Embed Size (px)
Citation preview
1
Results of Dot Survey
USDA Outdoor Farmers MarketWashington, DC
United States Department of Agriculture
Agricultural Marketing Service
September 2011
2
The U.S. Department of Agriculture (USDA) prohibits discrimination in all of its programs and activities on the basis of race, color, national origin, age, disability, and where applicable, sex, marital status, familial status, parental status, religion, sexual orientation, political beliefs, genetic information, reprisal, or because all or part of an individual’s income is derived from any public assistance program. (Not all prohibited bases apply to all programs.) Persons with disabilities who require alternative means for communication of program information (Braille, large print, audiotape, etc.) should contact USDA’s TARGET Center at (202) 720-2600 (voice and TDD). To file a complaint of discrimination, write to USDA, Assistant Secretary for Civil Rights, Office of the Assistant Secretary for Civil Rights, 1400 Independence Avenue, S.W., Stop 9410, Washington, DC 20250-9410, or call toll-free at (866) 632-9992 (English) or (800) 877-8339 (TDD) or (866) 377-8642 (English Federal-relay) or (800) 845-6136 (Spanish Federal-relay). USDA is an equal opportunity provider and employer.
Preferred CitationRagland, Edward, Velma Lakins, and Carlos Coleman. Results of Dot Survey: USDA Outdoor Farmers Market, Washington, DC. U.S. Dept. of Agriculture, Agricultural Marketing Service. Web. <http://dx.doi.org/10.9752/MS043.09-2011>
3
Edward Ragland, Economist
Velma Lakins, Agricultural Marketing Specialist
Carlos Coleman, Student Intern
Marketing Services Division
USDA Agricultural Marketing Service
Results of Dot Survey
USDA Outdoor Farmers MarketWashington, DC

1
This report presents an analysis of responses obtained from visitors to the United States Department of Agriculture (USDA) outdoor farmers market at 12th and Independence Avenue, SW, in Washington, D.C. during two market days, September 10 and 17, 2010. The Rapid Market Assessment, also known as the dot survey, was carried out to assess the composition and shopping habits of the market’s customer base so the managers of the market could better understand:
Who attends the market•
What services and amenities customers most enjoy at the market•
What impact the market’s operation has had on their customers’ purchasing patterns and • consumption decisions
Personnel from the USDA Agricultural Marketing Service’s (AMS) Farmers Market and Direct Marketing Research Branch used the dot survey approach to conduct consumer research at the farmers market. The dot survey technique is a “self-service” research approach that asks a limited number of questions displayed on easels in the market.1 Individual questions are placed on poster boards, making it easy for consumers to indicate their responses with round, colorful, self-sticking dots. We found using the dot survey technique to be a quick, simple, and effective way to engage consumer participation and collect market data. The dot survey was developed by Larry Lev, Linda Brewer, and Gary Stephenson of Oregon State University. It is among the most popular techniques for gauging consumer behavior at farmers markets. Among other market associations, it has been used by the Michigan Farmers Market, New Mexico Farmers Market, and North Dakota Farmers Market Association. Not only was the dot survey fun for the respondents, but we were also able to solicit a great deal of participation from market visitors, which increased the number of responses and contributed to the overall market atmosphere.
1 Larry Lev, Linda Brewer, and Garry Stephenson (OSU). Oregon Small Farmers Technical Report: Tools for Rapid Market Assessments. 1999. Revision V, 2004. Pg. 4. This guide explains the process for conducting a Rapid Market Assessment, including customer counts, dot surveys, and constructive comments and observations.
USDA Farmers Market 2010 Dot Survey Results
2
The outdoor USDA Farmers Market has been held every Friday from 10:00 a.m. to 2:00 p.m. from June through mid-November at USDA headquarters since August 1996. The market convenes in the executive parking lot of the Jamie L. Whitten building at the corner of 12th and Independence Avenue, SW, Washington, DC, at the Metro elevator entrance. The market is located next to the USDA People’s Garden and near several Government buildings and museums, and is a half a block from the National Mall, which teems with tourists during the farmers market season.
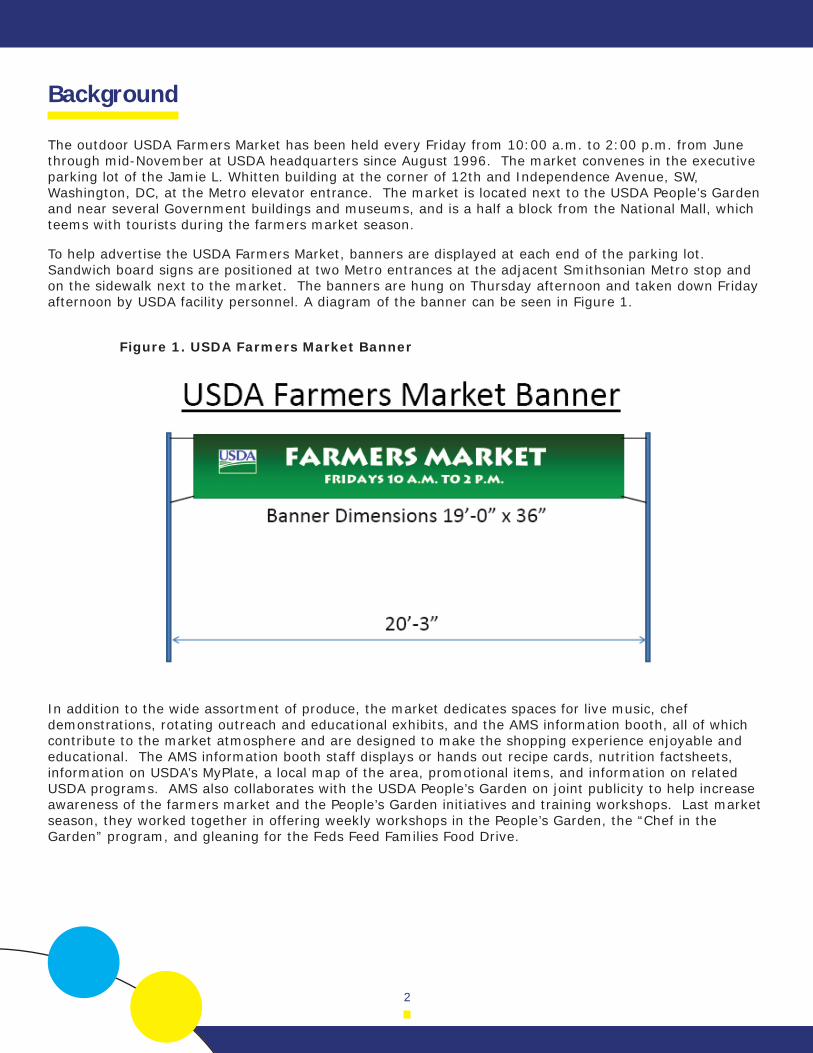
To help advertise the USDA Farmers Market, banners are displayed at each end of the parking lot. Sandwich board signs are positioned at two Metro entrances at the adjacent Smithsonian Metro stop and on the sidewalk next to the market. The banners are hung on Thursday afternoon and taken down Friday afternoon by USDA facility personnel. A diagram of the banner can be seen in Figure 1.
In addition to the wide assortment of produce, the market dedicates spaces for live music, chef demonstrations, rotating outreach and educational exhibits, and the AMS information booth, all of which contribute to the market atmosphere and are designed to make the shopping experience enjoyable and educational. The AMS information booth staff displays or hands out recipe cards, nutrition factsheets, information on USDA’s MyPlate, a local map of the area, promotional items, and information on related USDA programs. AMS also collaborates with the USDA People’s Garden on joint publicity to help increase awareness of the farmers market and the People’s Garden initiatives and training workshops. Last market season, they worked together in offering weekly workshops in the People’s Garden, the “Chef in the Garden” program, and gleaning for the Feds Feed Families Food Drive.
Background
Figure 1. USDA Farmers Market Banner
3
The USDA Farmers Market is composed of 14 vendors who offer a wide range of products that keep customers coming back week after week. The product mix is designed to give customers access to a variety of high-quality agricultural products straight from the farm, including fresh produce, honey, local meats, cheeses, and fresh herbs, as well as value-added products like jams and jellies, baked goods, ready-to-eat prepared foods, and handmade soaps.2 All the fruits and vegetables sold on the market are grown locally on farms in Maryland, Pennsylvania, and Virginia. Products grown within 150 miles are considered “locally grown” for the purpose of participating in the USDA Farmers Market. The blend of products piques the interest of customers who work nearby, as well as the many tourists that visit the museums, monuments, and landmarks on the National Mall. Live music is played every market day. Chef demonstrations are held an average of once a month. During peak market season, from mid-June to the end of August, the market draws approximately 2,500 customers each Friday to purchase fresh farm products, socialize, and enjoy good food and music.
To help manage the product mix for the market, interested and returning vendors complete a simple one-page USDA Farmers Market application form each year and submit it to the farmers market manager (an AMS Marketing Services Division employee). The application provides information about their farm or business and the types of products and goods they plan to sell. The application process helps ensure a uniform and fair process for deciding which farm operations or businesses are allowed to participate in the market and provides a diverse product mix of fresh fruits and vegetables. Establishing a successful farmers market requires careful planning and coordination between the market management, farmers, and vendors. Farmers market management is complex; it includes market set-up and break-down, market layout, market promotion, providing a dependable supply and variety of product mix, collecting vendor information, and other administrative tasks—just to name a few market manager functions.
It is important to have dedicated staff to help the market run smoothly and successfully. The AMS/Marketing Services Division oversees the USDA Farmers Market operations. The market manager spends 15 to 20 hours per week organizing it. Any vendor may apply, but the market management approves prospective vendors based on market need. Fourteen stalls are available for use by vendors in the current layout (Figure 2); all are occupied.
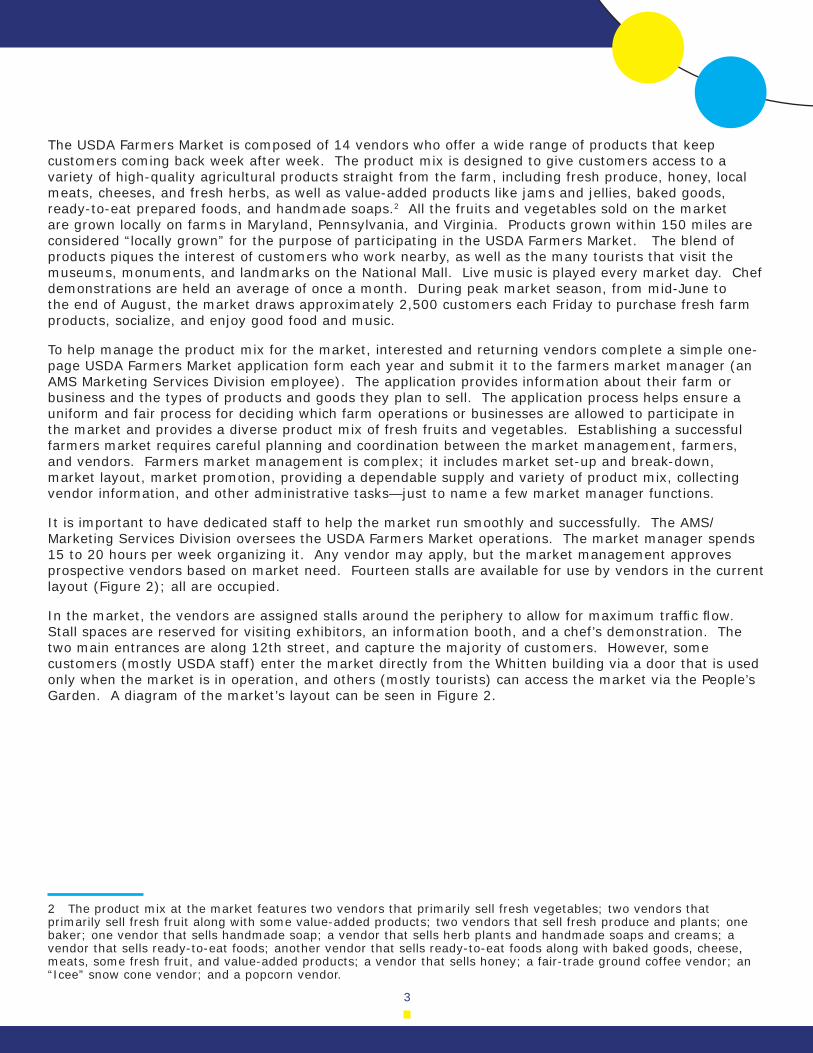
In the market, the vendors are assigned stalls around the periphery to allow for maximum traffi c fl ow. Stall spaces are reserved for visiting exhibitors, an information booth, and a chef’s demonstration. The two main entrances are along 12th street, and capture the majority of customers. However, some customers (mostly USDA staff) enter the market directly from the Whitten building via a door that is used only when the market is in operation, and others (mostly tourists) can access the market via the People’s Garden. A diagram of the market’s layout can be seen in Figure 2.
2 The product mix at the market features two vendors that primarily sell fresh vegetables; two vendors that primarily sell fresh fruit along with some value-added products; two vendors that sell fresh produce and plants; one baker; one vendor that sells handmade soap; a vendor that sells herb plants and handmade soaps and creams; a vendor that sells ready-to-eat foods; another vendor that sells ready-to-eat foods along with baked goods, cheese, meats, some fresh fruit, and value-added products; a vendor that sells honey; a fair-trade ground coffee vendor; an “Icee” snow cone vendor; and a popcorn vendor.
4
Methodology
The survey was conducted on two consecutive Fridays: September 10 and 17, 2010. The weather was much the same on both days: slightly cloudy in the morning, with temperatures in the low 70s during peak market hours. Similar types of questions were asked on both days of the survey. Market traffi c on these days was about 1,500 people, which seemed to be representative of normal foot traffi c for this time of the market season. During peak market season, from mid-June to the end of August, the market draws approximately 2,500 customers. After the Labor Day weekend, the number of tourists who visit the National Mall and local museums begins to dwindle, reducing the number of customers visiting the farmers market.
To help spread the word about the survey, it was announced through Department-wide e-mail and posted on the USDA blog. There was good participation on the fi rst survey day, but we noticed that some people were a little reluctant to participate because they were not sure what was involved. In contrast, on the second survey day, the number of respondents increased from 262 to 343, which we believe was due to greater awareness of the survey and the fact that participants received free promotional items and the opportunity to enter into a free raffl e drawing. Participants in the survey were rewarded by having their names entered in a raffl e drawing for a generous basket of assorted farmers market products, which were donated by vendors. A market basket was raffl ed on each day the survey was conducted. After completing the survey, respondents could select free promotional items that include calculators, note pads, key chains, and stress balls as a gesture of appreciation for their support.
Figure 2. USDA Farmers Market Layout

5
The survey was conducted in two phases. A set of four questions was asked on two consecutive market days. A different set of four questions was asked on each day of the survey. Survey questions were displayed in the information booth on 20- by 30-inch poster boards. Once a poster board fi lled up with dots, it was replaced by a new board with the same questions. Some questions were replaced up to four times during the survey.
Figure 3. Survey Question Posters
6
The Farmers Market and Direct Marketing Research staff served as survey facilitators, answering questions from participants and guiding them through the survey process. At least two staff members supervised the survey area. Staff members were instructed to randomly select potential participants from customers who appeared to have completed their shopping at the market. Before participants began the survey, staff members asked them to categorize themselves as a USDA employee, other Government employee, local resident, or tourist. If the respondent didn’t fall into one of these four categories, they were classifi ed as “other.” Shoppers were then given a set of seven dots to answer the survey, with members of each category receiving a different colored set of dots: USDA employee participants answered the survey using green dots, other Government employees used blue dots, local residents used orange dots, tourist used red or light blue dots, and the other respondents used yellow dots. Most respondents fell into one of the four defi ned categories; only 1.5 percent of respondents on the fi rst day and 7.0 percent on the second day were classifi ed as “other.”
We discovered early on the fi rst day of the survey that participants responded more favorably to the term “dot game” than “dot survey.” After the start of the survey, we adjusted our methods for administering the survey and changed our behavior to increase the number of participants. By creating a pleasant and inviting atmosphere, we drew more shoppers to participate in the survey.
Customers were approached individually in a normal tone of voice and asked if they were interested in playing our dot game. Staff members were instructed to refrain from calling potential participants over from a distance to participate and were asked to avoid hawking or waving market shoppers over to participate in the survey, as these overt actions might discourage potential participation. Asking too aggressively for participation can give a potential participant the idea that whatever you want them to do is diffi cult to accomplish or overly time consuming.
Branch personnel also made a deliberate effort to be cordial and pleasant to all potential participants, especially to those shoppers that refused to participate in the survey. Anyone that refused to participate was told: “Okay. Thank you for supporting the farmers market and have a good day.”
Participants commented that Branch personnel were helpful and pleasant and they found the dot game fun to play. The multi-colored dots and the attractive art work on the posters used to display the questions and to record responses generated curiosity among market customers and also helped draw participants into the survey area. As the number of people gathered at the survey site grew, this generated even more interest among potential participants—so much so that four or fi ve shoppers would wait in line to have the opportunity to share their opinions about the market. Because this was the fi rst time a dot survey had been conducted at the market, adjustments in approach and strategy were largely made on the spot. In the future, we believe it will be benefi cial to hold a short training session with staff prior to conducting the survey to ensure a more uniform approach to customers and maximize participation rates.
7
Survey Questions on Day One:
The fi rst day of the survey was conducted on Friday, September 10, 2010. Customers were asked to answer the following four questions:
1. How much do you usually spend at the market on market day?
2. What products did you purchase at the market today?
3. How many vendors did you purchase from at the market today?
4. What is the number one reason you shop at the farmers market?
Respondents were instructed to use one dot out of a total of seven to answer the fi rst and third questions and could use as many dots as necessary to answer questions two and four. Questions two and four allowed for multiple responses. On question four, many respondents expressed that several categories were their top reason for shopping at the market, so it was decided to allow survey respondents the option to select more than one category. A complete listing of all the questions provided to participants to choose from is listed in Appendix 1.
Day One of the Survey
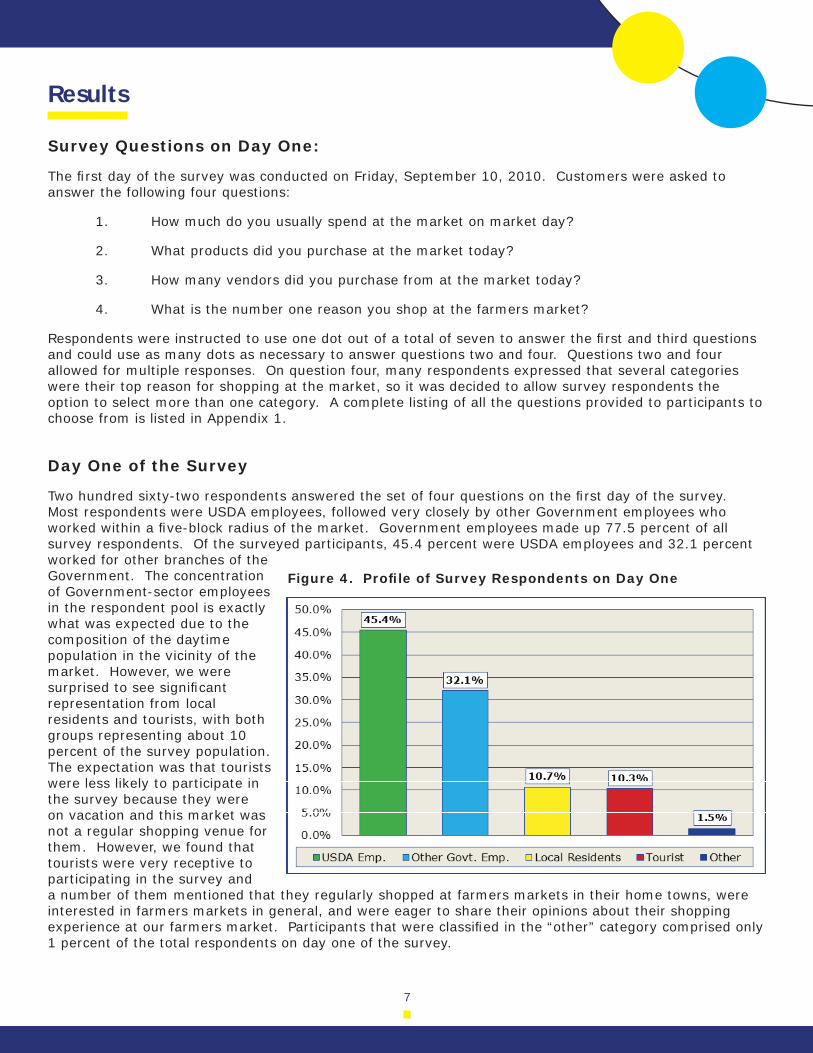
Two hundred sixty-two respondents answered the set of four questions on the fi rst day of the survey. Most respondents were USDA employees, followed very closely by other Government employees who worked within a fi ve-block radius of the market. Government employees made up 77.5 percent of all survey respondents. Of the surveyed participants, 45.4 percent were USDA employees and 32.1 percent worked for other branches of the Government. The concentration of Government-sector employees in the respondent pool is exactly what was expected due to the composition of the daytime population in the vicinity of the market. However, we were surprised to see signifi cant representation from local residents and tourists, with both groups representing about 10 percent of the survey population. The expectation was that tourists were less likely to participate in the survey because they were on vacation and this market was not a regular shopping venue for them. However, we found that tourists were very receptive to participating in the survey and a number of them mentioned that they regularly shopped at farmers markets in their home towns, were interested in farmers markets in general, and were eager to share their opinions about their shopping experience at our farmers market. Participants that were classifi ed in the “other” category comprised only 1 percent of the total respondents on day one of the survey.
Results
Figure 4. Profi le of Survey Respondents on Day One
8
How much do you usually spend at the market on market day?
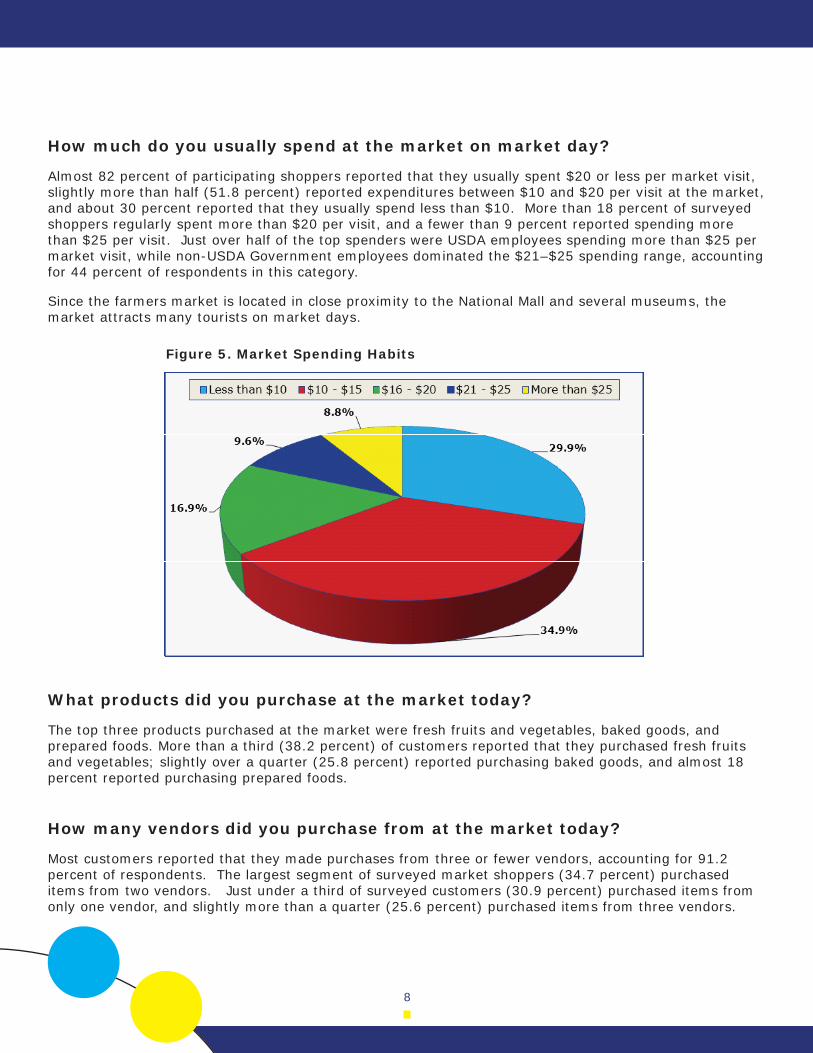
Almost 82 percent of participating shoppers reported that they usually spent $20 or less per market visit, slightly more than half (51.8 percent) reported expenditures between $10 and $20 per visit at the market, and about 30 percent reported that they usually spend less than $10. More than 18 percent of surveyed shoppers regularly spent more than $20 per visit, and a fewer than 9 percent reported spending more than $25 per visit. Just over half of the top spenders were USDA employees spending more than $25 per market visit, while non-USDA Government employees dominated the $21–$25 spending range, accounting for 44 percent of respondents in this category.
Since the farmers market is located in close proximity to the National Mall and several museums, the market attracts many tourists on market days.
What products did you purchase at the market today?
The top three products purchased at the market were fresh fruits and vegetables, baked goods, and prepared foods. More than a third (38.2 percent) of customers reported that they purchased fresh fruits and vegetables; slightly over a quarter (25.8 percent) reported purchasing baked goods, and almost 18 percent reported purchasing prepared foods.
How many vendors did you purchase from at the market today?
Most customers reported that they made purchases from three or fewer vendors, accounting for 91.2 percent of respondents. The largest segment of surveyed market shoppers (34.7 percent) purchased items from two vendors. Just under a third of surveyed customers (30.9 percent) purchased items from only one vendor, and slightly more than a quarter (25.6 percent) purchased items from three vendors.
Figure 5. Market Spending Habits
9
What is the number one reason that you shop at the farmers market?
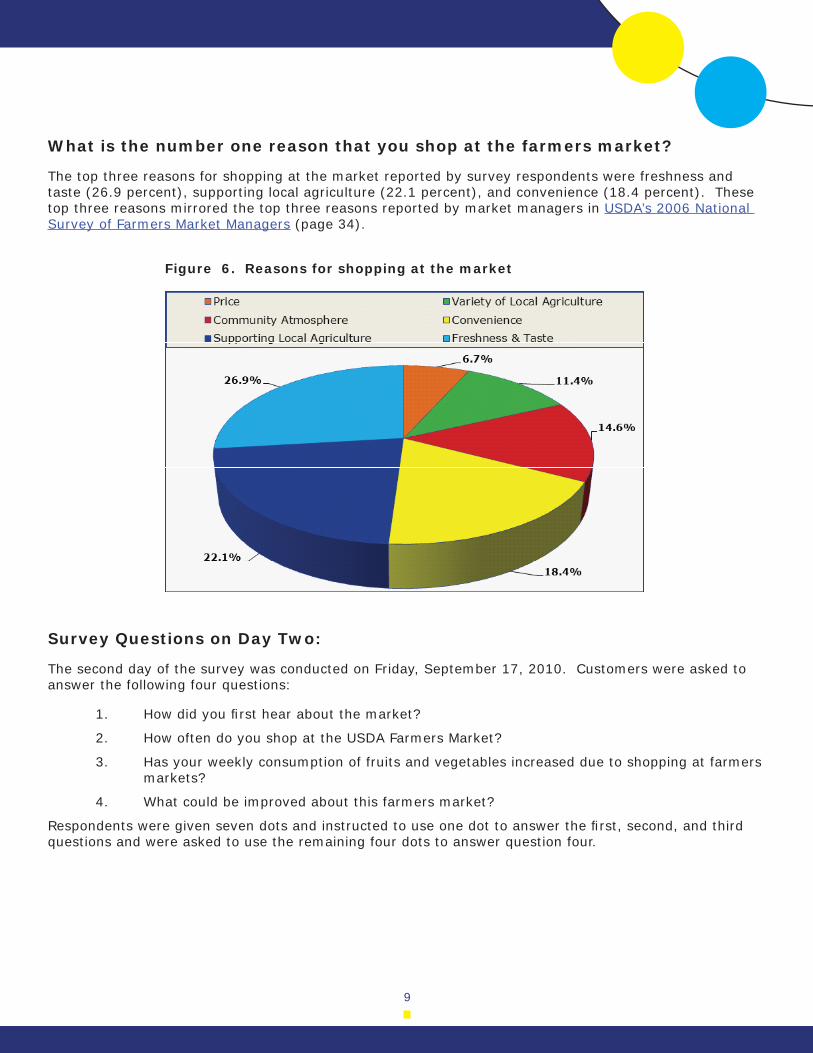
The top three reasons for shopping at the market reported by survey respondents were freshness and taste (26.9 percent), supporting local agriculture (22.1 percent), and convenience (18.4 percent). These top three reasons mirrored the top three reasons reported by market managers in USDA’s 2006 National Survey of Farmers Market Managers (page 34).
Survey Questions on Day Two:
The second day of the survey was conducted on Friday, September 17, 2010. Customers were asked to answer the following four questions:
How did you fi rst hear about the market? 1.
How often do you shop at the USDA Farmers Market?2.
Has your weekly consumption of fruits and vegetables increased due to shopping at farmers 3. markets?
What could be improved about this farmers market?4.
Respondents were given seven dots and instructed to use one dot to answer the fi rst, second, and third questions and were asked to use the remaining four dots to answer question four.
Figure 6. Reasons for shopping at the market
10
Day Two of the Survey
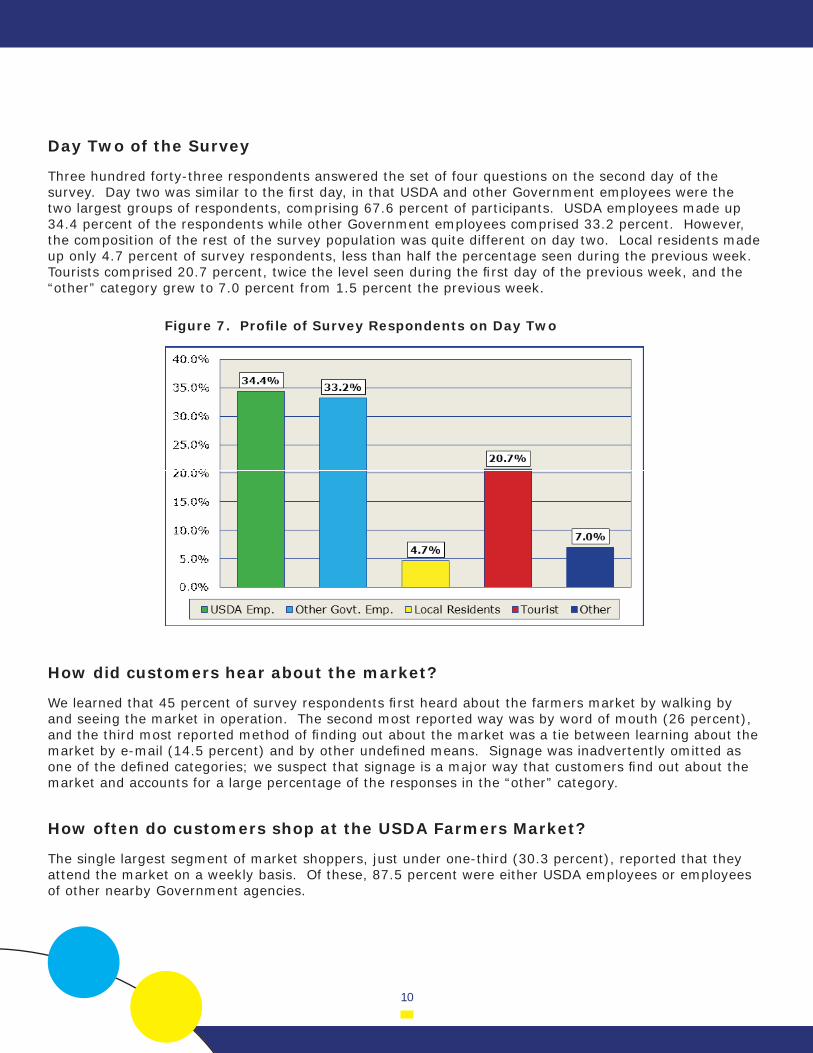
Three hundred forty-three respondents answered the set of four questions on the second day of the survey. Day two was similar to the fi rst day, in that USDA and other Government employees were the two largest groups of respondents, comprising 67.6 percent of participants. USDA employees made up 34.4 percent of the respondents while other Government employees comprised 33.2 percent. However, the composition of the rest of the survey population was quite different on day two. Local residents made up only 4.7 percent of survey respondents, less than half the percentage seen during the previous week. Tourists comprised 20.7 percent, twice the level seen during the fi rst day of the previous week, and the “other” category grew to 7.0 percent from 1.5 percent the previous week.
How did customers hear about the market?
We learned that 45 percent of survey respondents fi rst heard about the farmers market by walking by and seeing the market in operation. The second most reported way was by word of mouth (26 percent), and the third most reported method of fi nding out about the market was a tie between learning about the market by e-mail (14.5 percent) and by other undefi ned means. Signage was inadvertently omitted as one of the defi ned categories; we suspect that signage is a major way that customers fi nd out about the market and accounts for a large percentage of the responses in the “other” category.
How often do customers shop at the USDA Farmers Market?
The single largest segment of market shoppers, just under one-third (30.3 percent), reported that they attend the market on a weekly basis. Of these, 87.5 percent were either USDA employees or employees of other nearby Government agencies.
Figure 7. Profi le of Survey Respondents on Day Two
11
In a somewhat surprising development, the next largest segment of surveyed customers (29.4 percent) reported that they were fi rst-time shoppers at the market. Although this group was primarily composed of tourists (59.4 percent), nearly a third of this fi rst-time shopper group (31.8 percent) consisted of Government employees, and nearly two-thirds of these Government workers were employed outside of USDA. This fi nding may indicate that we have the potential to increase our farmers market’s foot traffi c by increasing our marketing efforts and outreach to employees from non-USDA Government agencies in the surrounding area.
Has your weekly consumption of fruits and vegetables increased due to shopping at farmers markets?
Over half of the surveyed customers (57.2 percent) agreed that shopping at farmers markets had resulted in an increase of their consumption of fruits and vegetables. A quarter of survey respondents (25.1 percent) reported that they strongly agreed with this statement, and almost one-third (32.1 percent) reported that shopping at farmers markets did have a positive impact on their fruit and vegetable consumption. Fewer than a third (32.4 percent) reported no relationship between shopping at farmers markets and their fruit and vegetable consumption, and only 10.5 percent reported that they disagreed or strongly disagreed with the statement that there was a positive relationship between frequenting a farmers market and their overall consumption of fruits and vegetables.
What could be improved at the market?
The six areas of improvement that market customers could choose from in the dot survey were:
Greater selection of fruit1.
Greater selection of vegetables2.
Availability of organic products3.
Greater selection of prepared food 4.
Extend the market season through November5.
More chef demonstrations6.
The administrators of the dot survey were deliberate in their selection of the market improvement options; each of the offered choices was considered to be an achievable objective. Respondents were given four dots that they could place as they saw fi t: with all dots on one category, dots spread over four categories, or dots distributed in any combination of categories. Participants were required, however, to use all four dots when answering the question.
12
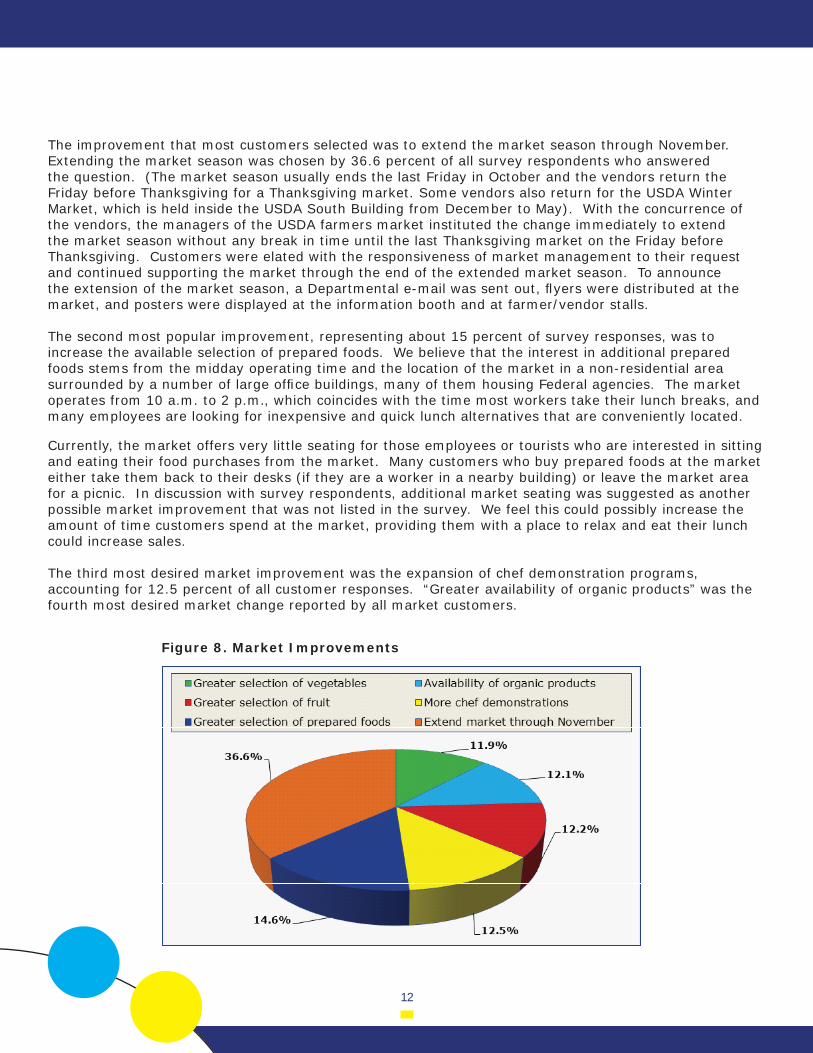
The improvement that most customers selected was to extend the market season through November. Extending the market season was chosen by 36.6 percent of all survey respondents who answered the question. (The market season usually ends the last Friday in October and the vendors return the Friday before Thanksgiving for a Thanksgiving market. Some vendors also return for the USDA Winter Market, which is held inside the USDA South Building from December to May). With the concurrence of the vendors, the managers of the USDA farmers market instituted the change immediately to extend the market season without any break in time until the last Thanksgiving market on the Friday before Thanksgiving. Customers were elated with the responsiveness of market management to their request and continued supporting the market through the end of the extended market season. To announce the extension of the market season, a Departmental e-mail was sent out, fl yers were distributed at the market, and posters were displayed at the information booth and at farmer/vendor stalls.
The second most popular improvement, representing about 15 percent of survey responses, was to increase the available selection of prepared foods. We believe that the interest in additional prepared foods stems from the midday operating time and the location of the market in a non-residential area surrounded by a number of large offi ce buildings, many of them housing Federal agencies. The market operates from 10 a.m. to 2 p.m., which coincides with the time most workers take their lunch breaks, and many employees are looking for inexpensive and quick lunch alternatives that are conveniently located.
Currently, the market offers very little seating for those employees or tourists who are interested in sitting and eating their food purchases from the market. Many customers who buy prepared foods at the market either take them back to their desks (if they are a worker in a nearby building) or leave the market area for a picnic. In discussion with survey respondents, additional market seating was suggested as another possible market improvement that was not listed in the survey. We feel this could possibly increase the amount of time customers spend at the market, providing them with a place to relax and eat their lunch could increase sales.
The third most desired market improvement was the expansion of chef demonstration programs, accounting for 12.5 percent of all customer responses. “Greater availability of organic products” was the fourth most desired market change reported by all market customers.
Figure 8. Market Improvements
13
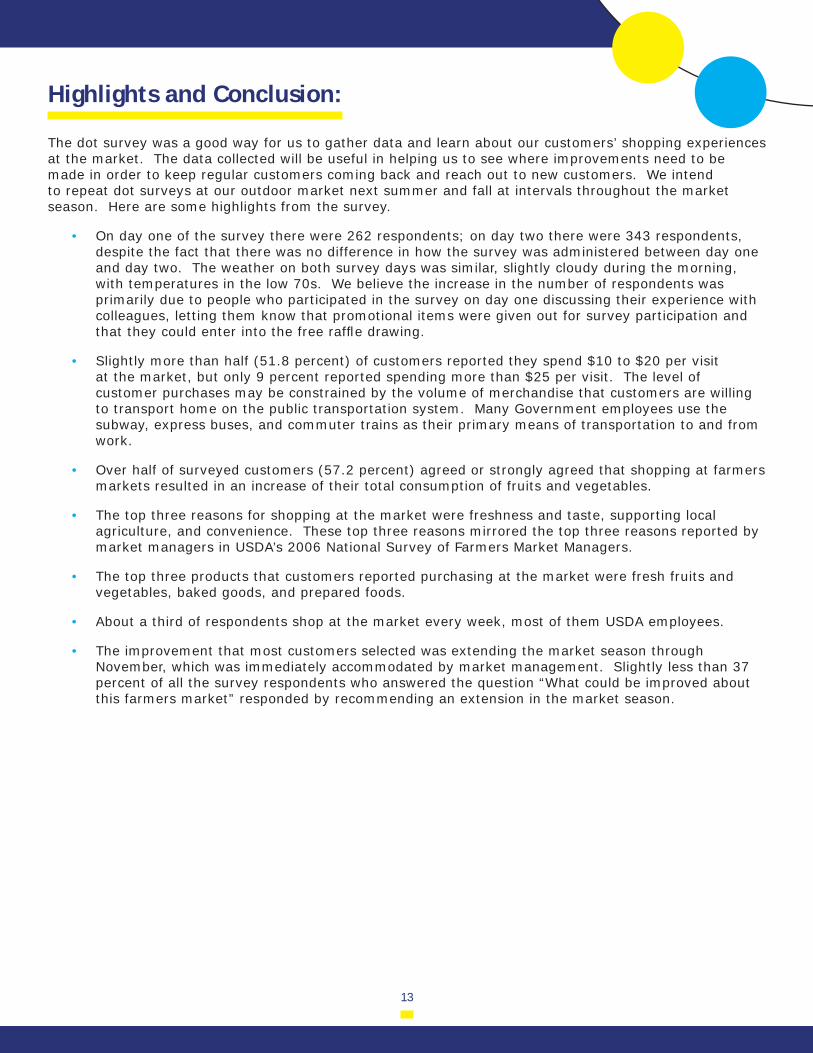
Highlights and Conclusion:
The dot survey was a good way for us to gather data and learn about our customers’ shopping experiences at the market. The data collected will be useful in helping us to see where improvements need to be made in order to keep regular customers coming back and reach out to new customers. We intend to repeat dot surveys at our outdoor market next summer and fall at intervals throughout the market season. Here are some highlights from the survey.
On day one of the survey there were 262 respondents; on day two there were 343 respondents, • despite the fact that there was no difference in how the survey was administered between day one and day two. The weather on both survey days was similar, slightly cloudy during the morning, with temperatures in the low 70s. We believe the increase in the number of respondents was primarily due to people who participated in the survey on day one discussing their experience with colleagues, letting them know that promotional items were given out for survey participation and that they could enter into the free raffl e drawing.
Slightly more than half (51.8 percent) of customers reported they spend $10 to $20 per visit • at the market, but only 9 percent reported spending more than $25 per visit. The level of customer purchases may be constrained by the volume of merchandise that customers are willing to transport home on the public transportation system. Many Government employees use the subway, express buses, and commuter trains as their primary means of transportation to and from work.
Over half of surveyed customers (57.2 percent) agreed or strongly agreed that shopping at farmers • markets resulted in an increase of their total consumption of fruits and vegetables.
The top three reasons for shopping at the market were freshness and taste, supporting local • agriculture, and convenience. These top three reasons mirrored the top three reasons reported by market managers in USDA’s 2006 National Survey of Farmers Market Managers.
The top three products that customers reported purchasing at the market were fresh fruits and • vegetables, baked goods, and prepared foods.
About a third of respondents shop at the market every week, most of them USDA employees.•
The improvement that most customers selected was extending the market season through • November, which was immediately accommodated by market management. Slightly less than 37 percent of all the survey respondents who answered the question “What could be improved about this farmers market” responded by recommending an extension in the market season.
14
Appendix 1
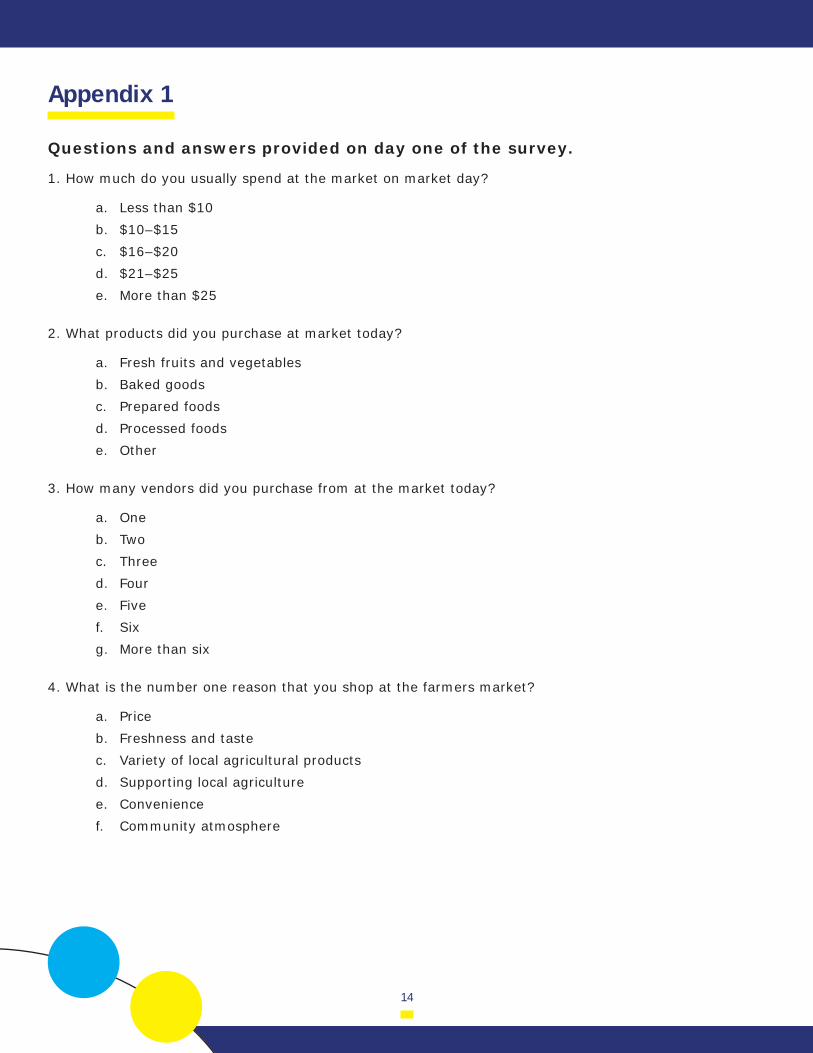
Questions and answers provided on day one of the survey.
How much do you usually spend at the market on market day?1.
Less than $10a.
$10–$15b.
$16–$20c.
$21–$25d.
More than $25 e.
What products did you purchase at market today?2.
Fresh fruits and vegetablesa.
Baked goodsb.
Prepared foodsc.
Processed foodsd.
Othere.
How many vendors did you purchase from at the market today?3.
Onea.
Twob.
Threec.
Fourd.
Fivee.
Sixf.
More than sixg.
What is the number one reason that you shop at the farmers market?4.
Pricea.
Freshness and tasteb.
Variety of local agricultural productsc.
Supporting local agricultured.
Conveniencee.
Community atmospheref.
15
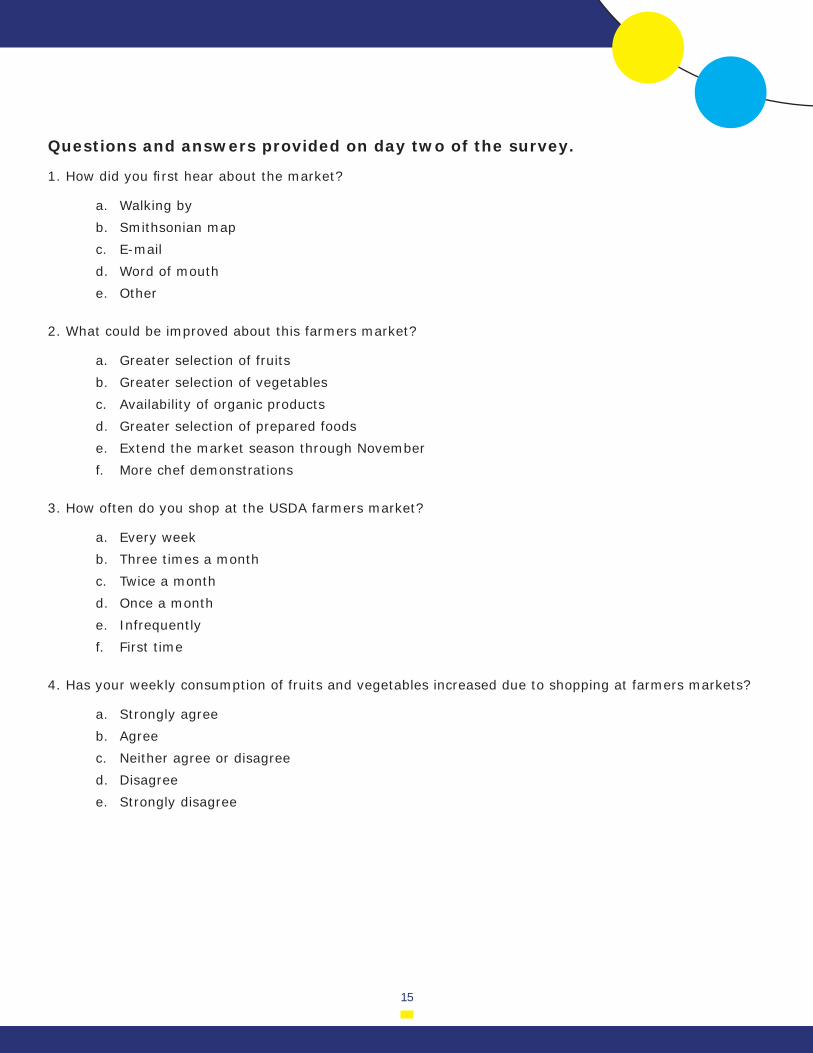
Questions and answers provided on day two of the survey.
How did you fi rst hear about the market? 1.
Walking bya.
Smithsonian mapb.
E-mailc.
Word of mouthd.
Othere.
What could be improved about this farmers market?2.
Greater selection of fruitsa.
Greater selection of vegetablesb.
Availability of organic productsc.
Greater selection of prepared foodsd.
Extend the market season through Novembere.
More chef demonstrationsf.
How often do you shop at the USDA farmers market?3.
Every weeka.
Three times a monthb.
Twice a monthc.
Once a monthd.
Infrequentlye.
First timef.
Has your weekly consumption of fruits and vegetables increased due to shopping at farmers markets?4.
Strongly agreea.
Agreeb.
Neither agree or disagreec.
Disagreed.
Strongly disagreee.
16
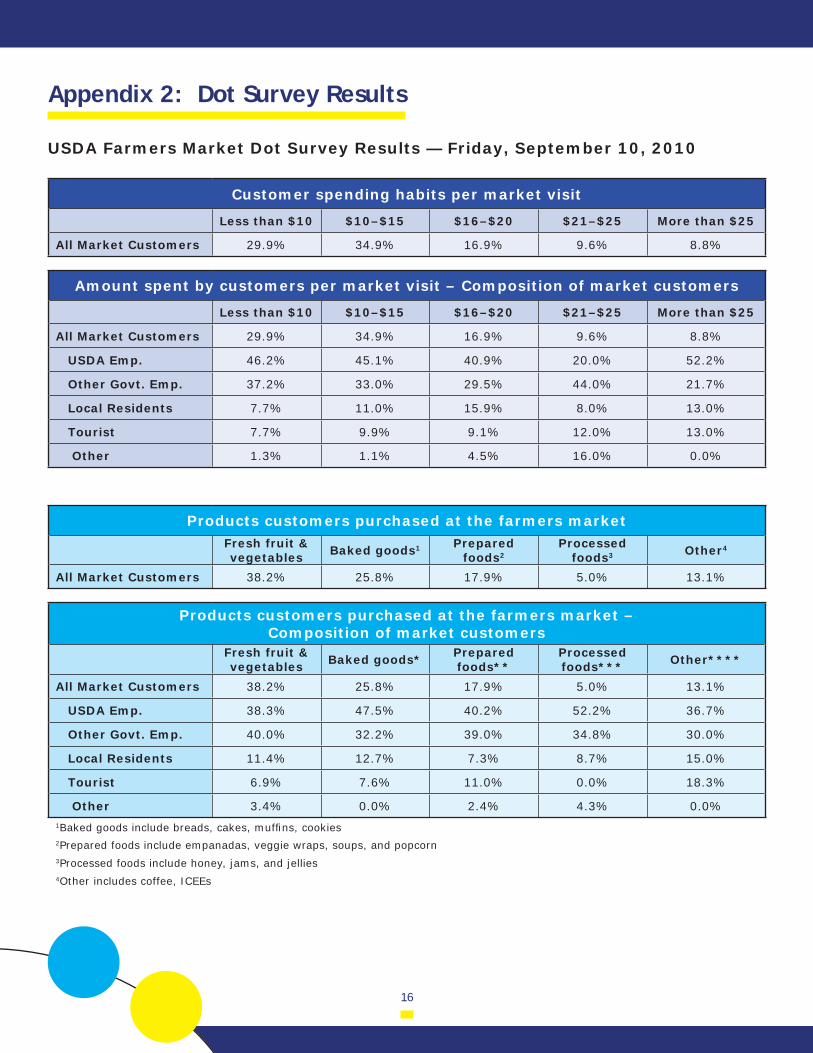
Appendix 2: Dot Survey Results USDA Farmers Market Dot Survey Results — Friday, September 10, 2010
Customer spending habits per market visit
Less than $10 $10–$15 $16–$20 $21–$25 More than $25
All Market Customers 29.9% 34.9% 16.9% 9.6% 8.8%
Amount spent by customers per market visit – Composition of market customers
Less than $10 $10–$15 $16–$20 $21–$25 More than $25
All Market Customers 29.9% 34.9% 16.9% 9.6% 8.8%
USDA Emp. 46.2% 45.1% 40.9% 20.0% 52.2%
Other Govt. Emp. 37.2% 33.0% 29.5% 44.0% 21.7%
Local Residents 7.7% 11.0% 15.9% 8.0% 13.0%
Tourist 7.7% 9.9% 9.1% 12.0% 13.0%
Other 1.3% 1.1% 4.5% 16.0% 0.0%
Products customers purchased at the farmers marketFresh fruit & vegetables Baked goods1 Prepared
foods2Processed
foods3 Other4
All Market Customers 38.2% 25.8% 17.9% 5.0% 13.1%
Products customers purchased at the farmers market – Composition of market customers
Fresh fruit & vegetables Baked goods* Prepared
foods**Processed foods*** Other****
All Market Customers 38.2% 25.8% 17.9% 5.0% 13.1%
USDA Emp. 38.3% 47.5% 40.2% 52.2% 36.7%
Other Govt. Emp. 40.0% 32.2% 39.0% 34.8% 30.0%
Local Residents 11.4% 12.7% 7.3% 8.7% 15.0%
Tourist 6.9% 7.6% 11.0% 0.0% 18.3%
Other 3.4% 0.0% 2.4% 4.3% 0.0%1Baked goods include breads, cakes, muffi ns, cookies2Prepared foods include empanadas, veggie wraps, soups, and popcorn3Processed foods include honey, jams, and jellies4Other includes coffee, ICEEs
17
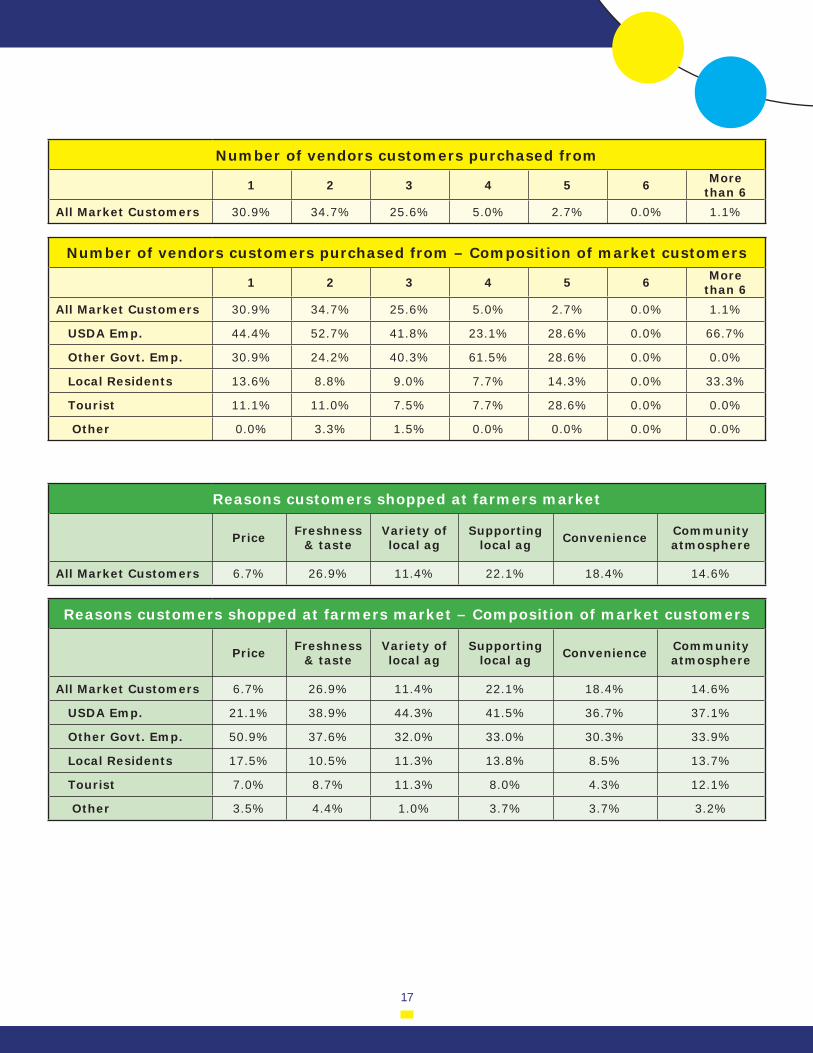
Number of vendors customers purchased from
1 2 3 4 5 6 More than 6
All Market Customers 30.9% 34.7% 25.6% 5.0% 2.7% 0.0% 1.1%
Number of vendors customers purchased from – Composition of market customers
1 2 3 4 5 6 More than 6
All Market Customers 30.9% 34.7% 25.6% 5.0% 2.7% 0.0% 1.1%
USDA Emp. 44.4% 52.7% 41.8% 23.1% 28.6% 0.0% 66.7%
Other Govt. Emp. 30.9% 24.2% 40.3% 61.5% 28.6% 0.0% 0.0%
Local Residents 13.6% 8.8% 9.0% 7.7% 14.3% 0.0% 33.3%
Tourist 11.1% 11.0% 7.5% 7.7% 28.6% 0.0% 0.0%
Other 0.0% 3.3% 1.5% 0.0% 0.0% 0.0% 0.0%
Reasons customers shopped at farmers market
Price Freshness & taste
Variety of local ag
Supporting local ag Convenience Community
atmosphere
All Market Customers 6.7% 26.9% 11.4% 22.1% 18.4% 14.6%
Reasons customers shopped at farmers market – Composition of market customers
Price Freshness & taste
Variety of local ag
Supporting local ag Convenience Community
atmosphere
All Market Customers 6.7% 26.9% 11.4% 22.1% 18.4% 14.6%
USDA Emp. 21.1% 38.9% 44.3% 41.5% 36.7% 37.1%
Other Govt. Emp. 50.9% 37.6% 32.0% 33.0% 30.3% 33.9%
Local Residents 17.5% 10.5% 11.3% 13.8% 8.5% 13.7%
Tourist 7.0% 8.7% 11.3% 8.0% 4.3% 12.1%
Other 3.5% 4.4% 1.0% 3.7% 3.7% 3.2%
18
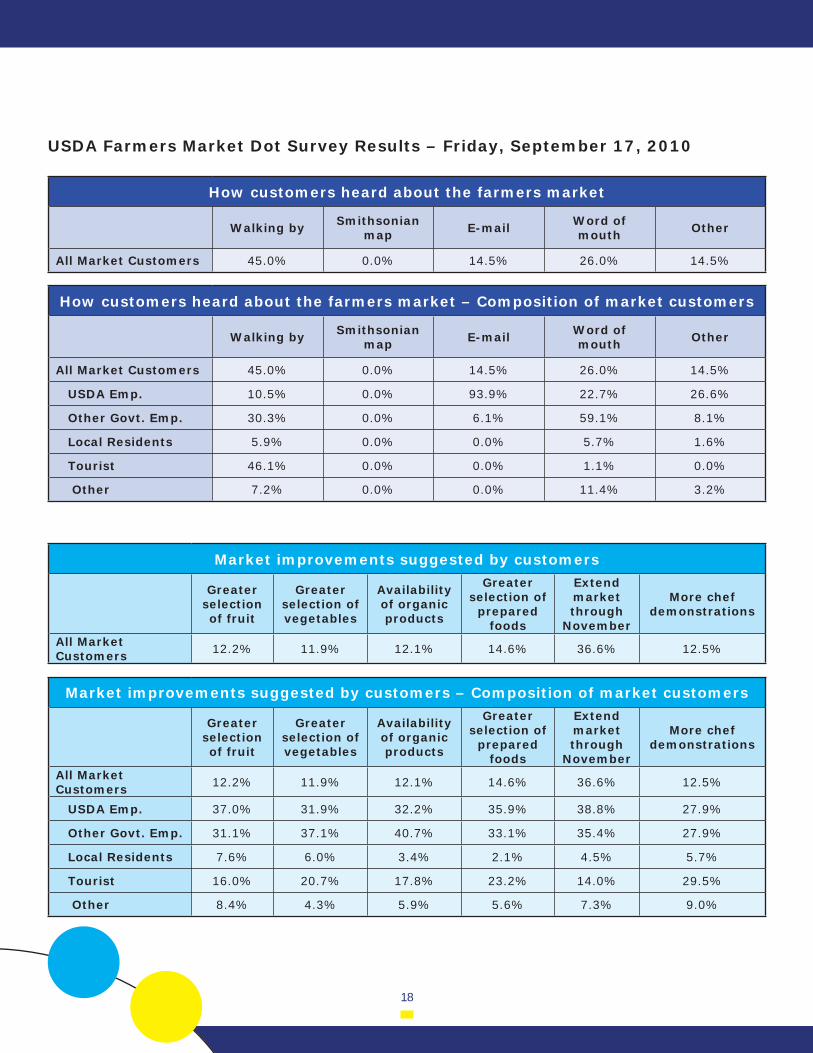
USDA Farmers Market Dot Survey Results – Friday, September 17, 2010
How customers heard about the farmers market
Walking by Smithsonian map E-mail Word of
mouth Other
All Market Customers 45.0% 0.0% 14.5% 26.0% 14.5%
How customers heard about the farmers market – Composition of market customers
Walking by Smithsonian map E-mail Word of
mouth Other
All Market Customers 45.0% 0.0% 14.5% 26.0% 14.5%
USDA Emp. 10.5% 0.0% 93.9% 22.7% 26.6%
Other Govt. Emp. 30.3% 0.0% 6.1% 59.1% 8.1%
Local Residents 5.9% 0.0% 0.0% 5.7% 1.6%
Tourist 46.1% 0.0% 0.0% 1.1% 0.0%
Other 7.2% 0.0% 0.0% 11.4% 3.2%
Market improvements suggested by customers
Greater selection of fruit
Greater selection of vegetables
Availability of organic products
Greater selection of
prepared foods
Extend market through
November
More chef demonstrations
All Market Customers 12.2% 11.9% 12.1% 14.6% 36.6% 12.5%
Market improvements suggested by customers – Composition of market customers
Greater selection of fruit
Greater selection of vegetables
Availability of organic products
Greater selection of
prepared foods
Extend market through
November
More chef demonstrations
All Market Customers 12.2% 11.9% 12.1% 14.6% 36.6% 12.5%
USDA Emp. 37.0% 31.9% 32.2% 35.9% 38.8% 27.9%
Other Govt. Emp. 31.1% 37.1% 40.7% 33.1% 35.4% 27.9%
Local Residents 7.6% 6.0% 3.4% 2.1% 4.5% 5.7%
Tourist 16.0% 20.7% 17.8% 23.2% 14.0% 29.5%
Other 8.4% 4.3% 5.9% 5.6% 7.3% 9.0%
19
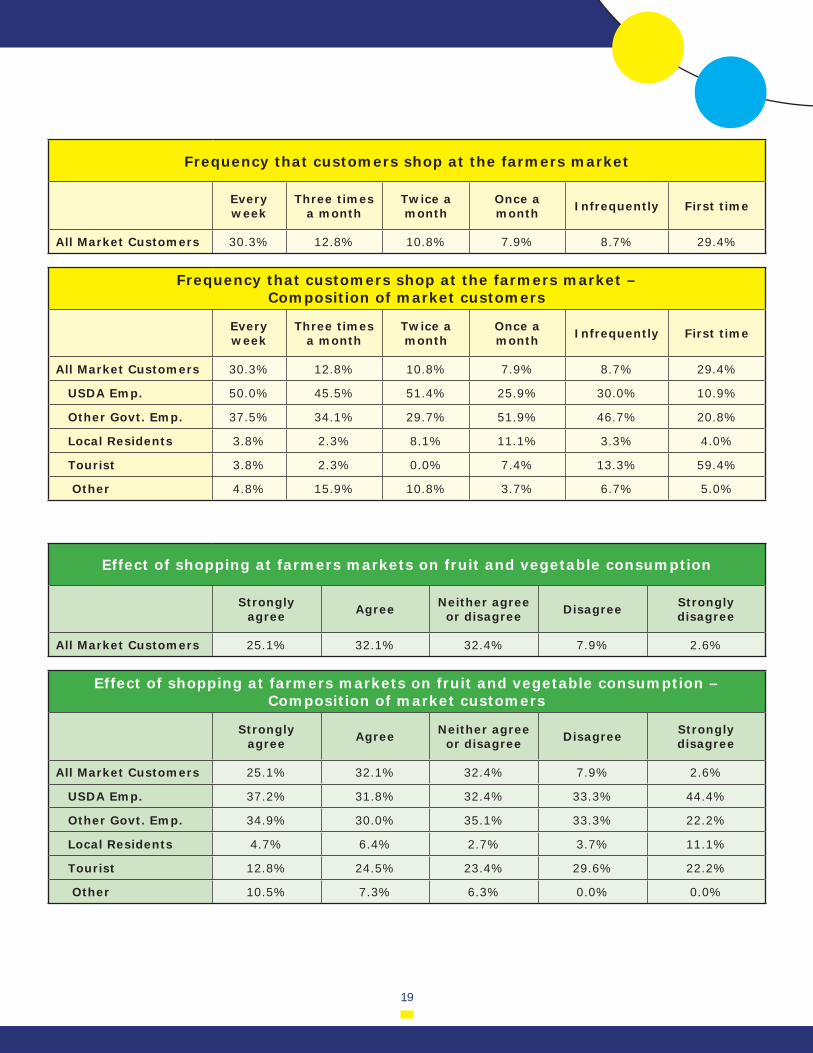
Frequency that customers shop at the farmers market
Every week
Three times a month
Twice a month
Once a month Infrequently First time
All Market Customers 30.3% 12.8% 10.8% 7.9% 8.7% 29.4%
Frequency that customers shop at the farmers market – Composition of market customers
Every week
Three times a month
Twice a month
Once a month Infrequently First time
All Market Customers 30.3% 12.8% 10.8% 7.9% 8.7% 29.4%
USDA Emp. 50.0% 45.5% 51.4% 25.9% 30.0% 10.9%
Other Govt. Emp. 37.5% 34.1% 29.7% 51.9% 46.7% 20.8%
Local Residents 3.8% 2.3% 8.1% 11.1% 3.3% 4.0%
Tourist 3.8% 2.3% 0.0% 7.4% 13.3% 59.4%
Other 4.8% 15.9% 10.8% 3.7% 6.7% 5.0%
Effect of shopping at farmers markets on fruit and vegetable consumption
Strongly agree Agree Neither agree
or disagree Disagree Strongly disagree
All Market Customers 25.1% 32.1% 32.4% 7.9% 2.6%
Effect of shopping at farmers markets on fruit and vegetable consumption – Composition of market customers
Strongly agree Agree Neither agree
or disagree Disagree Strongly disagree
All Market Customers 25.1% 32.1% 32.4% 7.9% 2.6%
USDA Emp. 37.2% 31.8% 32.4% 33.3% 44.4%
Other Govt. Emp. 34.9% 30.0% 35.1% 33.3% 22.2%
Local Residents 4.7% 6.4% 2.7% 3.7% 11.1%
Tourist 12.8% 24.5% 23.4% 29.6% 22.2%
Other 10.5% 7.3% 6.3% 0.0% 0.0%


22