Embed Size (px)
Citation preview
Results of Blue Sink Pumping Test No. 2 Hillsborough County, Florida
Final Report
Hydrologic Evaluation Section Southwest Florida Water Management District
September 2009
Results of Blue Sink Pumping Test No.2, Hillsborough County, Florida
September 2009
The geological evaluation and interpretation contained in the report entitled Results of Blue Sink Pumping Test No.2, Hillsborough County, Florida has been prepared by or approved by a Certified Professional Geologist in the State of Florida, in accordance with Chapter 492, Florida Statutes.
Ronald J. Basso, (Jr. Professional G logist License No. PG 0001325

1.0 INTRODUCTION .................................................................................................. 1
2.0 SITE INFORMATION ........................................................................................... 1 2.1 Site Location and Watershed ...................................................................... 1
2.2 Previous Long-term Pumping Tests ............................................................ 4 2.2.1 1996 Pumping Test ........................................................................... 4 2.2.2 2000 Emergency Pumping Test ........................................................ 5 2.2.3 SWFWMD 2008 Pumping Test No. 1 ............................................... 6
3.0 HYDROGEOLOGY............................................................................................... 7
4.0 PUMPING TEST SETUP AND MONITORING PROGRAM ................................. 7 4.1 Blue Sink Pumping Test No. 2 ..................................................................... 7 4.2 Monitored Water Levels ............................................................................... 9
4.2.1 Blue Sink and Ewanowski Spring ..................................................... 9 4.2.2 Lakes ................................................................................................ 9
4.2.3 Wells ............................................................................................... 11 4.3 Background Water Levels ......................................................................... 12
4.3.1 Wells ............................................................................................... 12
4.3.2 Lakes .............................................................................................. 13 4.4 Rainfall Data .............................................................................................. 13 4.5 Water Quality Testing – Blue Sink ............................................................. 13
5.0 PUMPING TEST RESULTS ............................................................................... 14 5.1 Rainfall ...................................................................................................... 14
5.2 Discharge Rates ........................................................................................ 14 5.3 Pumping Test Drawdown .......................................................................... 18
5.3.1 Sink and Spring Drawdown ............................................................. 19
5.3.2 Lake Drawdown .............................................................................. 20 5.3.3 Upper Floridan Aquifer Drawdown .................................................. 20
5.4 Water Level Elevations .............................................................................. 20 5.5 Upper Floridan Aquifer - Estimation of Hydraulic Parameters ................... 20
5.5.1 Distance Drawdown Method ........................................................... 25 5.5.2 Cooper-Jacob Straight Line Method ............................................... 26
5.6 Potable Well Survey .................................................................................. 31
6.0 BLUE SINK WATER QUALITY RESULTS ......................................................... 32 7.0 CONCLUSIONS ................................................................................................. 34

- 1 -
Results of Blue Sink Pumping Test No. 2 Hillsborough County, Florida
By Jason Patterson and Ron Basso, P.G.
1.0 INTRODUCTION
Blue Sink was evaluated as a potential river augmentation source by the Southwest Florida Water Management District (District) in March 2009 by pumping approximately three (3) cubic feet per second (cfs) or two (2) million gallons per day (mgd) for 30 days. The pumping test was conducted to determine if two mgd could be sustainably developed from Blue Sink during the spring dry season to assist the City of Tampa in meeting the minimum low flow of 24 cfs established for the lower Hillsborough River. The Blue Sink project, along with water from Sulphur Spring, the Tampa Bypass Canal, and another sinkhole located near Morris Bridge wellfield, are all sources being evaluated by the City of Tampa and the District to help meet the lower Hillsborough River minimum flow criteria. These projects are part of the lower Hillsborough River recovery strategy plan amended in Rule 40D-8, F.A.C., adopted by the Governing Board on August 28, 2007. An extensive monitoring program was developed for the Blue Sink pumping test to evaluate potential impacts to nearby lakes and Upper Floridan aquifer (UFA) wells. Monitoring equipment was installed by the District during the summer and fall of 2007. This report documents the physical characteristics of the site, the pumping test set-up, and results of the 30-day test.
2.0 SITE INFORMATION
2.1 Site Location and Watershed
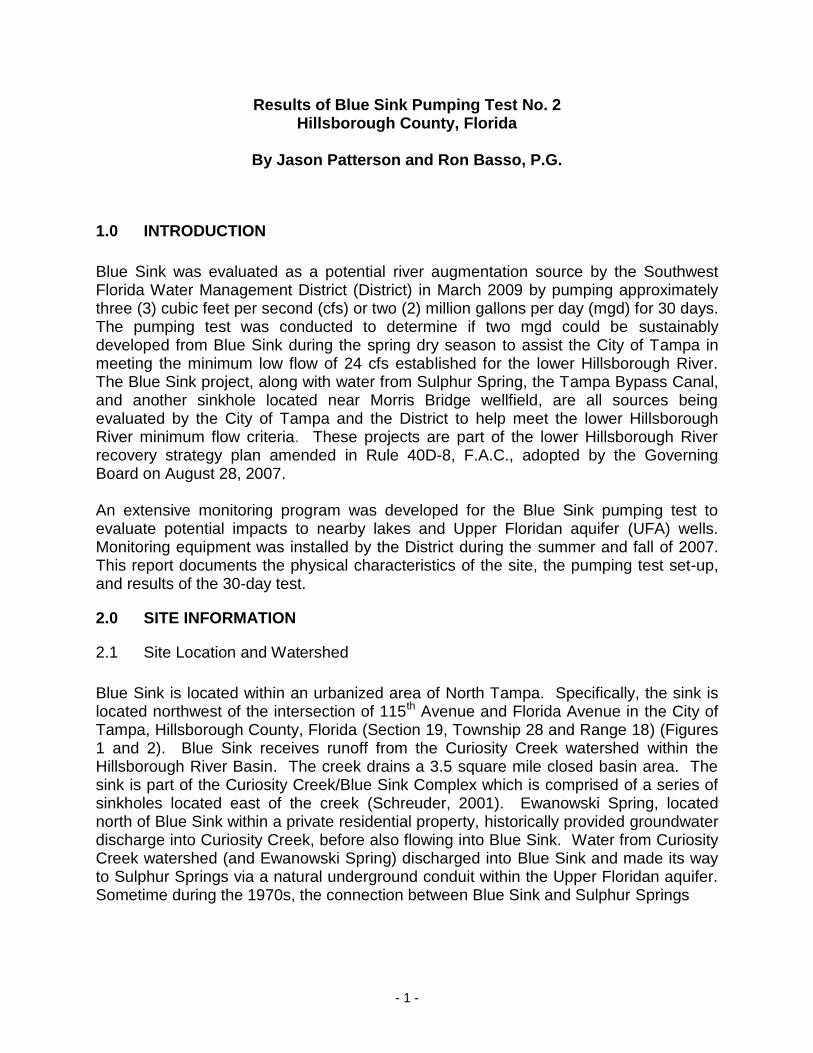
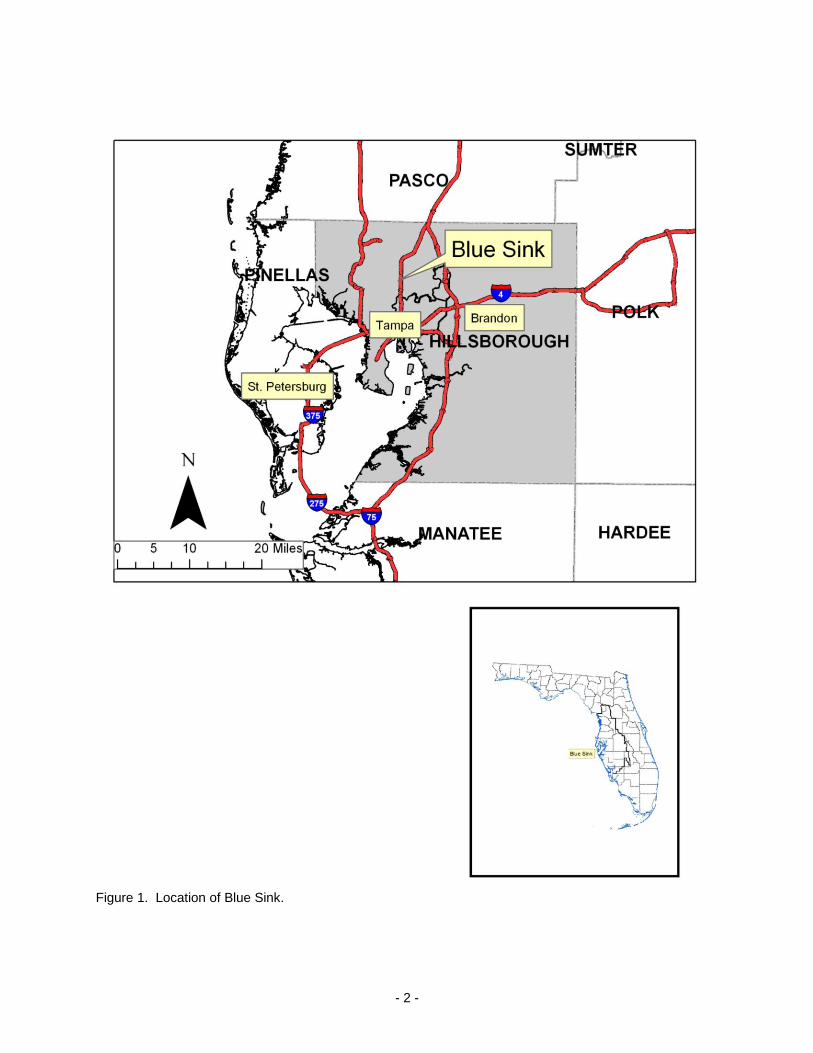
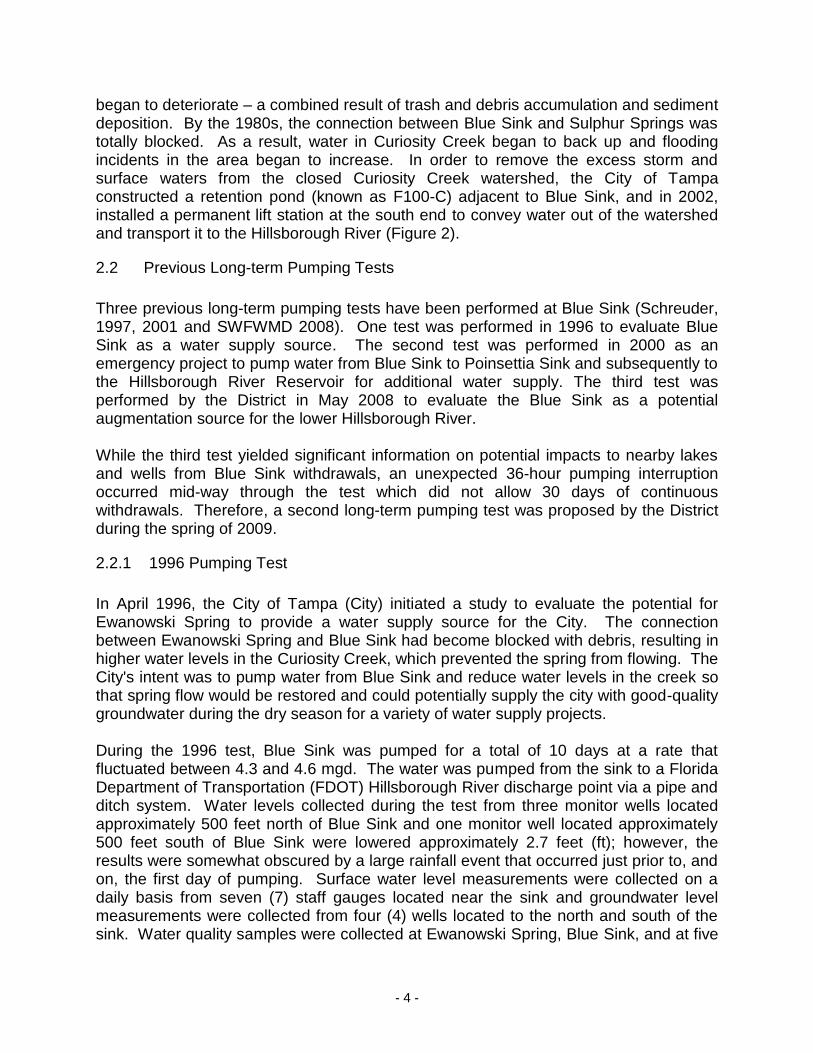
Blue Sink is located within an urbanized area of North Tampa. Specifically, the sink is located northwest of the intersection of 115th Avenue and Florida Avenue in the City of Tampa, Hillsborough County, Florida (Section 19, Township 28 and Range 18) (Figures 1 and 2). Blue Sink receives runoff from the Curiosity Creek watershed within the Hillsborough River Basin. The creek drains a 3.5 square mile closed basin area. The sink is part of the Curiosity Creek/Blue Sink Complex which is comprised of a series of sinkholes located east of the creek (Schreuder, 2001). Ewanowski Spring, located north of Blue Sink within a private residential property, historically provided groundwater discharge into Curiosity Creek, before also flowing into Blue Sink. Water from Curiosity Creek watershed (and Ewanowski Spring) discharged into Blue Sink and made its way to Sulphur Springs via a natural underground conduit within the Upper Floridan aquifer. Sometime during the 1970s, the connection between Blue Sink and Sulphur Springs
- 2 -
Figure 1. Location of Blue Sink.
- 3 -
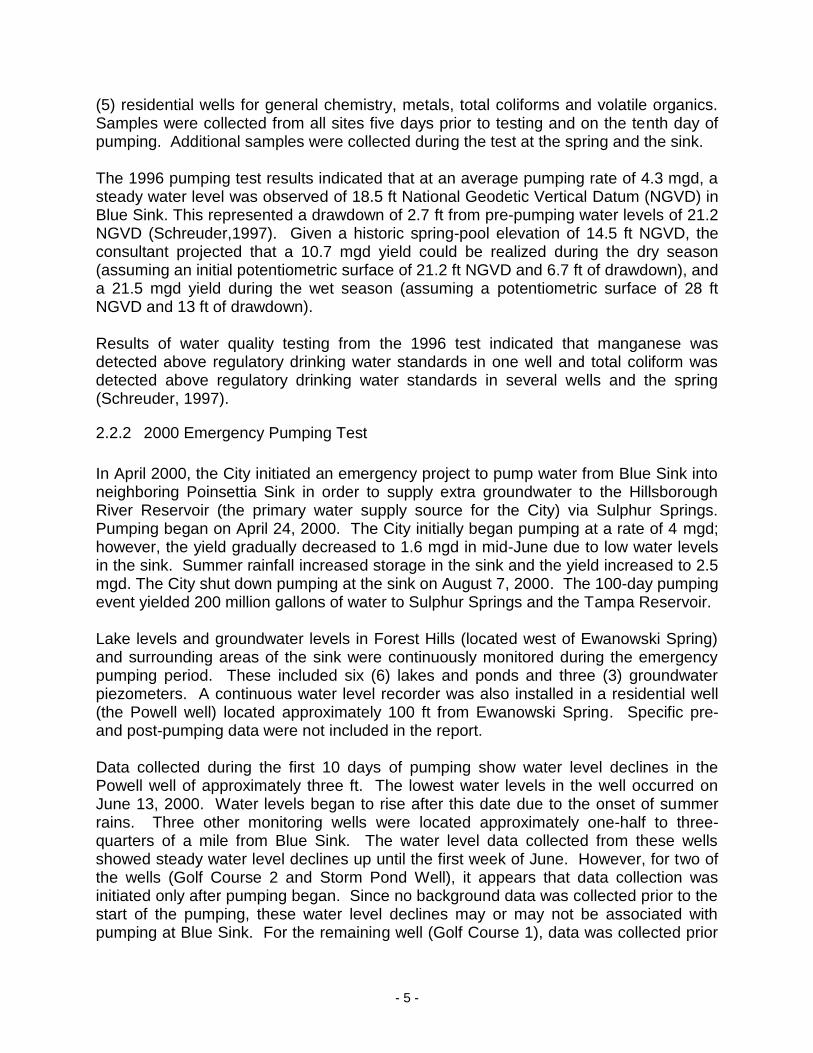
Figure 2. Location of Blue Sink, Ewanowski Spring, and the F100-C stormwater pond.
- 4 -
began to deteriorate – a combined result of trash and debris accumulation and sediment deposition. By the 1980s, the connection between Blue Sink and Sulphur Springs was totally blocked. As a result, water in Curiosity Creek began to back up and flooding incidents in the area began to increase. In order to remove the excess storm and surface waters from the closed Curiosity Creek watershed, the City of Tampa constructed a retention pond (known as F100-C) adjacent to Blue Sink, and in 2002, installed a permanent lift station at the south end to convey water out of the watershed and transport it to the Hillsborough River (Figure 2).
2.2 Previous Long-term Pumping Tests
Three previous long-term pumping tests have been performed at Blue Sink (Schreuder, 1997, 2001 and SWFWMD 2008). One test was performed in 1996 to evaluate Blue Sink as a water supply source. The second test was performed in 2000 as an emergency project to pump water from Blue Sink to Poinsettia Sink and subsequently to the Hillsborough River Reservoir for additional water supply. The third test was performed by the District in May 2008 to evaluate the Blue Sink as a potential augmentation source for the lower Hillsborough River. While the third test yielded significant information on potential impacts to nearby lakes and wells from Blue Sink withdrawals, an unexpected 36-hour pumping interruption occurred mid-way through the test which did not allow 30 days of continuous withdrawals. Therefore, a second long-term pumping test was proposed by the District during the spring of 2009.
2.2.1 1996 Pumping Test
In April 1996, the City of Tampa (City) initiated a study to evaluate the potential for Ewanowski Spring to provide a water supply source for the City. The connection between Ewanowski Spring and Blue Sink had become blocked with debris, resulting in higher water levels in the Curiosity Creek, which prevented the spring from flowing. The City's intent was to pump water from Blue Sink and reduce water levels in the creek so that spring flow would be restored and could potentially supply the city with good-quality groundwater during the dry season for a variety of water supply projects. During the 1996 test, Blue Sink was pumped for a total of 10 days at a rate that fluctuated between 4.3 and 4.6 mgd. The water was pumped from the sink to a Florida Department of Transportation (FDOT) Hillsborough River discharge point via a pipe and ditch system. Water levels collected during the test from three monitor wells located approximately 500 feet north of Blue Sink and one monitor well located approximately 500 feet south of Blue Sink were lowered approximately 2.7 feet (ft); however, the results were somewhat obscured by a large rainfall event that occurred just prior to, and on, the first day of pumping. Surface water level measurements were collected on a daily basis from seven (7) staff gauges located near the sink and groundwater level measurements were collected from four (4) wells located to the north and south of the sink. Water quality samples were collected at Ewanowski Spring, Blue Sink, and at five
- 5 -
(5) residential wells for general chemistry, metals, total coliforms and volatile organics. Samples were collected from all sites five days prior to testing and on the tenth day of pumping. Additional samples were collected during the test at the spring and the sink. The 1996 pumping test results indicated that at an average pumping rate of 4.3 mgd, a steady water level was observed of 18.5 ft National Geodetic Vertical Datum (NGVD) in Blue Sink. This represented a drawdown of 2.7 ft from pre-pumping water levels of 21.2 NGVD (Schreuder,1997). Given a historic spring-pool elevation of 14.5 ft NGVD, the consultant projected that a 10.7 mgd yield could be realized during the dry season (assuming an initial potentiometric surface of 21.2 ft NGVD and 6.7 ft of drawdown), and a 21.5 mgd yield during the wet season (assuming a potentiometric surface of 28 ft NGVD and 13 ft of drawdown). Results of water quality testing from the 1996 test indicated that manganese was detected above regulatory drinking water standards in one well and total coliform was detected above regulatory drinking water standards in several wells and the spring (Schreuder, 1997).
2.2.2 2000 Emergency Pumping Test
In April 2000, the City initiated an emergency project to pump water from Blue Sink into neighboring Poinsettia Sink in order to supply extra groundwater to the Hillsborough River Reservoir (the primary water supply source for the City) via Sulphur Springs. Pumping began on April 24, 2000. The City initially began pumping at a rate of 4 mgd; however, the yield gradually decreased to 1.6 mgd in mid-June due to low water levels in the sink. Summer rainfall increased storage in the sink and the yield increased to 2.5 mgd. The City shut down pumping at the sink on August 7, 2000. The 100-day pumping event yielded 200 million gallons of water to Sulphur Springs and the Tampa Reservoir. Lake levels and groundwater levels in Forest Hills (located west of Ewanowski Spring) and surrounding areas of the sink were continuously monitored during the emergency pumping period. These included six (6) lakes and ponds and three (3) groundwater piezometers. A continuous water level recorder was also installed in a residential well (the Powell well) located approximately 100 ft from Ewanowski Spring. Specific pre- and post-pumping data were not included in the report. Data collected during the first 10 days of pumping show water level declines in the Powell well of approximately three ft. The lowest water levels in the well occurred on June 13, 2000. Water levels began to rise after this date due to the onset of summer rains. Three other monitoring wells were located approximately one-half to three-quarters of a mile from Blue Sink. The water level data collected from these wells showed steady water level declines up until the first week of June. However, for two of the wells (Golf Course 2 and Storm Pond Well), it appears that data collection was initiated only after pumping began. Since no background data was collected prior to the start of the pumping, these water level declines may or may not be associated with pumping at Blue Sink. For the remaining well (Golf Course 1), data was collected prior
- 6 -
to pumping (approximately one to two weeks); however, it is difficult to discern whether water levels were relatively static or already declining at the onset of pumping. Water quality samples were collected and analyzed for drinking water standards. However, all of the analytical data was not available for review. From the data available, samples analyzed for drinking water standards exceeded criteria for cis-1,2-Dichloroethylene, Trichloroethylene and Vinyl Chloride (Chloromethane). Values of Fecal and Total Coliform from samples taken at Blue Sink in August 2000, ranged from 100 coliforms per 100 milliliters (col/100mL) to greater than 20,000 col/100mL; and 16,000 col/100mL to 149,000 col/100mL. Total Suspended Solids (TSS) values ranged from 3 to 8 mg/L from the same sample set (HydroServices, 2000).
2.2.3 SWFWMD 2008 Pumping Test No. 1
On May 7, 2008, a pumping test was performed at Blue Sink to assess the feasibility of using the sink as a source of water to augment low flow conditions in the lower Hillsborough River. The pumping test was initiated during the dry months of the year (May 2008 through early June 2008) to determine the quantity of water that can be developed from Blue Sink without adversely impacting water resources in the area. Lake levels within the vicinity of the sink were continuously monitored before, during, and after the pump test period at 15-minute intervals. These included five (5) lakes and ponds. One lake (Lake Ellen) located approximately 2.35 miles from Blue Sink was used to monitor background water levels. The background lake water levels decreased by 0.79 ft during the pumping period. Calculated drawdown was less than 0.1 ft in three of the five lakes near the pumping test and two lakes (Lake Eckles and Noreast Lake) showed increased lake levels. Therefore, no significant drawdown was observed in lake levels during the pumping period. Water levels were collected at eight (8) UFA wells located from 110 to 3,800 ft from Blue Sink during the pumping test. A background well, ROMP 66 Tampa-Suwannee, located approximately 6,300 ft south of Blue Sink, was used to determine the regional trend in the UFA. Background water levels decreased by 1.28 ft during the pumping period. Drawdown for the eight (8) UFA monitor wells ranged from 2.53 ft near the sink to 0.2 ft at 3,500 ft away. During the test, a mechanical failure interrupted the pumping for more than 36 hours from May 19, 2008 to May 21, 2008. This resulted in water levels recovering close to their pre-pumping levels in the sink and did not allow 30 days of relatively constant stress on the system. Therefore, maximum drawdown in Blue Sink (and nearby lakes and wells) may not have been fully achieved during the test. Based on this situation, District staff recommended that a second pumping test be conducted in the spring of 2009 at Blue Sink.
- 7 -
3.0 HYDROGEOLOGY
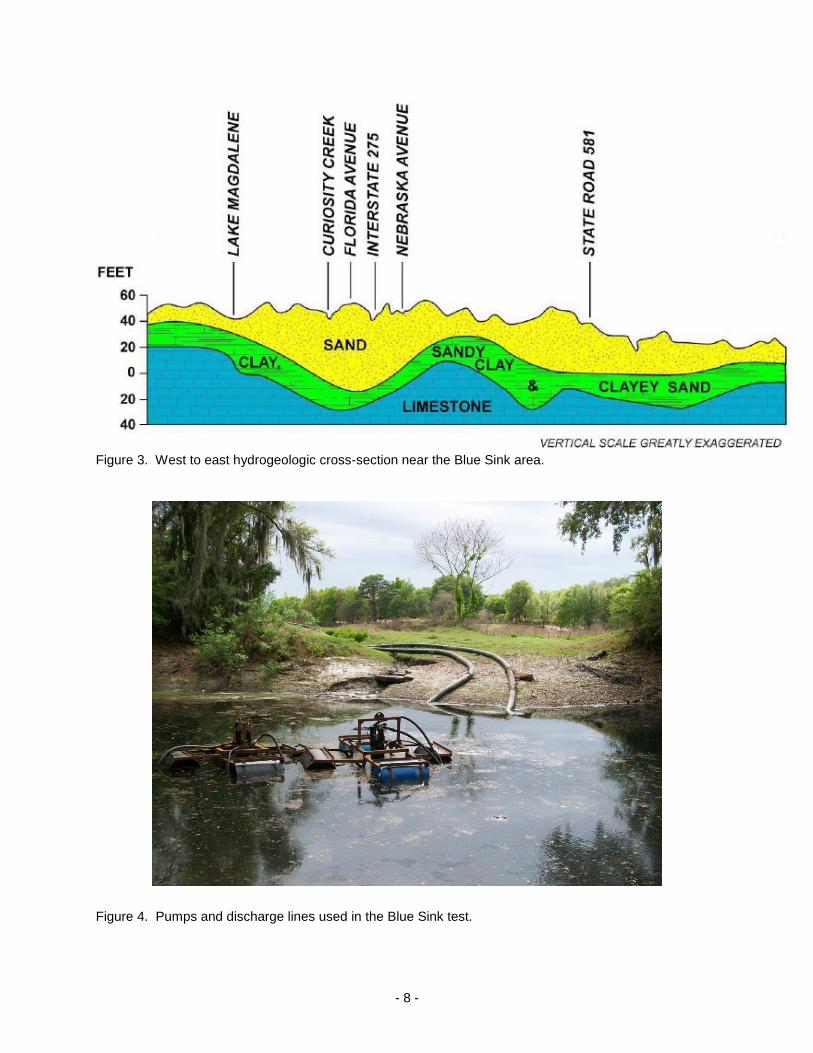
The hydrogeologic flow system of the Blue Sink area is comprised of three principal hydrogeologic units: 1) the surficial aquifer; 2) semi-confining beds of the intermediate confining unit; and 3) the Upper Floridan aquifer (UFA). The surficial aquifer consists of unconsolidated fine sands, silt, and clayey sands of Miocene, Pleistocene, and recent origin which generally range in thickness from 10 ft to 50 ft (SWFWMD, 2000). The intermediate confining unit separates the surficial aquifer from the underlying UFA. It is composed of sandy clay and clay of the Hawthorn Group that somewhat limits the hydraulic connection between the surficial and UFA (SWFWMD, 2000). Downward leakage into the UFA is retarded by these lower permeability units; however, the collapse of the underlying limestone due to karst processes has produced numerous breaches in the clay that act as vertical conduits for the movement of water from the surficial to the UFA (SWFWMD, 2001). The UFA is the primary artesian aquifer throughout Florida and much of the southeastern United States. The UFA is composed of limestone and dolomite beds of Eocene to Miocene age which have an average thickness of approximately 1,100 ft in the Blue Sink area (Miller, 1986). The lower part of the Avon Park Formation contains evaporites consisting of gypsum and anhydrite that reduce permeability of the rock and defines the base of the UFA (SWFWMD, 2001). The Blue Sink complex of sink features is located within the Sulphur Springs contributing area. Sulphur Springs is located about 2.3 miles south of Blue Sink and discharges an average of 44 cfs to the lower Hillsborough River. According to well installation logs in the area, the lithology within the vicinity of Blue Sink consists of fine sand to approximately 20 ft below land surface (bls), clay from approximately 20 to 25 ft bls and limestone below approximately 25 ft bls. A hydrogeologic cross section of the Blue Sink area is presented in Figure 3.
4.0 PUMPING TEST SETUP AND MONITORING PROGRAM
To assess the feasibility of using Blue Sink as a source of water to augment low flow conditions in the lower Hillsborough River, the District proposed conducting a second pumping test to achieve 30 days of continuous pumping stress on Blue Sink. The second District pumping test at Blue Sink occurred mainly during March 2009.
4.1 Blue Sink Pumping Test No. 2
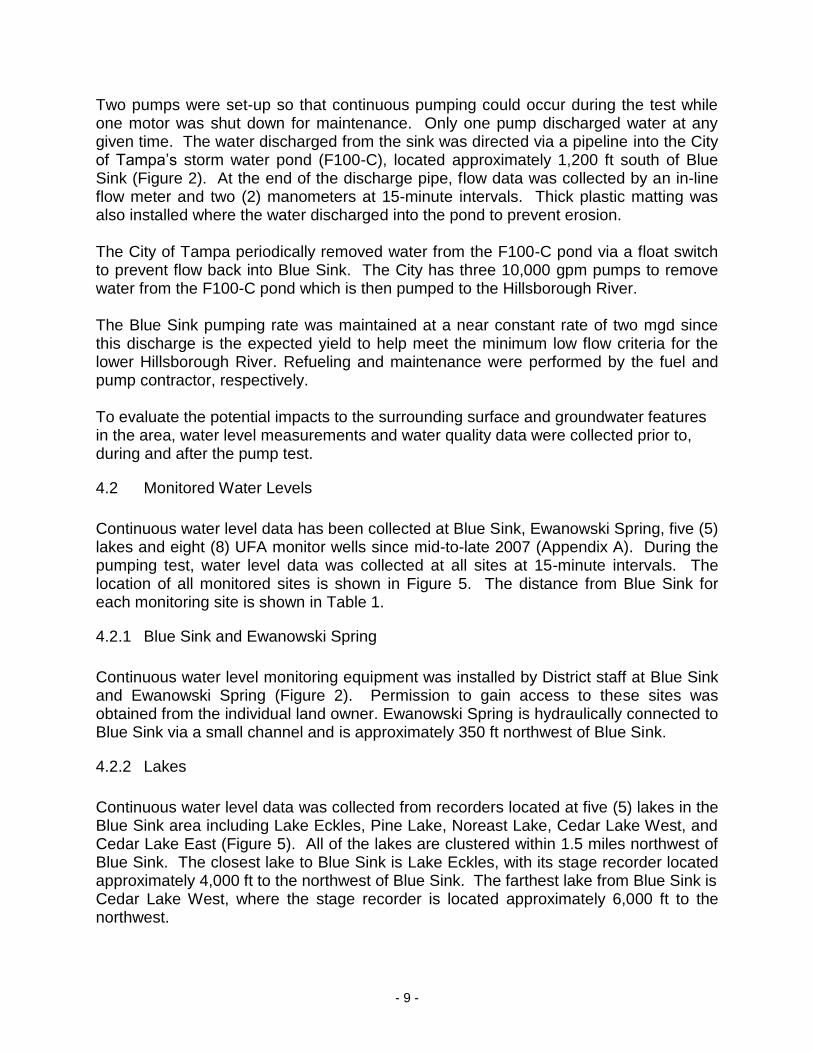
The pumping test was initiated at 9 a.m. on March 2, 2009 and ended at 9 a.m. on April 1, 2009. Prior to the pumping test, two pumps were installed in Blue Sink (Figure 4). Each pump was capable of discharging approximately two (2) mgd for the 30-day period. The intake features for each pump were mounted on barrel floats in the sink.
- 8 -
Figure 3. West to east hydrogeologic cross-section near the Blue Sink area.
Figure 4. Pumps and discharge lines used in the Blue Sink test.
- 9 -
Two pumps were set-up so that continuous pumping could occur during the test while one motor was shut down for maintenance. Only one pump discharged water at any given time. The water discharged from the sink was directed via a pipeline into the City of Tampa’s storm water pond (F100-C), located approximately 1,200 ft south of Blue Sink (Figure 2). At the end of the discharge pipe, flow data was collected by an in-line flow meter and two (2) manometers at 15-minute intervals. Thick plastic matting was also installed where the water discharged into the pond to prevent erosion. The City of Tampa periodically removed water from the F100-C pond via a float switch to prevent flow back into Blue Sink. The City has three 10,000 gpm pumps to remove water from the F100-C pond which is then pumped to the Hillsborough River. The Blue Sink pumping rate was maintained at a near constant rate of two mgd since this discharge is the expected yield to help meet the minimum low flow criteria for the lower Hillsborough River. Refueling and maintenance were performed by the fuel and pump contractor, respectively. To evaluate the potential impacts to the surrounding surface and groundwater features in the area, water level measurements and water quality data were collected prior to, during and after the pump test.
4.2 Monitored Water Levels
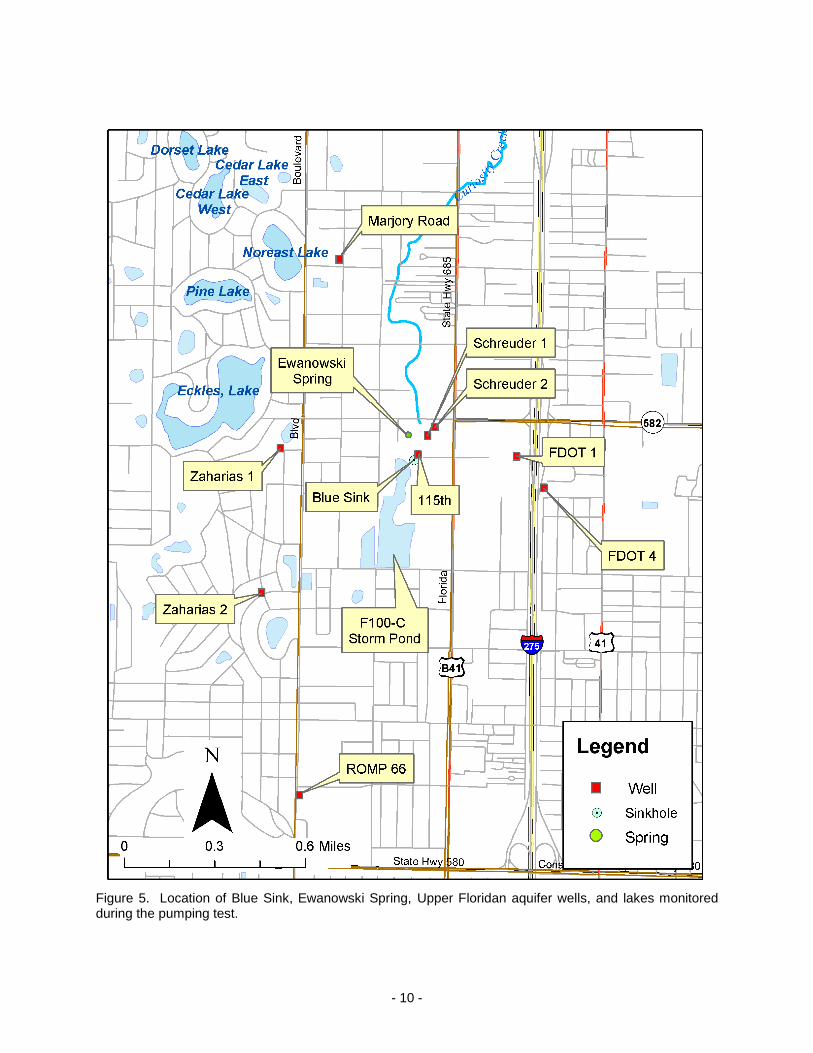
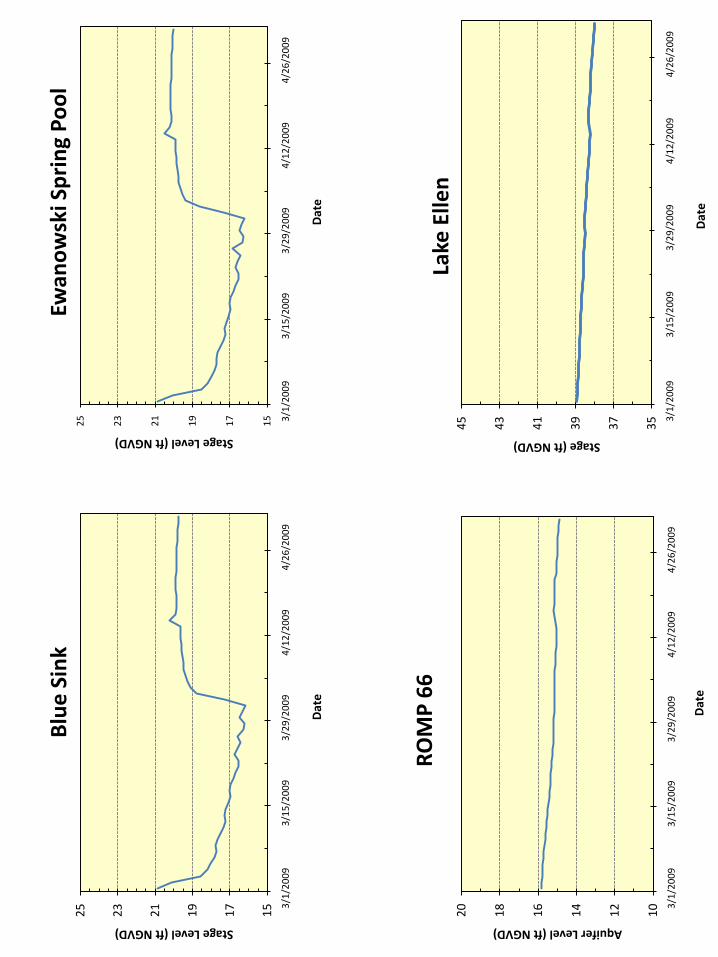
Continuous water level data has been collected at Blue Sink, Ewanowski Spring, five (5) lakes and eight (8) UFA monitor wells since mid-to-late 2007 (Appendix A). During the pumping test, water level data was collected at all sites at 15-minute intervals. The location of all monitored sites is shown in Figure 5. The distance from Blue Sink for each monitoring site is shown in Table 1.
4.2.1 Blue Sink and Ewanowski Spring
Continuous water level monitoring equipment was installed by District staff at Blue Sink and Ewanowski Spring (Figure 2). Permission to gain access to these sites was obtained from the individual land owner. Ewanowski Spring is hydraulically connected to Blue Sink via a small channel and is approximately 350 ft northwest of Blue Sink.
4.2.2 Lakes
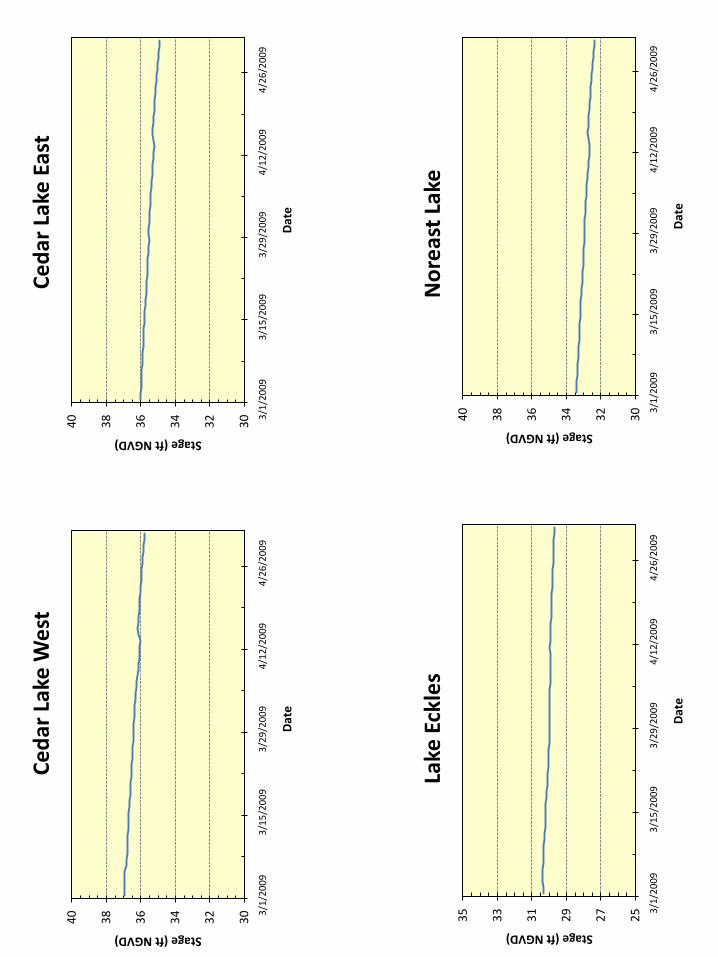
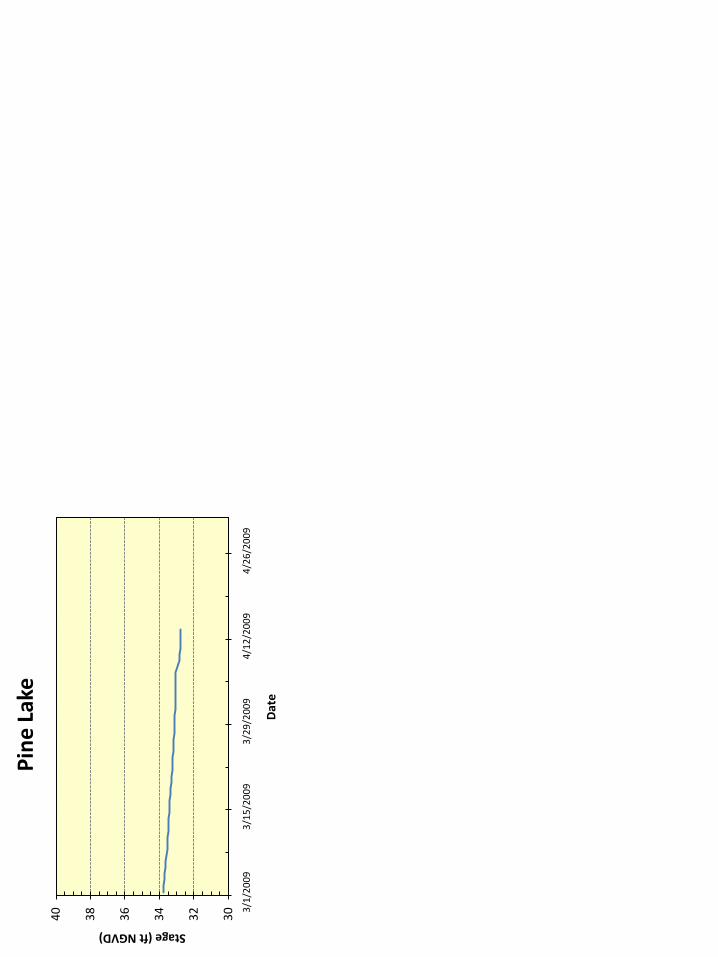
Continuous water level data was collected from recorders located at five (5) lakes in the Blue Sink area including Lake Eckles, Pine Lake, Noreast Lake, Cedar Lake West, and Cedar Lake East (Figure 5). All of the lakes are clustered within 1.5 miles northwest of Blue Sink. The closest lake to Blue Sink is Lake Eckles, with its stage recorder located approximately 4,000 ft to the northwest of Blue Sink. The farthest lake from Blue Sink is Cedar Lake West, where the stage recorder is located approximately 6,000 ft to the northwest.
- 10 -
Figure 5. Location of Blue Sink, Ewanowski Spring, Upper Floridan aquifer wells, and lakes monitored during the pumping test.
- 11 -
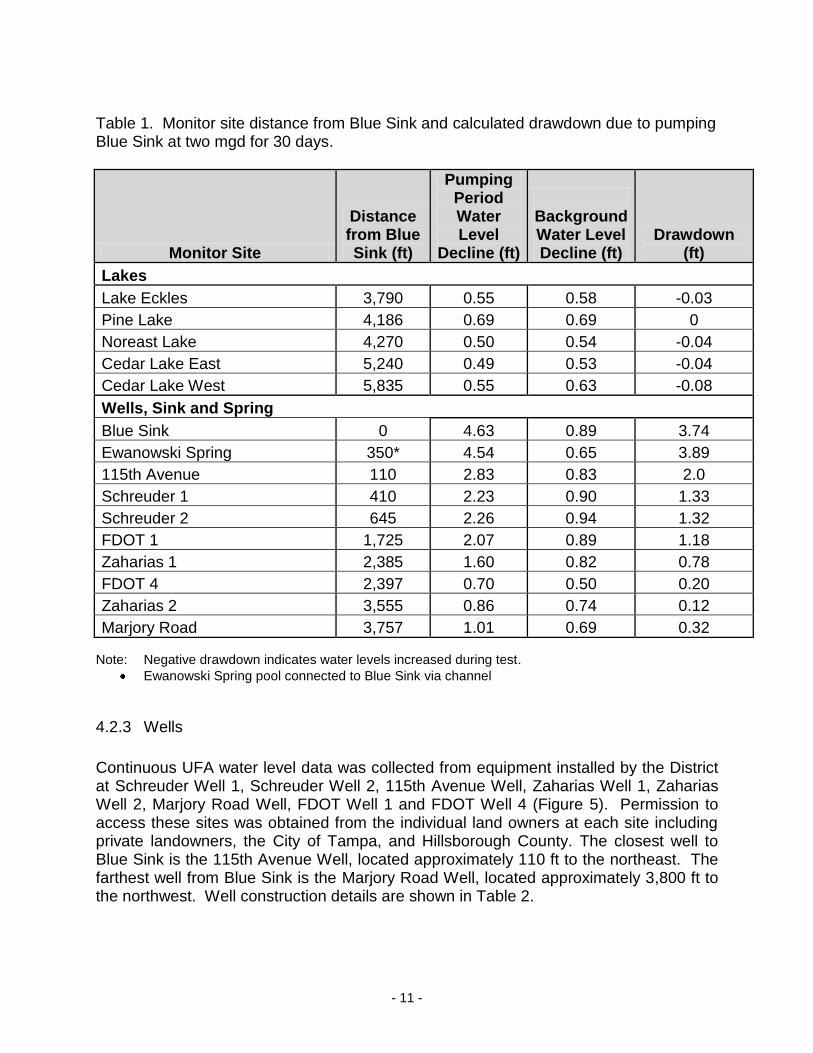
Table 1. Monitor site distance from Blue Sink and calculated drawdown due to pumping Blue Sink at two mgd for 30 days.
Monitor Site
Distance from Blue Sink (ft)
Pumping Period Water Level
Decline (ft)
Background Water Level Decline (ft)
Drawdown (ft)
Lakes
Lake Eckles 3,790 0.55 0.58 -0.03
Pine Lake 4,186 0.69 0.69 0
Noreast Lake 4,270 0.50 0.54 -0.04
Cedar Lake East 5,240 0.49 0.53 -0.04
Cedar Lake West 5,835 0.55 0.63 -0.08
Wells, Sink and Spring
Blue Sink 0 4.63 0.89 3.74
Ewanowski Spring 350* 4.54 0.65 3.89
115th Avenue 110 2.83 0.83 2.0
Schreuder 1 410 2.23 0.90 1.33
Schreuder 2 645 2.26 0.94 1.32
FDOT 1 1,725 2.07 0.89 1.18
Zaharias 1 2,385 1.60 0.82 0.78
FDOT 4 2,397 0.70 0.50 0.20
Zaharias 2 3,555 0.86 0.74 0.12
Marjory Road 3,757 1.01 0.69 0.32
Note: Negative drawdown indicates water levels increased during test.
Ewanowski Spring pool connected to Blue Sink via channel
4.2.3 Wells
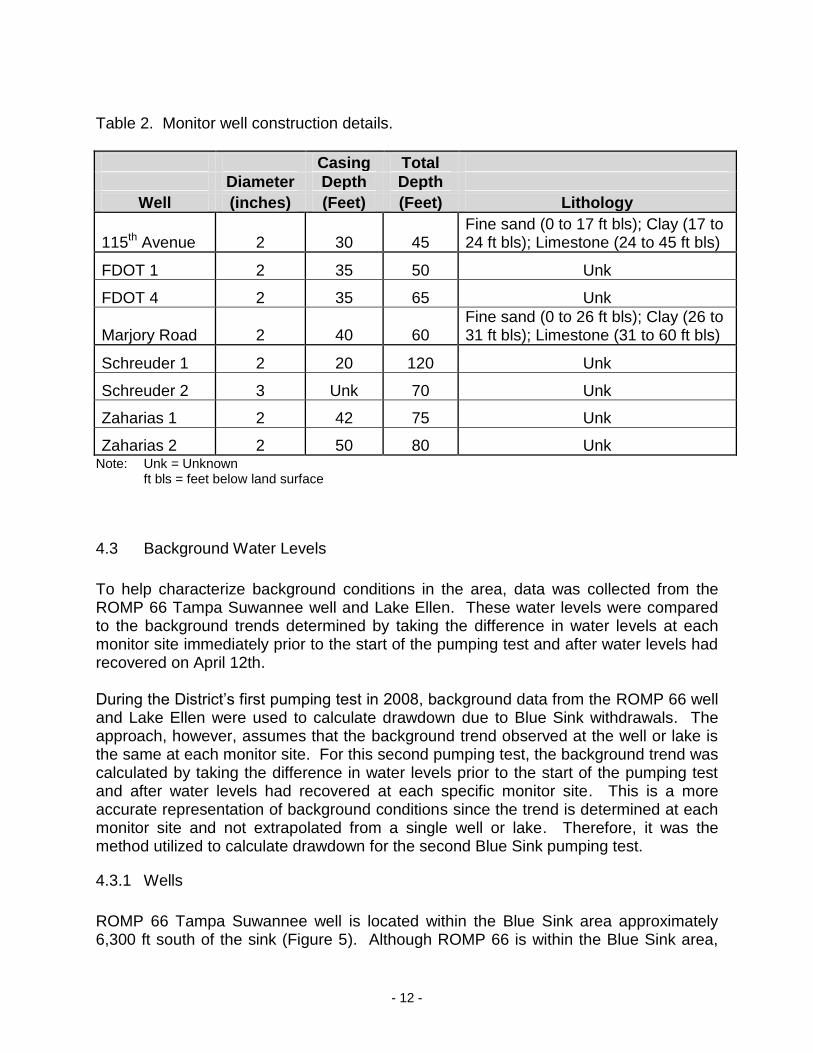
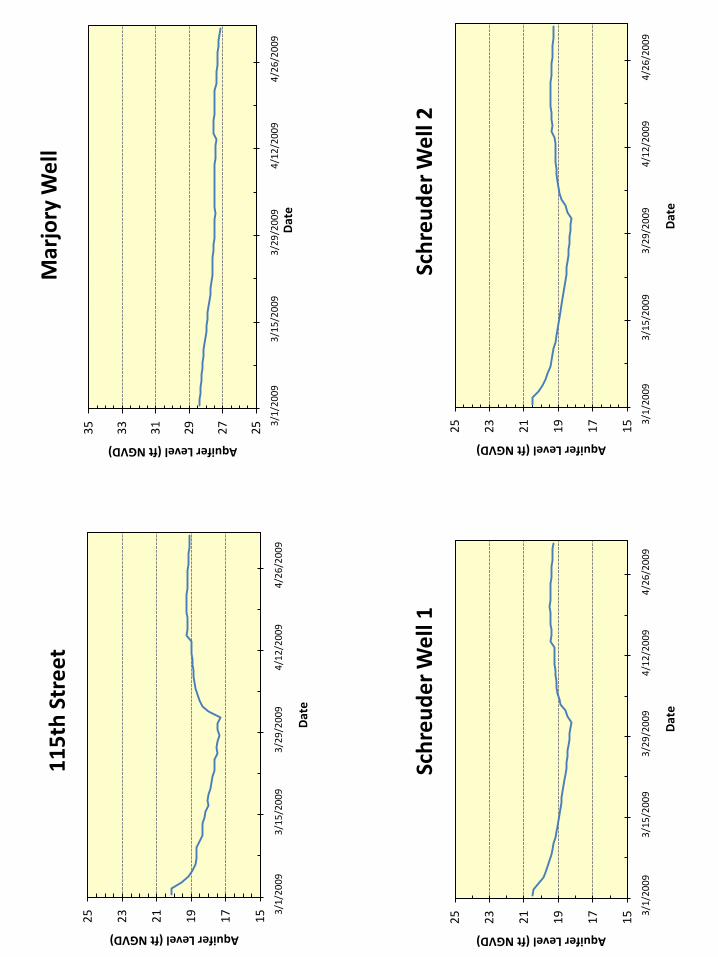
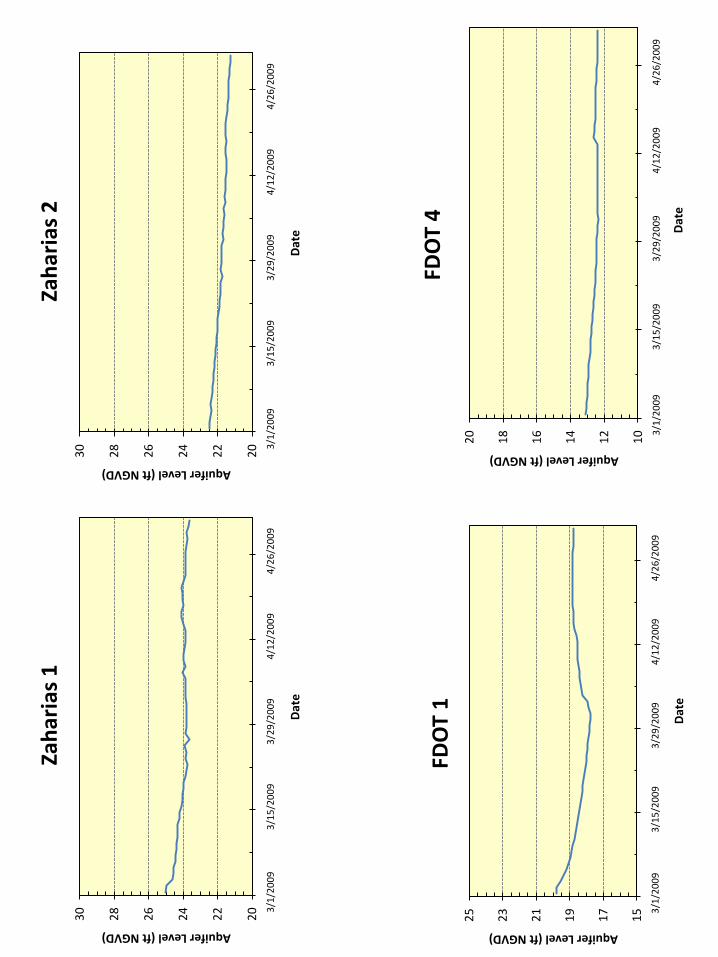
Continuous UFA water level data was collected from equipment installed by the District at Schreuder Well 1, Schreuder Well 2, 115th Avenue Well, Zaharias Well 1, Zaharias Well 2, Marjory Road Well, FDOT Well 1 and FDOT Well 4 (Figure 5). Permission to access these sites was obtained from the individual land owners at each site including private landowners, the City of Tampa, and Hillsborough County. The closest well to Blue Sink is the 115th Avenue Well, located approximately 110 ft to the northeast. The farthest well from Blue Sink is the Marjory Road Well, located approximately 3,800 ft to the northwest. Well construction details are shown in Table 2.
- 12 -
Table 2. Monitor well construction details.
Casing Total
Diameter Depth Depth
Well (inches) (Feet) (Feet) Lithology
115th Avenue 2 30 45 Fine sand (0 to 17 ft bls); Clay (17 to 24 ft bls); Limestone (24 to 45 ft bls)
FDOT 1 2 35 50 Unk
FDOT 4 2 35 65 Unk
Marjory Road 2 40 60 Fine sand (0 to 26 ft bls); Clay (26 to 31 ft bls); Limestone (31 to 60 ft bls)
Schreuder 1 2 20 120 Unk
Schreuder 2 3 Unk 70 Unk
Zaharias 1 2 42 75 Unk
Zaharias 2 2 50 80 Unk Note: Unk = Unknown ft bls = feet below land surface
4.3 Background Water Levels
To help characterize background conditions in the area, data was collected from the ROMP 66 Tampa Suwannee well and Lake Ellen. These water levels were compared to the background trends determined by taking the difference in water levels at each monitor site immediately prior to the start of the pumping test and after water levels had recovered on April 12th. During the District’s first pumping test in 2008, background data from the ROMP 66 well and Lake Ellen were used to calculate drawdown due to Blue Sink withdrawals. The approach, however, assumes that the background trend observed at the well or lake is the same at each monitor site. For this second pumping test, the background trend was calculated by taking the difference in water levels prior to the start of the pumping test and after water levels had recovered at each specific monitor site. This is a more accurate representation of background conditions since the trend is determined at each monitor site and not extrapolated from a single well or lake. Therefore, it was the method utilized to calculate drawdown for the second Blue Sink pumping test.
4.3.1 Wells
ROMP 66 Tampa Suwannee well is located within the Blue Sink area approximately 6,300 ft south of the sink (Figure 5). Although ROMP 66 is within the Blue Sink area,
- 13 -
analysis of previous pumping test results indicated that it is not significantly affected by withdrawals from Blue Sink. A continuous water level recorder already existed on the ROMP 66 well and the well is part of the District’s regional monitoring network. Data from this well was used to compare with background water level trends determined by taking the difference between pre-pumping and recovered water levels at each sink, spring, and UFA well monitor site. The ROMP 66 well water level declined by 0.74 ft during the 30-day pumping test. The average background water level decline as determined by taking the difference between pre-pumping and recovered water levels at each sink, spring, and monitor well was 0.79 ft.
4.3.2 Lakes
Lake Ellen is located in the vicinity of Blue Sink, but well outside the zone-of-influence of the pumping test (Figure 2). Lake Ellen is situated approximately 12,000 ft northwest of Blue Sink. Stage data from the lake was used to compare with background water level trends determined by taking the difference between pre-pumping and recovered water levels at the lake monitor sites. Lake Ellen’s stage declined by 0.43 ft during the 30-day pumping test. The average background trend as determined by taking the difference between pre-pumping and recovered water levels at each lake was 0.59 ft. In this case, Lake Ellen’s stage change during the 30-day pumping test was slightly lower compared to background trends determined at each of the five lakes monitored during the test.
4.4 Rainfall Data
A continuous rainfall gage was installed at the Marjory Road Well location on March 9, 2008 (Figure 5). The rainfall gage is located approximately 3,800 ft northwest of Blue Sink. Data was collected via tipping bucket gage at 15-minute intervals to evaluate the effect of rainfall in the area of Blue Sink during the pumping period.
4.5 Water Quality Testing – Blue Sink
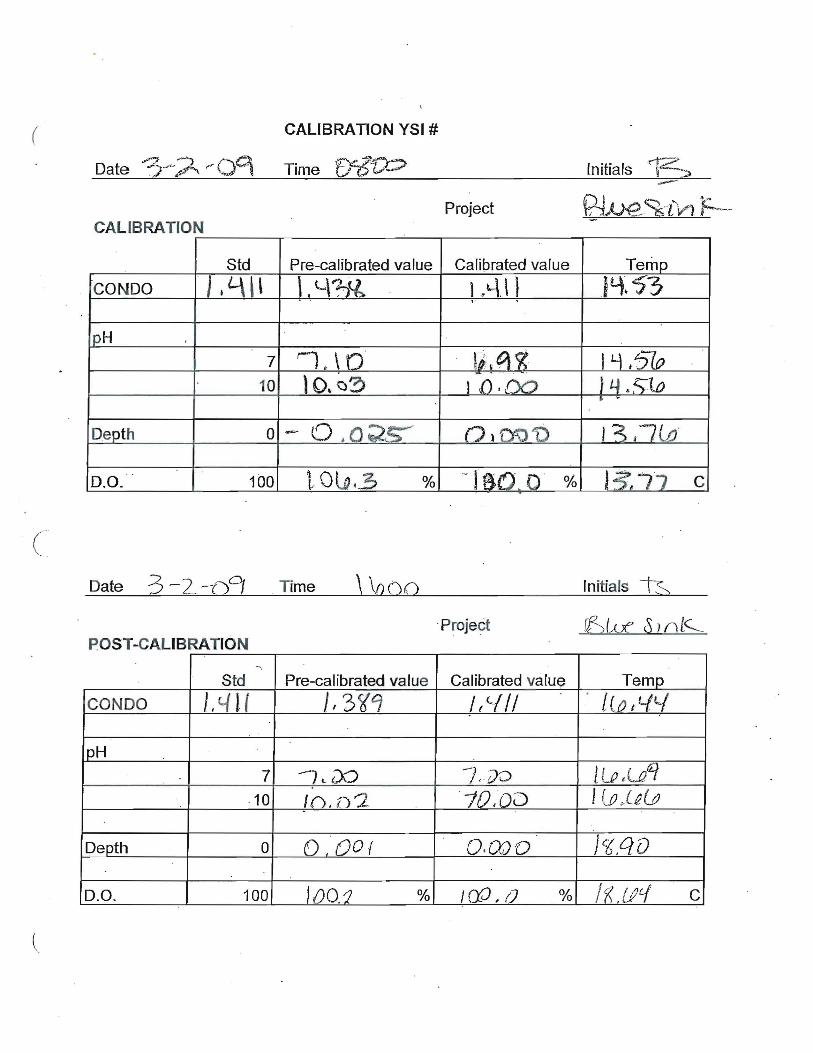
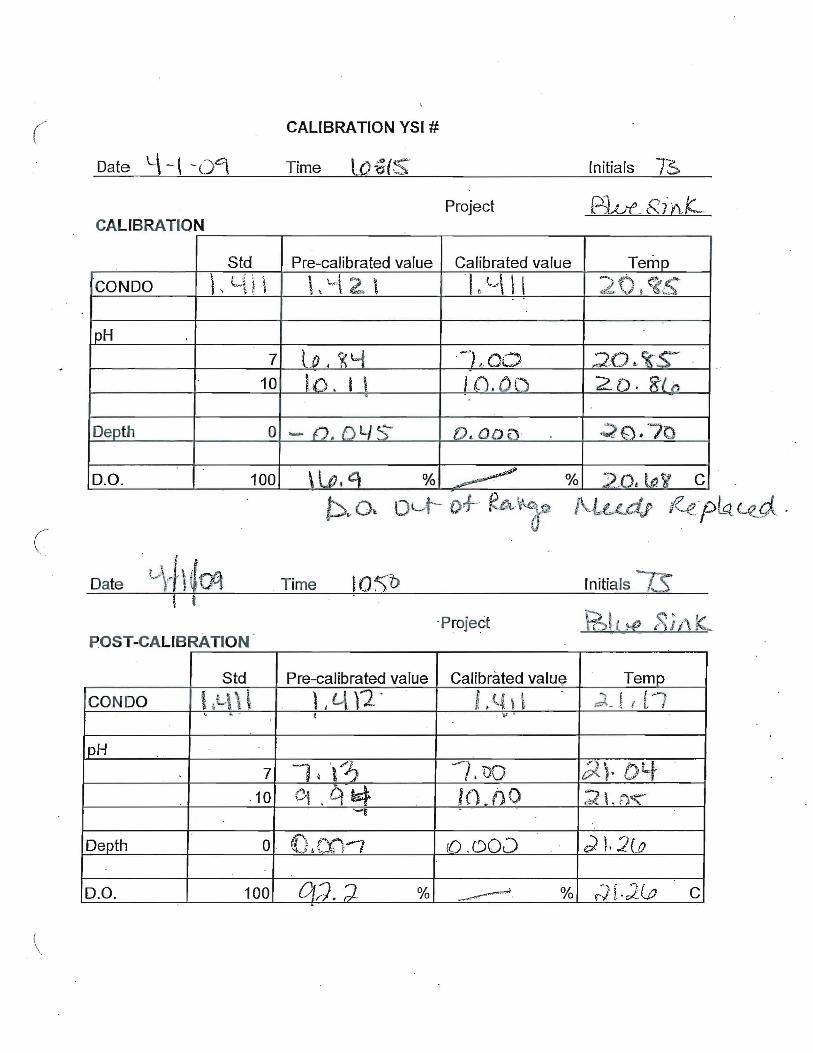
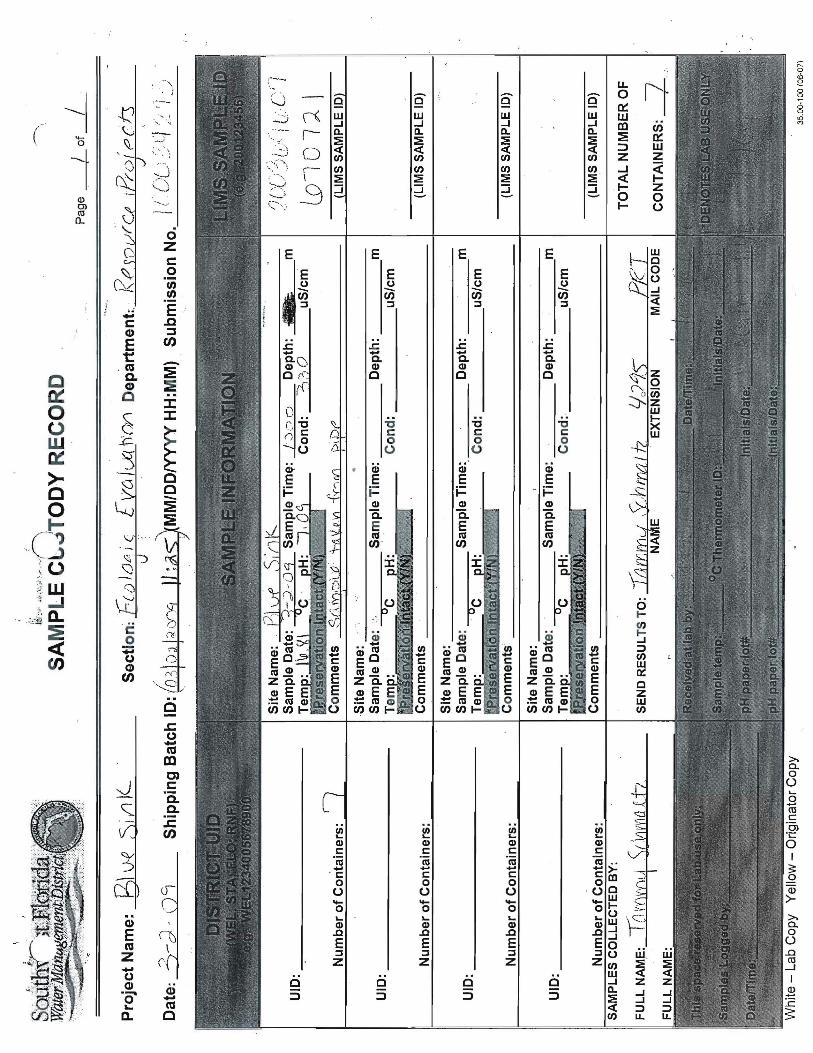
Surface water samples were collected from Blue Sink at 10:00 a.m. on March 2, 2009, and at 8:05 a.m. on April 1, 2009. All samples were collected in accordance with current Florida Department of Environmental Protection (FDEP) Standard Operating Procedures (SOPs) (FS 2000/2100). Unfiltered surface water grab samples were collected directly into laboratory-supplied sample containers from the pumping test discharge pipe located at the outfall into the F100-C pond. Prior to sampling, water was collected into a tub, and static field measurements (including temperature, pH and conductivity) were taken using a -YSI multi-parameter sonde meter. Prior to collecting field measurements, the YSI meter was calibrated in accordance with FDEP SOPs.

- 14 -
Following collection of the samples for each event, the containers were preserved as necessary and stored in iced coolers. The samples were submitted under proper chain of custody to the District's in-house laboratory for chlorophyll [Standard Method (SM) 10200H); pheaophytin (SM 10200H); color (SM 20th Edition 2120B); conductivity (SM 18th Edition 2510B); ortho phosphorous (SM 4500-P); total phosphorous [Environmental Protection Agency (EPA) Method 365.1]; total suspended solids (TSS) (SM 2540D); amount filtered from TSS volume (SM 2540D); volatile suspended solids (SM 2540E); turbidity (SM 20th Edition 2130B); hydrogen ion (pH) (SM 4500H+B); ammonia (SM 20th Edition 4500NH3-G); nitrate+nitrite (EPA Method 353.2); nitrite (EPA Method 353.2); and total nitrogen (EPA Method 353.2). Calibration sheets and chain of custodies for both sampling events are included in Appendix B.
5.0 PUMPING TEST RESULTS
5.1 Rainfall
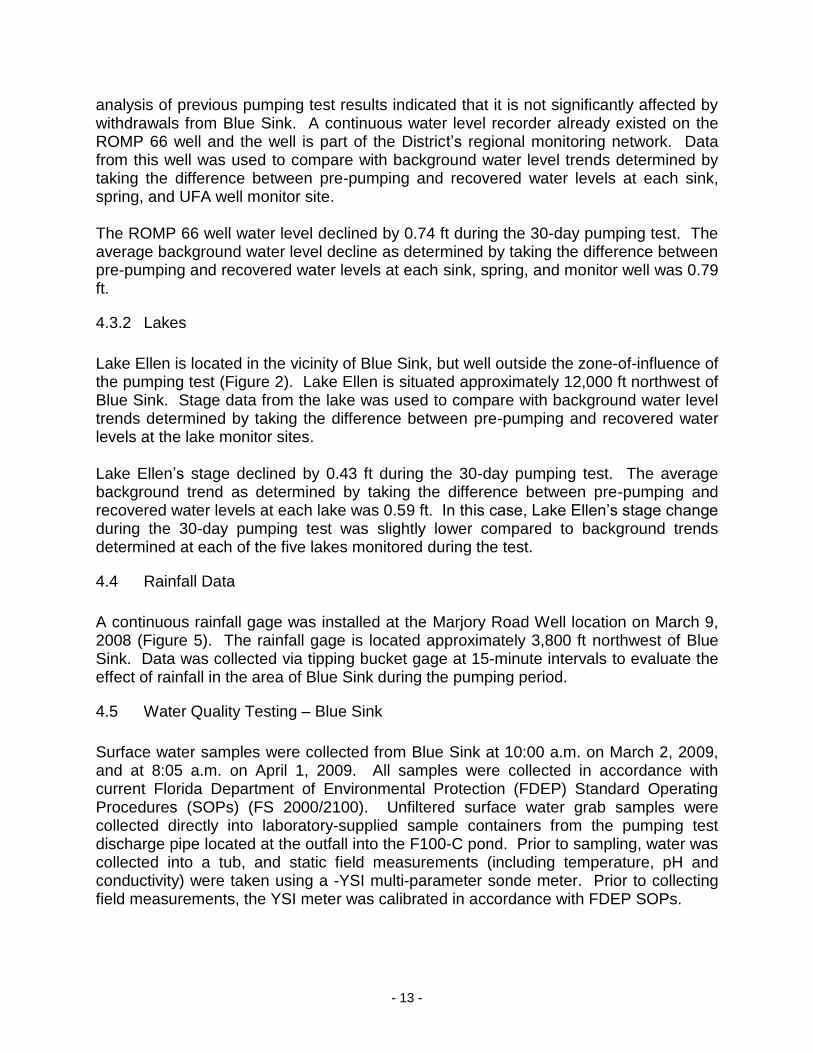
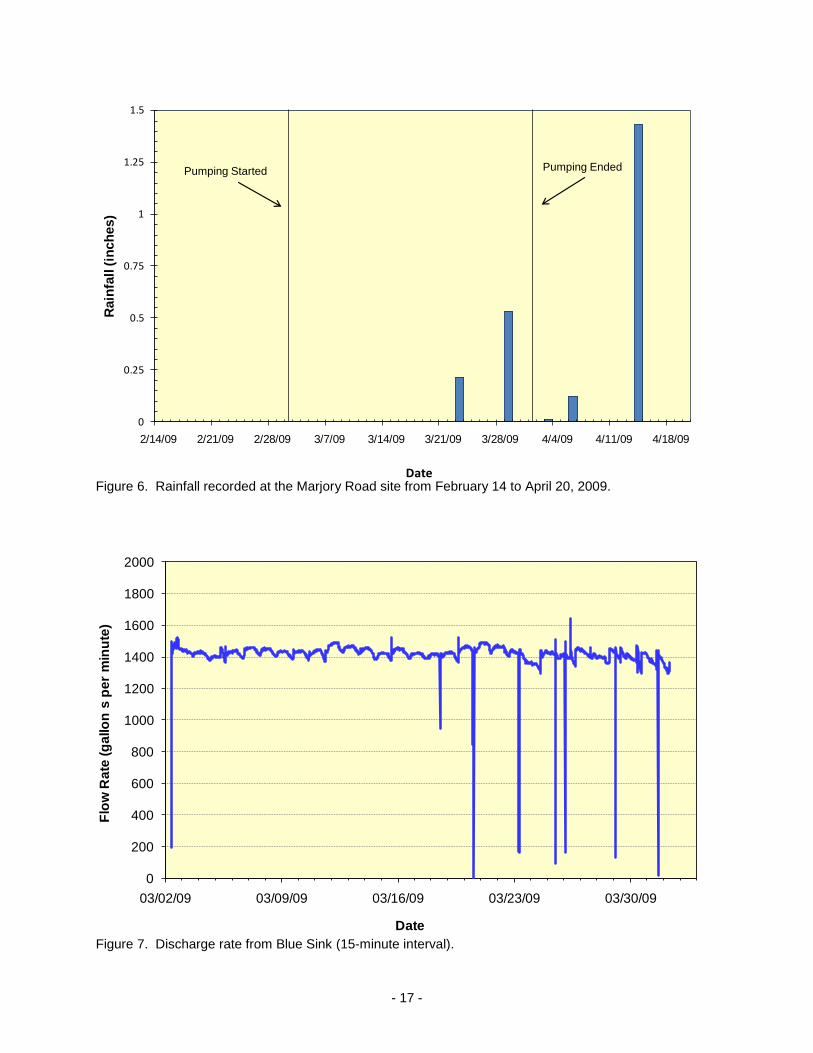
No significant rainfall was recorded during the pump test period or within two weeks prior to the pump test. Rainfall was recorded during the 30-day pumping test period on March 23, 2009 (0.21 inches) and on March 29, 2009 (0.53 inches) for a total of 0.74 inches (0.06 feet). Rainfall after the test totaled 0.01 inches on April 3rd, 0.12 inches on April 5th, and 1.43 inches on April 14th (Table 3 and Figure 6).
5.2 Discharge Rates
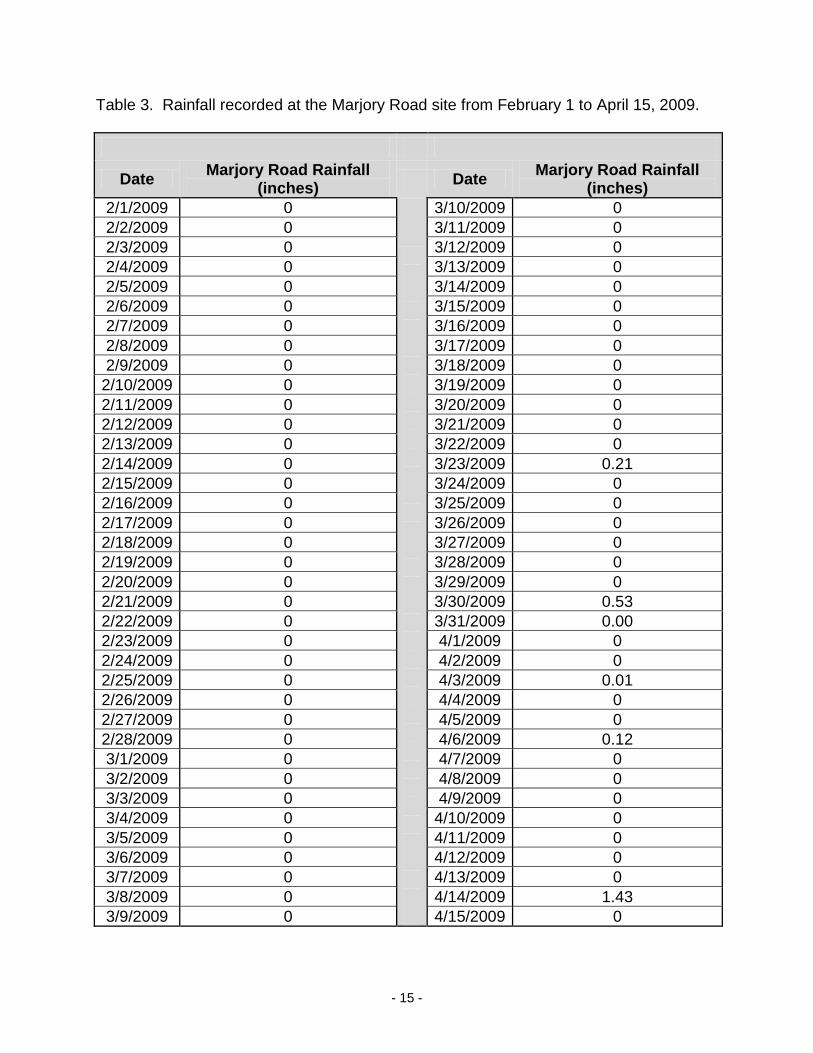
Flow was measured using a flow meter and two manometers at 15-minute intervals during the pumping test (Table 4 and Figure 7). Data from the flow meter was not available due to a mechanical failure caused by sediment and other debris. The measured flow rates from Manometer 1 were essentially the same as Manometer 2 readings. The average flow rate during the pump test was 1,412 gpm from Manometer 1 and 1,411 gpm from Manometer 2. The average from both manometers was 1,412 gpm or approximately two mgd. The largest 15-minute fluctuations between Manometer 1 and Manometer 2 ranged from -25 percent to 34 percent (Table 4). Total discharge from Blue Sink was approximately 61 million gallons during the 30-day test. Pumping from Blue Sink was interrupted during the test on March 18, 29, and 31, for less than one-half hour. On March 20, the pumping was interrupted from 11:45 a.m. to 1:30 p.m. and on March 23 from 6:30 a.m. to 7:15 a.m. The pumping was also interrupted on March 26 from 1:15 p.m. to 2:30 p.m. All pumping interruptions were less than two hours and did not significantly impact the analysis of impacts. Many of the pump shutdowns were due to vandalism of the pumping equipment and discharge line.
- 15 -
Table 3. Rainfall recorded at the Marjory Road site from February 1 to April 15, 2009.
Date Marjory Road Rainfall
(inches) Date
Marjory Road Rainfall (inches)
2/1/2009 0
3/10/2009 0
2/2/2009 0 3/11/2009 0
2/3/2009 0 3/12/2009 0
2/4/2009 0 3/13/2009 0
2/5/2009 0 3/14/2009 0
2/6/2009 0 3/15/2009 0
2/7/2009 0 3/16/2009 0
2/8/2009 0 3/17/2009 0
2/9/2009 0 3/18/2009 0
2/10/2009 0 3/19/2009 0
2/11/2009 0 3/20/2009 0
2/12/2009 0 3/21/2009 0
2/13/2009 0 3/22/2009 0
2/14/2009 0 3/23/2009 0.21
2/15/2009 0 3/24/2009 0
2/16/2009 0 3/25/2009 0
2/17/2009 0 3/26/2009 0
2/18/2009 0 3/27/2009 0
2/19/2009 0 3/28/2009 0
2/20/2009 0 3/29/2009 0
2/21/2009 0 3/30/2009 0.53
2/22/2009 0 3/31/2009 0.00
2/23/2009 0 4/1/2009 0
2/24/2009 0 4/2/2009 0
2/25/2009 0 4/3/2009 0.01
2/26/2009 0 4/4/2009 0
2/27/2009 0 4/5/2009 0
2/28/2009 0 4/6/2009 0.12
3/1/2009 0 4/7/2009 0
3/2/2009 0 4/8/2009 0
3/3/2009 0 4/9/2009 0
3/4/2009 0 4/10/2009 0
3/5/2009 0 4/11/2009 0
3/6/2009 0 4/12/2009 0
3/7/2009 0 4/13/2009 0
3/8/2009 0 4/14/2009 1.43
3/9/2009 0 4/15/2009 0
- 16 -
Table 4. Daily withdrawal rates during the Blue Sink test, March 2 through April 1, 2009.
Average Flow
Man 1 Man 2 Man 1 Man 2 Flow Difference
Date/Time ft ft gpm gpm gpm percentage
3/2/2009 9:05 4.253 4.216 1455 1449 1452 0%
3/3/2009 9:00 4.128 4.108 1434 1430 1432 0%
3/4/2009 9:00 4.052 4.034 1421 1417 1419 0%
3/5/2009 9:00 4.264 4.201 1457 1446 1452 1%
3/6/2009 9:00 4.126 4.1 1433 1429 1431 0%
3/7/2009 9:00 4.257 4.227 1456 1451 1453 0%
3/8/2009 9:00 4.164 4.129 1440 1434 1437 0%
3/9/2009 9:00 4.061 4.045 1422 1419 1421 0%
3/10/2009 9:00 4.114 4.072 1431 1424 1428 1%
3/11/2009 9:00 4.158 4.136 1439 1435 1437 0%
3/12/2009 9:00 4.453 4.412 1489 1482 1486 0%
3/13/2009 9:00 4.315 4.292 1466 1462 1464 0%
3/14/2009 9:00 4.197 4.187 1446 1444 1445 0%
3/15/2009 9:00 4.059 4.054 1422 1421 1421 0%
3/16/2009 9:00 4.167 4.2 1441 1446 1443 0%
3/17/2009 9:00 4.064 4.103 1423 1429 1426 0%
3/18/2009 9:00 4.039 4.059 1418 1422 1420 0%
3/19/2009 9:00 4.025 4.047 1416 1420 1418 0%
3/20/2009 9:00 4.286 4.264 1461 1457 1459 0%
3/21/2009 9:00 4.424 4.434 1484 1486 1485 0%
3/22/2009 9:00 4.326 4.289 1468 1461 1465 0%
3/23/2009 9:00 4.187 4.141 1444 1436 1440 1%
3/24/2009 9:00 3.666 3.641 1351 1347 1349 0%
3/25/2009 9:00 4.083 4.028 1426 1416 1421 1%
3/26/2009 9:00 5.137 5.133 1599 1599 1599 0%
3/27/2009 9:00 4.069 4.037 1424 1418 1421 0%
3/28/2009 9:00 3.901 3.889 1394 1392 1393 0%
3/29/2009 9:00 3.945 3.898 1402 1393 1397 1%
3/30/2009 9:00 3.777 3.717 1371 1361 1366 1%
3/31/2009 9:00 3.773 3.778 1371 1372 1371 0%
4/1/2009 9:00 3.776 3.744 1371 1365 1368 0% Note: Man = Manometer gpm = gallons per minute
- 17 -
0
0.25
0.5
0.75
1
1.25
1.5
2/14/09 2/21/09 2/28/09 3/7/09 3/14/09 3/21/09 3/28/09 4/4/09 4/11/09 4/18/09
Rain
fall
(in
ch
es)
Date
Pumping Started Pumping Ended
Figure 6. Rainfall recorded at the Marjory Road site from February 14 to April 20, 2009.
0
200
400
600
800
1000
1200
1400
1600
1800
2000
03/02/09 03/09/09 03/16/09 03/23/09 03/30/09
Flo
w R
ate
(g
allo
n s
pe
r m
inu
te)
Date Figure 7. Discharge rate from Blue Sink (15-minute interval).
- 18 -
The City of Tampa reported that they pumped 38.876 million gallons of water from the F100-C storm water pond to the Hillsborough River from 9:00 a.m. March 2, 2009 to 9:00 a.m. on April 1, 2009. The difference between water pumped from the F100-C pond versus water pumped into the pond was about 22 million gallons. Most of this water increased storage within F100-C as its stage was unusually low at the start of the test due to the prolonged drought conditions experienced during early 2009. The City of Tampa maintained the pond elevation at a maximum of 22.0 ft NGVD to eliminate the possibility of water pumped from Blue Sink flowing back into the sink. Recorded rainfall during the pump test totaled 0.74 inches. No runoff occurred from Curiosity Creek into Blue Sink or F100-C during the 30-day pumping test.
5.3 Pumping Test Drawdown
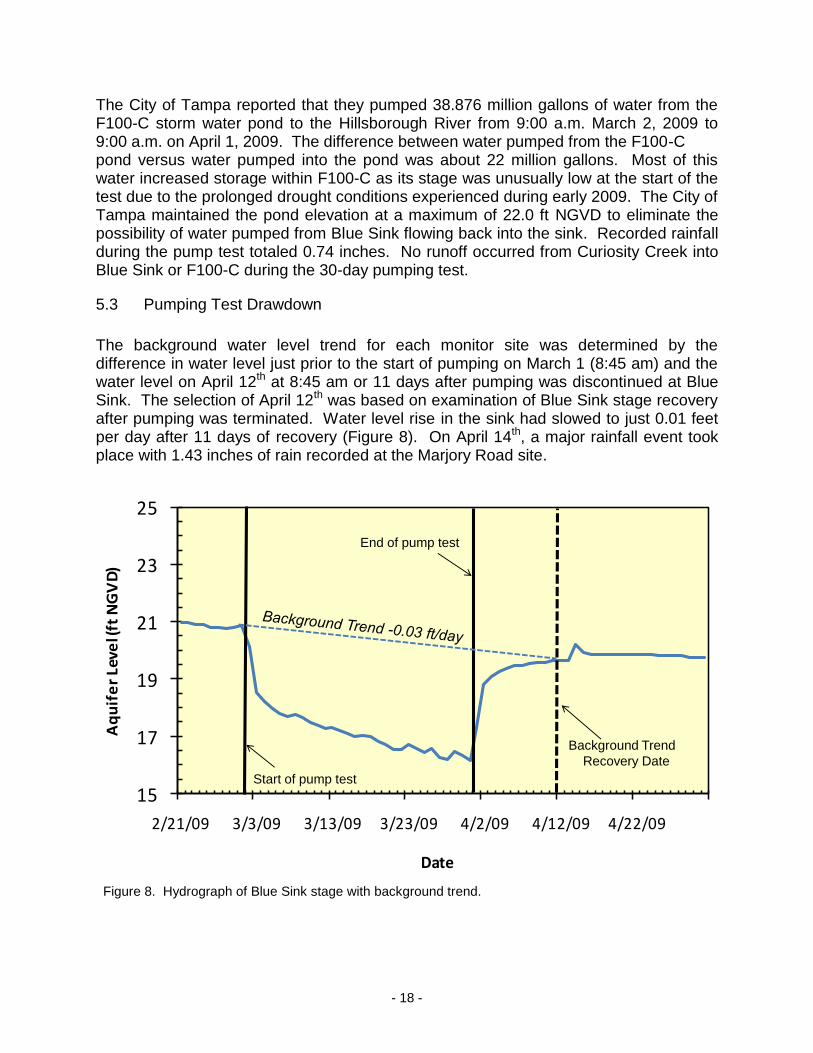
The background water level trend for each monitor site was determined by the difference in water level just prior to the start of pumping on March 1 (8:45 am) and the water level on April 12th at 8:45 am or 11 days after pumping was discontinued at Blue Sink. The selection of April 12th was based on examination of Blue Sink stage recovery after pumping was terminated. Water level rise in the sink had slowed to just 0.01 feet per day after 11 days of recovery (Figure 8). On April 14th, a major rainfall event took place with 1.43 inches of rain recorded at the Marjory Road site.
15
17
19
21
23
25
2/21/09 3/3/09 3/13/09 3/23/09 4/2/09 4/12/09 4/22/09
Aq
uif
er
Leve
l (ft
NG
VD
)
Date
Background Trend
Recovery Date
Start of pump test
End of pump test
Figure 8. Hydrograph of Blue Sink stage with background trend.
- 19 -
Drawdown from the pumping test was calculated for each lake, well, Blue Sink, and Ewanowski Spring by subtracting out the background change from the measured change in water levels from March 2 to April 1, 2009 (Table 1).
5.3.1 Sink and Spring Drawdown
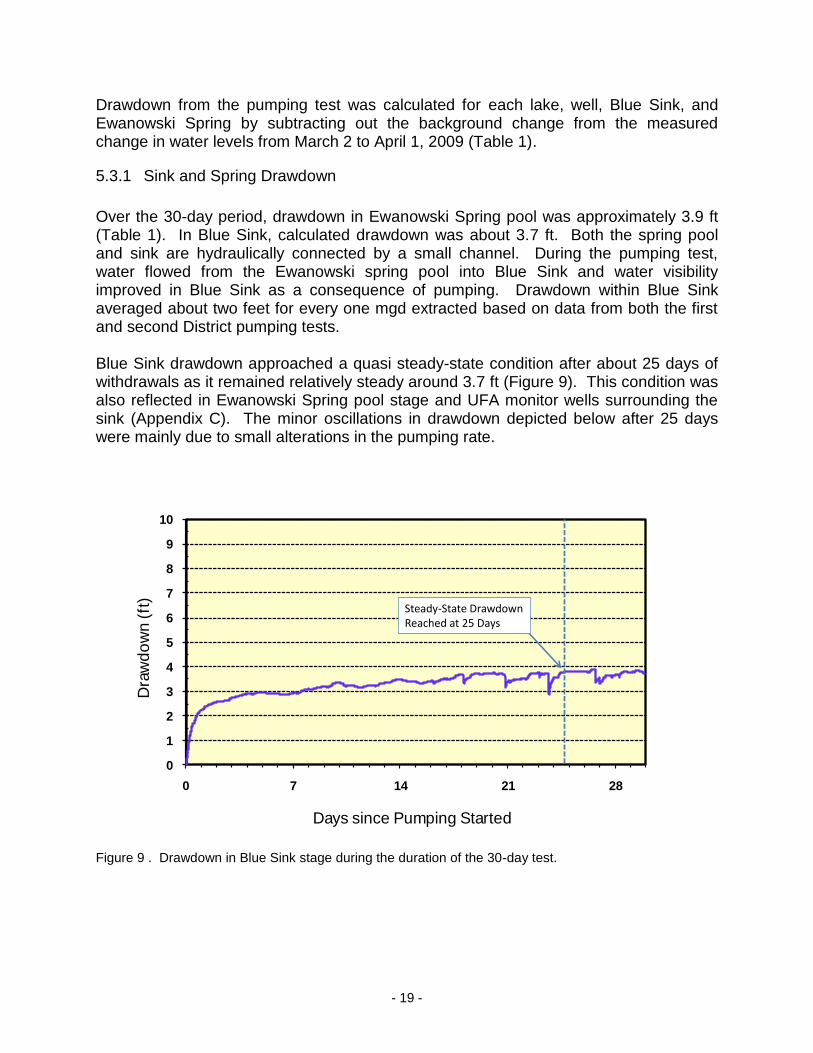
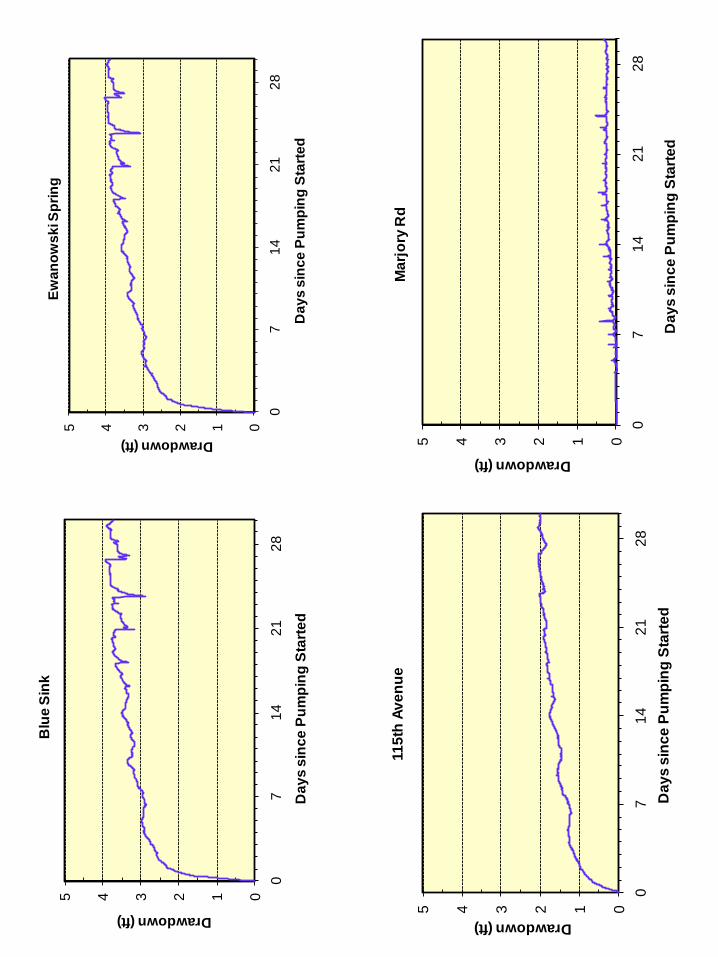
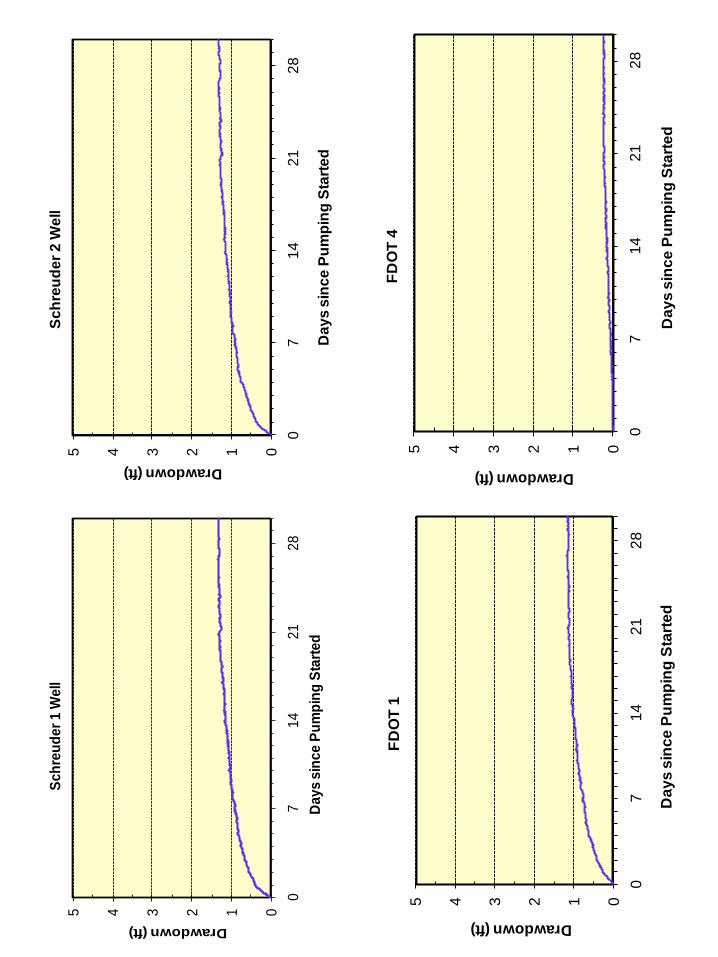
Over the 30-day period, drawdown in Ewanowski Spring pool was approximately 3.9 ft (Table 1). In Blue Sink, calculated drawdown was about 3.7 ft. Both the spring pool and sink are hydraulically connected by a small channel. During the pumping test, water flowed from the Ewanowski spring pool into Blue Sink and water visibility improved in Blue Sink as a consequence of pumping. Drawdown within Blue Sink averaged about two feet for every one mgd extracted based on data from both the first and second District pumping tests. Blue Sink drawdown approached a quasi steady-state condition after about 25 days of withdrawals as it remained relatively steady around 3.7 ft (Figure 9). This condition was also reflected in Ewanowski Spring pool stage and UFA monitor wells surrounding the sink (Appendix C). The minor oscillations in drawdown depicted below after 25 days were mainly due to small alterations in the pumping rate.
0
1
2
3
4
5
6
7
8
9
10
0 7 14 21 28
Dra
wd
ow
n (
ft)
Days since Pumping Started
Steady-State DrawdownReached at 25 Days
Figure 9 . Drawdown in Blue Sink stage during the duration of the 30-day test.
- 20 -
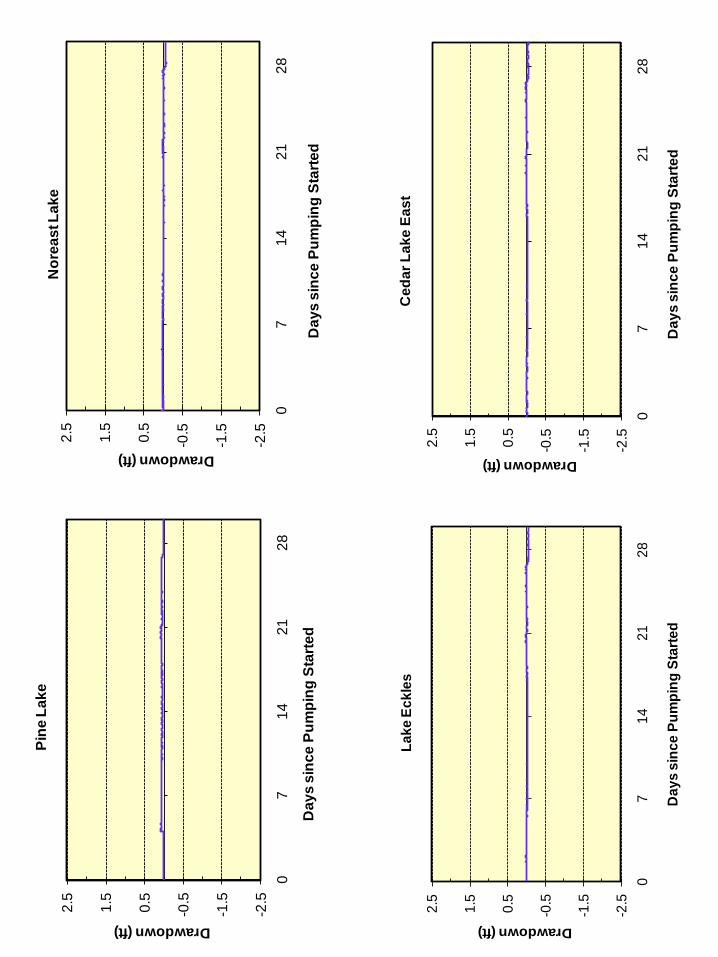
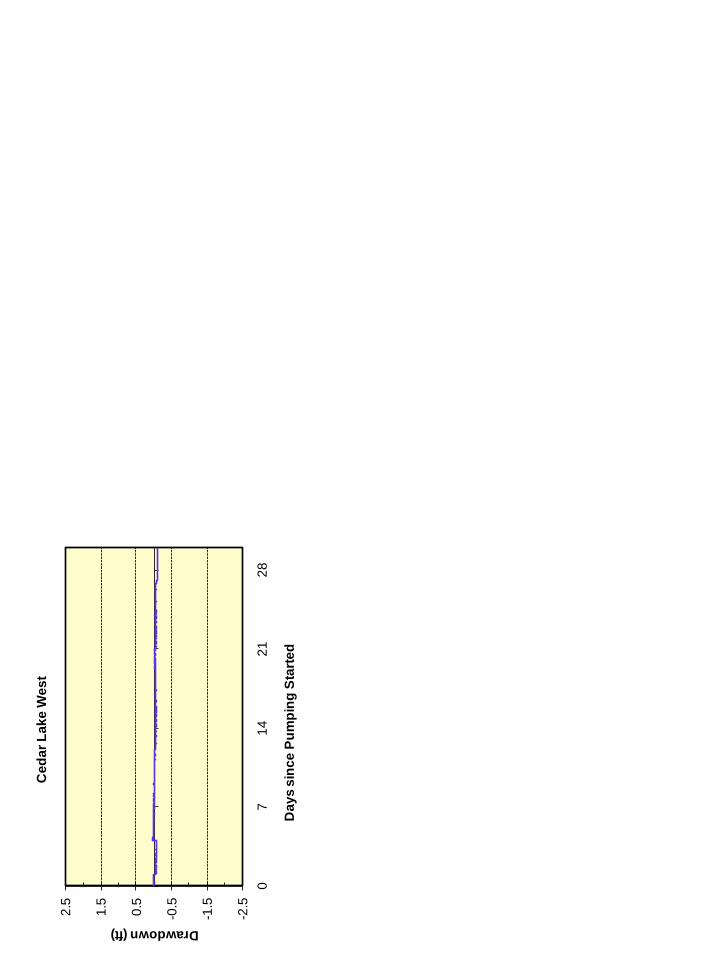
5.3.2 Lake Drawdown
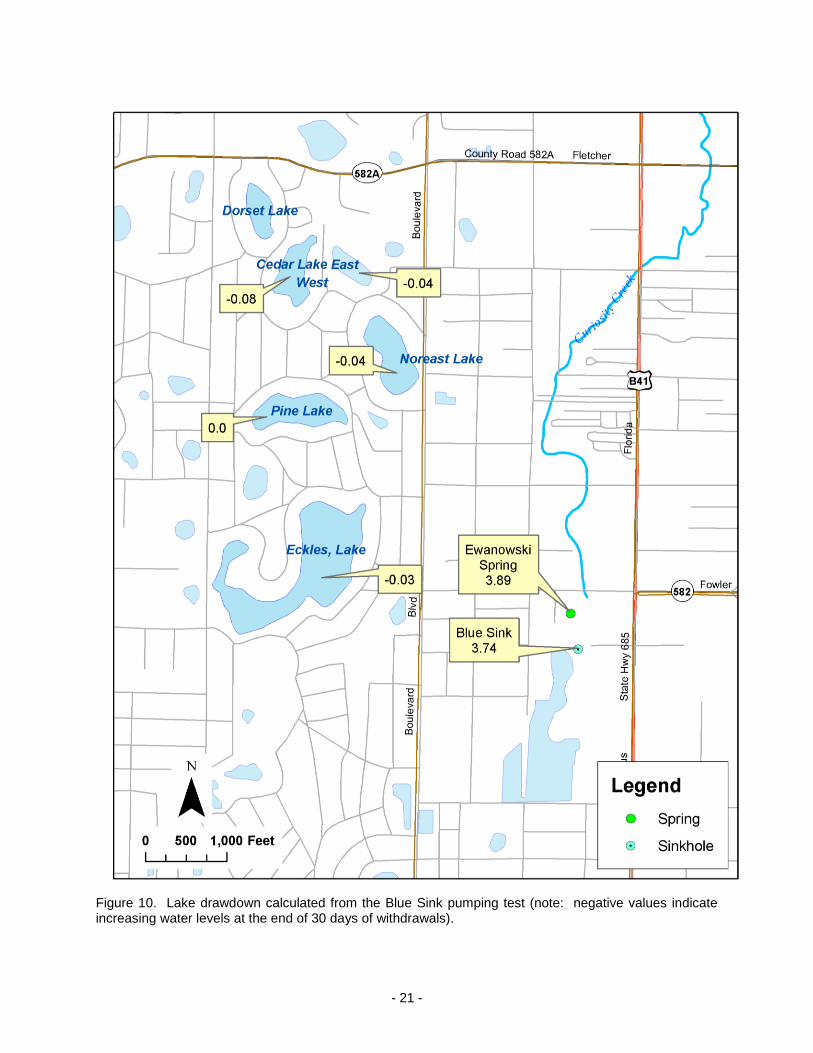
Lake drawdown was calculated for five (5) lakes in the Blue Sink area including Lake Eckles, Pine Lake, Noreast Lake, Cedar Lake West, and Cedar Lake East (Figure 10). All of the lakes are clustered within 1.5 miles northwest of Blue Sink. The closest lake to Blue Sink is Lake Eckles, located approximately 4,000 ft to the northwest of Blue Sink. Drawdown calculated at Lake Eckles showed a slight increase of 0.03 ft after the 30 days of withdrawals (Table 1). Water levels also slightly increased at Noreast Lake, Cedar Lake East and Cedar Lake West. Drawdown calculated for Pine Lake was 0.0 ft. In summary, none of the lakes monitored during the Blue Sink pumping test were significantly impacted by withdrawals from Blue Sink (Appendix C).
5.3.3 Upper Floridan Aquifer Drawdown
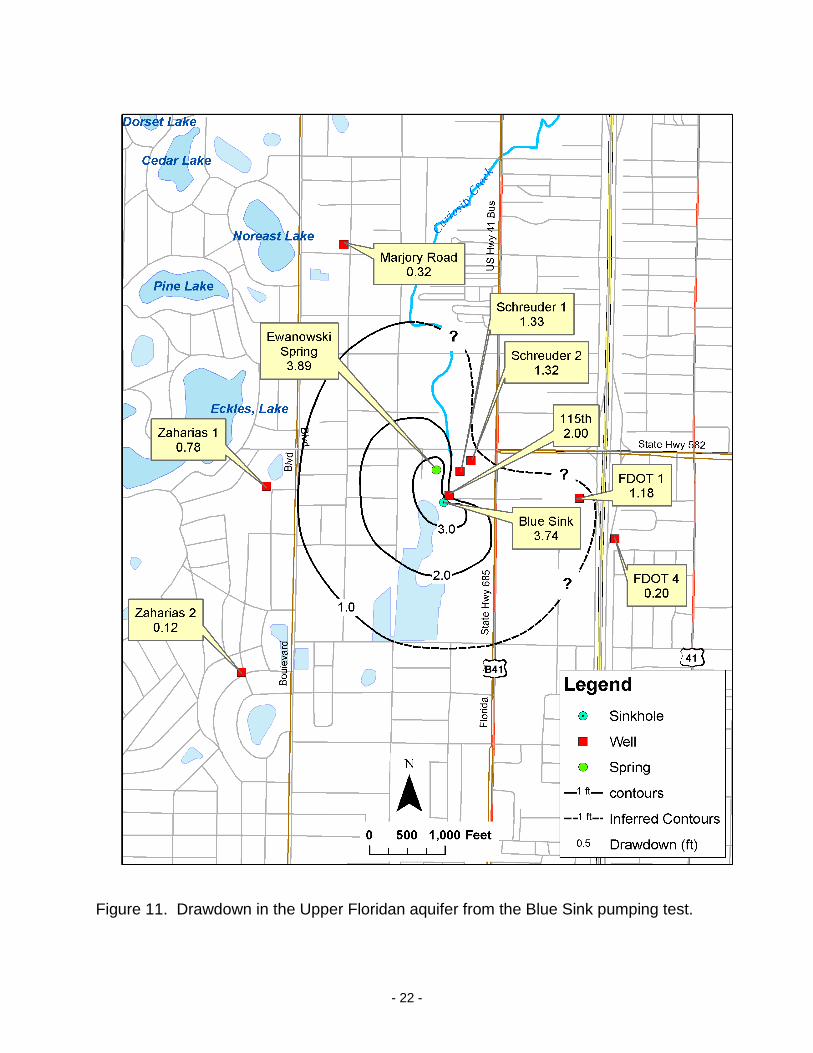
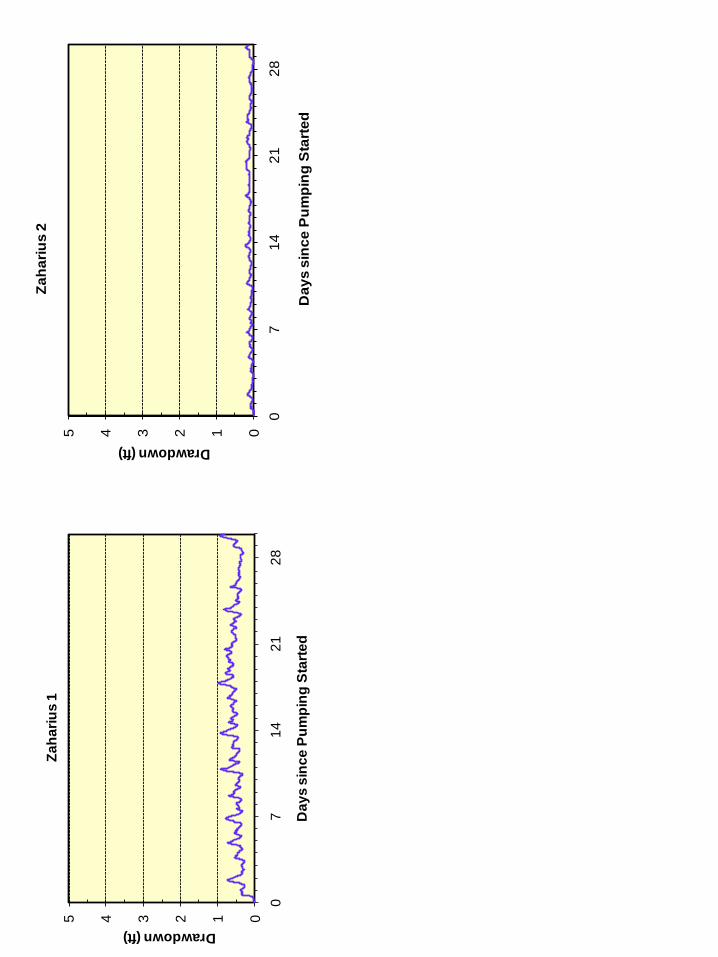
Drawdown in the UFA was calculated at eight monitor wells and ranged from two (2) ft at 110 ft away from Blue Sink to 0.32 ft at approximately 3,800 ft from the sink (Table 1). Based on the results of this test, one foot of drawdown within the UFA extends out about 2,000 ft from the sink except toward the northeast where it is closer to 800 ft (Figure 11). The distance to two feet of drawdown in the UFA was about 1,100 ft except decreasing to 110 ft to the northeast of the sink. The drawdown pattern around Blue Sink appears to be mostly symmetrical except to the northeast. This suggests anisotropic conditions where permeability within the UFA may be higher northeast of the sink. Additional monitor wells in close proximity to the sink, however, would be needed to more fully test this hypothesis.
5.4 Water Level Elevations
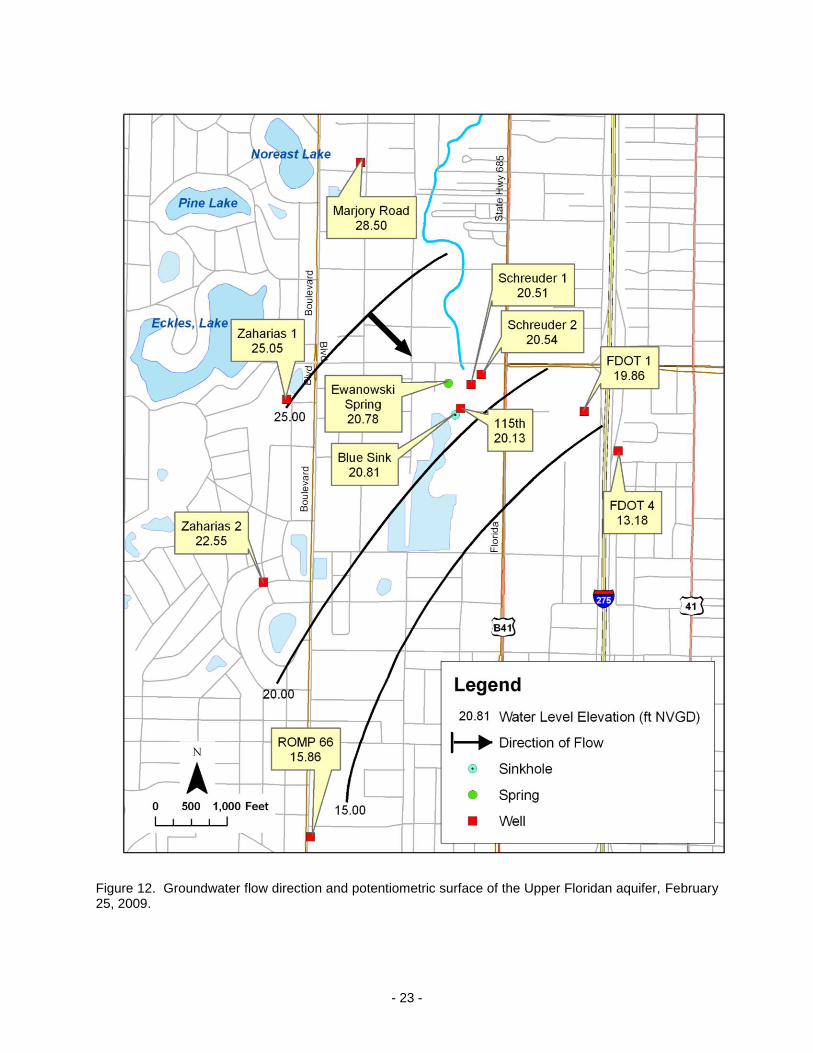
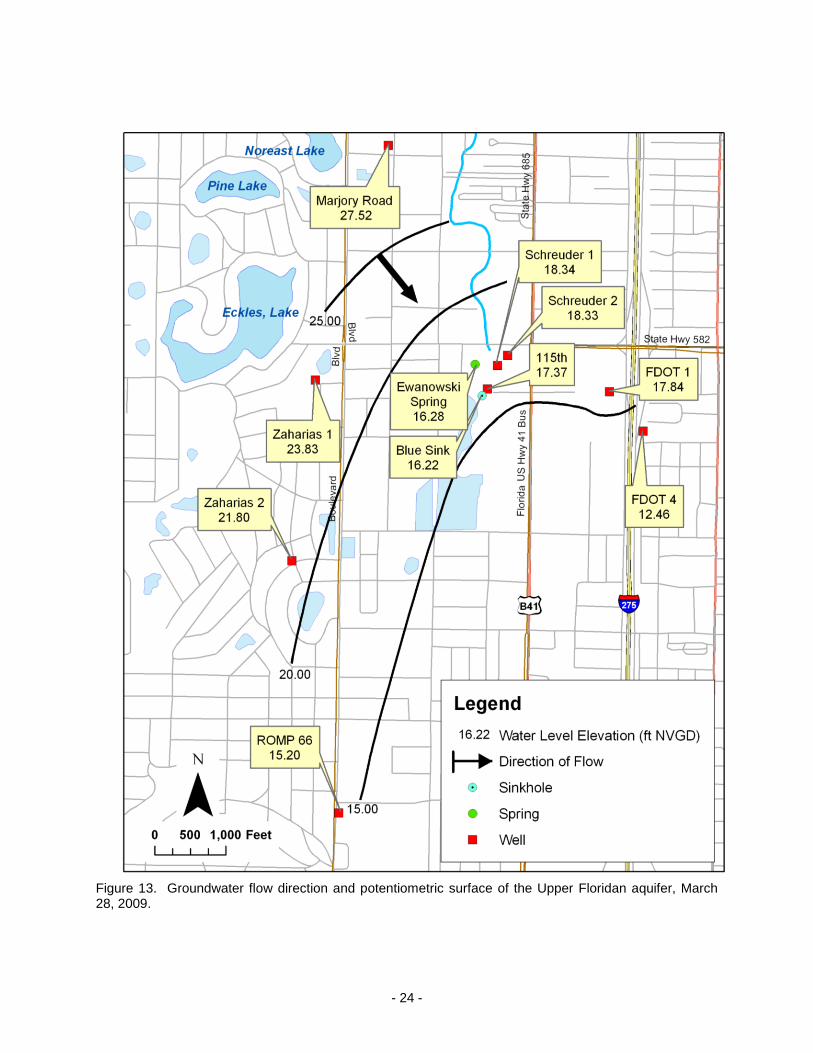
Water level elevations were determined at each well location to map the potentiometric surface and groundwater flow direction in the area. The elevations were calculated by subtracting the measured depth to water in each well from the surveyed top of casing measurement at each well. Groundwater flow maps for February 25, 2009 and March 28, 2009 are presented in Figures 12 and 13, respectively. The direction of groundwater flow during both time periods was toward the southeast.
5.5 Upper Floridan Aquifer - Estimation of Hydraulic Parameters
The pumping test was designed primarily to: 1) determine the sustainable yield of Blue Sink; and 2) establish if any adverse impacts to nearby lakes or aquifer levels would occur due to withdrawals. However, an estimate of transmissivity and storage coefficient within the UFA can be determined based on the drawdown from wells at different radial distances from Blue Sink over the same period of time. This type of
- 21 -
Figure 10. Lake drawdown calculated from the Blue Sink pumping test (note: negative values indicate increasing water levels at the end of 30 days of withdrawals).
- 22 -
Figure 11. Drawdown in the Upper Floridan aquifer from the Blue Sink pumping test.
- 23 -
Figure 12. Groundwater flow direction and potentiometric surface of the Upper Floridan aquifer, February 25, 2009.
- 24 -
Figure 13. Groundwater flow direction and potentiometric surface of the Upper Floridan aquifer, March 28, 2009.
- 25 -
analysis, termed the distance-drawdown method, is based upon the Theis equation (Fetter, 2001). Additionally, transmissivity and storage coefficient can also be determined based on straight-line plots of drawdown versus time and aquifer level recovery. This analysis is called the Cooper-Jacob straight line method (Fetter, 2001). Both above-mentioned methods of estimating hydraulic parameters were used to approximate transmissivity and storage coefficient for the UFA within the Blue Sink area. For the Cooper-Jacob straight line method, four wells (Schreuder 1, Schreuder 2, 115th Ave, and FDOT 1) were selected for analysis due to their close proximity to Blue Sink.
5.5.1 Distance Drawdown Method
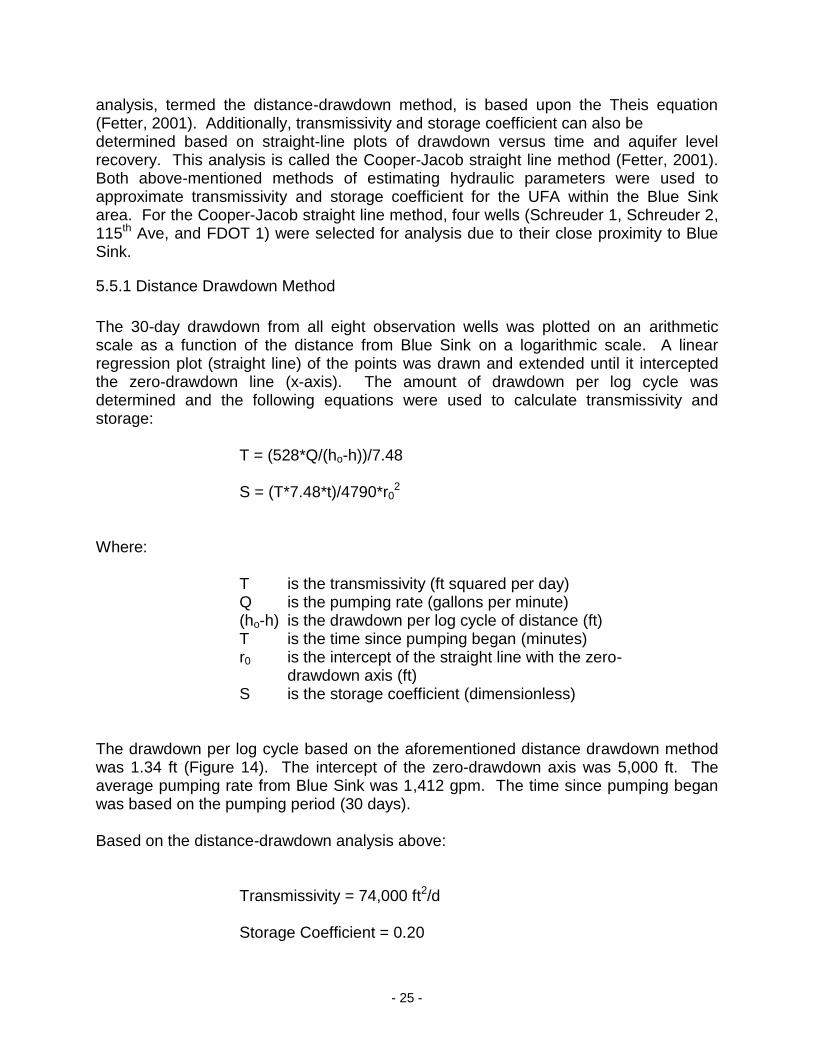
The 30-day drawdown from all eight observation wells was plotted on an arithmetic scale as a function of the distance from Blue Sink on a logarithmic scale. A linear regression plot (straight line) of the points was drawn and extended until it intercepted the zero-drawdown line (x-axis). The amount of drawdown per log cycle was determined and the following equations were used to calculate transmissivity and storage: T = (528*Q/(ho-h))/7.48 S = (T*7.48*t)/4790*r0
2
Where: T is the transmissivity (ft squared per day) Q is the pumping rate (gallons per minute) (ho-h) is the drawdown per log cycle of distance (ft) T is the time since pumping began (minutes) r0 is the intercept of the straight line with the zero- drawdown axis (ft) S is the storage coefficient (dimensionless) The drawdown per log cycle based on the aforementioned distance drawdown method was 1.34 ft (Figure 14). The intercept of the zero-drawdown axis was 5,000 ft. The average pumping rate from Blue Sink was 1,412 gpm. The time since pumping began was based on the pumping period (30 days). Based on the distance-drawdown analysis above: Transmissivity = 74,000 ft2/d Storage Coefficient = 0.20
- 26 -
0
1
2
3
4
1 10 100 1000 10000 100000
Dra
wd
ow
n (ft
)
Distance from Blue Sink (ft)
Drawdown per Log Cycle = 1.34 ft.
Zero Drawdown Intercept = 5,000 min.
Figure 14. Distance-drawdown plot from the Blue Sink pumping test.
The transmissivity value of 74,000 ft2/d is slightly higher than the results of 63,000 ft2/d determined from a 24-hour aquifer test performed on an 80-foot temporary well installed near well FDOT-2 (Schreuder, 2001). Additionally, this transmissivity result is also slightly higher than 66,000 ft2/d from first Blue Sink test conducted by the District in May 2008.
5.5.2 Cooper-Jacob Straight Line Method
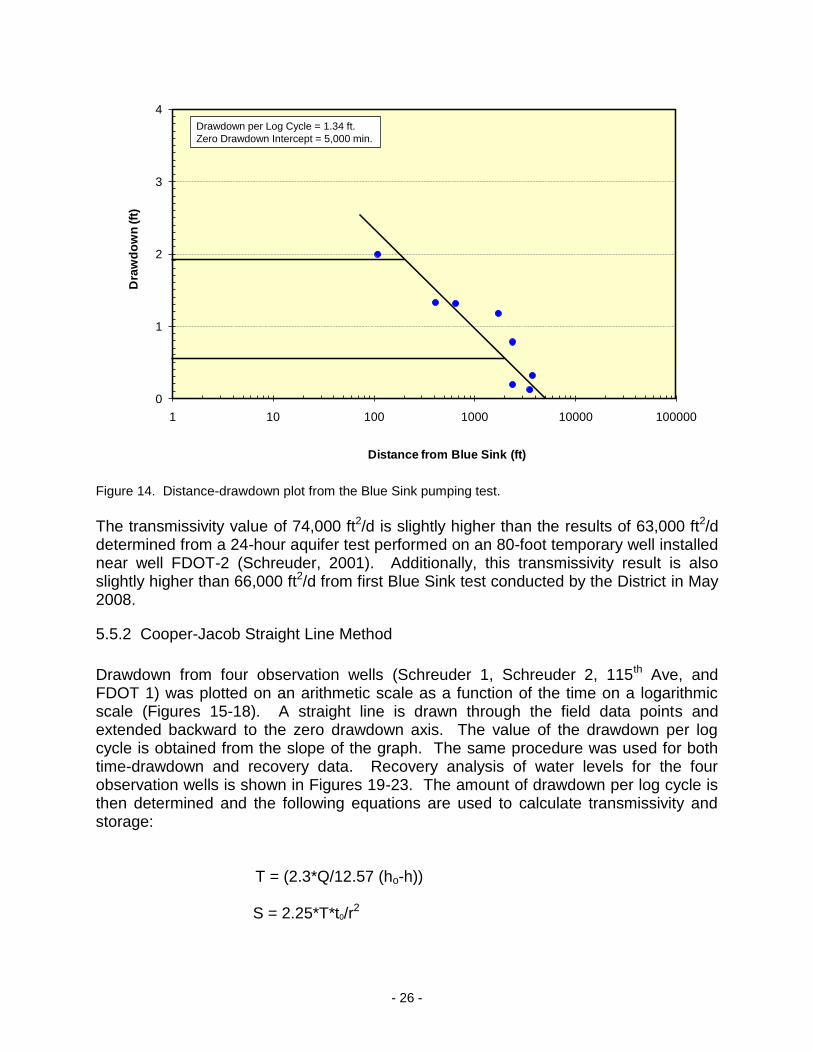
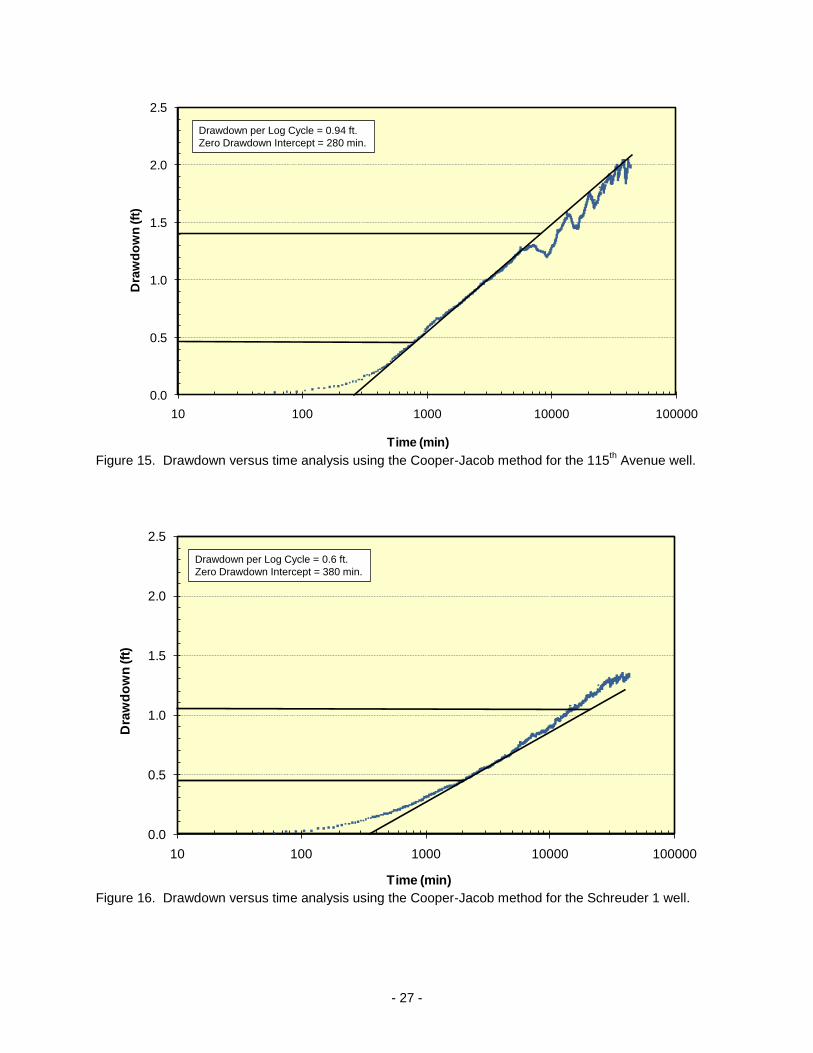
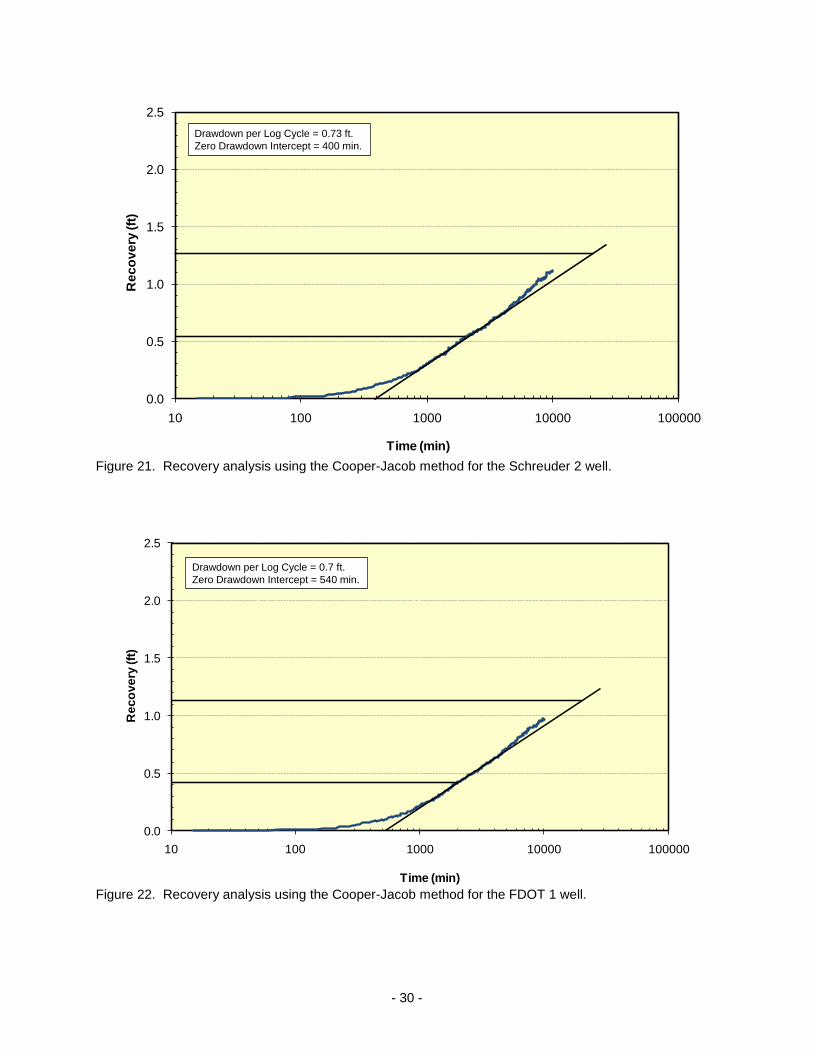
Drawdown from four observation wells (Schreuder 1, Schreuder 2, 115th Ave, and FDOT 1) was plotted on an arithmetic scale as a function of the time on a logarithmic scale (Figures 15-18). A straight line is drawn through the field data points and extended backward to the zero drawdown axis. The value of the drawdown per log cycle is obtained from the slope of the graph. The same procedure was used for both time-drawdown and recovery data. Recovery analysis of water levels for the four observation wells is shown in Figures 19-23. The amount of drawdown per log cycle is then determined and the following equations are used to calculate transmissivity and storage: T = (2.3*Q/12.57 (ho-h)) S = 2.25*T*t0/r
2
- 27 -
0.0
0.5
1.0
1.5
2.0
2.5
10 100 1000 10000 100000
Dra
wd
ow
n (ft
)
Time (min)
Drawdown per Log Cycle = 0.94 ft.
Zero Drawdown Intercept = 280 min.
Figure 15. Drawdown versus time analysis using the Cooper-Jacob method for the 115
th Avenue well.
0.0
0.5
1.0
1.5
2.0
2.5
10 100 1000 10000 100000
Dra
wd
ow
n (ft
)
Time (min)
Drawdown per Log Cycle = 0.6 ft.
Zero Drawdown Intercept = 380 min.
Figure 16. Drawdown versus time analysis using the Cooper-Jacob method for the Schreuder 1 well.
- 28 -
0.0
0.5
1.0
1.5
2.0
2.5
10 100 1000 10000 100000
Dra
wd
ow
n (ft
)
Time (min)
Drawdown per Log Cycle = 0.66 ft.
Zero Drawdown Intercept = 420 min.
Figure 17. Drawdown versus time analysis using the Cooper-Jacob method for the Schreuder 2 well.
0.0
0.5
1.0
1.5
2.0
2.5
10 100 1000 10000 100000
Dra
wd
ow
n (ft
)
Time (min)
Drawdown per Log Cycle = 0.64 ft.
Zero Drawdown Intercept = 240 min.
Figure 18. Drawdown versus time analysis using the Cooper-Jacob method for the FDOT 1 well.
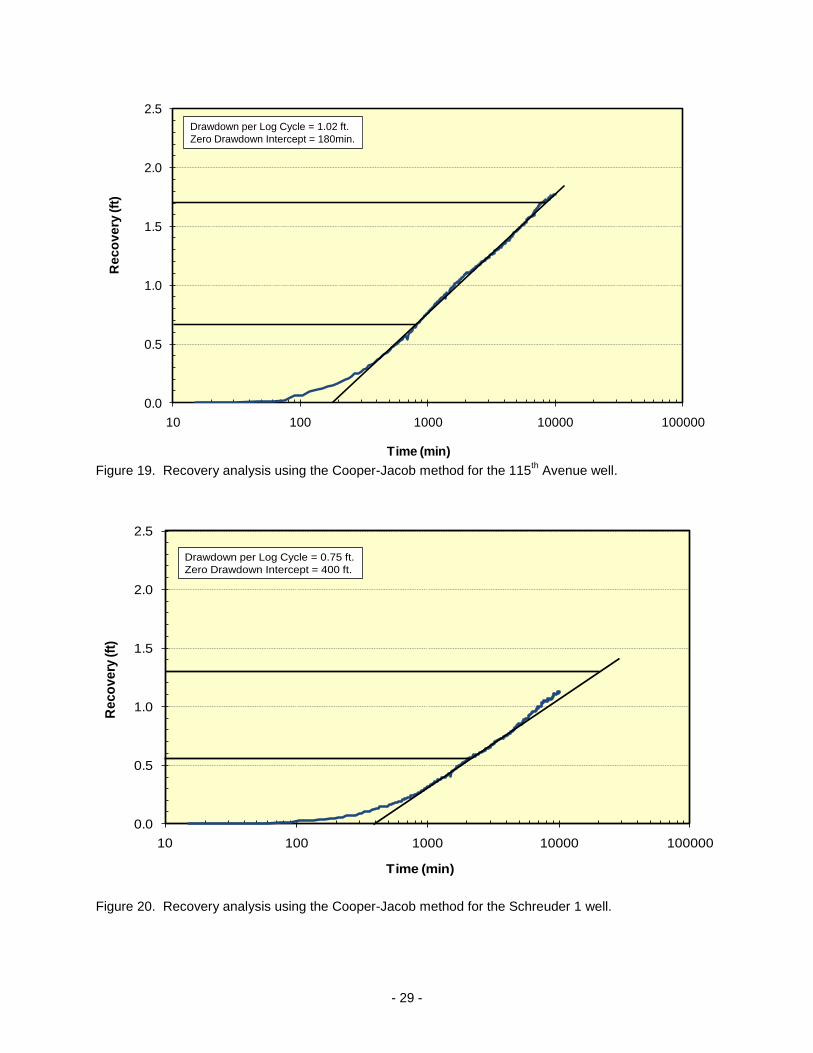
- 29 -
0.0
0.5
1.0
1.5
2.0
2.5
10 100 1000 10000 100000
Re
co
ve
ry (ft
)
Time (min)
Drawdown per Log Cycle = 1.02 ft.
Zero Drawdown Intercept = 180min.
Figure 19. Recovery analysis using the Cooper-Jacob method for the 115
th Avenue well.
0.0
0.5
1.0
1.5
2.0
2.5
10 100 1000 10000 100000
Re
co
ve
ry (f
t)
Time (min)
Drawdown per Log Cycle = 0.75 ft.
Zero Drawdown Intercept = 400 ft.
Figure 20. Recovery analysis using the Cooper-Jacob method for the Schreuder 1 well.
- 30 -
0.0
0.5
1.0
1.5
2.0
2.5
10 100 1000 10000 100000
Re
co
ve
ry (ft
)
Time (min)
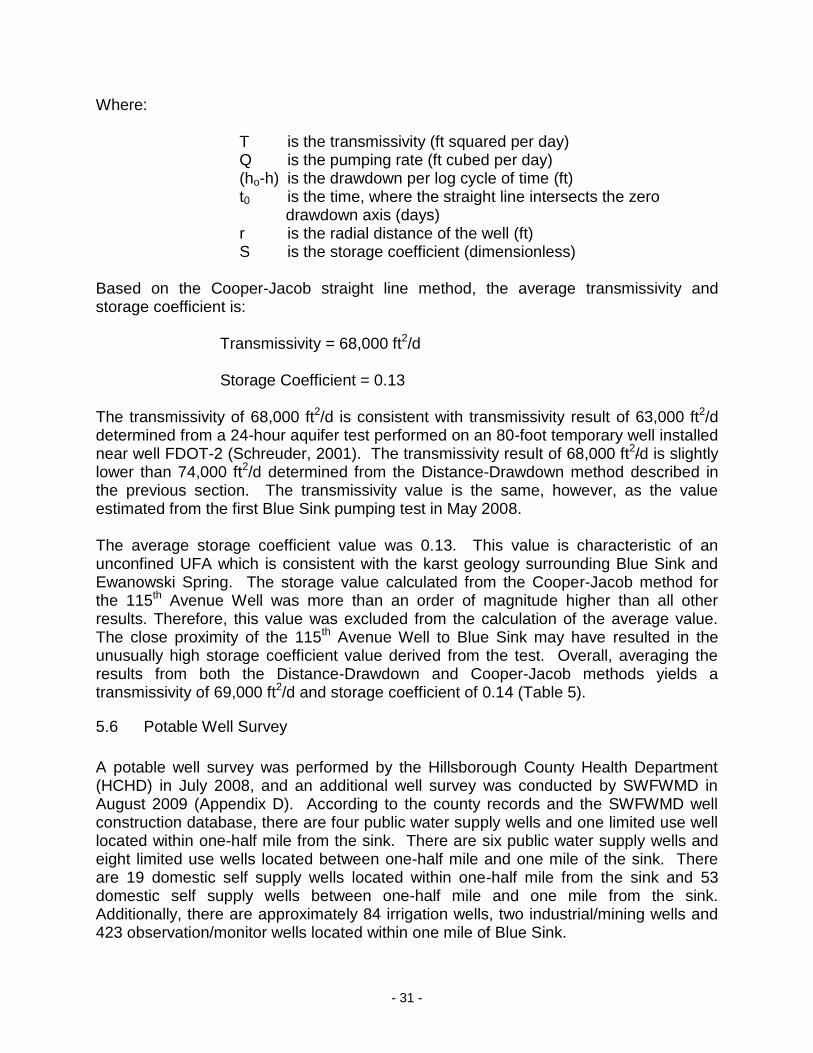
Drawdown per Log Cycle = 0.73 ft.
Zero Drawdown Intercept = 400 min.
Figure 21. Recovery analysis using the Cooper-Jacob method for the Schreuder 2 well.
0.0
0.5
1.0
1.5
2.0
2.5
10 100 1000 10000 100000
Re
co
ve
ry (ft
)
Time (min)
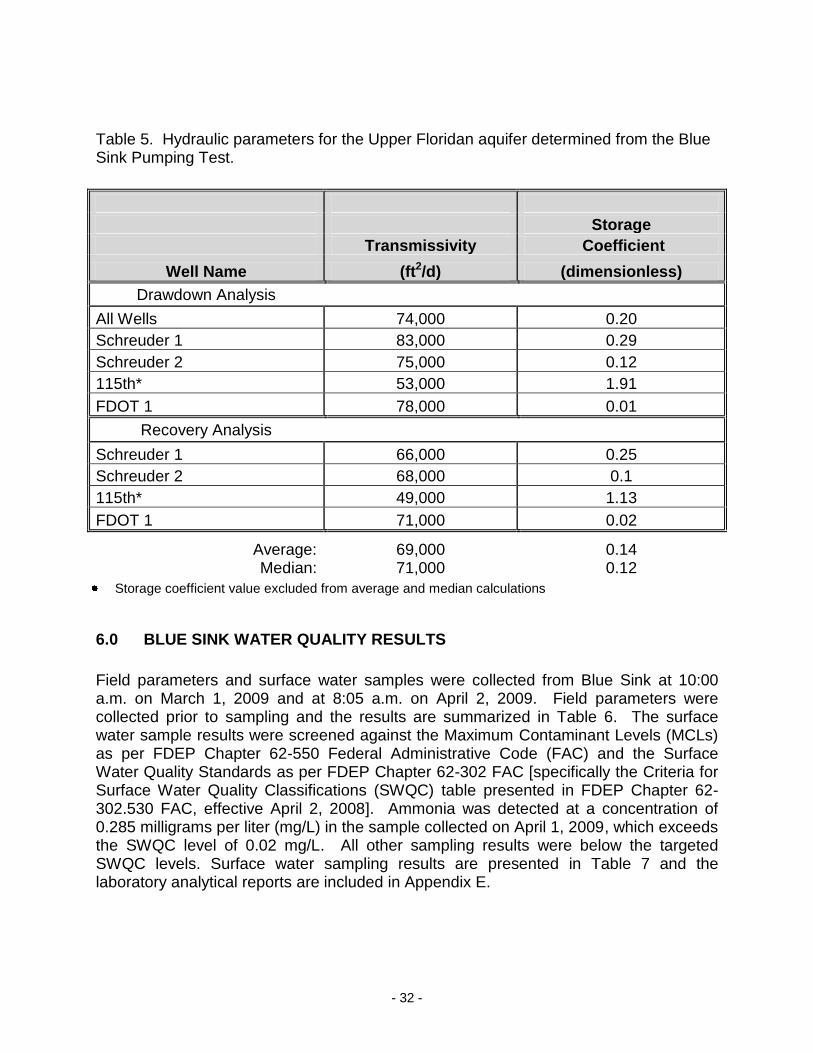
Drawdown per Log Cycle = 0.7 ft.
Zero Drawdown Intercept = 540 min.
Figure 22. Recovery analysis using the Cooper-Jacob method for the FDOT 1 well.
- 31 -
Where: T is the transmissivity (ft squared per day) Q is the pumping rate (ft cubed per day) (ho-h) is the drawdown per log cycle of time (ft) t0 is the time, where the straight line intersects the zero drawdown axis (days) r
is the radial distance of the well (ft) S is the storage coefficient (dimensionless) Based on the Cooper-Jacob straight line method, the average transmissivity and storage coefficient is: Transmissivity = 68,000 ft2/d Storage Coefficient = 0.13 The transmissivity of 68,000 ft2/d is consistent with transmissivity result of 63,000 ft2/d determined from a 24-hour aquifer test performed on an 80-foot temporary well installed near well FDOT-2 (Schreuder, 2001). The transmissivity result of 68,000 ft2/d is slightly lower than 74,000 ft2/d determined from the Distance-Drawdown method described in the previous section. The transmissivity value is the same, however, as the value estimated from the first Blue Sink pumping test in May 2008. The average storage coefficient value was 0.13. This value is characteristic of an unconfined UFA which is consistent with the karst geology surrounding Blue Sink and Ewanowski Spring. The storage value calculated from the Cooper-Jacob method for the 115th Avenue Well was more than an order of magnitude higher than all other results. Therefore, this value was excluded from the calculation of the average value. The close proximity of the 115th Avenue Well to Blue Sink may have resulted in the unusually high storage coefficient value derived from the test. Overall, averaging the results from both the Distance-Drawdown and Cooper-Jacob methods yields a transmissivity of 69,000 ft2/d and storage coefficient of 0.14 (Table 5).
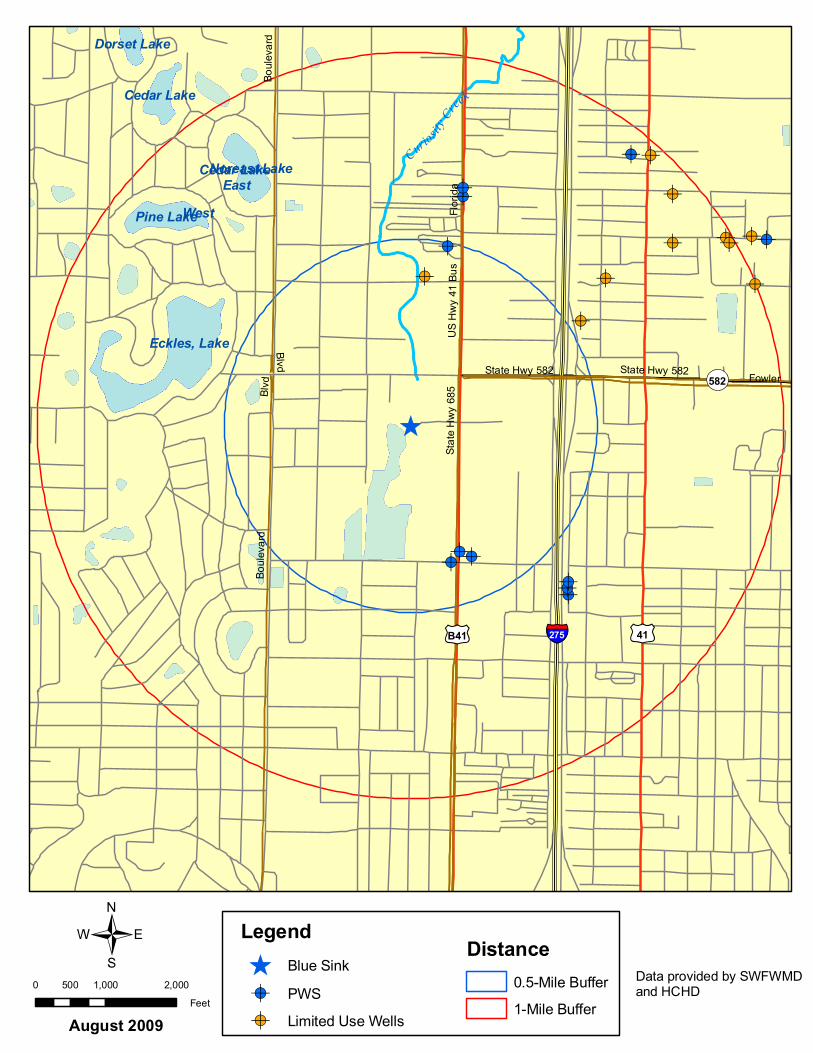
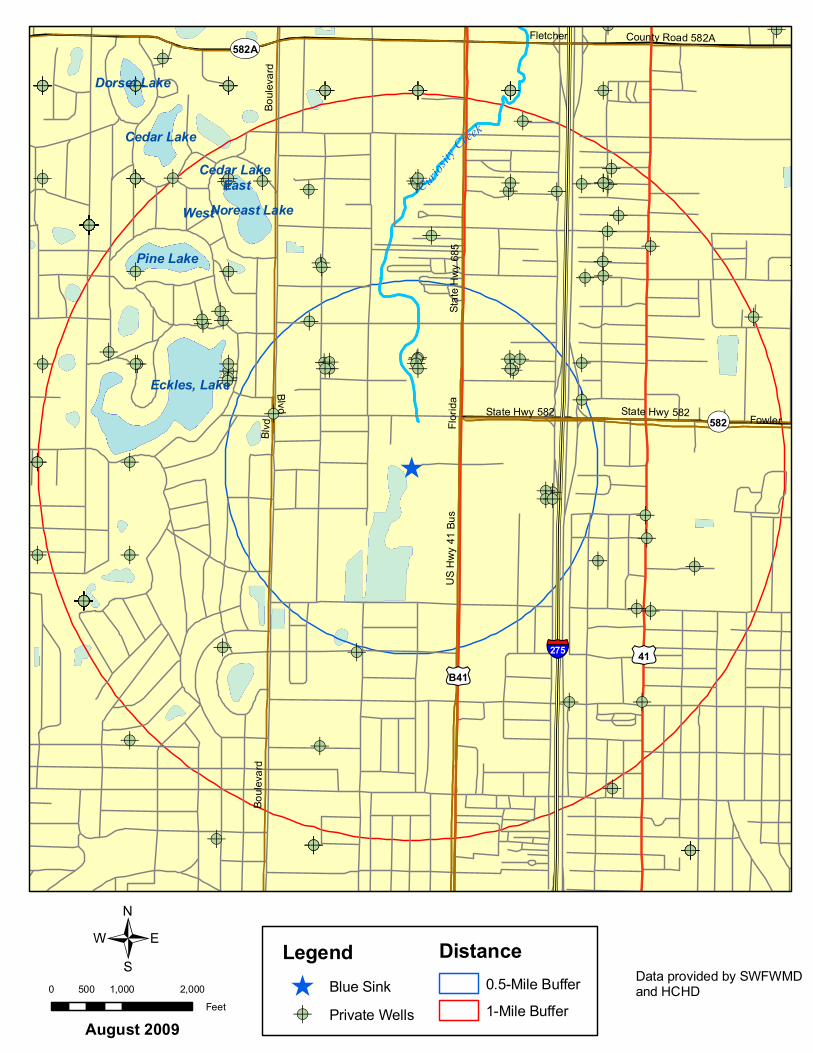
5.6 Potable Well Survey
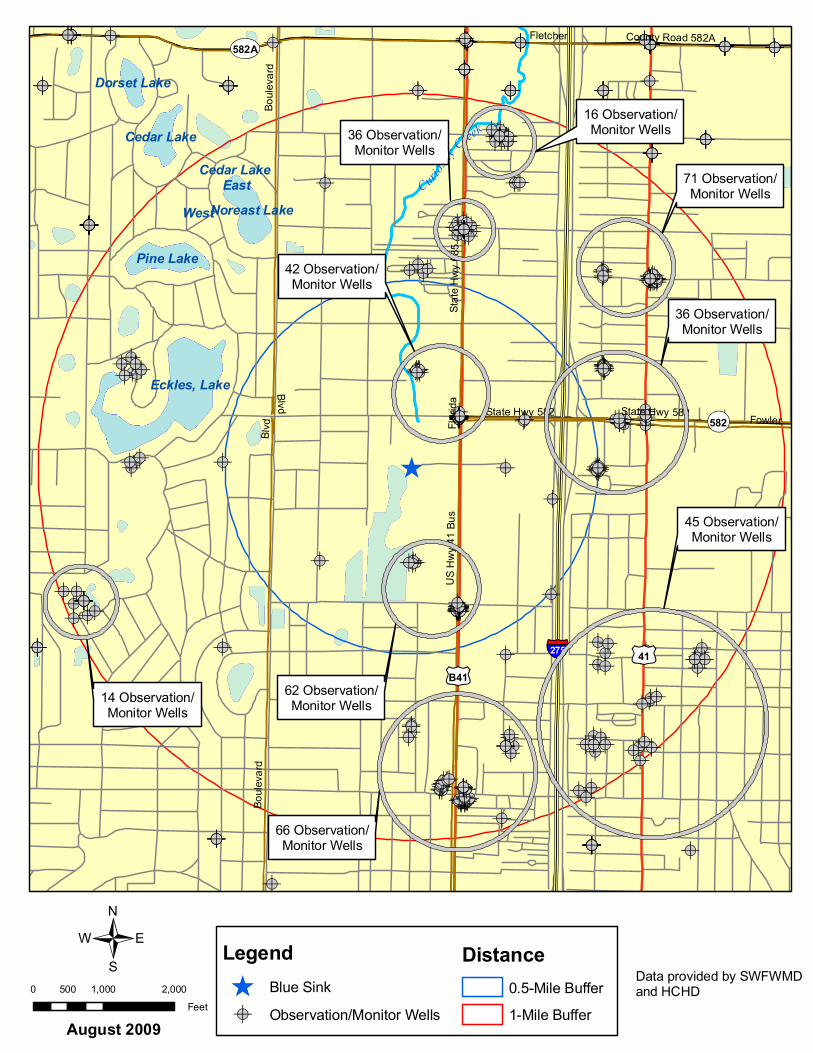
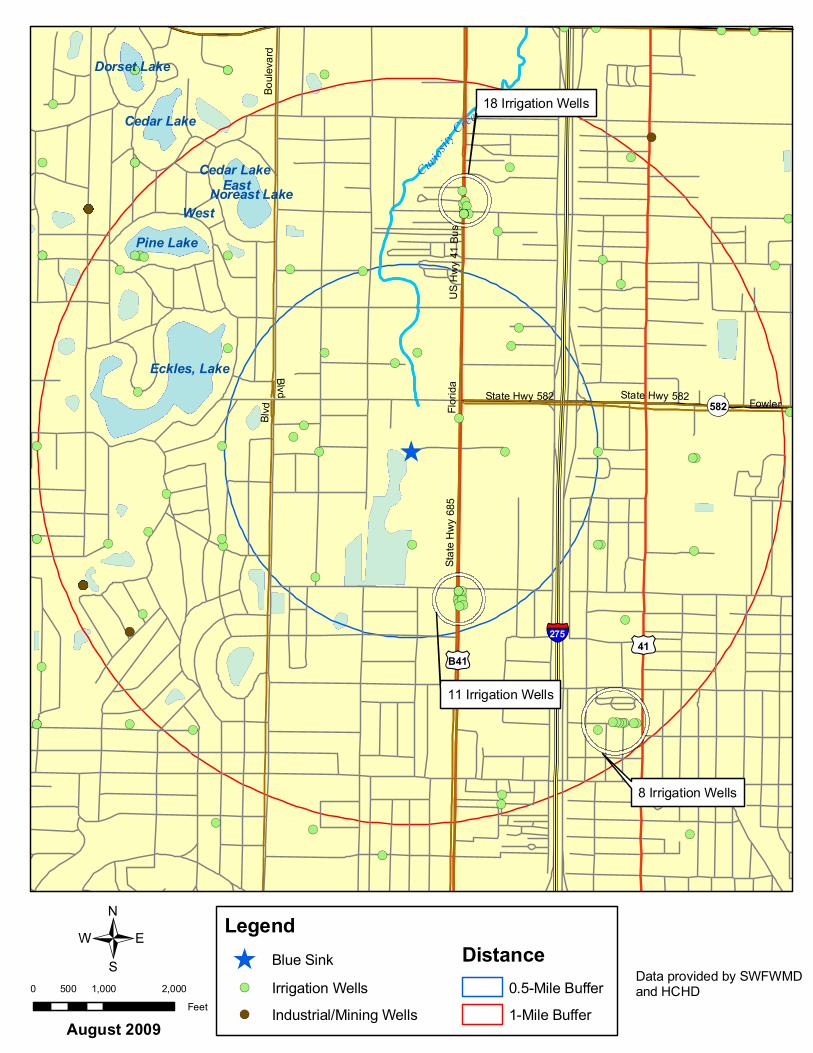
A potable well survey was performed by the Hillsborough County Health Department (HCHD) in July 2008, and an additional well survey was conducted by SWFWMD in August 2009 (Appendix D). According to the county records and the SWFWMD well construction database, there are four public water supply wells and one limited use well located within one-half mile from the sink. There are six public water supply wells and eight limited use wells located between one-half mile and one mile of the sink. There are 19 domestic self supply wells located within one-half mile from the sink and 53 domestic self supply wells between one-half mile and one mile from the sink. Additionally, there are approximately 84 irrigation wells, two industrial/mining wells and 423 observation/monitor wells located within one mile of Blue Sink.
- 32 -
Table 5. Hydraulic parameters for the Upper Floridan aquifer determined from the Blue Sink Pumping Test.
Storage
Transmissivity Coefficient
Well Name (ft2/d) (dimensionless)
Drawdown Analysis
All Wells 74,000 0.20
Schreuder 1 83,000 0.29
Schreuder 2 75,000 0.12
115th* 53,000 1.91
FDOT 1 78,000 0.01
Recovery Analysis
Schreuder 1 66,000 0.25
Schreuder 2 68,000 0.1
115th* 49,000 1.13
FDOT 1 71,000 0.02
Average: Median:
69,000 71,000
0.14 0.12
Storage coefficient value excluded from average and median calculations
6.0 BLUE SINK WATER QUALITY RESULTS
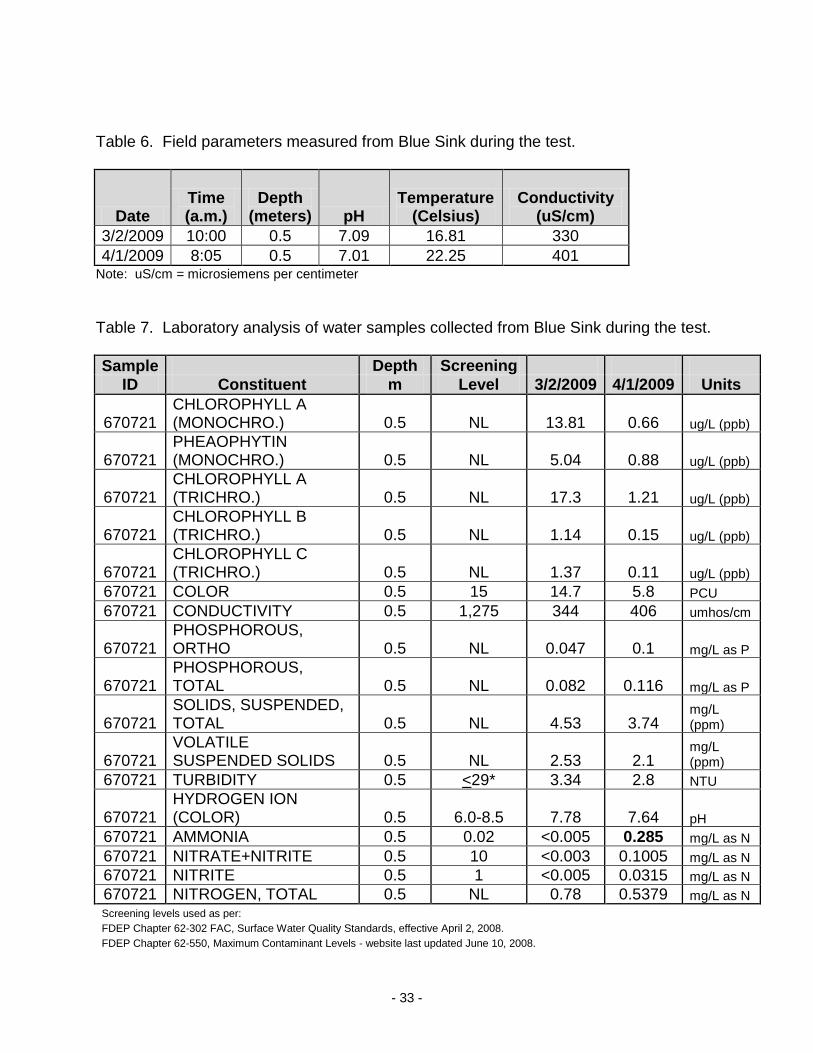
Field parameters and surface water samples were collected from Blue Sink at 10:00 a.m. on March 1, 2009 and at 8:05 a.m. on April 2, 2009. Field parameters were collected prior to sampling and the results are summarized in Table 6. The surface water sample results were screened against the Maximum Contaminant Levels (MCLs) as per FDEP Chapter 62-550 Federal Administrative Code (FAC) and the Surface Water Quality Standards as per FDEP Chapter 62-302 FAC [specifically the Criteria for Surface Water Quality Classifications (SWQC) table presented in FDEP Chapter 62-302.530 FAC, effective April 2, 2008]. Ammonia was detected at a concentration of 0.285 milligrams per liter (mg/L) in the sample collected on April 1, 2009, which exceeds the SWQC level of 0.02 mg/L. All other sampling results were below the targeted SWQC levels. Surface water sampling results are presented in Table 7 and the laboratory analytical reports are included in Appendix E.
- 33 -
Table 6. Field parameters measured from Blue Sink during the test.
Date Time (a.m.)
Depth (meters) pH
Temperature (Celsius)
Conductivity (uS/cm)
3/2/2009 10:00 0.5 7.09 16.81 330
4/1/2009 8:05 0.5 7.01 22.25 401 Note: uS/cm = microsiemens per centimeter
Table 7. Laboratory analysis of water samples collected from Blue Sink during the test.
Sample Depth Screening ID Constituent m Level 3/2/2009 4/1/2009 Units
670721 CHLOROPHYLL A (MONOCHRO.) 0.5 NL 13.81 0.66 ug/L (ppb)
670721 PHEAOPHYTIN (MONOCHRO.) 0.5 NL 5.04 0.88 ug/L (ppb)
670721 CHLOROPHYLL A (TRICHRO.) 0.5 NL 17.3 1.21 ug/L (ppb)
670721 CHLOROPHYLL B (TRICHRO.) 0.5 NL 1.14 0.15 ug/L (ppb)
670721 CHLOROPHYLL C (TRICHRO.) 0.5 NL 1.37 0.11 ug/L (ppb)
670721 COLOR 0.5 15 14.7 5.8 PCU
670721 CONDUCTIVITY 0.5 1,275 344 406 umhos/cm
670721 PHOSPHOROUS, ORTHO 0.5 NL 0.047 0.1 mg/L as P
670721 PHOSPHOROUS, TOTAL 0.5 NL 0.082 0.116 mg/L as P
670721 SOLIDS, SUSPENDED, TOTAL 0.5 NL 4.53 3.74
mg/L (ppm)
670721 VOLATILE SUSPENDED SOLIDS 0.5 NL 2.53 2.1
mg/L (ppm)
670721 TURBIDITY 0.5 <29* 3.34 2.8 NTU
670721 HYDROGEN ION (COLOR) 0.5 6.0-8.5 7.78 7.64 pH
670721 AMMONIA 0.5 0.02 <0.005 0.285 mg/L as N
670721 NITRATE+NITRITE 0.5 10 <0.003 0.1005 mg/L as N
670721 NITRITE 0.5 1 <0.005 0.0315 mg/L as N
670721 NITROGEN, TOTAL 0.5 NL 0.78 0.5379 mg/L as N
Screening levels used as per: FDEP Chapter 62-302 FAC, Surface Water Quality Standards, effective April 2, 2008.
FDEP Chapter 62-550, Maximum Contaminant Levels - website last updated June 10, 2008.
- 34 -
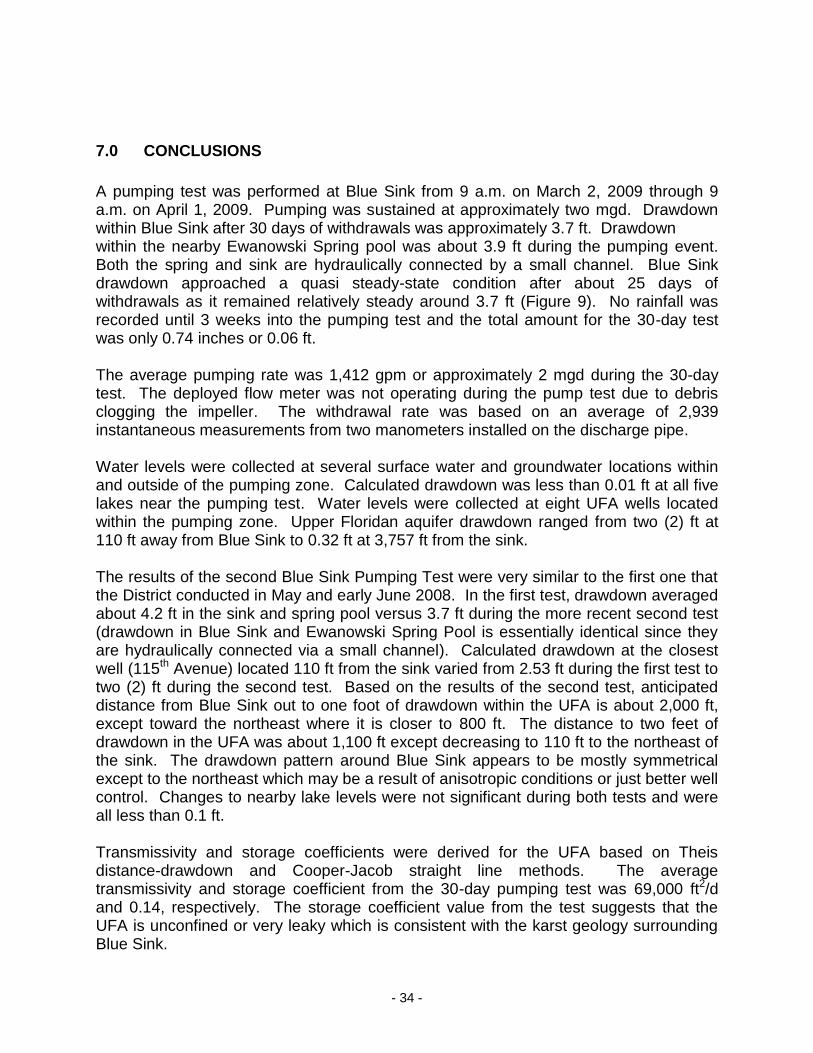
7.0 CONCLUSIONS
A pumping test was performed at Blue Sink from 9 a.m. on March 2, 2009 through 9 a.m. on April 1, 2009. Pumping was sustained at approximately two mgd. Drawdown within Blue Sink after 30 days of withdrawals was approximately 3.7 ft. Drawdown within the nearby Ewanowski Spring pool was about 3.9 ft during the pumping event. Both the spring and sink are hydraulically connected by a small channel. Blue Sink drawdown approached a quasi steady-state condition after about 25 days of withdrawals as it remained relatively steady around 3.7 ft (Figure 9). No rainfall was recorded until 3 weeks into the pumping test and the total amount for the 30-day test was only 0.74 inches or 0.06 ft. The average pumping rate was 1,412 gpm or approximately 2 mgd during the 30-day test. The deployed flow meter was not operating during the pump test due to debris clogging the impeller. The withdrawal rate was based on an average of 2,939 instantaneous measurements from two manometers installed on the discharge pipe. Water levels were collected at several surface water and groundwater locations within and outside of the pumping zone. Calculated drawdown was less than 0.01 ft at all five lakes near the pumping test. Water levels were collected at eight UFA wells located within the pumping zone. Upper Floridan aquifer drawdown ranged from two (2) ft at 110 ft away from Blue Sink to 0.32 ft at 3,757 ft from the sink. The results of the second Blue Sink Pumping Test were very similar to the first one that the District conducted in May and early June 2008. In the first test, drawdown averaged about 4.2 ft in the sink and spring pool versus 3.7 ft during the more recent second test (drawdown in Blue Sink and Ewanowski Spring Pool is essentially identical since they are hydraulically connected via a small channel). Calculated drawdown at the closest well (115th Avenue) located 110 ft from the sink varied from 2.53 ft during the first test to two (2) ft during the second test. Based on the results of the second test, anticipated distance from Blue Sink out to one foot of drawdown within the UFA is about 2,000 ft, except toward the northeast where it is closer to 800 ft. The distance to two feet of drawdown in the UFA was about 1,100 ft except decreasing to 110 ft to the northeast of the sink. The drawdown pattern around Blue Sink appears to be mostly symmetrical except to the northeast which may be a result of anisotropic conditions or just better well control. Changes to nearby lake levels were not significant during both tests and were all less than 0.1 ft. Transmissivity and storage coefficients were derived for the UFA based on Theis distance-drawdown and Cooper-Jacob straight line methods. The average transmissivity and storage coefficient from the 30-day pumping test was 69,000 ft2/d and 0.14, respectively. The storage coefficient value from the test suggests that the UFA is unconfined or very leaky which is consistent with the karst geology surrounding Blue Sink.
- 35 -
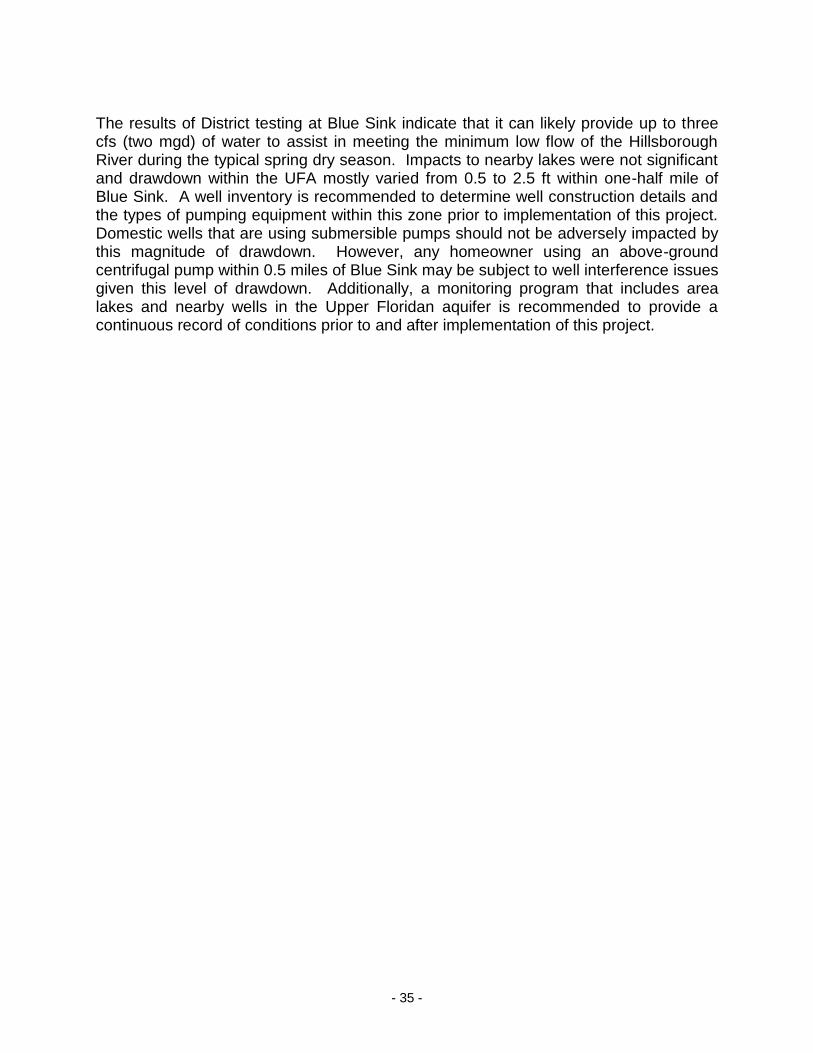
The results of District testing at Blue Sink indicate that it can likely provide up to three cfs (two mgd) of water to assist in meeting the minimum low flow of the Hillsborough River during the typical spring dry season. Impacts to nearby lakes were not significant and drawdown within the UFA mostly varied from 0.5 to 2.5 ft within one-half mile of Blue Sink. A well inventory is recommended to determine well construction details and the types of pumping equipment within this zone prior to implementation of this project. Domestic wells that are using submersible pumps should not be adversely impacted by this magnitude of drawdown. However, any homeowner using an above-ground centrifugal pump within 0.5 miles of Blue Sink may be subject to well interference issues given this level of drawdown. Additionally, a monitoring program that includes area lakes and nearby wells in the Upper Floridan aquifer is recommended to provide a continuous record of conditions prior to and after implementation of this project.
- 36 -
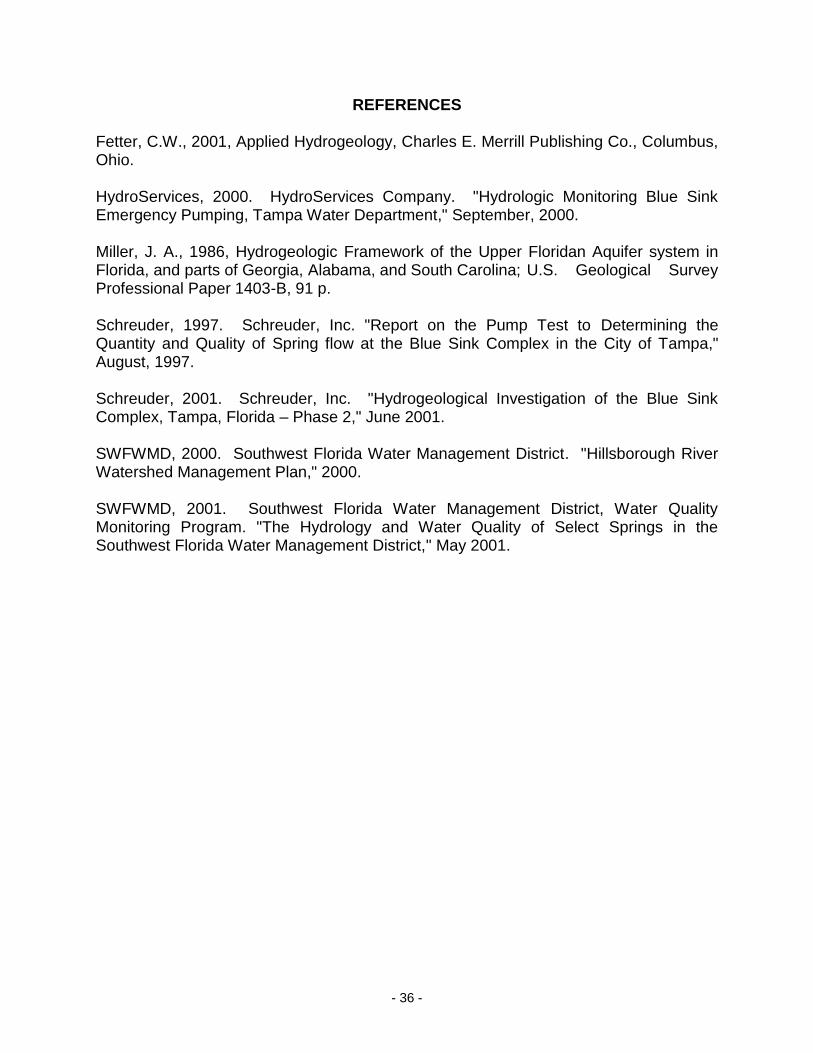
REFERENCES
Fetter, C.W., 2001, Applied Hydrogeology, Charles E. Merrill Publishing Co., Columbus, Ohio. HydroServices, 2000. HydroServices Company. "Hydrologic Monitoring Blue Sink Emergency Pumping, Tampa Water Department," September, 2000. Miller, J. A., 1986, Hydrogeologic Framework of the Upper Floridan Aquifer system in Florida, and parts of Georgia, Alabama, and South Carolina; U.S. Geological Survey Professional Paper 1403-B, 91 p. Schreuder, 1997. Schreuder, Inc. "Report on the Pump Test to Determining the Quantity and Quality of Spring flow at the Blue Sink Complex in the City of Tampa," August, 1997. Schreuder, 2001. Schreuder, Inc. "Hydrogeological Investigation of the Blue Sink Complex, Tampa, Florida – Phase 2," June 2001. SWFWMD, 2000. Southwest Florida Water Management District. "Hillsborough River Watershed Management Plan," 2000. SWFWMD, 2001. Southwest Florida Water Management District, Water Quality Monitoring Program. "The Hydrology and Water Quality of Select Springs in the Southwest Florida Water Management District," May 2001.

APPENDIX A
10
12
14
16
18
20 3/1/2009
3/15/2009
3/29/2009
4/12/2009
4/26/2009
Aquifer Level (ft NGVD)
Dat
e
RO
MP
66
15
17
19
21
23
25 3/1/2009
3/15/2009
3/29/2009
4/12/2009
4/26/2009
Stage Level (ft NGVD)
Dat
e
Blu
e S
ink
35
37
39
41
43
45 3/1/2009
3/15/2009
3/29/2009
4/12/2009
4/26/2009
Stage (ft NGVD)
Dat
e
Lake
Elle
n
15
17
19
21
23
25 3/1/2009
3/15/2009
3/29/2009
4/12/2009
4/26/2009
Stage Level (ft NGVD)
Dat
e
Ewan
ow
ski S
pri
ng
Po
ol
30
32
34
36
38
40 3/1/2009
3/15/2009
3/29/2009
4/12/2009
4/26/2009
Stage (ft NGVD)
Dat
e
Ce
dar
Lak
e W
est
30
32
34
36
38
40 3/1/2009
3/15/2009
3/29/2009
4/12/2009
4/26/2009
Stage (ft NGVD)
Dat
e
Ce
dar
Lak
e E
ast
25
27
29
31
33
35 3/1/2009
3/15/2009
3/29/2009
4/12/2009
4/26/2009
Stage (ft NGVD)
Dat
e
Lake
Eck
les
30
32
34
36
38
40 3/1/2009
3/15/2009
3/29/2009
4/12/2009
4/26/2009
Stage (ft NGVD)
Dat
e
No
reas
t La
ke
30
32
34
36
38
40 3/1/2009
3/15/2009
3/29/2009
4/12/2009
4/26/2009
Stage (ft NGVD)
Dat
e
Pin
e L
ake
15
17
19
21
23
25 3/1/2009
3/15/2009
3/29/2009
4/12/2009
4/26/2009
Aquifer Level (ft NGVD)
Dat
e
11
5th
Str
eet
15
17
19
21
23
25 3/1/2009
3/15/2009
3/29/2009
4/12/2009
4/26/2009
Aquifer Level (ft NGVD)
Dat
e
Sch
reu
de
r W
ell
1
25
27
29
31
33
35 3/1/2009
3/15/2009
3/29/2009
4/12/2009
4/26/2009
Aquifer Level (ft NGVD)
Dat
e
Mar
jory
We
ll
15
17
19
21
23
25 3/1/2009
3/15/2009
3/29/2009
4/12/2009
4/26/2009
Aquifer Level (ft NGVD)
Dat
e
Sch
reu
de
r W
ell
2
20
22
24
26
28
30 3/1/2009
3/15/2009
3/29/2009
4/12/2009
4/26/2009
Aquifer Level (ft NGVD)
Dat
e
Zah
aria
s 2
20
22
24
26
28
30 3/1/2009
3/15/2009
3/29/2009
4/12/2009
4/26/2009
Aquifer Level (ft NGVD)
Dat
e
Zah
aria
s 1
10
12
14
16
18
20 3/1/2009
3/15/2009
3/29/2009
4/12/2009
4/26/2009
Aquifer Level (ft NGVD)
Dat
e
FDO
T 4
15
17
19
21
23
25 3/1/2009
3/15/2009
3/29/2009
4/12/2009
4/26/2009
Aquifer Level (ft NGVD)
Dat
e
FDO
T 1

APPENDIX B
CALIBRATION YSI #( r-/'?"
Date 3 --A ~ 0'1 Time Cic.zO:::> Initials \Z~
CALIBRATION
Std Pre-calibrated value Calibrated value Temp
CONDO J I L\ H \. L\~~
~,\O"
lO~~ 3
L~U I. .
lbttl ~ I {). [)O
()l OO 'D
JLl~ $3
I Y,51o }~ ~:;-lo • .
l':Sj-1LO
[pH
7
10
o ,O~S"e-Depth 0
t OlD.3 % "130 0 " % I~ . " C5 1/7D.O. 100
c Date 3 - 2 ---oq .Time \\000 Initials =ts
POST-CALIBRATION "Project rfSCu(' 8) n L<
....,
Std Pre-calibrated value Calibrated value Temp
CONDO J. Yl( J, 3 ~ Cj
I L ()C)
Itl/II.
7 .tJa
le oI L{'-{
lLP,ull IpH
7
·10 In, n '2.
0 OOf
IDO.1 %
"10 ,"ou
Q,ct)O
109,(J %
IloJ.;UJ
}et,QO
/7( ,fYtf C
Depth 0
D.O. 100
c
CALIBRATION YSI #(
Date \..\ - l -04 Time Lo~{S Initials IS
Project CALIBRATION
Std Pre-calibrated value Calibrated value Temp
L L\! \ \ l.-J? \ 'L~\ \ I ~-' O -"< CONDO . " .'
't. \ ,, ;:!~ .L. ...1 I ~.:. ,..;"
pH
7 lD , ~b{ ,- ) ""0 :20 , ~ 'irS,,() , "
10 10 . I \ LO .DO 2. D· R-l i'l. -
Depth 0 - o . a l l ~ D . O D e ,::JQ. 7 0
D.O. 100 \lo.q % »>" % 2_0. to)! C -
Date , Time IO;t)b Initials "7:~ t l
'Project POST-CALIBRATION
CONDO
pH
Depth
Std I . \ . ll ~t.- \ ,". li . •
7
·10
0
Pre-calibrated value
L L\ )-:2. ' I
1 ~ '\?J Ci ,q - ~
-t
( ) f"'(1 ~ ' J ro- 'l.' -"~ .J I
Calibrated value
Lq d'" .
---7, UO I ()~I) O -
10.0 00
Temp ,J,_ i f [,
r :\ • DLrt?Z }. J l J"': .~~ ~ . Lu'
d \.2eo
D.O. 100 01;), ;) . % .------" % ;) f·;2GJ C
\.
\
• '
,!
f,'
•
-----,,
SQdtn.
r1~j
[ SA
M"PLEt
C'O
TODY
RE
CO
RD
~~
a..t~~
.:.
::.
Pag
e ~Of_/_
Pro
ject
Nam
e:
E)\
U-R
5
i(1IC
.
sect
ion
: E
( Q
)/JJ
i S
£V
O/L
AD
'DY
) D
ep
art
rne
nt.
K
P' £O
I);C
,f iP
roj
PC
f3
Dat
e: 3
-d"
(J ~
Sh
ipp
ing
Bat
ch 1
0:~
lo;).l
~tY-
Y1 11
:esS
)M
M/O
OIY
YY
Y H
H:M
M)
Su
bm
issi
on
No.
I(
{)()
/ LI >
']~. :/'
35 .0
0-' 0
0 (0
6-07
)
L1M
S S
AM
PL
E ID
(L1M
S S
AM
PL
E 1
0)
(L1M
S S
AM
PL
E 1
0)
(L1M
S S
AM
PL
E I
D)
I} (,/
' j-:
i. :'
, L'"
r: (-
/'.:
. _
.< ~/
,./ L
t·.. ·
1
! .' c
.
1D-1
0 -7
J \
TO
TA
L N
UM
BE
R O
F
CO
NT
AIN
ER
S:
7 --
---r
--..
s-
J:!!lI
liiiil
<::
I "
.•. .
'.
.-"
Dep
th:
e III
~ ()U
Co
nd
: uS
/em
_
__
_ D
epth
: m
_ ~a
mple
Tim
e:
Dep
th:
m
H:
Con
d :
uS/e
m
~<)~-
. -, ~,
-
: ':Vc~
if~"
='
~ampie
Tim
e;
De
pth
: m
H:
C
on
d:
uS/e
m~L
_• •
•• '""~
SE
ND
RE
SU
LTS
TO
: 7IHnrn
~ "y
:"YJ m
aU
z 1-
/215
" Pl
CT
NA
E
'
. E
XT
EN
SIO
N
MA
IL C
OD
E
Site
Nam
e:
_ S
ampl
e D
ate
: -
Ter
nn:
h
mre
seliX
aU
Co
mm
en
ts
Nu
mb
er o
f Co
nta
ine
rs:
Nu
mb
er o
f C
on
tain
ers
:
Nu
mb
er
of C
on
tain
ers
:
Nu
mb
er
of C
on
tain
ers
:
UID
: _
UID
: ----------
UID
: _
UID
: --:-----------
SA
MP
LE
S C
OL
LE
CT
ED
BY
:
FU
LL
NA
Mf:
: lG
VrW
Y)l/
j SC
YlrM
th
FU
LL
NA
ME
:
r. , -,
': ".
'
":
-.:.,
....
".....
,~
------.
SA
MP
LE
CL.
-IT
OD
Y R~CORD
P
age ~
of---
1. ~
\.~
Pro
ject
Nam
e: B
ue
6111
1(
" S
ecti
on
: E
C6IQ
u,i
c ['
Vo.
{vC
At)
OVl
Dep
artm
ent:
fZ~~
ou
6
Pro
,'(J(
/>IJ
: .
J
Dat
e:
Lj _./
-09
':"",)!
~!hi
ppin
g Bat
ch 1
0: ~
t ljo l ld
DCI4
}O J
7'4
<M
M/D
DN
YY
Y H
H:M
M)
Su
bm
issi
on
No
.J 0
003L
fLoq
5
,,"
'-'
35.0
0-10
0 (0
6-07
)
(L1M
S S
AM
PL
E 1
0)
TO
TA
L N
UM
BE
R O
F
CO
NT
AIN
ER
S:
I
De
pth
: ...
.,-...
,..
m ,20D3131
~q
Ll
DI
. uS
/em
i:>1~) C
I
1JJ 7
07:
1. I
f .
. -f r
' )
'!' \ /}
(L
1MS
SA
MP
LE
IDI
Sa
mp
le T
ime
: D
ep
th:
m
H:
Co
nd
: u
S/e
m
I (L
1MS
SA
MP
LE
ID
)
I-
-D
ep
th:
m
Co
nd
: u
S/e
m
I (L
1MS
SA
MP
LE
10)
I.
._--
De
pth
: m
C
ond
: uS
/em
.~ :
Site
Nam
e:
-"--
-"-
_ S
am
ple
Dat
e;:
-T
em
o:
' .
°c
RH
: mm
Qjjf
lttf[~m~
lNrt
ij;~
SE
ND
RE
SU
LT
S T
O:
''101
mt
h Lg
SLh (
VIO
L
17.
LIJ
cj C
; PR
. S
NA
M
EX
TE
NS
ION
M
AIL
CO
DE
Site
Nam
e:S
am
ple
Dat
-e:""
"-----::-:-----:----::::--------=
:----:":'-
Ter
r!a;
.•r..?~
\":.;
. ~~.,::
-.f."
Nu
mb
er
of
Co
nta
ine
rs:
Nu
mb
er o
f C
on
tain
ers
:
Nu
mb
er
of
Co
nta
ine
rs:
Nu
mb
er o
f Co
nta
ine
rs:
UID
: _
UID
: _
UID
: -:-_~
~,.....----
UID
: _
SA
MP
LE
S C
OL
LE
CT
ED
BY
:
FU
LL
NA
ME
: 1
( \ Yy
j OO
I _!
, ) (
I!J
lYlG
l
b
Whi
te -
Lab
Cop
y Y
ello
w -
Orig
inat
or C
opy


APPENDIX C
012345
07
14
21
28
Drawdown (ft)
Da
ys
sin
ce
Pu
mp
ing
Sta
rte
d
Ew
an
ow
sk
i Sp
rin
g
012345
07
14
21
28
Drawdown (ft)
Da
ys
sin
ce
Pu
mp
ing
Sta
rte
d
Blu
eS
ink
012345
07
14
21
28
Drawdown (ft)
Da
ys
sin
ce
Pu
mp
ing
Sta
rte
d
11
5th
Av
en
ue
012345
07
14
21
28
Drawdown (ft)
Da
ys
sin
ce
Pu
mp
ing
Sta
rte
d
Ma
rjo
ry R
d
012345
07
14
21
28
Drawdown (ft)
Da
ys
sin
ce
Pu
mp
ing
Sta
rte
d
Sc
hre
ud
er
1 W
ell
012345
07
14
21
28
Drawdown (ft)
Da
ys
sin
ce
Pu
mp
ing
Sta
rte
d
Sc
hre
ud
er
2 W
ell
012345
07
14
21
28
Drawdown (ft)
Da
ys
sin
ce
Pu
mp
ing
Sta
rte
d
FD
OT
1
012345
07
14
21
28
Drawdown (ft)
Da
ys
sin
ce
Pu
mp
ing
Sta
rte
d
FD
OT
4
012345
07
14
21
28
Drawdown (ft)
Da
ys
sin
ce
Pu
mp
ing
Sta
rte
d
Za
ha
riu
s 1
012345
07
14
21
28
Drawdown (ft)
Da
ys
sin
ce
Pu
mp
ing
Sta
rte
d
Za
ha
riu
s 2
-2.5
-1.5
-0.5
0.5
1.5
2.5
07
14
21
28
Drawdown (ft)
Da
ys
sin
ce
Pu
mp
ing
Sta
rte
d
Pin
eL
ak
e
-2.5
-1.5
-0.5
0.5
1.5
2.5
07
14
21
28
Drawdown (ft)
Da
ys
sin
ce
Pu
mp
ing
Sta
rte
d
No
rea
st L
ak
e
-2.5
-1.5
-0.5
0.5
1.5
2.5
07
14
21
28
Drawdown (ft)
Da
ys
sin
ce
Pu
mp
ing
Sta
rte
d
La
ke
Ec
kle
s
-2.5
-1.5
-0.5
0.5
1.5
2.5
07
14
21
28
Drawdown (ft)
Da
ys
sin
ce
Pu
mp
ing
Sta
rte
d
Ce
da
r L
ak
e E
as
t
-2.5
-1.5
-0.5
0.5
1.5
2.5
07
14
21
28
Drawdown (ft)
Da
ys
sin
ce
Pu
mp
ing
Sta
rte
d
Ce
da
r L
ak
e W
es
t

APPENDIX D
_̂
!A!A!A
!A!A!A
!A
!A!A!A!A!A
!A
!A
!A
!A
!A
!A!A!A
!A !A
!A
!A
!A
!A
Eckles, Lake
Pine Lake
Noreast Lake
Cedar Lake
Dorset Lake
Curiosity
Creek
§̈¦275£¤B41 £¤41
OP582
Florid
aSta
te Hw
y 685
US H
wy 41
Bus
State Hwy 582 Fowler
Boule
vard
Blvd
Boule
vard
State Hwy 582
Blvd
Cedar Lake East
West
0 1,000 2,000500Feet
/August 2009
Data provided by SWFWMDand HCHD
Distance0.5-Mile Buffer1-Mile Buffer
Legend_̂ Blue Sink!A PWS!A Limited Use Wells
_̂
!A!A!A!A!A!A !A!A
!A
!A!A!A!A !A!A!A!A !A
!A!A
!A!A
!A!A!A
!A!A!A!A!A!A!A!A!A!A!A!A!A!A!A!A!A!A!A!A!A!A!A!A!A!A!A!A!A!A!A!A!A!A!A!A!A!A!A!A!A!A!A!A!A!A!A!A!A!A!A!A!A!A!A!A!A!A!A!A!A!A!A!A!A!A!A!A!A!A
!A!A!A !A!A
!A
!A!A!A!A!A!A!A
!A!A !A!A !A
!A!A
!A
!A!A!A!A!A!A!A!A !A
!A!A!A !A!A !A!A!A!A !A!A
!A
!A!A !A!A!A !A!A
!A!A !A!A!A!A!A !A !A
!A!A !A!A!A!A
!A!A!A!A!A!A!A!A!A!A!A!A!A!A!A!A!A!A!A!A!A!A!A!A!A!A!A!A!A!A!A!A!A!A!A!A!A!A!A!A!A!A!A!A!A!A!A!A!A !A!A!A!A!A!A!A!A!A!A!A!A!A!A!A!A!A!A!A!A!A!A!A!A!A!A!A!A!A!A!A!A!A!A!A!A!A!A!A!A!A!A!A!A!A!A!A!A!A!A!A!A!A!A!A!A!A!A!A!A!A!A!A!A!A!A!A!A!A!A!A!A
!A
!A !A!A!A!A!A!A !A
!A !A!A!A!A!A !A !A!A!A !A!A!A!A !A
!A!A
!A!A!A!A !A!A!A!A !A!A!A!A !A!A!A!A!A!A !A!A!A !A!A!A
!A!A
!A!A!A
!A
!A
Eckles, Lake
Pine Lake
Noreast Lake
Cedar Lake
Dorset Lake
Curiosi
ty Creek
§̈¦275
£¤B41£¤41
OP582
ST582A
Florid
a
Fletcher
State
Hwy 6
85US
Hwy
41 Bu
s
County Road 582A
State Hwy 582
Boule
vard
Fowler
Blvd
Boule
vard
State Hwy 582
Blvd
Cedar Lake East
West
0 1,000 2,000500Feet
/August 2009
Data provided by SWFWMDand HCHD
Distance0.5-Mile Buffer1-Mile Buffer
Legend_̂ Blue Sink!A Private Wells
_̂
!A!A!A!A!A!A!A!A!A!A!A!A!A!A!A!A!A!A!A!A!A!A!A!A!A!A !A!A!A!A!A!A!A!A!A!A!A!A!A!A!A!A!A!A!A!A!A!A!A !A!A!A!A!A!A!A!A!A!A!A!A!A!A!A!A!A !A!A!A
!A!A!A!A!A!A!A!A!A!A!A !A!A!A!A!A!A!A!A!A!A!A !A!A!A!A!A!A!A!A !A
!A
!A!A!A!A!A!A!A!A!A!A!A!A!A!A
!A!A!A!A!A!A!A!A!A!A!A!A!A!A!A!A!A!A!A!A!A!A!A
!A!A!A!A!A!A!A !A!A!A!A!A!A!A!A!A!A !A!A!A!A!A!A!A!A!A!A!A!A
!A!A!A!A!A
!A!A!A!A !A!A!A!A!A!A!A
!A!A!A!A!A!A!A !A!A!A
!A!A!A!A
!A!A!A!A!A
!A!A!A !A
!A!A!A!A
!A!A!A!A!A !A
!A!A!A!A!A!A!A!A!A!A!A!A!A!A!A!A!A!A!A!A!A!A!A!A!A!A!A!A!A!A!A!A!A!A!A!A!A!A!A!A!A!A!A!A!A!A!A!A!A!A!A!A!A!A!A!A!A!A!A!A!A!A!A!A!A!A!A!A!A!A!A!A!A!A!A!A!A!A!A!A!A!A!A
!A!A!A
!A!A
!A!A!A!A!A!A!A!A!A!A
!A !A!A!A!A
!A
!A !A!A!A!A!A!A!A!A!A!A!A!A!A !A
!A!A!A!A!A!A!A!A!A!A!A !A!A!A!A!A!A!A!A!A!A!A!A!A!A!A!A!A!A !A!A!A!A!A!A!A!A!A!A!A!A!A!A!A!A!A!A!A!A!A!A!A!A!A!A!A!A!A!A!A!A!A!A!A!A !A!A
!A!A!A!A
!A
!A!A!A!A!A!A!A!A!A!A!A!A!A!A!A!A
!A!A!A!A!A!A !A!A!A!A!A!A!A
!A!A!A!A!A!A!A!A!A!A!A!A!A!A!A!A!A!A!A!A!A!A!A!A!A!A!A!A!A!A!A!A!A!A!A!A!A!A!A!A!A!A!A!A!A!A!A!A!A!A!A!A!A!A!A!A!A!A!A!A!A!A!A!A!A!A!A!A
!A!A !A!A!A!A!A
!A!A!A!A!A!A!A!A!A!A!A!A!A!A!A!A!A!A!A!A!A!A!A!A!A!A!A!A!A!A!A!A!A!A!A!A!A!A!A!A!A!A!A!A!A!A!A!A!A!A!A!A!A!A!A!A!A!A!A!A!A!A!A!A!A!A!A!A!A!A!A!A!A!A!A!A!A!A!A!A!A!A!A!A!A!A!A!A!A!A!A!A!A!A!A!A!A!A!A!A!A!A
!A!A!A!A!A!A!A!A!A!A!A!A!A!A!A!A!A!A!A!A!A!A!A!A!A!A!A!A!A!A!A!A!A!A!A!A!A!A!A!A!A!A!A!A!A!A
!A !A!A!A
!A!A!A!A!A!A!A!A!A!A!A!A!A!A!A!A!A!A!A!A!A!A
!A!A!A!A!A!A!A!A!A!A!A!A
!A!A!A!A
!A!A !A!A!A!A!A !A!A!A!A!A!A!A!A!A !A!A !A!A!A!A!A!A!A!A!A!A!A!A !A!A!A!A!A!A!A!A!A!A!A!A!A!A!A!A!A!A!A!A!A!A!A!A!A!A!A!A
!A!A!A!A!A!A!A!A!A!A!A!A!A!A!A!A!A!A!A!A!A!A!A!A!A!A!A!A!A!A!A!A!A!A!A!A!A !A!A!A!A!A!A!A!A!A!A!A!A!A !A!A!A!A!A!A!A!A!A!A!A!A!A!A!A!A
Eckles, Lake
Pine Lake
Noreast Lake
Cedar Lake
Dorset Lake
Curiosi
ty Creek
§̈¦275
£¤B41£¤41
OP582
ST582A
Florid
a
Fletcher
State
Hwy 6
85US
Hwy
41 Bu
s
County Road 582A
State Hwy 582
Boule
vard
Fowler
Blvd
Boule
vard
State Hwy 582
Blvd
Cedar Lake East
West
0 1,000 2,000500Feet
/August 2009
Data provided by SWFWMDand HCHD
Distance0.5-Mile Buffer1-Mile Buffer
Legend_̂ Blue Sink!A Observation/Monitor Wells
14 Observation/Monitor Wells
66 Observation/Monitor Wells
45 Observation/Monitor Wells
62 Observation/Monitor Wells
71 Observation/Monitor Wells
16 Observation/Monitor Wells36 Observation/
Monitor Wells
42 Observation/Monitor Wells
36 Observation/Monitor Wells
_̂
!(!(!(!( !(!(!(
!(!( !( !(!( !(
!(
!(!(!( !(
!(!( !(
!(!( !( !(
!(!(!( !(!( !( !(!(!(!(!(!(!(!(
!(
!(!(
!(
!(!(!(!(!(!(!(!(!(!(!(!(!(!(!(!(!(!(!(
!(
!(
!(!(!(!(!(!(!(!(!(!(!(!(!(!(!(!(!(!(
!(
!(!( !( !(!(!(!(!(!(!(
!(
!(!(!(
!(!(!( !( !(
!(!( !( !(!(!(
!(!(
!(
!(!( !(!( !(
!( !(
!(!(!(!( !( !(
!(!( !(!( !(!(!(!( !(
!(!(!(!(!(!(!(!(!(!(!(!(!(!(!(
!(!(!(!(!(!(!(!(!(!(!(!(!(!(!(!(!(!(!(!(!(!(!(!(!(!(!(!(!(!(!(!(!(!(!(!(!(!(
!(!(
!(!( !( !(!( !(
!(
!(
!(!( !(!( !(!(
!(!(!(!(!(!(
!(
!(
!(!(!(!(
!(
Eckles, Lake
Pine Lake
Noreast Lake
Cedar Lake
Dorset Lake
Curiosity
Creek
§̈¦275
£¤B41£¤41
OP582Florid
aSta
te Hw
y 685
US H
wy 41
Bus
State Hwy 582
Boule
vard
Fowler
Blvd State Hwy 582
Blvd
Cedar Lake East
West
0 1,000 2,000500Feet
/August 2009
Data provided by SWFWMDand HCHD
Distance0.5-Mile Buffer1-Mile Buffer
Legend_̂ Blue Sink!( Irrigation Wells!( Industrial/Mining Wells
11 Irrigation Wells
8 Irrigation Wells
18 Irrigation Wells
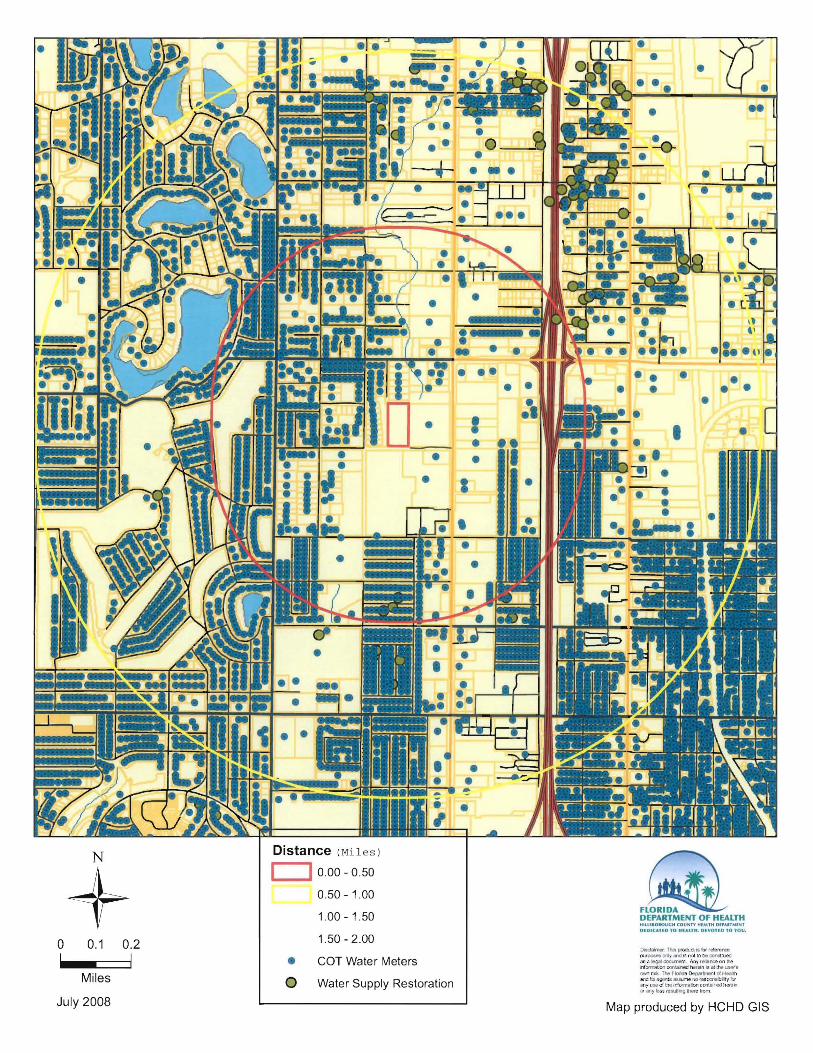
N
+Distance (Mi l e s)
c::J 0.00 - 0.50
0.50 - 1.00
1.00 - 1.50
1.50 - 2.00 o 0.1 0.2 !)I$claimer Thls prOOtJdls w rp,!p-t't'n('l! purpc:l&eB onIy lind l~ no4 10 bolCDO!'itruf!d <IS a ~ docl.menl M y f el tll I'CC on ee .n ror~bon COOlalfled ht.'fei n rs ..I lhe us6f' s ~ n~ T~ F~a~~l dH~~
! I • COT Water Meters and ib . got'lb IIlUj.;me no res pon stl ~Hy lorMiles JIfl)' uu of \he Informa tion CO!1l6jner1 hl~n
Ofllfl yh lS1,rnwlllllQ"+lf& !m m o Water Supply Restorat ion
July 2008 Map produced by HCHD GIS

APPENDIX E
SUBMISSION_RESULTS Southwest Florida Water Managem ent District Page 2 of 4 Chemistry Laboratory 08 :41 Monday , May 4, 2009
Results Report . . By Submission
Lab Name: SWFWMD Chemist r y Lab Address : 2379 Broad Street, Br ooksville , Fl 34604-6899 Phone # : (352) 796·7211 OAP #: 870100G FDOH Cert #: E44149
Requested by: Tammy Schmaltz
Submission ID: 100034273
Study Name: MINI MUM FLOWS
This report contains dat a certified as meeting the requirements set forth by the National Environmental Laboratory Accreditation Conference unless noted otherwise.
This re por t has been rev i ewed and approved bY~ Mark Rials
Laboratory Manager 352-796 -7211 ext. 4220
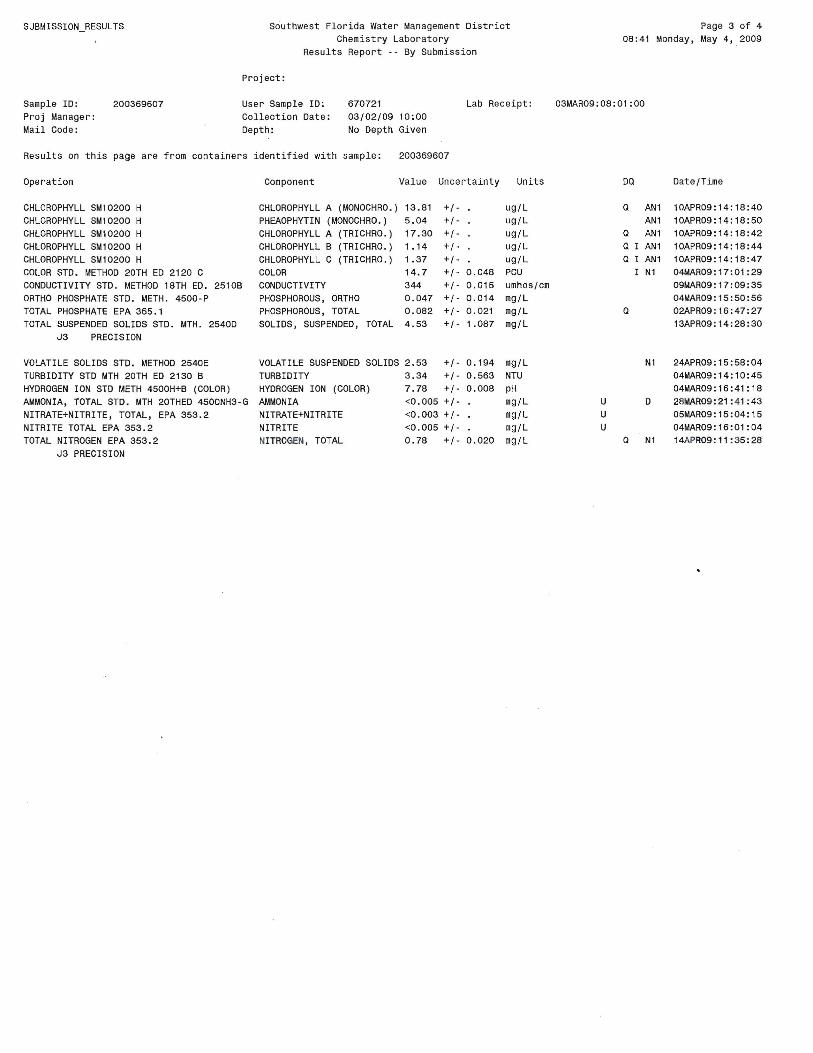
SUBMISSION_RESULTS Southwe st Fl orida Water Management District page 3 of 4 Chem i stry Laboratory 08:41 Monday, May 4, 2009
Results Rep ort . . By Submiss ion
Project:
Sample ID: Proj Manager : Mail Code:
200369607 User Sample ID: Collection Date: Depth:
670721 03/02/09
No Depth 10 :00
Given
Lab Receipt: 03MAR09:08:01 :00
Results on this page are from containers id entified with sample: 200369607
Operation Component Valu e Un certainty units DO Date/Time
CHLOROPHYLL SM10200 H CHLOROPHY LL SM10200 H CHLOROPHYLL SM10200 H CHLOROPHYLL SM10200 H CHLOROPHYLL SM10200 H COLOR STD. METHOD 20TH ED 2120 C CONDUCTIVITY STD. METHOD 18TH ED . 2510B ORTHO PHOSPHATE STD. METH. 4500 -P TOTAL PHOSPHATE EPA 365.1 TOTAL SUSPENDED SOLIDS STD. MTH. 25400
J3 PRECISION
CHLOROPHYLL A (MONOCHRO .) PHEAOPHYTIN (MONOCHRO.) CHLOROPHYLL A (TRICHRO.) CHLOROPHYLL B (TRICHRO.) CHLOROPHYLL C (TRICHRO.) COLOR CONDUCTIVI TY PHOSPHOROUS, ORTHO PHOSPHOROUS, TOTAL SOLIDS , SUSPENDED, TOTAL
13 .81 5. 04 17.30 1.14 1.37 14 .7 344 0 .047 0 . 082 4 .53
+1+1 +1+1· +1+1 0.048 +1- 0.015 +1- 0.014 +1 0. 021 +1 · 1.0B7
ug/L ug/L ug/L ug/L ug/L PCU umhos/ cm mg /L mg/L mg/L
0
0 0
0
0
AN1 AN1 AN1
I AN1 I AN1 I N1
10APR09:14:18:40 10APR09 :14:18:50 10APR09:14:18:42 10APR09:14:18:44 10APR09:14:18:47 04MAR09:17:01:29 09MAR09 :17 :09:35 04MAR09:15 :50:56 02APR09: 16 :47:27 13APR09:14:28:30
VOLATILE SOLIDS STD. METHOD 2540E TURBIDITY STD MTH 20TH ED 2130 B HYDROGEN ION STD METH 4500H+B (COLOR) AMMONIA, TOTAL STD. MTH 20THED 4500NH3 -G NITRATE+NITRITE , TOTAL, EPA 353.2 NITRITE TOTAL EPA 353 .2 TOTAL NITROGEN EPA 353.2
J3 PREC ISION
VOLATILE SUSPENDED SOLIDS 2.53 +1 0.194 TUR8IDITY 3.34 +1 0.563 HYDROGEN ION (COLOR) 7.78 +1- 0.008 AMMONIA <0 .005 +1 NITRATE+NITRITE <0 . 003 +1 NITRITE <0 .005 +1NITROGEN , TOTAL 0.78 +1- 0.020
mg /L NTU pH mg/L mg/L mg/L mg /L
U U U
0
N1
D
N1
24APR09:15: 58:04 04MAR09:14:10 :45 04MAR09:16:41:1B 28MAR09:21: 41 :43 05MAR09:15:04:15 04MAR09:16:01:D4 14AP R09 : 11: 35:2B
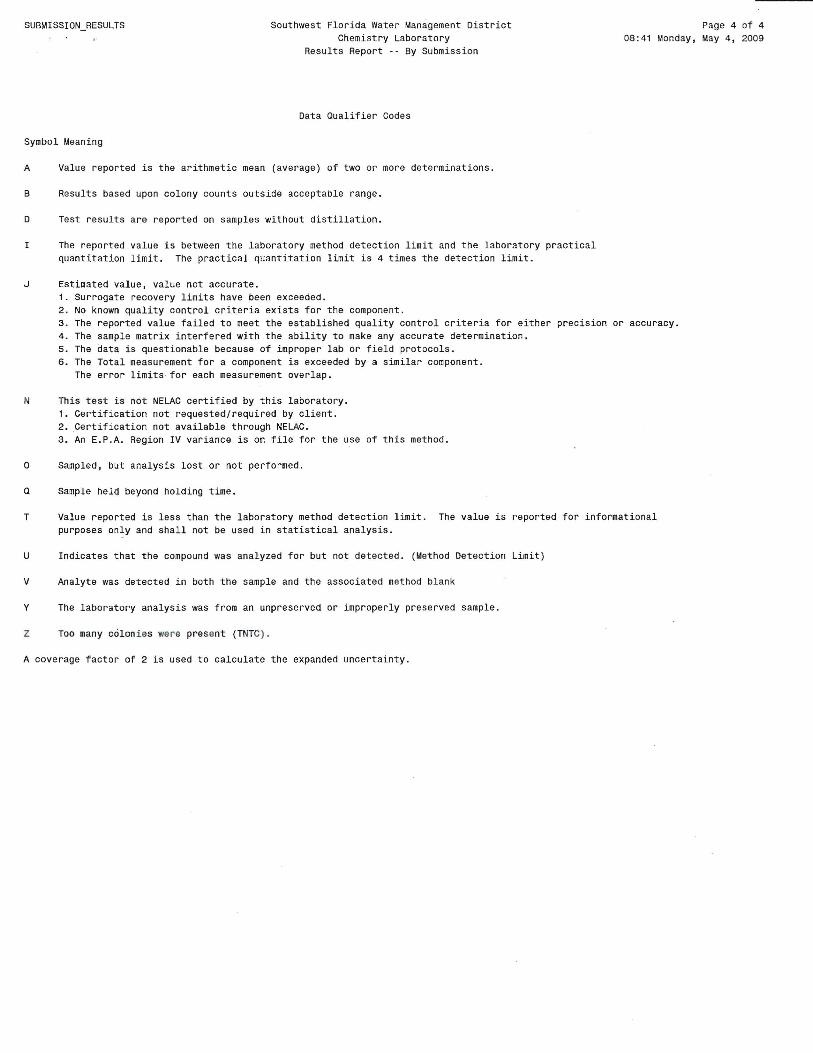
SUBMISSION_RESULTS Southwest Flo rida Water Management District Page 4 of 4 Chemistry Laboratory 08:41 Monday, May 4, 2009
Results Report - - By Submission
Data aualifier Codes
Symbol Meaning
A Value reported is the arithmet ic mean (average) of two or more determinations.
B Results based upon colony counts outside acce ptable range.
D Test r esults are r eported on samples without distillation.
The reported value is between the laboratory method detect i on limit and t he l aboratory pr actical quantitation limit. The practical quantitation limit is 4 tim es the detection limit.
J Estimated value, value not accurate. 1. Surrogate recovery limits have been exceed ed. 2. No known quality control criteria exi st s for th e component . 3. The reported value failed to meet the establ ished quality cont rol c r i t e r i a for e i t her pr ecision or acc uracy. 4. The sample matrix i nterfe re d with the ability to make any accurate determination. 5. The data i s questionable because of improper l ab or field protocols . 6. The Total meas ure ment for a component is exceeded by a s i mi lar component .
The error limits· for each measurement overlap.
N Thi s tes t is not NELAC certified by this laboratory. 1. Certif ication not re quest ed/ r equi red by client. 2. Certif i cation not available through NELAC. 3. An E.P.A. Regio n IV variance i s on file for the use of this method.
o Sampled, but analysis lost or not perfo rmed.
a Sample held beyond holding tim e.
T Value reported is less th an the labor atory method detection limit. The value is repo rted f or i nf ormatio nal purposes only and shall not be us ed in statistical anal ysis .
U Indicates t hat the compound was analyzed for but not detected . (Met hod Detection Limit)
V Analyte was detected in both the sample and the ass ociat ed method blank
Y The laboratory analysis was from an unpre served or improperly pre served sa mpl e .
Z Too many coloni es were present (TNTC) .
A coverage factor of 2 is used to cal culat e the expanded uncertainty.
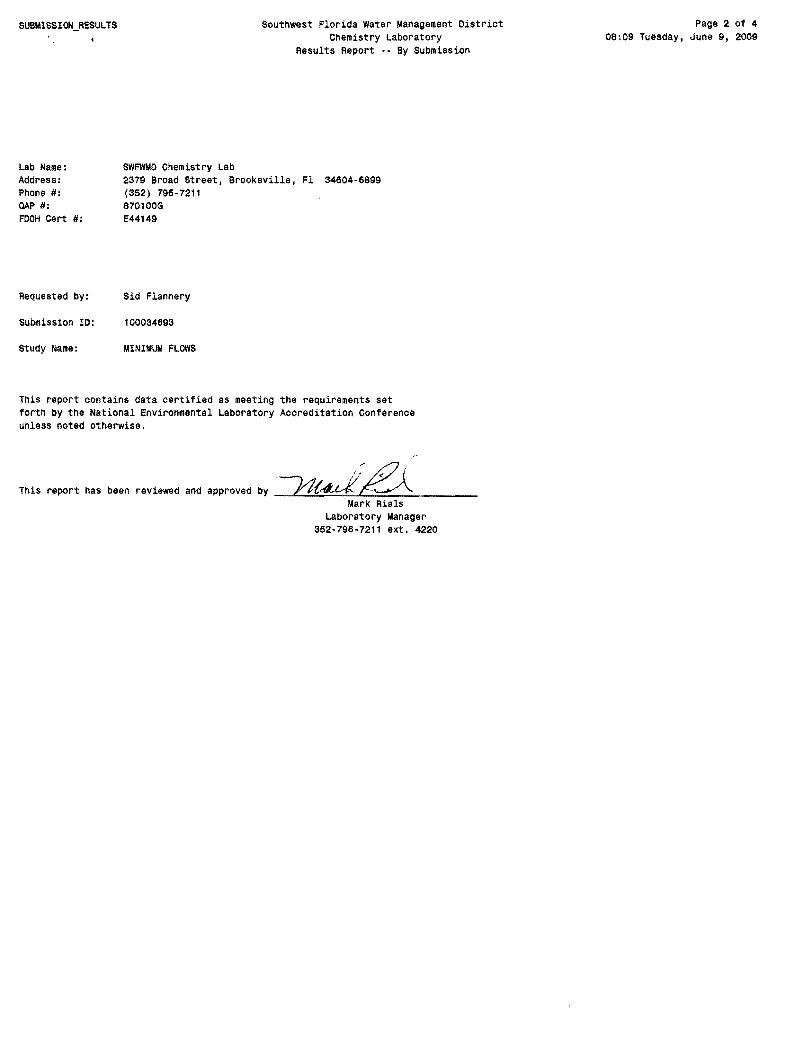
__ ___
Southwest Florida Water Management District Page 2 of 4 Chemistry Laboratory 08:09 Tuesday, June 9, 2009
Results Report -- By Submission
Lab Name: SWFWMO Chemistry Lab Address: 2379 Broad Street, Brooksville, Fl 34604-6899 Phone It: (352) 796-7211 OAP It: 870100G FOOH Cert It: E44149
Requested by: Sid Flannery
Submission 10: 100034693
Study Name: MINIMUM FLOWS
This report contains data certified as meeting the requirements set forth by the National Environmental Laboratory Accreditation Conference unless noted otherwise.
This report has been reviewed and approved by _'~L-~~~~~~iL~_'~~=<~-..___________ Mark Rials
Laboratory Manager 352-796-7211 ext. 4220
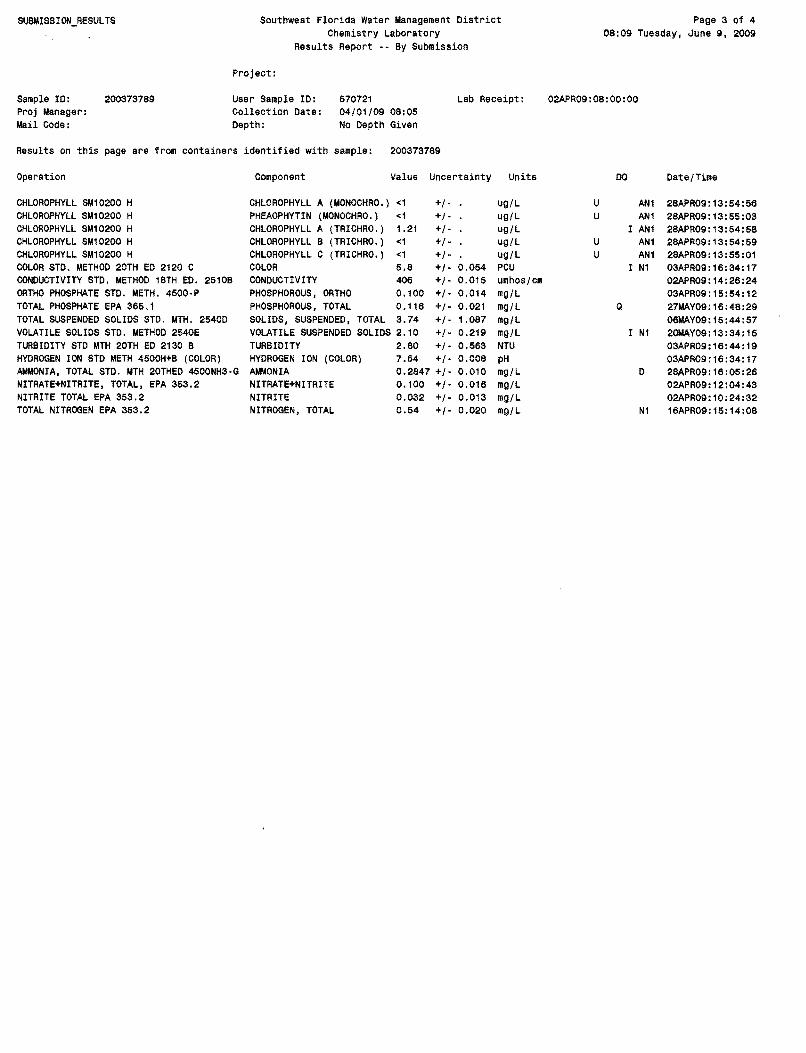
SUBMISSION_RESULTS Southwest Florida Water Management District Chemistry Laboratory
Results Report - By Submission
Page 3 of 4 08:09 Tuesday, June 9, 2009
Project:
Sample 10: 200373789 User Sample 10: 670721 Lab Receipt: 02APR09:08:00:00 Proj Manager: Mail Code:
Collection Date: Depth:
04/01/09 08:05 No Depth Given
Results on this page are from containers identified with sample: 200S73789
Operation Component Value Uncertainty Units DO Date/Time
CHLOROPHYLL SM10200 H CHLOROPHYll SM10200 H CHLOROPHYLL SM10200 H CHLOROPHYLL SM10200 H CHLOROPHYLL SM10200 H COLOR STD. METHOD 20TH ED 2120 C CONDUCTIVITY STD. METHOD 18TH ED. 2510B ORTHO PHOSPHATE STD. METH. 4500-P TOTAL PHOSPHATE EPA 365.1 TOTAL SUSPENDED SOLIDS STD. MTH. 25400 VOLATILE SOLIDS STD. METHOD 2540E TURBIDITY STD MTH 20TH ED 2130 B
CHLOROPHYLL A (MONOCHRO.) <1 PHEAOPHYTIN (MONOCHRO.) <1 CHLOROPHYLL A (TRICHRO.) 1.21 CHLOROPHYLL B (TRICHRO.) <1 CHLOROPHYLL C (TRICHRO.) <1 COLOR 5.8 CONDUCTIVITY 406 PHOSPHOROUS. ORTHO 0.100 PHOSPHOROUS, TOTAL 0.116 SOLIDS. SUSPENDED. TOTAL S.74 VOLATILE SUSPENDED SOLIDS 2.10 TURBIDITY 2.80
+/+/+/+/+/ -+/- 0.054 +/- 0.015 +/- 0.014 +/ 0.021 +/ 1.087 +/ 0.219 +1 0.563
ug/L ug/L ug/L ug/L ug/L PCU umhos/cm mg/L mg/L mg/L mg/L NTU
U U
U U
0
AN1 AN1
I AN1 AN1 ANl
I N1
I Nl
28APR09:13:54:56 28APR09:13:55:03 28APR09:13:54:58 28APR09:1S:54:59 28APR09:1S:55:01 03APR09:16:34:17 02APR09:14:26:24 OSAPR09:15:54:12 27MAY09:16:48:29 06MAY09:15:44:57 20MAY09:13:S4:15 03APR09:16:44:19
HYDROGEN ION STD METH 4500H+B (COLOR) AMMONIA. TOTAL STD. MTH 20THED 4500NH3-G NITRATE+NITRITE, TOTAL, EPA 353.2 NITRITE TOTAL EPA 353.2 TOTAL NITROGEN EPA 35S.2
HYDROGEN ION (COLOR) AMMONIA NITRATE+NITRITE NITRITE NITROGEN, TOTAL
7.64 +/- 0.008 0.2847 +1 0.010 0.100 +/- 0.016 0.032 +/ 0.013 0.54 +/ 0.020
pH mg/L mg/L mg/L mg/L
0
Nl
OSAPR09:16:34:17 28APR09:16:05:26 02APR09:12:04:43 02APR09:10:24:32 16APR09:15:14:08
SUBMISSION_RESULTS Southwest Florida Water Management District Page 4 of 4 Chemistry Laboratory 08:09 Tuesday, June 9, 2009
Results Report .. By Submission
Data Qualifier Codes
Symbol Meaning
A Value reported is the arithmetic mean (average) of two or more determinations.
8 Results based upon colony counts outside acceptable range.
o Test results are reported on samples without distillation.
The reported value is between the laboratory method detection limit and the laboratory practical quantitation limit. The practical quantitation limit is 4 times the detection limit.
J Estimated value, value not accurate. 1. Surrogate recovery limits have been exceeded. 2. No known quality control criteria exists for the component. 3. The reported value failed to meet the established quality control criteria for either precision 4. The sample matrix interfered with the ability to make any accurate determination. 5. The data is questionable because of improper lab or field protocols. 6. The Total measurement for a component is exceeded by a similar component.
The error limits for each measurement overlap.
or accuracy.
N This test is not NELAC certified by this laboratory. 1. Certification not requested/required by client. 2. Certification not available through NELAC. 3. An E.P.A. Region IV variance is on file for the use of this method.
o sampled, but analysis lost or not performed.
Q sample held beyond holding time.
T Value reported is less than the laboratory method detection limit. purposes only and shall not be used in statistical analysis.
The value is reported for informational
U Indicates that the compound was analyzed for but not detected. (Method Detection Limit)
V Analyte was detected in both the sample and the associated method blank
Y The laboratory analysis was from an unpreserved or improperly preserved sample.
Z Too many colonies were present (TNTC).
A coverage factor of 2 is used to calculate the expanded uncertainty.