Embed Size (px)
Citation preview

Form 9-014
UNITED STATES DEPARTMENT OF THE INTERIOR
GEOLOGICAL SURVEY RESTON, VA. 22092
RESULTS OF AQUIFER TESTING IN THE BELCOURT AREA,
ROLETTE COUNTY, NORTH DAKOTA
Open-File Report 75-396
Prepared in cooperation with the
U.S. Public Health Service
U.S. GOVERNMENT PRINTING O,ICE 589-917-b

i JNITED STATES DEPARTMENT OF THE INTERIOR
GEOLOGICAL SURVEY
RESULTS OF AQUIFER TESTING IN THE BELCOURT AREA,
ROLETTE COUNTY, NORTH DAKOTA
By P. G. Randich and G. E. Ghering
Open-File Report 75-396
Pr epared in cooperation with the
U.S. Public Health Se rvice
Bismarck , North Dakota
August 1975 .,.

CONTENTS
Ab s tract---------- ------ ----- ---------------··---- ------
Introduction--------------------------- - -- ------- ------ 2
Purpose and scope------------------------------ --- 2
Location of study area------------------------- --- 3
System of numbering data-colle ction sites------ --- 3
Geohydr ol ogy of the test site- -------------------- ----- 6
Aquifer tests---- - -- ---- ----------------------- --- 9
Water quality--------------------------------------- --- 12
Discussion and conclusions----------------------- - -- --- 15
Selected references--------------------------------- --- 17
ILLUSTRATIONS
Figure 1. Map showing loca t ion of study area------ --- 4
2. Graph s ho wing system of numbering data-
collection sites---------- -- --------------- 5
3. Map showing locat ions of test sites in
the Shell Valley aquifer ---------- -------- 7
4. Map showing locations of wells used during
aquifer tests and area of influence
resulting from pumping 71 hours at
120 gal/min (7.6 1/s )---------- - -------- --- 11
i ; i

TABLES
Table 1. Lithologic logs of wells and test holes
in the Belcourt area--------------------- - - - 18
2. Summary of aquifer-test results from
pumping well 161-071-03CDD4 for 71 hours- --- 29
3. Chemical anal yses of ground water from th e
Shell Valley aquifer------- -- ------------ --- 30
4. Chemical analyses of water from minor
elements from test well 161 -0 71-03CDD4--- --- 31
f.\ ,,
iv

SEL ECTED FACTORS FOR CONVERTING ENGLISH UNITS TO
INTERNATIONAL SYSTEM (S I ) UNITS
A dual system of measurements--English units and the
International System (Sl) ;of units--i s gi ven i n this report.
SI is a consistent system of units adopted by the Eleventh
General Conference of Weights and Mea sures in 1960. Selected
factors for converting English units t o SI un i ts are given
below.
Multiply English units
Acres
Acre-feet
Cubic feet per second (ft3/s)
Feet
Feet per day (ft/d)
Feet per mile
Feet squared per day (ft 2/d)
Gallons
Gallons per minute (gal/min)
Inches
Miles
Square miles
v
~
0.4047
To obtain SI units
hectares (ha)
.00404 7 square kilometres (km2)
1.233xl0- 6cubic kilometres (km 3)
28 . 3162
. 3048
. 304 8
. 1894
.09 29
.00378 5
. 06309
25.4
1 • 609
2 .. 590
litres per second (1/s)
metres (m)
metres per day (m/d)
metres per kilometre (m/km)
metres squared per (m2/d)
day
cubic metres (m3)
litres per second ( 1 Is)
millimetres (mm)
kilometres (km)
square kilometres (km2)

RESULTS OF AQUIFER TESTING IN THE BELCOURT ARE A,
ROLETTE COUNTY, NORTH DAKOTA
By P. G. Randich an d G. E. Ghering
ABSTRACT
The city of Belcourt, Agency headquarters for the Turtle
Mountain Indian Reservation, is located in northeast ern
Rolette County, north-central North Dakota. At the request of
the U.S. Public Health Service, the U.S. Geological Survey
conducted a study in the vicinity of Belcourt to ass ist in
location of a suitable water supply for the city.
The Shell Valley aquifer is located about 5 mil es south
west of Belcourt. Test drilling and aquifer testing in the
Shell Valley aquifer indicate an adequate quantity of suitable
quality water is available for development as a municipal
supply for the city of Belcourt. Transmissi vities in the test
area average 7,760 feet squared per day (7 21 metr es squared
per day). The aq uifer , which is generally unconfine d, con
tains about 5,000 acre-feet (0.006 cubic kilometres) of water
per square mile of surface area. Wells developed at a depth
of about 38 feet (12 metres) will yield as much as 12 5 gallons
per minute (8 litres per second} individually, if spaced at
leas t 700 feet (213 metres) apart.
The water is a calcium bicarbonate type and has a dis
solved-solids concentration of 323 to 566 milligrams per
litre. Trace elements did not exceed allowable limits as
defined by the U.S. Public Health Service.
1

INTRODUCTION
Purp os e and Scope
At the re quest of t he U.S. Publjc Health Ser vic e, the
U.S. Geological Survey condu c ted a two-phase grou nd-wat e r
study in the vicinity of Belcourt, N. Oak., Agency headquarters
for the Turtle Mountain Indi a n Reservation, to locat e a suit-
able water supply for the city.
Phase consi s ted of a r econnaissance of the geology and
hydrology of the area, test drilling, sample descrip t i on,
geophysical logging, observa t ion-well installation, water
sampling for chemical analys es, and preparation of a report
(Ra ndich, 1974) describing the major findings of thi s phase.
Selection of the Shell Valley aquifer (Randich, 1974 , p. 10)
as a suitable ground-water source was based on the r esults of
this phase.
Phase 2 consisted of aquifer delineation, selec tion of a
test site for development, well construction, aquife r testing
and analyses, and water sampling and analyses. The objec t ives
of phase 2 were to determine well yields, proper wel l s pa cing,
and long-term adequacy of the Shell Valley aquifer as a sour ce
of supply for the city of Belcourt. This report is the r es ult
of phase 2 of the study.
2

Location of Study Area
The study ·area (fig. 1) consisted of about 6 sq uare miles
(16 km 2) near the Turtle Mountain Indian Reservation about 5
miles (8 km) southwest of the city of Belcourt in no rtheastern
Rolette County, north-central North Dakota.
System of Numbering Data-Collection Sites
The system of numbering data sites used in thi s report is
illustrated in figure 2 and is based upon the location of the
well or test hole within the grid establish ed by the U.S.
Bureau of Land Management's survey of the area. The first
numeral denotes the township north of a base line; the second
numeral denotes the range west of the fifth principa l merid
ian; and the third numeral denotes the section in which the
well or test hole is located. The letters A, B, C, and D
designate, respectively, the northeast, northwest, southwest,
and southeas t quarter secti ons, quarter-quarter sec tions, and
quarter-quarter-quarter sections (10-acre, or 4-ha, tracts).
Consecutive terminal numerals are added if more than one well
is located within a given 10-acre (4-ha) tract. Th us, well
162-069-15DAA is in the NE~NE~SE~ sec. 15, T. 162 N., R. 69 W.
Similarly, well 162-069-08CDD2 is the second well l ocated in
the SE~SE~SW~ sec. 8, T. 162 N., R. 69 W.
3

••
0 4 MILES • 0 3 KILOMETRES
; .
100M LES ~~HM~~----~
• F I G U R E 1 • - - M a p s how i n g 1 o c a t i o n o f s t u d y a rea ··~
4

FI ~ UR E 2.--System of numberin g data -c oll ect i on site~ .
~ ' I ~
I • "
i' 5 I :J.
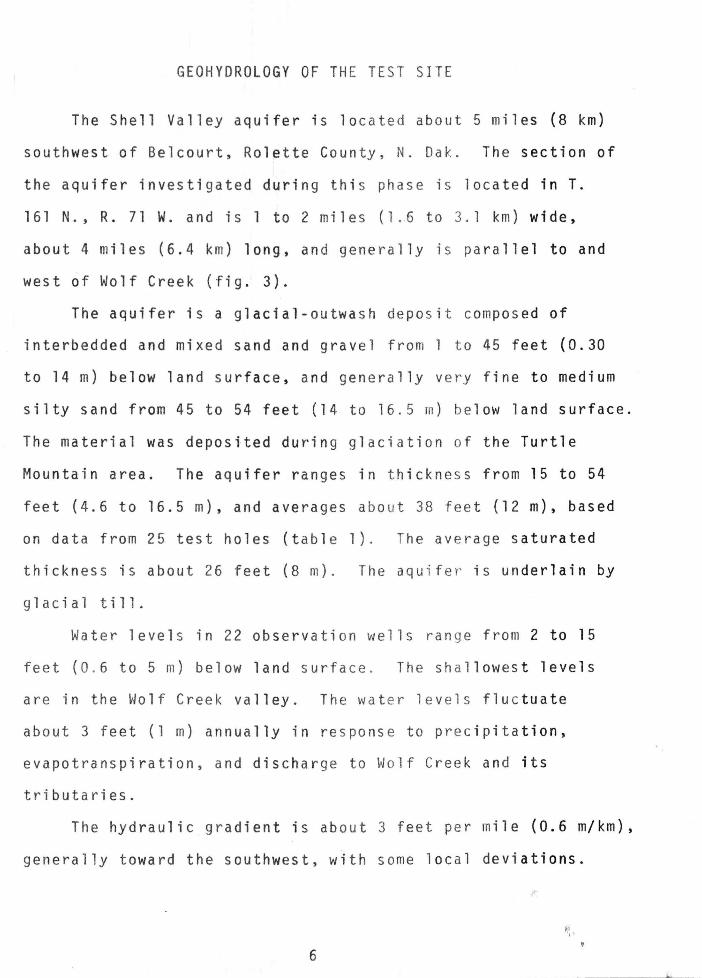
GEOHYDROLOGY OF THE TEST SITE
The Shell Valley aquifer is located about 5 mile s (8 km)
southwest of Belcourt, Rolette Cou nty, N. Oak. The section of
the aquifer investigated during th i s phase is locate d in T.
161 N., R. 71 W. and is 1 to 2 miles (1 .6 to 3.1 km) wide,
about 4 miles (6.4 km) long, and generally is paral lel to and
west of Wolf Creek (fig. 3).
The aquifer is a glacial-outwash deposit composed of
interbedded and mixed sand and grave l from 1 to 45 fe et (0.30
to 14m) below land surface, and generally very fine to medium
silty sand from 45 to 54 feet (14 to 16.5 m) bel ow land surface.
The material was depostted during glaciation of the Turtle
Mou ntain area. The aquifer ranges in thickness from 15 to 54
feet (4.6 to 16.5 m), and averages about 38 feet (12m), based
on data from 25 test holes (tabl e 1). Th e average saturated
thickness is about 26 feet (8 m). The aqu i fer is underlain by
glacial till.
Water levels in 22 observation wells rang e from 2 to 15
feet (0 . 6 to 5 m) below land surfa ce . The shal lowest levels
are in the Wolf Creek valley. The water levels flu ctuate
about 3 fe et (1 m) annually in re sponse to precipita tion,
evapotranspiration, and dischar ge to Wolf Creek and its
tributaries.
The hydraulic gradient is about 3 feet per mi le (0.6 m/km),
generally toward the southwest, with some local deviations.
6

4
9
8UE FROM U.S, GEOLOGICAL SUit\l£Y LAn UPSILON SE, 19-68
~---
3
SCALE 1:24 000
-------- ----·--~- -
--AQUIFER BOUNDARY
.u~ 'TEST HOLE A-litO NUMB£R C INiliCATES CH£J.flt:AL ANA;..'f3 S !H TA8t.E
A STREAM MEASUREMENT SITE
Of:=::a:=::::E=:::::!::::=:E::a::=:::E=:::C:=::E:s:::il::::::;i.l MILE 0 1 KILOM£fRE ea ea F3 -ea F3 ,
FIGURE 3.--Locations of test sites in the Shell Valley aquifer
near Belcourt.
•

Discharge in Wolf Creek was measured in April 1974 at
sites 161-071-02AAA and 161-071-lOCCC (fig. 3). At that time
60 ft 3;s (2 m3/s) was flowing through Wolf Creek in sec. 2,
a n d o n 1 y 3 5 f t 3 I s ( 1 m 3 1 s. ) i n s e c . l 0 , 2 m i 1 e s ( 3 k m ) d o w n -
stream. The loss was attributed to infiltration to the Shell
Valley aquifer. Late-fall observations indicated t hat springs
and seeps discharged into Wolf Creek, but only in sufficient
quantities to cause swampy areas adjacent to the st ream.
These data indicate there is a hydraulic connec tion between
the Shell Valley aquifer and Wolf Creek and its tributaries.
A dam constructed on Wolf Creek near the test site would make
more of the streamflow available as recharge to the Shell
Valley aquifer.
The Shell Valley aquifer contain s approximate ly 5,000 ·
acre-feet (0.006 km 3 ) of water in storage per square mile
(2.6 km 2) of aquifer surface area. About 50 percen t of this
amount may be available to properly constructed wel ls.
8

Aquifer Tests
As part of this investigation, two aquifer tes ts wer e
made during November and December 1974 in that part of th e I
Shell Valley aquifer seleCted for development. The test well
was installed at 161-071-03CDD4 (No. 41) using 8- i nc h ( 200- mm)
steel casing, a 6-inch (150-mm) stainless steel No. 40-slo t
screen set from 28 to 38 feet (8 to 12 m) below lan d surface,
and gravel packed. The well was equipped with a 6- inch (150-
mm) turbine pump powered by an industrial engine us ing propane
fuel. Water was discharged 800 feet (244 m) east of the well
near Wolf Creek. The discharge was maintained cons tant within
2 percent by a valve at the pump, monitored by a cumula t iv e
inline flow meter, and measured by an orifice and a manom eter
at the point of discharge. The water discharged du rin g t he
test did not infiltrate the ground and affect test res ul ts
because freezing temperatures caused the water to pond and
freeze on the surface near the point of discharge.
The first test was run for 27 ho urs at a pumpi ng rat e of
150 gal/min (9.5 1/s). Water samples were collected a t t he
well for standard chemical analyses after 4, 12, an d 24 hour s
of pumping and for trace-element analyses after 26 hour s of
pumping. This test was used to establish a maximum pump i ng
rate and to calibrate the instrumenta t ion.
9

The second test was run for 71 hours at a pumpi ng rate of
120 gal/min (7.6 1/s). Water samples were collected for
standard chemic~l analyses after 48 hours of pumping and for
trace-element analyses after 71 hours.
Data from the aquifer test were analyzed using methods
described by Ferris and others (1962); the results are sum-
marized in table 2. The transmissivity of the aqui fer in the
vicinity of the test site r anges from 6,350 to 8,650 ft 2/d
(721 m2/d) and averages 7,760 ft 2/d (721 m2/d). The storage
coefficient ranges from 0.051 to 0.16, indicating wa ter-table
conditions that trend toward leaky artesian con ditions in some
parts of the aquifer (table 2).
The areal extent of the cone of depression and the amount
of drawdown measured during the 71-hour test are shown in
figure 4. Recharge boundaries, attributed to verti cal drain-
age of upper materials in the aquifer, were detecte d in the
early parts of the test. The effect of a confining boundary,
probably the edge of the aquifer about 1,200 feet ( 365 m) east
of the pumped well, was detected after 800 minutes of .pumping.
The water level in the test well recovered to the original
level about 70 hours after the test.
·.!
~! '••
1 0

•
stCTION 3
0
34
SECTION 10
r
EXPLANATION
-o.4--t.iN:E {)F £CUAL DRA OOWN 6Af1HED WHERE APPBOXtMATELY t.OQ4'T'£P. tN1'£1tVAL. 0.2 FEET (0.0$ WTRES)
0.05
39
e PRO:OtJ'CTI:ON WELL
0 OSS£RVATtON WELL
H fill U £R
OA ORAWOOWN, I FEET
0.12
38
0 100 200 FEET
I 1 1 I l 0 25 50 METRES
•
' // ' --~ ,,_ I ---~~ ~~~ --------+------o-2-
1 I
FIGURE 4.--Locations of wells used during aquifer tests and area of influence resulting from pumping 71 hours at 120 gal l ons per minute
(7 . 6 litres per second).
/
I I
I /
, I I I

Aquifer-test analyses indi cat e th a t ma ximum yi elds to
adequa te ly screened wells ar e abou t 125 gal / mi n (8 1/ s ) with
a min i mum spacing of 700 feet (213 m) between wells arra nged
in an east-west array across the aqui f er in the pro posed area
for development (fig. 3). Present demands for the city of
Belcourt could be met by pumping three wells in the vicinity
of the test site.
~~A T ER QUALITY
The chemical analy s es of water samp l es colle c t ed from the
Shell Valley aquifer duri ng this phase of t he study are
listed in tables 3 and 4. The water in the Shell Valley
aqu i fer is a calcium bicarbonate type. The dissolv ed-solid s
concentration ranges from 323 to 566 mg/1 and avera ges 442
mg/1 1n 12 samples. A vari a tion in concentrat i on of dissolved
solids of about 200 mg/1 appears to be common in th e Shell
Valley aquifer.
As a means of judging the water quality in the Shell
Val l ey aquifer, drinking water standards established for
interstate carriers by the U.S. Public Health Servi ce in 1946
and amended in 1962 are given as follow:
12 - ----------- ·--. -

"Drinking water shall not c ontain i mpurit i es in concen ...
t rations which may be hazardous t o the health o .f t he consumers .
It should not be excessively corrosive to t he wa ter supply system.
Substance s used in its treatmen t shall no t rema .in in t he water
in concentrations greater than r equired b y good pract i ce .
Substances which may have deleterious physiol ogical eff ect, or
for which physiological effects are not k nown, shall not be
introduced into the system in a manner which wo uld per mit them
to reach the consumer .
"The following chem.ical s ubs t ances s hould not be present
in a water supply in excess o f t he listed concen trations where,
in the judgment of the Reporting Agency and the Certifying
Author_ity, other more suitable supplies are or can be made
available.
Subs tance
Al kyl Benzene Sulfonate {ABS-------------------Arsenic {As)----- ----------- --- ---------------·- -Chloride (Cl)--- - -------------- - - ---- -- - ---- - --Copper (Cu)----- ------------------ ------- - - - - - -Carbon Chloroform Extract (CCE) ----- - - -·---- - --·-Cyanide (CN)------------------- --- --- ------ - ----Fluoride (F)------------------------------------Iron (Fe)------------- - -------- - - - ------- - - --- --· Manganese (Mn)------------- ------------------ - -Nitrate l(N03)----------------- - - ------ - --- ---- -Phenols------------------------ ------ -- - - - ------Sulfate (S04----------------- - -- - --------- -----Total Dissolve d Solids------ - -- - - - ---- --------- -Zinc (Zn)----------------- ------ ------------ ----
Conce ntrations i n mg/1
0 .5 0. 01
250 . 1 . 0.2 0 .01
(See 5 . 23) 0 .3 0 .05
45 . 0 .001
250 . 500 .
5.
1In areas in which the nitrat e con tent of water i s known to be in excess of the listed concentration, the publi c should be warned of the potential dangers o f using the water for infant feeding .
1 3

. · "The presence af the follow.ing substances in excess of
the concentration~ li~ted shall constitute grounds for
rejection of the supply:
Substance
Arsenic (As)----------------- ------------------Barium (Ba)------------------------------------Cadm.ium (Cd) ---------------------------·---------Chromium (Hexavalent) (cr+6;--- ----------- -------Cyanide (CN)--------------------------- - -------Fluoride (F)---------------------- --------------Lead (Pb)-----------~---------------------------
Se1enium (Se)------------------ ----------------Silver (Ag)------ - ------------------------------
Concen tration in mg/1
0.05 1 . 0.01 0.05 0.2
(See 5.23) 0.05 0.01 0 . 05
"5.23 .Fluoride.--When fluoride is naturally present in
drinking water, the concentration should not average more than
the appropriate upper limit shown i n the fo1lol:vi.ng table.
Presence of fluoride in average concent.rat .i ons grea ter than
two times the optimum values listed sha L.l const1: tute grounds
for re jection of the supply.
"r~here fluoridation (suppl ementation of f l uoride in
drinking water) is practiced, the average Fluoride concen-
tration shall be kept within the uppe.r and l ower control
limits listed below:
Annual average of maximum daily air temperaturesl
50.0 -53.8 -58.4 -63.9 -70.7 -79.3 -
53.7------------------58.3------------------63.8------------------70.6------------------79.2------------------90 . 5-------------------
Recommended control limits--F .l uor_ide concentrations in mg/ 1
Lower ppt_imum Upper
0.9 1.2 1.7 0 . 8 1 .1 1 . 5 0.8 1.0 1 . 8 0 .7 0.9 1.2 0.7 0.8 1.0 0 .6 0.7 0.8
1Based on [Fahrenheit] temperature data obtained for a minimum of five years."
14

Analyses of five water samples collected during the
aquifer tests indicate a 40 to 50 percent decrease in dis
solved manganese and iron and a slight decrease in chloride
(table 3). These changes probably are due to well casing and
artificial gravel pack used in constructing the test well.
O·ISCUSSION AND CONCLUSIONS
l. The Shell Valley aquifer consists of about 26 feet {8
m) of saturated sand and gravel deposits in the test area.
The average transmissivity of the aquifer is 7,760 ft 2/d
(721 m2/d) and the storage coefficient ranges from 0.051 to
0.16. The ground-water gradient is about 3 ft/mi (0.6 m/km)
toward the southwest. Static water levels range from 2 to 15
feet (0.6 to 5 m) below land surface datum with about 3 feet
(1 m) of seasonal fluctuation. There is about 5,000 acre-feet
(0.006 km 3 ) of water in storage per squ a~e mile of surface
area of the aquifer, of which about 50 percent may be avail
able to properly constructed wells.
2. Aquifer-test analyses indicate that the ma ximum
individual well yield would be about 125 gal/min (8 1/s), and
minimum spacing between wells arranged in an east-west array
in the test area needs to be about 700 feet (213m) .
3. Test results indicate that present {1975) water
demands for the city of Belcou rt coul d be met by using t~ree
wells developed in the aquifer. Maximum well efficiency might
be obtained by screening the wells from 28 to 40 feet (9 to
12 m) below land surface using 40-50-slot screen with a
15

gravel pack. Wells developed with compressed air or high
velocity jetting for a minimum of 12 hours would fu rnish
maximum yie ld of sand-free water.
4. The potential for additional development could be
evaluated by monitoring water levels, quantities pumped, and
water quality at the well field.
5. Water from wells developed in the fine-gra ined
formations in sec. 2, T. 161 N., R. 71 W., near the valley of
Wolf Creek, contains considerably more dissolved iron and
manganese than water from wells developed in coarse sediments
in sec. 3, T. 161 N., R. 71 W.
6. The water from the Shell Vall ey aquifer in the
proposed well-field area is a hard calcium bicarbona te type
with a dissolved-solids concentration of about 500 mg/1. The
quality of the water in the Shell Val ley aquifer appears to be
the best available in the area for municipal use.
7. Water-level and streamflow data sugges t a hydraulic
connection between Wolf Creek and the Shell Valley aquifer.
If a suitable connection exists, the quality of the water in
the aquifer is susceptible to change if th e quality of the
recharge water derived from Wolf Creek is changed.
8. A dam and l ak e on Wolf Creek near the well field in
the Shell Valley aquifer could provide additional storage of
water to recharge the aquifer if the to tal amount of ground
water developed exceeds the rate of natural recharge .
16

SELECTED REFERENCES
Ferris, V. G., Knowles, D. B. , Brown, R. J., and Sta l l man , R.
W., 1962, Theory of aquifer tests: U.S. Geol. Survey
Water-Supply Paper 1536-E, 174 p.
Lohman, S. W., and others, 1972, Definitions of selec t ed
ground-water terms--revision s and conceptua l re fineme nt s:
U.S. Geol. Survey Water-Supply Paper 1988, 21 p .
Randich, P. G., 1974, Ground-water availability in t he Belcourt
area, Rolette County, North Dakota: U.S. Geol . Survey
open-file report 75-104, 37 p.
U. S. Public Health Service, 1946, Drinking water sta ndar ds :
Public Health Rept., v. 61 , no. 11, p. 371-384.
______ 1962, Public health drinking water standards: U.S.
Public Health Service Pub. no . 956, 61 p.
,.
17

•
•
•
I
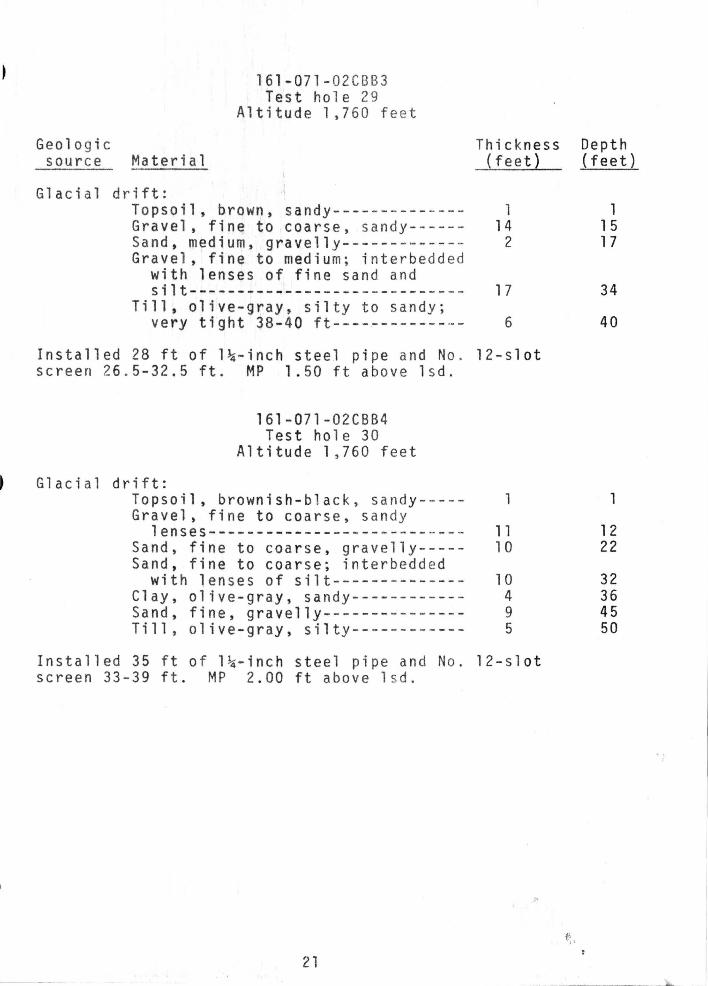
TABLE 1.--Lithologic logs of we l l s and tes t holes in the Belcou r t a rea
EXPLANATION
MP, measuring point Ls d, land s ur f ace datum
Geologic
l61-071-02CBB1 Test hole 23
Altitude 1, 762 fee t
Thickness source Material (feet)
Glacial drift: Topsoil, brownish-black, sandy----Gravel, fine to medium, sandy;
silty in places------- - - --- - ---- Silt, medium-gray~ sandy in place s ;
some gravel streaks--- ----- - ----Gravel, fine to medium------ ------Clay, medium-gray, silty -- --- ----- -
161-071-02CBB2 Test hole 24
Altitude 1,760 feet
2
1 5
21 1 1
Glacial drif t : Topsoil, brown, sandy- ------ - - --- -- 1 Gravel, medium to coarse, sandy---- 6 Gravel, fine to coarse; about 25
percent coarse sand----- -- ------- 5 Gravel, granule to medium, sandy--- 15 Sand, medium to coarse, gravelly,
silty---------------------------- 3 Gravel, fine to coarse------- - ----- 4 Sand, medium, silty---------------- 4 Gravel, medium to coarse, s andy to
silty---------------------------- 6 Till, olive-gray, silty------------ 6
Installed 35 ft of 1~-inch steel pipe and No. 12-slot screen 35-41 ft. MP 1.00 ft above lsd .
18
Depth (feet)
W· ,,,
2
1 7
38 39 40
1 7
1 2 27
30 34 38
44 50

l61-071-02CBC1 iT e s t h o 1 e 2 5
~ 1 t 'i .tude 1 , 7 6 0 feet
Geologic Thickne ss source Material (feet)
Gla cial drift: Topsoil, black, sandy---- ---------- 2 Gravel, fine to coarse; fine to
coarse sand------------- --------- 5 Gravel, medium to very coarse; fine
to coarse sand--------- ---------- 8 Gravel and cobbles, granule to very
coarse, rounded-------- ---------- 7 Till, olive-gray, sandy-- -- -------- 3
Installed 14 ft of 1~-inch steel pipe and No. 12-s lot screen 12-20 ft. MP 2.00 ft above lsd.
Glacial drift:
161-071-02CBC2 Test hole 26
Altitude l ,760 feet
Topsoil, brown ish-bla ck, sandy----Gravel, fine to very coarse ; fine
to coarse san d------------------Sand, medium-gray, silty (no
samples, all carried in the mud)Gravel, fine; about 50 percent very
fine to medium sand-------------Till, olive-gray, sil ty to sandy---
2
21
1 5
6 6
Installed 35 ft of 1~-inch steel pipe and No. 12-slo t screen 34-40 ft. MP 1.00 ft above lsd.
19
Depth (feet)
2
7
1 5
22 25
2
23
38
44 50

161-071-02BCD Test hole 27
Altitude 1,768 feet
Geologic Thickn ess source Material (feet )
Glacial drift: Topsoil, brownish-black, sandy-·---- 2 Sand, fine to coarse, gravelly----- 6 Gravel, fine to m~dium, sandy------ 12 Sand, very fine to medium, silty--- 12 Ti 11, o 1 i ve-gray, very sandy;
interbedded with thin lenses of grav~l--------------------------- 8
I n s t a 1 1 e d 2 8 f t o f l~- i n c h s t e e 1 p ·i p e a n d N o . 1 2 - s 1 o t screen 26-32 ft. MP 2.0~ ft above lsd.
Glacial drift:
161-071-02BDC Test hole 28
Altitude 1,765 feet
Topsoil, brownish-black, sandy----Gravel; cobbles------------ - ------ Sand, fine to medium, silty to
clayey-------------------------- -Sand, fine to coarse; interbedded
with thin lenses of silty clay--Gravel, fine to medium, sandy-----Sand, fine to coarse, silty-------Till, olive-gray, sandy-----------Gravel, fine, sandy---------------Till, olive-gray, sandy------------
1 4
5
8 4 8 6 2 2
Installed 21 ft of 1~-inch steel pipe and No. 12-sl ot screen 20-26 ft. MP 1.00 ft above lsd.
20
Depth (feet)
2 8
20 32
40
1 5
10
18 22 30 36 38 40
Geologic
161·071-02CBB3 Test hole 29
Altitude 1,760 feet
source Material
Glacial drift: Topsoil, brown, sandy-------------Gravel, fine to coarse, sandy-----Sand, medium, gravelly------------Gravel, fine to medium; interbedded
with lenses of fine sand and s i 1 t--------- _._------- -----------
Till, olive-gray, silty to sandy; v e r y t i g h t 3 8 - 4 0 f t - - - - - - - - - - - - ·- -
Installed 28 ft of 1~-inch steel pipe and No. screen 26.5-32.5 ft. MP 1.50 ft above lsd.
Glacial drift:
161-071-02CBB4 Test hole 30
Altitude 1,760 feet
Topsoil , brownish-black, sandy----Gravel, fine to coarse, sandy
lenses---------------------------Sand, rine to coarse, gravelly----Sand, fine to coarse; interbedded
with lenses of silt------ - ------Clay, olive-gray, sandy-----------Sand, fine, gravelly--------------Till, olive-gray, silty------------
Thickness (feet)
1 14
2
1 7
6
12-slot
1
1 1 1 0
l 0 4 9 5
Installed 35 ft of 1~-inch steel pipe and No. 12-slot screen 33-39 ft. MP 2.00 ft above lsd.
21
Depth (feet)
1 15 17
34
40
1
12 22
32 36 45 50

Geologic .
161-071-02CBB5 Test hole 31
Altitude 1,760 feet
source Material
Glacial drift: Topsoil, brownish-black, sandy----Gravel, fine to very coarse, sandySand, fine to medium--------- - ----Gravel, fine to very coarse;
interbedded with lenses of very fine to coarse ~and-------------
Sand, medium; interbedded with lenses of silt and some gravel--
Gravel, medium, sandy-------------Till, olive-gray, ve ry sandy- -- ----
Thickne ss (feet)
1 1 1
2
8
8 2 3
Installed 28 ft of 1~-inch steel pipe and No. 12-slot screen 26-32 ft. MP 2.00 ft above lsd.
Glacial drift:
161-071-02CB B6 Test hole 32
Altitude l ,759 feet
Topsoil, brownish-black, sa ndy---- Gravel, medium to coarse, sandy---Sand, medium; interbedded with
lenses of silt------ -- - ----- ----. Sand, medium, clayey --------------
Sand, medium, silty--- ------------Till, olive-gray, silty--- ---- -----
1 1 1
1 0 8 3 2
Installed 28ft of 1~-inch steel pipe and No. 12-slot screen 26-32 ft. MP 2.00 ft above lsd .
22
Depth (feet)
1 1 2 14
22
30 32 35
1 12
22 30 33 35
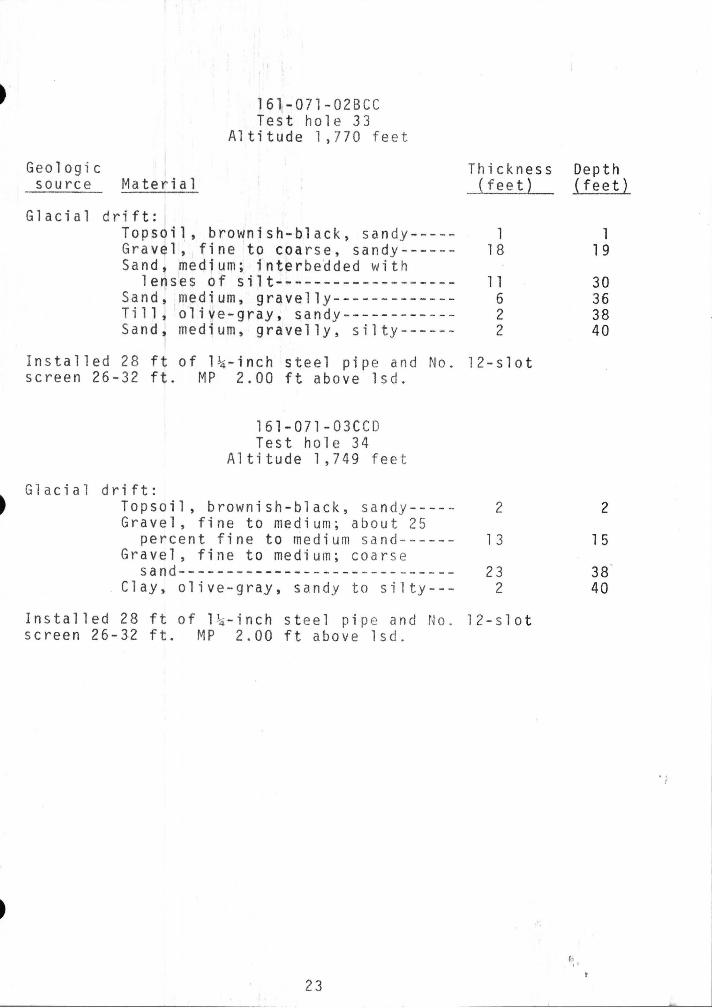
16,-071-02BCC Test hole 33
Altitude 1,770 feet
Geologic Thickne ss source Material (feet)
Glacial drift: Topsoil, brownish-black, sandy----- l Gravel, fine to coarse, sandy------ 18 Sand, medium; interbedded with
lenses of silt-~----------------- 11 Sand, medium, gravelly------------- 6 Till, oliye-gray, sandy------------ 2 Sand, medium, gravelly, silty------ 2
Installed 28ft of 1~-inch steel pipe and No. 12-slot screen 26-32 ft. MP 2.00 ft above lsd.
Glacial drift:
161-07l-03CCD Test hole 34
Altitude 1,749 feet
Topsoil, brownish-black, sandy----Gravel, fine to medium; about 25
percent fine to medium sand-----Gravel, fine to medium; coarse
sand-----------------------------. Clay, olive-gray, sandy to silty---
2
1 3
23 2
Installed 28 ft of 1 ~ -inch steel pipe and No. 12-slo t screen 26-32 ft. MP 2.00 ft above lsd.
23
Depth (feet)
1 1 9
30 36 38 40
2
1 5
38 40

161-071-03CDD1 Test hole 35
Altitude 1,754 feet
Geologic Thickne ss source Material (feet)
Glacial drift: Topsoil, brownish~black, sandy-- --- 1 Gravel, fine to medi urn; some very
coarse lenses; interbedded with lenses of fine to very coarse sand------------------- --------- - 18
Sand, fine to coa rse, gravelly, silty-------------------- --- --- -- 11
Sand, fine to coarse, gravelly----- 8 Gravel, fine; interbedded with very
fine sand------------------------ 4 Sand, very fine to medium, silty--- 12 Till, olive-gray, silty to sandy--- 6
Installed 35 ft of 1~-inch st eel pipe and No. 12-slot screen 33-39 ft. MP 2.00 ft above lsd.
Glacial drift:
161-07l-03CDD2 Test hole 36
Altitude 1,751 feet
Topsoil, brownish-black, sandy ----Sand, fine to very coarse, gravelly Gravel, fine to medium; int erbe dded
with fine to medium sand--------Sand, medium to very coarse,
gravelly------------------ ------Sand, fine to very coarse; inte r
bedded with lenses of fine gravel-------------------- --- ----
1 4
1 1
14
1 0
Installed 28 ft of 1 ~-i nch steel pipe and No. 18-slot screen 26-32 ft. MP 2.00 ft above lsd.
'· 24
Depth (feet)
19
30 38
42 54 60
1 5
16
30
40

161-071-03CDD3 Test hole 37
Altitude 1,750 feet
Geologic Thick ness source Mate~ial (fee t)
Glacial drift: Topsoil, brownish-black, sandy----- 2 Sand, medium to coarse, gravelly--- 3 Gravel, f i ne to coarse; inter-
bedded with medium to very coarse sand-- - -------------- ---- - ----- - - 20
Sand , medium to very coarse, gravelly-------- -- ----- - - --- - ---- 6
Gravel, fine to coarse; interbedded with lenses of medium to very coarse sand---- - -------- --- ----- - 7
Sand, very fine to medium, si lty-- - 2
Installed 28 ft of 1~-inch steel pipe and No . 18-sl ot screen 26 - 32 ft. MP 2.00 ft above lsd.
Glacial drift:
161-071-03CDC1 Test hole 38
Altitude 1,7 50 feet
Topsoil, brownish-black, sandy-- - - Sand, medium to coarse , gravel l y-- Gravel, fine to coarse; interbed ded
with lenses of coarse sand- --- Sand, medium to coarse; interbe dded
with lenses of medi um to coarse sand---------------------------- -
Sand, medium to coarse, gravel l y-- Gravel, fine to coarse ; interbedded
with lenses of medium to coarse sand------------- - ----- --------- -
Sand, very fine to medium, s ilty-- -
2 4
1 9
1 0 2
2 1
Installed 28 ft of 1~-inch steel pip e and No . 18-sl ot screen 26-32 ft. MP 2.00 ft above lsd.
25
~· r:f
Depth (feet)
2 5
25
31
38 40
2 6
25
35 37
39 40

l61-071-03CDC2 ' Test hole 39
Altitude 1,750 feet
Geologic Thickne s s source Material (feet)
Glacial drift: Topsoil, brownish-black, sandy----- 2 Sand, fine to coarse, gravelly----- 3 Gravel, fine to coarse; inte r bedded
with thin lenses of medium sand-- 11 Gravel, fine to medium; interbedded
with lenses of medium to coarse sand------------------- - --------- 19
Sand, medium to coarse, gr avelly--- 4 Sand, very fine to medium , silty--- 1
Installed 28 ft of 1~ - inch steel pipe and No. 18-slot screen 26-32 ft. MP 2.00 ft above lsd.
Glacial drift:
161-071-02CBB7 Test hole 40
Altitude 1,760 feet
Topsoil, brownish-black, sandy----Sand, fine to coarse, gravelly----Gravel, fine to coarse, s andy- ----Sand, fine to very coarse ; inter-
bedded with lenses of silt------Gravel, fine to coarse; interbe dded
with fine to coarse sand -- - - ----Sand, very fine to medium, ve ry
silty------------------- - - -- -----Gravel, fine, sandy to silty------Sand, fine to medium, grav e ll y---- Sand, fine to medium; interbedded
with thin lenses of gra ve l and silt-----------------------------
Installed 11 ft of 5-inch steel pipe and 4-inch N o • 1 8 - s 1 o t s c r e e n 1 0 - 1 8 f t . ~1 P 1 . 0 0 f t a b o v e
26
2 4 5
3
6
2 3 5
5
diame ter 1 s d.
Dep t h (feet)
2 5
1 6
35 39 40
2 6
1 1
14
20
22 25 30
3 5

Geologic
161-071-0 3CDD4 Test hole 41
Alt i tude 1,752 feet
sourc e Material
Glacial drift: Topsoi l , brownish-black, sandy- ---Sand, medium to very coar se ; fi ne
to medium gravel----------------Gravel, medium, well-rounded- -----Gravel, fine to coarse; in terbe dded
with some lenses of medium to coarse sand---------------------
Sand, fine to medium------ ----- - - --
Thickn ess (feet_L
2
16 7
1 3 4
Used two sacks of Revert during drilling. Bac kwashed, jetted screen, and developed with air . Installed 30ft of 8-inch steel pipe and 6-inch diameter No . 40 -slot stainless steel screen 28-38 ft. MP 2.00 ft above lsd.
Glacial drift:
161-071-03CDD5 Test hole 42
Altitude 1,751 feet
Topsoil, brownish-black, sandy----Gravel, fine to coarse; about 30
percent fine to coarse sand-----Sand, fine to very coarse; about 25
percent fine to medium gravel---Gravel, fine to medium; interbedded
with about 50 percent medium to very coarse sand---------------- -
2
16
7
l 5
Installed 28 ft of 1~-inch steel pip e and No. 12-alot screen 26-32 ft. MP 2.00 ft above lsd.
27
Depth (feet)
2
18 25
38 42
2
18
25
40

Geologic
161-07 .1-lOABB Test hole 43
Altitude 1 , 753 feet
source Material
Glacial drift: Topsoil, brownish-black, sandy----Gravel, fine to medium; interbedded
with lenses of medium to coarse sand- - --------------- - -----------
Sand, medium to very coa r se; about 30 percent fine to medium gravel
Gravel, fine to coarse, sandy-----Sand, medium to very coarse; about
25 percent fine gravel-----------
Thickn ess (feet )
7
l 7 7
8
Installed 28ft of 1 ~ -inch steel pipe and No. 25-s lot screen 26-32 ft. MP 2.00 ft above lsd .
28
Depth (feet)
1
8
25 32
40

Well location -------
16l-071-03CDD1
16l-071-03CDD2
16l-071-03CDD4
161-071-03CDD5
161-071 -lOABB
Dista.nce drawdown
TABL E 2.--Summary of aquifer -test results from pumping well 161-07l-03CDD4 for 71 hours
Static Distance and water 1 eve 1 direction from
below lsd We ll
(2UIDEed well
number (feet) (metres) (feet) (m~tres)
35 12.30 3.75 135 s 41
36 10.70 3.26 223 sw 68
41 10.37 3. l 6 0 0
42 9.62 2.93 330 SE 1 01
43 11 . 24 3.43 200 N 61
all
Transmissivity ( T)
(ft 2 /d) (m 2/d)
6,830 633
6,350 590
7,870 730
7,680 712
8,650 895
7,200 668
Hydraulic conductivit~ ( K)
( f t (9_) _____ ( m (d)
260 79
240 74
300 92
290 89
370 11 3
280 86
Storage coefficient
( II s fi )
0.065
• 1 6
.051
• 1 4
----

Well location
161-07i-02BCD
161-07l-02BDC
161-071-02CBB2
161-071-02CBC1
161-071-03CCD
161-07l-03COC1
i 6l-071-03CDD1
161-071-03CDD4
161-071-03CD04
161 - 071-03CDD4
161-071 -0 3CDD4
1Gl-07l-03CDD4
Well number
27
28
24
25
34
38
35
41
41
41
41
41
Depth of ~ve 11 (ft)
32
26
41
20
32
32
39
38
38
38
38
38
Date of
sample
11-06-74
11-06-74
11-06-74
11-13-74
11-05-74
11-05-74
11-05 -74
11-21-74
11-21-74
11-22-74
11-25-74
11-27-74
Pumping time (hrs)/ rate
(gal/min)
8/6
8/3
12/2
12/5
l 2/5
10/5
10/5
4/150
1 2/150
24/120
50/120
71/120
Dissolved silica (Si02) (mg/1)
25
24
24
24
25
25
22
23
23
1 5
23
23
Dissolved
iron (Fe}
(H g_/1 )
80
320
60
20
10
10
20
20.
30
60
10
1 0
Dissolved
manganese
(Mn) { ug/1 )
590
520
370
140
20
10
90
50
40
60
40
30
Dis.-so lved cal.: cium (Car
(mg/l)
100
92
98
91
73
83
78
66
65
68
65
66
Dissolved magne
sium (Mg}
( mg/ 1 }
27
28
35
48
57
50
3~
27
29
27
29
29
Dissolved sodium
(Na) (mg/1)
23
1 4
23
23
14
1 7
7 . 5
1 2
1 3
1 5
1 3
1 3
. -TABLE 3.--Chemical anal yses of ground wa ter from .l the I She 11 v a 11 ey a q u; fer
Dissolved po ta s
sium ( K)
{mg/1)
7. 1
5.2
5 . 1
4. 1
4.8
4.9
3. 1
3.3
3.6
3.9
3.5
3.4
Bicarbonate
~~~~f~ 327
321
331
363
360
356
249
258
258
260
259
260
Phosphate or tho dissolved as (P) (mg/1}
0.04
.03
. 02
. 01
.05
. 04
.05
. 03
.02
. 02
Phosphate dis
solved or tho
(P04) (mg/1)
0. 1 2
.09
. 06
.0 3
. 1 5
• 1 2
. 1 5
.09
.06
.06
PhosPhorus
d1 ssolved as ( P) ( mg/1 )
0. 05
.04
. 01
. 0 l
. 01
. 01
.03
.03
1
5
Tota 1 a 1 ka-1 in i ty
(as CaC03) (mg/1)
268
263
271
298
295
292
204
21 2
212
212
213
Dissolved sulfate
I (S04) . (mg/1)
140
110
160
170
140
1 50
1 30
83
83
85
80
83
Dissolved chlo
ride ( c 1 )
(mg/1)
4.4
3. 1
5.3
5. 1
4.7
5. 1
4.9
3 . 3
3 . 4
2.9
2.3
2. 3
Dissolved fluoride
( F ) (mg/1)
0 . 1
. 1
. 1
. 2
. 2
. 2
. 1
. 1
. 1
.4
. 1
. 1
Dissolved nitrate
( N) (mg/1)
0 . 00
. 03
. 03
1.5
3. 3
2.8
2.9
3.5
3.5
• 4
3.0
3. 4
Dissolved
boron (B)
(ug/1)
110
50
80
90
70
90
40
60
50
0
50
80
Dissolved solids (residue at 180°C ) (mg/l)
506
447
523
566
532
529
438
364
365
352
323
362
Hardness
(Ca,Mg) (mg/1)
360
350
390
420
420
410
330
280
280
280
280
28 0
Noncar
bonate hardness
{mg/1)
93
82
120
l 30
120
1 20
130
64
70
67
69
71
Percent
sodium
1 2
8
11
10
7
8
5
9
9
10
9
9
Sodium ad
sorption ratio
0.5
. 3
. 5
. 5
. 3
. 4
. 2
. 3
. 3
. 4
• 3
. 3
Specific conduct
ance (J.lmh os /cm
749
673
780
847
808
802
649
576
576
580
578
583
pH
{units)
8. 1
8.0
8.2
8.0
8. 1
8. 1
8.0
7.8
7. 7
7.8
7. 7
7 .7
Temper ature ( c c)
5.0
5.0
5.0
5.0
5.0
5.0
5.0
5 .0
5.0
5.0
5.0
5,0

TABLE 4.- - Chemical analyses of water for minor e lements
from test well 161-071-03CDD4
(Dissolved mineral constituents are in micrograms per l i tre (~g/1) except as indicated)
Constituent
Alum i num (Al) Arsenic (As) Barium (Ba) Beryllium (Be) Cadmium (Cd)
Chromium (Cr) Cobalt (Co) Copper (Cu) Cyanide (CN) (mg/1) Lead (Pb)
Lithium (Li) Mercury (Hg) Molybdenum (Mo) Nickel (Ni) Se l enium (Se)
Silver (Ag} Strontium (Sr) Vanadium (V)
• Zinc (Zn)
{ 1 )
Nov. 11, 1974 after pumping 26 hours at
150 gal/mi_n __
31
10 1
<100 <10
0
<10 0 2
.00 3
30 < • 1 3 0 0
<l 260
2.2 30
{ 2)
Nov. 27, 1974 after pump ing 71 hour s a t
120 gal/min
10 2
<100 <1 0
0
<10 0 2
. 00 1
30 < . 1 2 2 1
<1 260
1 . 8 30