Embed Size (px)
Citation preview
Results of Ambient Air Analysesin Support of Transport Rule
Presentation for RPO Workshop
November 2003

Results to be Covered
• What are the main constituents of PM2.5?
• Are these regionally or locally generated?
• What are the largest emission source types and where are they located?
• How consistent are the results based on ambient air analyses with those from modeling?

Sulfa te
Am m onium
N itra te
TC M
C rusta l
6 .20 18.69 31.18
What are the main constituents of PM2.5 in Urban Areas?
(1) Sulfate and Total Carbon dominate the eastern pies(2) Total Carbon dominant in the western pies, nitrate large
fraction in southern CA and SLC.

Sulfa teAm m oniumN itra teTC MC rusta l
1 .71 7.91 14.11
What are the main constituents of PM2.5 in Rural Areas?
(1) Sulfate and Total Carbon dominate the eastern pies.(2) West dominated by Total Carbon, crustal important in
southwest and eastern WA.

Sulfa teAm m oniumN itra teTC MC rusta l
1 .71 7.91 14.11
Comparison of Urban and Rural Composition
Sulfa te
Am m onium
N itra te
TC M
C rusta l
6 .20 18.69 31.18
Urban
Rural
Sulfa teAm m oniumN itra teTC MC rusta l
1 .71 7.91 14.11
Comparison of annual average (March 2001 - Feb 2002) PM2.5 mass and species concentrations. Urban data from EPA’s speciation network and rural data from IMPROVE network.

Regional vs. Urban Pollutants
0
5
10
15
20
25
0
2
4
6
8
10
PM2.5 Mass
0
2
4
6
8
10
Sulfate
0
2
4
6
8
10
Total Carbon
0
2
4
6
8
10
Nitrate
Ammonium
Co
nce
ntr
ati
on
(
g/m
3)
Comparison of annual average (March 2001 - Feb 2002) PM2.5 mass and species concentrations at paired urban and rural locations. Urban data from EPA’s speciation network and rural data from IMPROVE network. Average urban concentration is sum of estimated urban and regional contributions.
8

Regional vs. Urban Pollutants
Sulfate is mostly a regional problem...the urban excess is small.
Total Carbon appears to be both a regional and an urban problem, due to various sources of carbon. Total carbon has three components:+ Black Carbon (BC) – directly emitted, likely mostly urban+ Primary Organic Aerosols (POA) – directly emitted, likely mostly urban+ Secondary Organic Aerosols (SOA) from anthropogenic sources and from biogenic sources (coniferous trees) – likely both urban and regional problem.
Nitrate may be both an urban and a regional problem…note that urban excess tends to be higher in the North compared to the South due to climate.
Ammonium associates with Sulfate and Nitrate. Can be a regional and urban problem depending on the source of ammonia.
Crustal material (not shown) may be both an urban and a regional problem; very small amounts (<1 µg/m3) appear in both urban and rural areas, but may be generated from different sources.
Regional pollutants are typically observed at similar concentration levels across broad geographic areas. Urban
pollutants are typically highest in and near urban areas.0
5
10
15
20
25
0
2
4
6
8
10
PM2.5 Mass
0
2
4
6
8
10
Sulfate
0
2
4
6
8
10
Total Carbon
0
2
4
6
8
10
Nitrate
Ammonium
Co
nce
ntr
ati
on
(
g/m
3)
Comparison of annual average (March 2001 - Feb 2002) PM2.5 mass and species concentrations at paired urban and rural locations. Urban data from EPA’s speciation network and rural data from IMPROVE network. Average urban concentration is sum of estimated urban and regional contributions.
8

Regional vs. Urban PollutantsSulfate is mostly a regional problem...the urban excess is small.
Total Carbon appears to be both a regional and an urban problem, due to various sources of carbon. Total carbon has three components:+ Black Carbon (BC) – directly emitted, likely mostly urban+ Primary Organic Aerosols (POA) – directly emitted, likely mostly urban+ Secondary Organic Aerosols (SOA) from anthropogenic sources and from biogenic sources (coniferous trees) – likely both urban and regional problem.
Nitrate may be both an urban and a regional problem…note that urban excess tends to be higher in the North compared to the South due to climate.
Ammonium associates with Sulfate and Nitrate. Can be a regional and urban problem depending on the source of ammonia.
Crustal material (not shown) may be both an urban and a regional problem; very small amounts (<1 µg/m3) appear in both urban and rural areas, but may be generated from different sources.
8

What are the largest emission source types?
(Based on Source Apportionment Analyses)
(1) Sulfate source type is largest at all sites. Mobile and nitrate source types are second and third largest at all sites.
(2) Based on EPA-sponsored SA study in 8 urban areas.(3) EPA-sponsored 8-cities work consistent with results from recent compilation of > 17
published SA works.
0
5
10
15
20
25
Hou
ston
Bir
min
gham
Ch
arlo
tte
St.
Lou
is
Ind
ian
apol
is
Was
hin
gton
Milw
auk
ee
Bro
nx
Other
Mobile sources
Transported Nitrate
Transported Sulfate

Bronx
Birmingham CharlotteHouston
Indianapolis
Milwaukee
St. LouisDC
Regions for Largest Emission Source Type: (1) Features Unique to
Each City, (2) But They Intersect

Charlotte
“Sulfate” Source Regions Common to Multiple Sites
3+ 5+
Milwaukee
St. Louis
Indianapolis
Birmingham
DC
Bronx
Houston
1999 SO2 Emissions (Tons/Year)
Where is the Largest Emission Source Type Located?(Based on Multiple Cities)

Charlotte
“Sulfate” Source Regions Common to Multiple Sites
3+ 5+
Milwaukee
St. Louis
Indianapolis
Birmingham
DC
Bronx
Houston
1999 SO2 Emissions (Tons/Year)
Locations of SO2 emissions are consistent with high-probability regions for “Sulfate” source type.
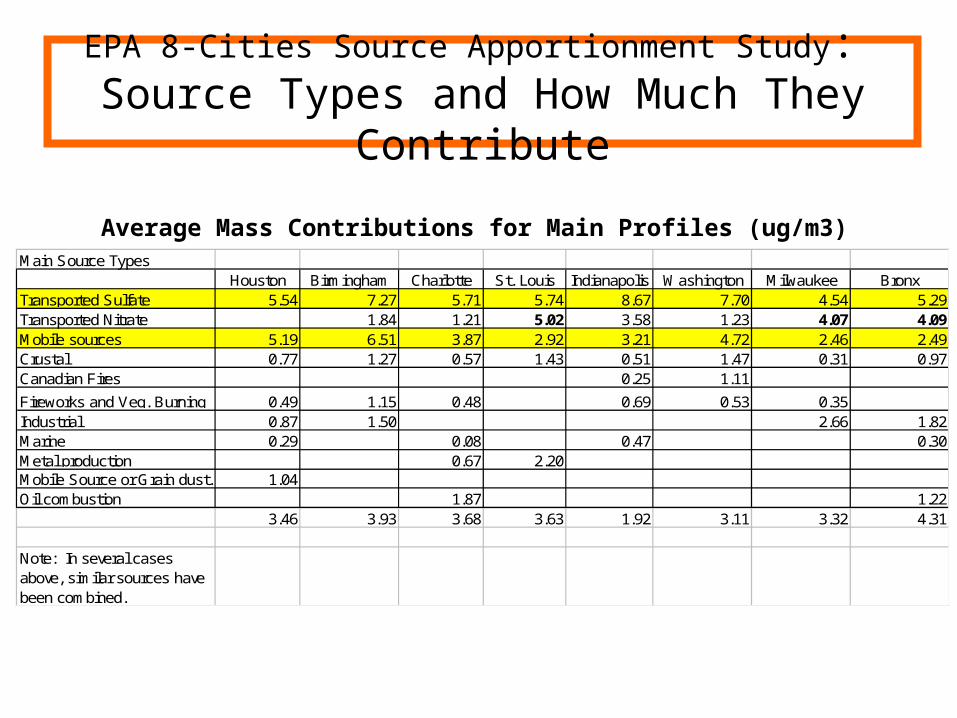
Main Source TypesHouston Birmingham Charlotte St. Louis Indianapolis Washington Milwaukee Bronx
Transported Sulfate 5.54 7.27 5.71 5.74 8.67 7.70 4.54 5.29Transported Nitrate 1.84 1.21 5.02 3.58 1.23 4.07 4.09Mobile sources 5.19 6.51 3.87 2.92 3.21 4.72 2.46 2.49Crustal 0.77 1.27 0.57 1.43 0.51 1.47 0.31 0.97Canadian Fires 0.25 1.11
Fireworks and Veg. Burning 0.49 1.15 0.48 0.69 0.53 0.35Industrial 0.87 1.50 2.66 1.82Marine 0.29 0.08 0.47 0.30Metal production 0.67 2.20Mobile Source or Grain dust. 1.04Oil combustion 1.87 1.22
3.46 3.93 3.68 3.63 1.92 3.11 3.32 4.31
Note: In several cases above, similar sources have been combined.
Average Mass Contributions for Main Profiles (ug/m3)
EPA 8-Cities Source Apportionment Study: Source Types and How Much They Contribute

Preliminary Consistency Check with Modeling Results
Comparison of Bronx Source Region for Sulfate and Zero Out Runs
• States with largest impact on Bronx all in High Probability Source Region.
• States with small impact on Bronx not in High Probability Source Region
State
Zero Out
Impact State
Zero Out
Impact
NY 1.97 CT 0.07PA 0.94 AL 0.05NJ 0.74 MN 0.05OH 0.41 MO 0.05
MD/DC 0.22 TX 0.05MI 0.21 IA 0.04VA 0.21 ND/VT 0.04WV 0.17 SC 0.04
IL 0.16 SD/NH 0.04IN 0.15 LA 0.03NC 0.13 AR 0.02MA 0.12 FL 0.02WI 0.10 MS 0.02
DE 0.09 NE/ME 0.02KY 0.09 CO 0.01GA 0.08 KS 0.01TN 0.08 MT 0.01
OK 0.01WY 0.01NM 0.00RI 0.00
States in High Probability
Source Region
States Not in High Probability Source Region
ug/m3 sulfate

Source Apportionment Compilation
• Review of Nearly 20 Recently Published Articles Using Source Apportionment Modeling
• Over 35 Eastern Locations• Common Themes
– Secondary Sulfate/Coal Combustion One of the Largest Sources in Almost All Studies
– Secondary Sulfate/Coal Combustion Over 50% of the Mass During Some Seasons (mostly summer) in Many Studies
– Secondary Organic Mass/Motor Vehicles Identified in Most Studies
– Nitrate Dominated Source Identified in About Half of the Studies (In studies where back trajectories were used, origin of source often pointed to areas associated with high ammonia emissions)

Locations Included in Compilation
PLUS:
SeattleSLC ValleyPhoenix

Recap
• Major species in east are sulfate, OC, and nitrate; in the west, OC and nitrate.
• Urban/rural comparison indicates that attainment in the East is not achievable just with local control measures.
• Main sources are combustion from utilities and mobile.
• Preliminary assessment shows consistent result from observed and predictive analyses.

Tabular Listing of LocationsLabel Location or Nearest City Label Location or Nearest City
1 Acadia National Park, ME 18 Bondville, IL
2 Lye Brook Wilderness, VT 19 St. Louis, MO
3 Underhill, VT 20 Boundary Waters Canoe Area, MN
4 Bronx, NY 21 Atlanta, GA
5 Connecticut Hill, NY 22 Yorkville, GA
6 Brigantine National Wildlife Refuge, NJ 23 Pensacola, FL
7 Arendtsville, PA 24 NW of Pensacola, FL
8 M.K. Goddard, PA 25 Birmingham, AL
9 Washington, DC 26 Centreville, AL
10 Jefferson/James River Face Wilderness, VI 27 Gulfport, MS
11 Shenandoah National Park, VI 28 Oak Grove, MS
12 Dolly Sods/Otter Creek Wilderness, WV 29 Houston, TX
13 Toronto, ON 30 Charlotte, NC
14 Quaker City, OH 31 Fort Meade, MD
15 Livonia, IN 32 Indianapolis, IN
16 Mammoth Cave National Park, KY 33 Milwaukee, WI
17 Great Smoky Mountains National Park, TN 34 Narragansett, RI