Embed Size (px)
Citation preview
1 Frey, Rasdorf, Lewis RESULTS OF A COMPREHENSIVE FIELD STUDY OF FUEL USE AND EMISSIONS
OF NONROAD DIESEL CONSTRUCTION EQUIPMENT
Corresponding Author H. Christopher Frey, Ph.D.
Professor Department of Civil, Construction, and Environmental Engineering
North Carolina State University Raleigh, NC 27695-7908
Telephone 919-515-1155, Fax 919-515-7908 Email [email protected]
William Rasdorf, Ph.D., P.E.
Professor Department of Civil, Construction, and Environmental Engineering
North Carolina State University Raleigh, NC 27695-7908
Telephone 919-515-7637, Fax 919-515-7908 Email [email protected]
Phil Lewis, Ph.D., P.E.
Construction Extension Specialist and Lecturer Department of Civil, Construction, and Environmental Engineering
North Carolina State University Raleigh, NC 27695-7908
Telephone 919-515-7430, Fax 919-515-7908 Email [email protected]
Submitted for Publication in Transportation Research Record February 17, 2010
Text words 5,708 plus 1,750 words for 5 Tables and 2 Figures = 7,459 Words
2 Frey, Rasdorf, Lewis
ABSTRACT There is limited field data that can be used for fuel use and emissions analyses of nonroad diesel construction equipment. This paper summarizes the results of field research that used a portable emission monitoring system (PEMS) to collect fuel use and emissions data from eight backhoes, six bulldozers, three excavators, four generators, six motor graders, three off-road trucks, one skid-steer loader, three track loaders, and five wheel loaders while they performed various duty cycles. These tests produced approximately 119 hours of field data for petroleum diesel and approximately 48 hours for B20 biodiesel. Engine attribute data including horsepower, displacement, model year, engine tier, and engine load were measured to determine their influence on fuel use rates and emission rates of NOx, HC, CO, CO2, and opacity. Mass per time fuel use rates were developed for each item of equipment as well as mass per time and mass per fuel used emission rates for each pollutant. For petroleum diesel, fuel use and emission rates of each pollutant were found to increase with engine displacement, horsepower, and load, and to decrease with model year and engine tier. The results were qualitatively similar for B20. Fuel-based emission rates were found to have less variability and less sensitivity to engine size and load than time-based emission rates. Hence, where possible, development of emission inventories based on fuel consumed, rather than time of activity, is preferred.
3 Frey, Rasdorf, Lewis
INTRODUCTION There are over two million items of diesel construction and mining equipment in the United States that consume almost 6 billion gallons of diesel fuel per year (1). This equipment emits nitrogen oxides (NOx), hydrocarbons (HC), carbon monoxide (CO), particulate matter (PM), and carbon dioxide (CO2). Fuel use and emissions estimates for construction equipment are typically based on steady-state engine dynamometer tests using uninstalled stationary engines in a laboratory; these tests, however, do not represent in-use equipment activity. Thus, there is a need to determine fuel use and emission rates based on in-use measurements. Field data can be used to quantify construction equipment activity and the influence of equipment duty cycles on fuel use and emissions.
North Carolina State University (NCSU) recently completed two field studies that quantified the fuel use, emissions, and engine performance data of 39 items of diesel-powered construction equipment as they performed common construction duty cycles on job sites (2, 3). The equipment includes eight backhoes, six bulldozers, three excavators, four generators, six motor graders, three off-road trucks, one skid-steer loader, three track loaders, and five wheel loaders. These items were tested while fueled with petroleum diesel. Furthermore, five of the backhoes, all six motor graders, and four of the wheel loaders were also tested with B20 biodiesel. Thus, a total of 54 field measurements were conducted. This research has produced an unprecedented database of real-world fuel use and emissions field data for diesel construction equipment. Although portions of this data are published in specific case studies, there has not yet been a comprehensive overview of trends within these extensive data.
The objective of this paper is to report and assess trends in this large body of field data. The results include engine size, engine model year, and engine tier; engine performance data related to engine load; representative duty cycles of the work performed by the equipment at the job site; and the related fuel use rates and emission rates of NOx, HC, CO, CO2, and PM. These data can be used to develop and improve diesel emission inventories, evaluate diesel emissions reduction programs and regulations, model diesel equipment fuel use and emissions, assess air quality impacts of alternative fuels, estimate CO2 emissions from diesel construction equipment, and develop fuel and emission inventories for construction projects. RELATED WORK There has been a lack of field data for in-use fuel consumption and emissions characteristics of construction equipment. The Environmental Protection Agency (EPA), West Virginia University (WVU), and Clean Air Technologies International, Inc (CATI) have conducted on-board in-use measurements of emissions from construction equipment (4 - 6). Not all of these data were quality assured nor are they all available for public use. Furthermore, it is not possible to investigate the relationship between the activity duty cycles versus fuel use and emissions based on these data.
Abolhassani et al. (7) evaluated the fuel use and emissions of excavators performing duty cycles in the field. Frey et al. (8) performed a comparison of petroleum diesel versus B20 biodiesel emissions from backhoes, motor graders, and wheel loaders performing field activities based on field data. Frey et al. (9) characterized the field activity, fuel use, and emissions of selected motor graders fueled with petroleum diesel and B20 biodiesel. Lewis et al. (10) examined requirements and incentives for reducing emissions from construction equipment and also advocated the use of field emissions data versus emissions data obtained from engine dynamometer tests. Lewis et al. (11) discussed the development and use of an emissions
4 Frey, Rasdorf, Lewis
inventory for a fleet of backhoes, front-end loaders, and motor graders to make fleet management decisions related to replacing older equipment with newer equipment. Pang et al. (12) quantified the tailpipe emissions and fuel cycle energy use for petroleum diesel and B20 biodiesel to support a comprehensive comparison of the difference in total fossil energy use, greenhouse gas emissions, and air pollutant emissions for substitution of B20 in place of petroleum diesel.
Frey and Bammi (13) developed probabilistic emission factors for NOx and HC based on engine dynamometer data from nonroad mobile sources including construction, farm, and industrial engines. Frey et al. (14) used field data from dump trucks to develop link-based emission factors for NOx, HC, CO, and PM. Although these were highway vehicles, this type of equipment is used extensively in construction and can be used to estimate the overall impact of emissions from construction activities. METHODOLOGY This section provides a brief overview of the field data collection and analysis process.Detailed documentation of these procedures is provided by Frey et al. (3) and Rasdorf et al. (15). Field Data Collection An on-board portable emissions monitoring system (PEMS) was used to gather engine, fuel use, and emissions data directly from in-use construction equipment. The PEMS used was the Montana System manufactured by CATI (16). The PEMS was secured to the body of the equipment. Sensors were connected to the engine to collect engine performance data related to engine speed, intake air temperature, and engine load. Tailpipe exhaust amples were drawn continuously to measure exhaust concentrations of NOx, HC, CO, CO2, and PM. These data were collected on a second-by-second basis, typically for three hours or more.
The original field data (referred to as “raw data”) underwent a rigorous quality assurance process to determine whether any errors or problems existed. This process is documented in detail by Frey et al (3). If any errors were found, they were corrected when possible. If the errors could not be corrected, the affected data were removed. The purpose of the quality assurance process was to produce a valid set of data (referred to as “processed data”). Engine Attributes Engine attributes that affect performance, fuel use, and emissions include engine size, engine age, engine tier, and engine load. Engine size is quantified based on rated horsepower and displacement. This information was collected in the field and verified with the engine manufacturer’s specifications, found in publications such as the Caterpillar Performance Handbook (17).
As engines increase in age, their performance may deteriorate (18). Consequently, engines may produce more emissions as they get older. Engine age was represented by the engine model year. Engine hours of operation are another attribute that can be used to measure engine age; however, insufficient data was collected for engine hours and therefore is not reported.
In 1994, EPA adopted an engine tier classification system for all new nonroad diesel engines. Engine tiers are emission standards that require diesel engines manufactured after a specified date to meet the performance levels specified in the standards. The EPA engine tier classifications include successive Tier 1, Tier 2, Tier 3, Tier 4 Transitional, and Tier 4 Final, which are effective in reducing emissions in a phased sequence from 1996 to 2013. Engine tiers
5 Frey, Rasdorf, Lewis
are essentially a hybrid engine attribute based on engine size (horsepower rating) and engine age (model year). The engine tier of each item of equipment was recorded.
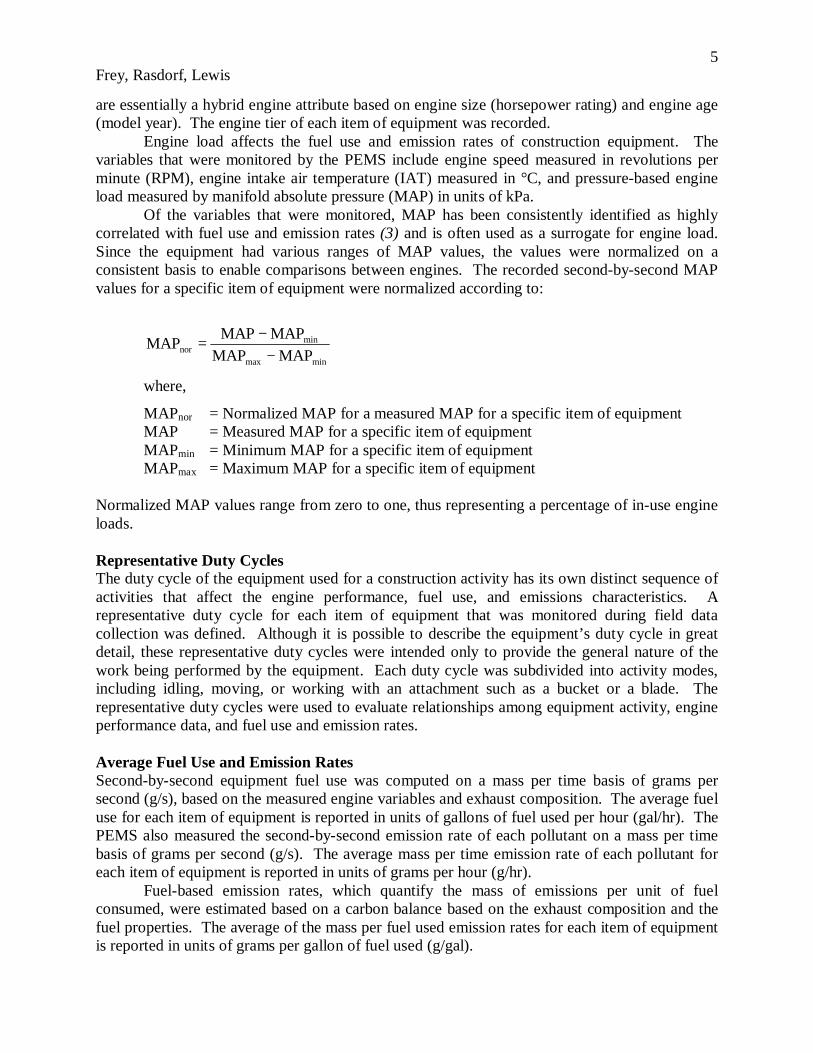
Engine load affects the fuel use and emission rates of construction equipment. The variables that were monitored by the PEMS include engine speed measured in revolutions per minute (RPM), engine intake air temperature (IAT) measured in °C, and pressure-based engine load measured by manifold absolute pressure (MAP) in units of kPa.
Of the variables that were monitored, MAP has been consistently identified as highly correlated with fuel use and emission rates (3) and is often used as a surrogate for engine load. Since the equipment had various ranges of MAP values, the values were normalized on a consistent basis to enable comparisons between engines. The recorded second-by-second MAP values for a specific item of equipment were normalized according to:
minmax
minnor MAPMAP
MAPMAPMAP−
−=
where,
MAPnor = Normalized MAP for a measured MAP for a specific item of equipment MAP = Measured MAP for a specific item of equipment MAPmin = Minimum MAP for a specific item of equipment MAPmax = Maximum MAP for a specific item of equipment
Normalized MAP values range from zero to one, thus representing a percentage of in-use engine loads. Representative Duty Cycles The duty cycle of the equipment used for a construction activity has its own distinct sequence of activities that affect the engine performance, fuel use, and emissions characteristics. A representative duty cycle for each item of equipment that was monitored during field data collection was defined. Although it is possible to describe the equipment’s duty cycle in great detail, these representative duty cycles were intended only to provide the general nature of the work being performed by the equipment. Each duty cycle was subdivided into activity modes, including idling, moving, or working with an attachment such as a bucket or a blade. The representative duty cycles were used to evaluate relationships among equipment activity, engine performance data, and fuel use and emission rates. Average Fuel Use and Emission Rates Second-by-second equipment fuel use was computed on a mass per time basis of grams per second (g/s), based on the measured engine variables and exhaust composition. The average fuel use for each item of equipment is reported in units of gallons of fuel used per hour (gal/hr). The PEMS also measured the second-by-second emission rate of each pollutant on a mass per time basis of grams per second (g/s). The average mass per time emission rate of each pollutant for each item of equipment is reported in units of grams per hour (g/hr).
Fuel-based emission rates, which quantify the mass of emissions per unit of fuel consumed, were estimated based on a carbon balance based on the exhaust composition and the fuel properties. The average of the mass per fuel used emission rates for each item of equipment is reported in units of grams per gallon of fuel used (g/gal).
6 Frey, Rasdorf, Lewis
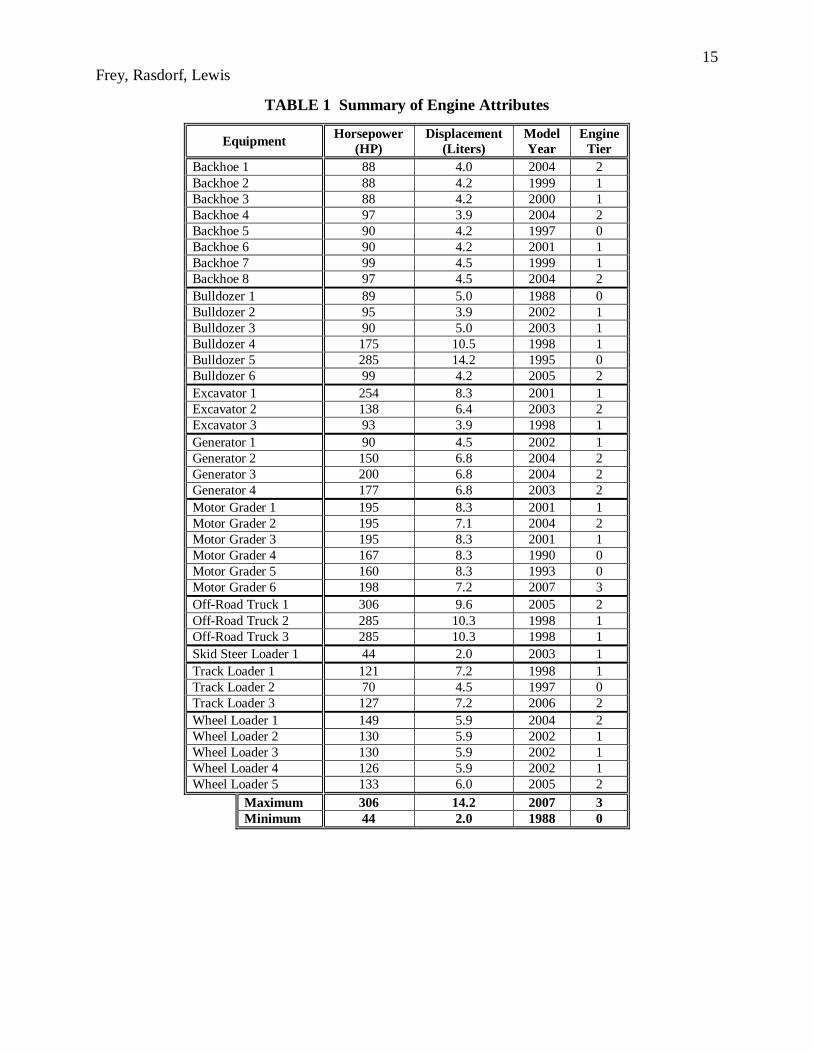
The term “fuel-based emission factors” only refers to estimating emissions per unit of fuel consumed (grams of pollutant per gallon of fuel consumed), as opposed to estimating emissions per unit of engine shaft output (grams per brake horsepower-hour) as has been the typical practice based on engine dynamometers. It is not possible to measure engine shaft output during actual operations; therefore, g/bhp-hr emission factors are not a convenient basis for developing practical emission inventories. Furthermore, the results of this research will indicate that fuel-based emission factors have less variability than time-based (gram of pollutant emitted per hour of operation) emission factors. Since one objective of this work is to support improved emission inventories, the most convenient form of an emission factor can be selected, irrespective of the regulatory framework used for engine certification testing.. A fuel-based emission factor can be developed for any fuel, and thus does not imply or exclude any particular regulatory approach. The average fuel use and emission rates of each pollutant were measured for all 39 items of equipment while they were fueled with petroleum diesel. Furthermore, five backhoes, six motor graders, and four wheel loaders were tested a second time while fueled with B20 biodiesel, thus providing a basis for comparison of fuel use and emission rates of construction equipment while using different types of fuel. The methodology used to collect the data was the same for each fuel type. RESULTS This section provides the results of the field data collection for the equipment that was tested. These results include engine attributes, representative duty cycles, and average fuel use and emission rates. Analyses of trends in the data are also provided. Field Data Collection The 54 tests yielded over 665,000 seconds (185 hours) of raw data. After the quality assurance process, nearly 604,000 seconds (168 hours) of processed data remained. Approximately 9% of the raw data were deemed invalid by the quality assurance process and were not included in the final processed dataset; thus, approximately 91% of the data collected in the field were available for use. Of the processed data, approximately 119 hours were associated with equipment fueled with petroleum diesel and approximately 48 hours were associated with B20 biodiesel. The PEMS estimated accurate emissions data for NOx, CO, and CO2. The emission rates of these pollutants are of the same magnitude of those found in other data sources, such as the EPA NONROAD model (1). The HC data tend to be biased low. The PM detection method for the PEMS is analogous to opacity. The field measurements are useful for relative comparisons of PM emission rates for different fuels or equipment types, but not for characterization of the absolute magnitude of PM emissions. The PM data reported here could be low by an order of magnitude according to previous comparisons of the opacity-based measurements to other PM data. Batelle (20) provides a detailed evaluation of the reporting accuracy of the PEMS. Engine Attributes Table 1 summarizes the engine attributes of the tested equipment. The rated horsepower of the equipment ranged from 44 hp for a skid-steer loader to 306 hp for an off-road hauler truck. The engine displacement ranged from 2.0 liter for a skid-steer loader to 14.2 liter for a bulldozer. The engine model years ranged from 1988 to 2007, with one engine from the 1980’s, 12 engines from the 1990’s, and 26 engines from the 2000’s; thus, the majority of the engines were less than ten
7 Frey, Rasdorf, Lewis
years old when they were tested. Engine Tiers 0 through 3 were represented in the dataset, with six Tier 0 engines, 19 Tier 1 engines, 13 Tier 2 engines, and one Tier 3 engine. The latter was a new motor grader that recently had been placed into service. Engine loads and their relationship to duty cycles are discussed in the following section. Representative Duty Cycles The representative duty cycle for each item of tested equipment is summarized in Table 2 for the equipment fueled with petroleum diesel and in Table 3 for the equipment fueled with B20 biodiesel. These duty cycles were related to grading and earthwork activities commonly performed on construction sites such as moving soil, moving rock, moving building materials, loading trucks, rough grading, fine grading, excavating soil, clearing and grubbing, and shaping soil stockpiles. For motor graders, the “Resurface” duty cycle refers to a dirt road maintenance activity that involved smoothing ruts in the road surface while using the full length of the motor grader’s blade; the “Shoulder” duty cycle refers to a highway maintenance activity that involved grading roadway shoulders and ditches while using only the end portion of the motor grader’s blade. The primary duty cycle of the generators was to provide a temporary source of electricity at a jobsite. Overall, there were 12 observed representative duty cycles during the 54 tests.
The average engine loads based on the normalized MAP values are summarized in Table 2 for the equipment fueled with petroleum diesel and in Table 3 for the equipment fueled with B20 biodiesel. The average engine loads correspond to each duty cycle.
For the equipment fueled with petroleum diesel, the skid-steer loader and generators have the highest overall average engine loads of 54% and 53%, respectively. The skid-steer loader average engine load, however, is based on one observation only; thus, there is no basis for comparison with other skid-steer loaders. Furthermore, generators are stationary equipment that does not move around a jobsite, thus there is limited variability in engine load.
The lowest overall average engine load is 8% for the off-road hauler trucks; however, such a low average engine load should be interpreted with caution. The duty cycles observed for these off-road trucks included long idle times while the trucks were waiting to be loaded and then moving at low speeds for very short haul distances. Off-road trucks frequently operate at high speeds over long distances while hauling heavy payloads and can therefore generate very high engine loads. Thus, the overall average engine load for off-road trucks presented here are not representative of all off-road truck duty cycles.
Backhoes and wheel loaders have similar overall average engine loads of 19% and 17%, respectively. Both types of equipment are wheel-mounted tractors with comparable body styles and front-loader buckets that are used to perform similar duty cycles, including loading trucks, moving soil, and moving building materials. Bulldozers and track loaders also have similar overall average engine loads of 24% and 29%, respectively. These are track-type tractors with comparable body styles and work attachments that perform similar duty cycles including rough grading, fine grading, stockpile shaping, and moving building materials. Although the average engine loads for these four types of equipment can be higher under extreme conditions, such as moving maximum payloads on an adverse grade, the average engine loads presented here are typical for the observed duty cycles.
Each of the three excavators was observed performing a separate duty cycle that had its own distinct average engine load. Based on this data, it is apparent that excavators can operate under a wide range of engine loads. For example, the average engine load of 21% for clearing and grubbing involved removing small-to-medium sized trees that did not require much effort
8 Frey, Rasdorf, Lewis
from the engine. Conversely, the average engine load of 52% involved moving heavy rock which required significant effort. For the excavating soil duty cycle, an average engine load of 40% was observed for the excavator while digging in common earth; however, the soil type may affect the engine load. A lower engine load would be expected for an excavator digging in sandy topsoil and a higher engine load would be expected for an excavator digging in hard-packed clay, although there was no opportunity to measure the engine loads for an excavating soil duty cycle for various soil types.
Motor graders were observed performing two separate duty cycles, including resurfacing and shouldering. Resurfacing had an average engine load of 39% and shouldering had an average engine load of 24%. The resurfacing duty cycle had a higher average engine load because the motor grader engaged the full length of its blade and thus had a higher resistance imposed by the ground. The shouldering duty cycle had a lower average engine load because only a fraction of the blade was engaged with the ground and thus had less resistance.
For the equipment fueled with B20 biodiesel, the overall average engine loads were quantitatively similar to the equipment fueled with petroleum diesel. Backhoes and wheel loaders had an overall average engine load of 22% and 19%, respectively (19% and 17%, respectively for petroleum diesel). For motor graders, the overall average engine load for resurfacing was 39%, the same as petroleum diesel, and 22% for shouldering (24% for petroleum diesel). Thus, as expected, fuel type has no significant impact on average engine loads and the slight variability in average engine loads based on fuel type shown here can be attributed to the variation in the individual duty cycles that were measured. Average Fuel Use and Emission Rates The average time-based fuel use and emission rates and the average fuel-based emission rates are summarized in Table 2 for the equipment fueled with petroleum diesel and in Table 3 for the equipment fueled with B20 biodiesel. The average fuel use and emission rates for each item of equipment correspond to the duty cycle and engine attribute data including horsepower, displacement, model year, engine tier, and engine load. Furthermore, the correlation coefficients for fuel use and emission rates versus engine attributes are presented in Tables 4 and 5 for the equipment fueled with petroleum diesel and B20 biodiesel, respectively.
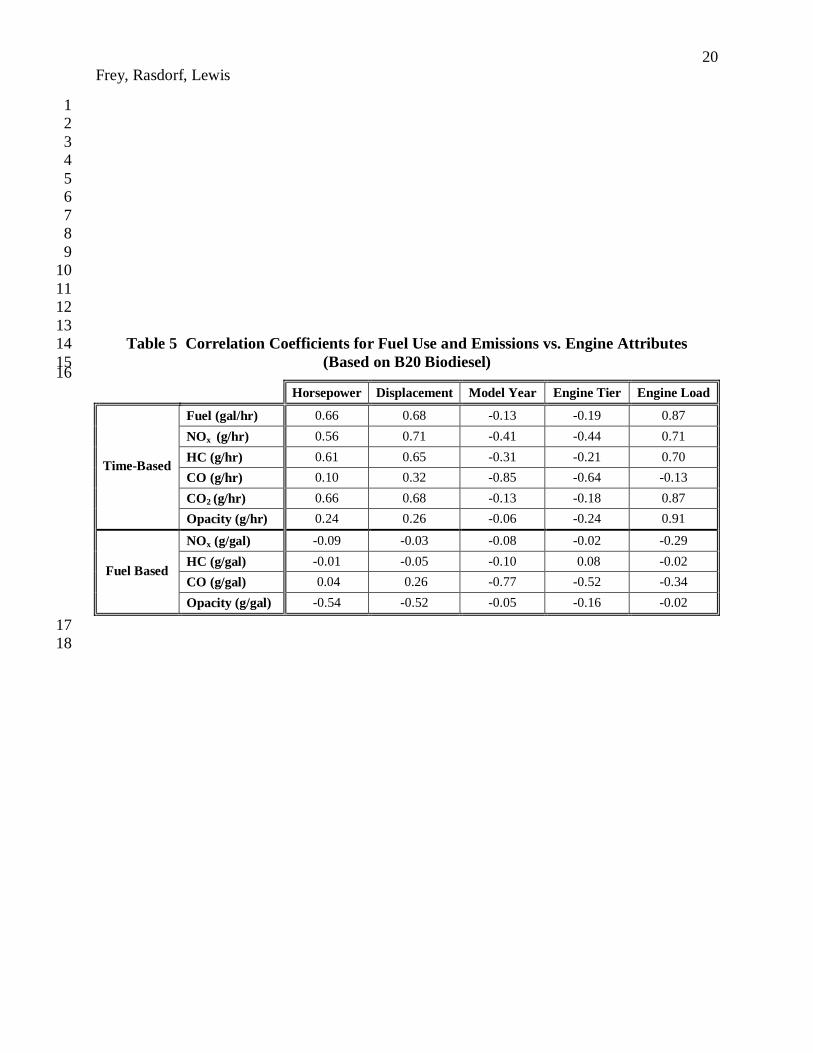
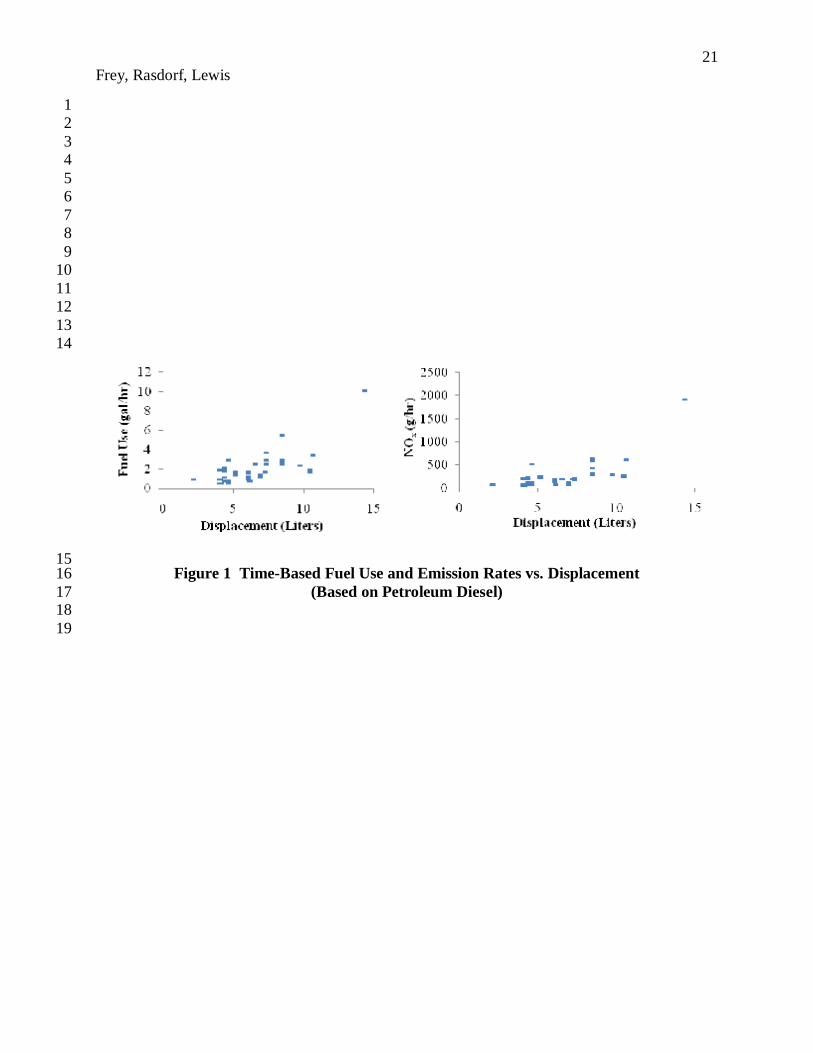
Based on Table 4, the time-based fuel use and emission rates of each pollutant have a strong positive relationship with displacement and a moderate positive relationship with horsepower; thus, engine size has the greatest impact on time-based petroleum diesel fuel use and emission rates of NOx, HC, CO, CO2 and opacity. As examples, scatterplots for the relationships of fuel use and NOx emission rates versus displacement are presented in Figure 1. These plots represent the linear increase in fuel use and NOx emission rates as displacement increases. Although not shown, similar trends exist in the emission rates of the other pollutants. Based on Table 5, the time-based fuel use and emission rates of NOx, HC, CO2, and opacity have a strong positive relationship with engine load; CO emission rates have a strong negative relationship with model year. Fuel use and NOx, HC, and CO2 emission rates also have a strong positive relationship with horsepower and displacement. Overall, engine load has the most significant impact on B20 biodiesel time-based fuel use and emission rates of NOx, HC, CO2, and opacity; model year has the most significant impact on CO emission rates. Engine displacement was the most highly correlated factor for petroleum diesel fuel use and emission rates in part because there was large variability of a factor of more than 6, from 44 to 306 hp, in displacement among those data. For the equipment tested using B20 fuel,
9 Frey, Rasdorf, Lewis
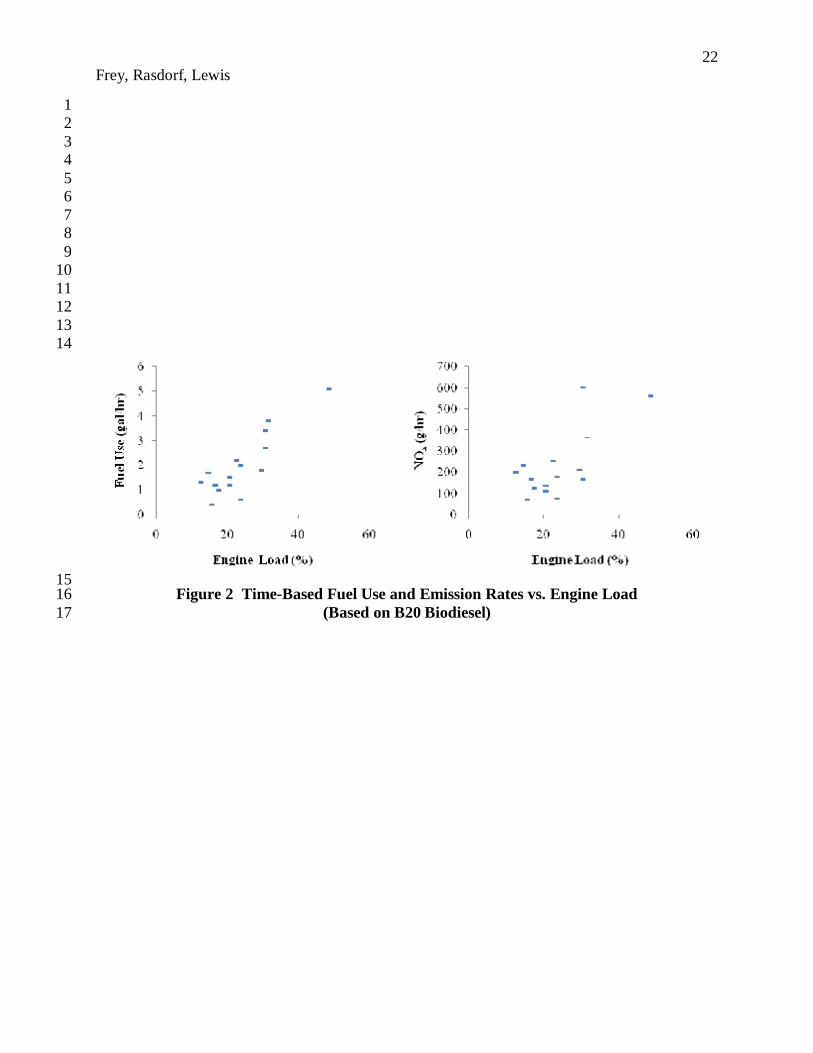
displacement varied by only a factor of approximately 2, from 90 to 198 hp. However, for the tests on B20 fuel, engine load varied by a factor of 4, from 12 to 48 percent. Hence, the identification of engine load as most highly correlated with fuel use rate and most of the emission rates for B20 is in part an artifact of the range of variation of this factor in the sample data set. As examples, scatterplots for the relationships of fuel use and NOx versus engine load are presented in Figure 2. These plots represent the linear increase in fuel use and NOx emissions with an increase in engine load. Although not shown, there are similar trends in the data for HC, CO2, and opacity with respect to engine load; however, CO emission rates decrease as the model year increases.
Based on Tables 4 and 5, there is a negative relationship of fuel use and emission rates versus model year and engine tier, regardless of fuel type. Although these relationships are relatively weak, they still imply that newer model engines and engine tier standards have been effective at reducing fuel use and emissions.
Based on Tables 4 and 5, fuel-based emission rates have relatively weak relationships with the measured engine attributes of horsepower, displacement, model year, engine tier, and engine load. This does not mean, however, that fuel-based emission rates are unreliable. In fact, fuel-based emission rates tend to have less variability than time-based emission rates and therefore are effective for emissions analyses. Based on the data in Table 2, the petroleum diesel fuel-based emission rates have coefficients of variation (standard deviation divided by the mean) that are lower than the time-based emission rates’ by approximately 73% for NOx, 34% for HC, 14% for CO, and 42% for opacity; the average fuel-based emission rate of CO2 for all equipment that was measured using petroleum diesel is approximately 9,900 g/gal ± 2%. Based on the data in Table 3, the B20 biodiesel fuel-based emission rates have coefficients of variation that are lower than the time-based emission rates’ by approximately 65% for NOx, 8% for HC, 51% for CO, and 32% for opacity; the average fuel-based emission rate CO2 for all equipment that was measured using B20 biodiesel is approximately 9,700 g/gal ± 5%. Overall, the relative range of variation for fuel-based emission rates is lower than time-based emission rates. A comparison of results between B20 and petroleum diesel for the 15 vehicles that were measured using both fuels needs to be done on a consistent basis for the same duty cycles for each type of equipment, in order to avoid the confounding effect of inter-test variability in duty cycle. Frey et al. (8) developed and applied engine load-based modal models of fuel use and emission rates, and for each equipment item used the same distribution of engine load, to enable comparison between the two fuels for the same duty cycle. On average over all 15 vehicles tested, time-based NO emission rates were 2 percent lower for B20 than petroleum diesel, which is not a statistically significant result. However, time-based emission rates were lower by 18, 26, and 25 percent for PM, HC, and CO, respectively, which are significant. CONCLUSIONS & RECOMMENDATIONS There is a need for accurate fuel use and emissions data for in-use nonroad diesel construction equipment. This type of data can be used to assess the environmental impacts of construction activities, particularly with regard to energy use and air quality. The work presented here provides a solid foundation for developing comprehensive datasets of fuel use and emissions information; however, more research needs to be done. The research that produced these results should be continued to observe more equipment of the same type in order to refine the current data and also gather data from other non-represented equipment types.
10 Frey, Rasdorf, Lewis
Fuel use and emissions field data collected by an on-board PEMS has an advantage over laboratory dynamometer testing in that the field data represents actual in-use conditions for the equipment as opposed to simulated conditions. Thus, PEMS data are useful for developing emission inventories that are representative of actual vehicle operations in the field; however, the methods and results presented here are not intended as a certification test or to replace existing certification tests. The field data results presented here have been quality assured and benchmarked to independent data, and are considered valid. These data should be used as a complement to existing emissions data, including the EPA NONROAD emission factors, in order to provide in-depth analyses of nonroad emission sources, including construction equipment. The construction activities being performed by the equipment presented here were characterized by representative duty cycles; therefore, the corresponding fuel use and emissions for the construction activity itself can be compared to the quantity of work completed by the equipment. By linking construction quantities to fuel use and emissions, it is possible to establish fuel use and emission factors based on construction quantities, such as the cubic yards of excavation per gallon of fuel used by an excavator or the grams of pollutant emitted per mile of roadway shoulder scraped by a motor grader. These emission factors can then be used to estimate the fuel use requirements and the pollutants emitted for a construction project based on a quantity takeoff from a set of construction plans and specifications. Petroleum diesel and B20 biodiesel fuel use and time-based emission rates, in most cases, have a strong positive relationship with engine displacement, horsepower, and load. For both fuels, time-based fuel and emission rates were inversely proportional to model year and engine tier. These types of trends should be investigated further and used for modeling fuel use and emissions as a function of equipment type, engine size, engine load, and model year or engine tier.
Fuel-based emission rates tend to have less variability than time-based emission rates. Hence, development of emissions inventories based on quantifying fuel consumed, rather than time of operation, is preferred where possible. The data presented here may be used to evaluate fuel use and emission rates based on equipment type, fuel type, and engine attributes including horsepower, displacement, model year, engine tier, and engine load. These comparisons permit fuel use and emissions considerations to be used when making fleet management decisions such as selecting equipment for a specific activity or evaluating the equipment’s useful life and deterioration rates. Fleet managers should consider the impact of fuel use and emissions when determining which equipment to use on a project and also when to retire, replace, or retrofit existing equipment. The results presented here may be used as a basis for establishing emissions inventories of construction projects to help determine their emissions footprint. These types of emission inventories may be used to assess the environmental impact of construction projects at the local, state, regional, and national levels. Environmental planners and policy-makers should consider such emissions inventories when developing pollution reduction strategies and regulations, particularly for the construction industry.

11 Frey, Rasdorf, Lewis
ACKNOWLEDGEMENT This material is based upon work supported by the National Science Foundation through Grant No. 0327731 and also by the North Carolina Department of Transportation through Research Project No. HWY - 2006 – 08. Any opinions, findings, and conclusions or recommendations expressed in this material are those of the authors and do not necessarily reflect the views of the NSF or the NCDOT. Saeed Abolhasani, M.S.CE, Hyung-Wook Choi, Ph.D., Kangwook Kim, Ph. D., and Shih-Hao Pang, Ph.D. assisted with data collection and analysis.
12 Frey, Rasdorf, Lewis
REFERENCES 1. EPA. User’s Guide for the Final NONROAD2005 Model. EPA-420-R-05-013, U.S.
Environmental Protection Agency, Office of Transportation and Air Quality, Ann Arbor, MI, 2005.
2. Frey, C., W. Rasdorf, K. Kim, S. Pang, P. Lewis, and S. Abolhassani. Life Cycle Inventory and Impact Analysis Framework for Nonroad Construction Vehicles and Equipment (TSE03-L). Research Project for National Science Foundation, Arlington, VA, 2007.
3. Frey, C., W. Rasdorf, K. Kim, S.H. Pang, P. Lewis, and S. Abolhassani. Real-World Duty Cycles and Utilization for Construction Equipment in North Carolina. FHWA/NC/ 2006 – 55, Prepared by North Carolina State University for North Carolina Department of Transportation, Raleigh, NC, 2008.
4. May, D.; L. Fisher, C. Tennis, and T. Parrish. Simple, Portable, On-vehicle Testing (SPOT) Final Report. Contract number 86-C-01-106, Prepared by Analytical Engineering, Inc. for the U.S. Environmental Protection Agency, Columbus, IN, 2002.
5. Gautam, M., D. Carder, N. Clark, and D. Lyons. Testing for Exhaust Emissions of Diesel Powered Off-Road Engines. APB contract number 98-317, Prepared by West Virginia University for the California Air Resources Board and the California EPA, Sacramento, 2002.
6. Vojtisek-Lom, M. Real-World Exhaust Emissions from Construction Equipment at the World Trade Center #7 Site. Prepared by Clean Air Technologies International, Inc. for Northeast States for Coordinated Air Use Management, Buffalo, NY, 2003.
7. Abolhasani, S., C. Frey, K. Kim, S. Pang, W. Rasdorf, and P. Lewis. Real-World In-Use Activity, Fuel Use, and Emissions for Nonroad Construction Vehicles: A Case Study for Excavators, Journal of the Air & Waste Management Association, Vol. 58, No. 8, pp. 1033-1046, 2008.
8. Frey, C., W. Rasdorf, K. Kim, S. Pang, and P. Lewis. Comparison of Real World Emissions of Backhoes, Front-End Loaders, and Motor Graders for B20 Biodiesel vs. Petroleum Diesel and for Selected Engine Tiers. In Transportation Research Record: Journal of the Transportation Research Board, No. 2058, Transportation Research Board of the National Academies, Washington, D.C., pp. 33-42, 2008.
9. Frey, C., K. Kim, W. Rasdorf, S. Pang, and P. Lewis. Characterization of Real-World Activity, Fuel Use, and Emissions of Selected Motor Graders Fueled with Petroleum Diesel and B20 Biodiesel. Journal of the Air & Waste Management Association, Vol. 58, No. 10, pp 1274-1287, 2008.
10. Lewis, P., W. Rasdorf, C. Frey, K. Kim, and S. Pang. Requirements and Incentives for Reducing Construction Vehicle Emissions and Comparison of Nonroad Diesel Engine Emissions Data Sources, Journal of Construction Engineering and Management, Vol. 135, No. 5, pp. 341-351, 2009.
13 Frey, Rasdorf, Lewis
11. Lewis, P., C. Frey, and W. Rasdorf. Development and Use of Emissions Inventories for Construction Vehicles. In Transportation Research Record: Journal of the Transportation Research Board, Transportation Research Board of the National Academies, Washington, D.C., 2009, (In Press TRB09-1485).
12. Pang, S., C. Frey, and W. Rasdorf. Life Cycle Inventory Energy Consumption and Emissions for Biodiesel versus Petroleum Diesel Fueled Construction Vehicles, Environmental Science and Technology, Vol. 43, No. 16, pp. 6398-6405, 2009.
13. Frey, C. and S. Bammi. Probabilistic Nonroad Mobile Source Emission Factors. Journal of Environmental Engineering, Vol. 129, No. 2, pp. 162-168,2003.
14. Frey, C., N. Rouphail, and H. Zhai. Link-Based Emission Factors for Heavy-Duty Diesel Trucks Based on Real-World Data. In Transportation Research Record: Journal of the Transportation Research Board, No. 2058, Transportation Research Board of the National Academies, Washington, D.C., 2008, pp. 23 – 32.
15. Rasdorf, W., C. Frey, P. Lewis, K. Kim S. Pang, and S. Abolhassani. Field Procedures for Real-World Measurements of Emissions from Diesel Construction Vehicles. Journal of Infrastructure Systems, Submitted October 2008.
16. CATI. OEM-2100 Montana System Operation Manual, Clean Air Technologies International, Inc., Buffalo, NY, 2003.
17. CAT. Caterpillar Performance Handbook, Edition 35, Caterpillar, Inc., Peoria, IL, 2004. 18. Nichols, H. and D. Day. Moving the Earth: The Workbook of Excavation, The McGraw-
Hill Companies, Inc., New York, NY, 2005. 19. EPA. Exhaust and Crankcase Emission Factors for Nonroad Engine Modeling -
Compression-Ignition. EPA-420-P-04-009, NR-009c, U.S. Environmental Protection Agency, Ann Arbor, MI, 2004.
20. Battelle. Environmental Technology Verification Report: Clean Air Technologies International, Inc. REMOTE On-Board Emissions Monitor, Prepared by Battelle for the U.S. Environmental Protection Agency, Columbus, OH, 2003.
14 Frey, Rasdorf, Lewis
LIST OF TABLES AND FIGURES
TABLE 1 Summary of Engine Attributes
TABLE 2 Summary Data for Petroleum Diesel
TABLE 3 Summary Data for B20 Biodiesel
Table 4 Correlation Coefficients for Fuel Use and Emissions vs. Engine Attributes (Based on Petroleum Diesel)
Table 5 Correlation Coefficients for Fuel Use and Emissions vs. Engine Attributes (Based on B20 Biodiesel)
Figure 1 Time-Based Fuel Use and Emission Rates vs. Displacement (Based on Petroleum Diesel)
Figure 2 Time-Based Fuel Use and Emission Rates vs. Engine Load (Based on B20 Biodiesel)
15 Frey, Rasdorf, Lewis
TABLE 1 Summary of Engine Attributes
Equipment Horsepower (HP)
Displacement (Liters)
Model Year
Engine Tier
Backhoe 1 88 4.0 2004 2 Backhoe 2 88 4.2 1999 1 Backhoe 3 88 4.2 2000 1 Backhoe 4 97 3.9 2004 2 Backhoe 5 90 4.2 1997 0 Backhoe 6 90 4.2 2001 1 Backhoe 7 99 4.5 1999 1 Backhoe 8 97 4.5 2004 2 Bulldozer 1 89 5.0 1988 0 Bulldozer 2 95 3.9 2002 1 Bulldozer 3 90 5.0 2003 1 Bulldozer 4 175 10.5 1998 1 Bulldozer 5 285 14.2 1995 0 Bulldozer 6 99 4.2 2005 2 Excavator 1 254 8.3 2001 1 Excavator 2 138 6.4 2003 2 Excavator 3 93 3.9 1998 1 Generator 1 90 4.5 2002 1 Generator 2 150 6.8 2004 2 Generator 3 200 6.8 2004 2 Generator 4 177 6.8 2003 2 Motor Grader 1 195 8.3 2001 1 Motor Grader 2 195 7.1 2004 2 Motor Grader 3 195 8.3 2001 1 Motor Grader 4 167 8.3 1990 0 Motor Grader 5 160 8.3 1993 0 Motor Grader 6 198 7.2 2007 3 Off-Road Truck 1 306 9.6 2005 2 Off-Road Truck 2 285 10.3 1998 1 Off-Road Truck 3 285 10.3 1998 1 Skid Steer Loader 1 44 2.0 2003 1 Track Loader 1 121 7.2 1998 1 Track Loader 2 70 4.5 1997 0 Track Loader 3 127 7.2 2006 2 Wheel Loader 1 149 5.9 2004 2 Wheel Loader 2 130 5.9 2002 1 Wheel Loader 3 130 5.9 2002 1 Wheel Loader 4 126 5.9 2002 1 Wheel Loader 5 133 6.0 2005 2
Maximum 306 14.2 2007 3 Minimum 44 2.0 1988 0
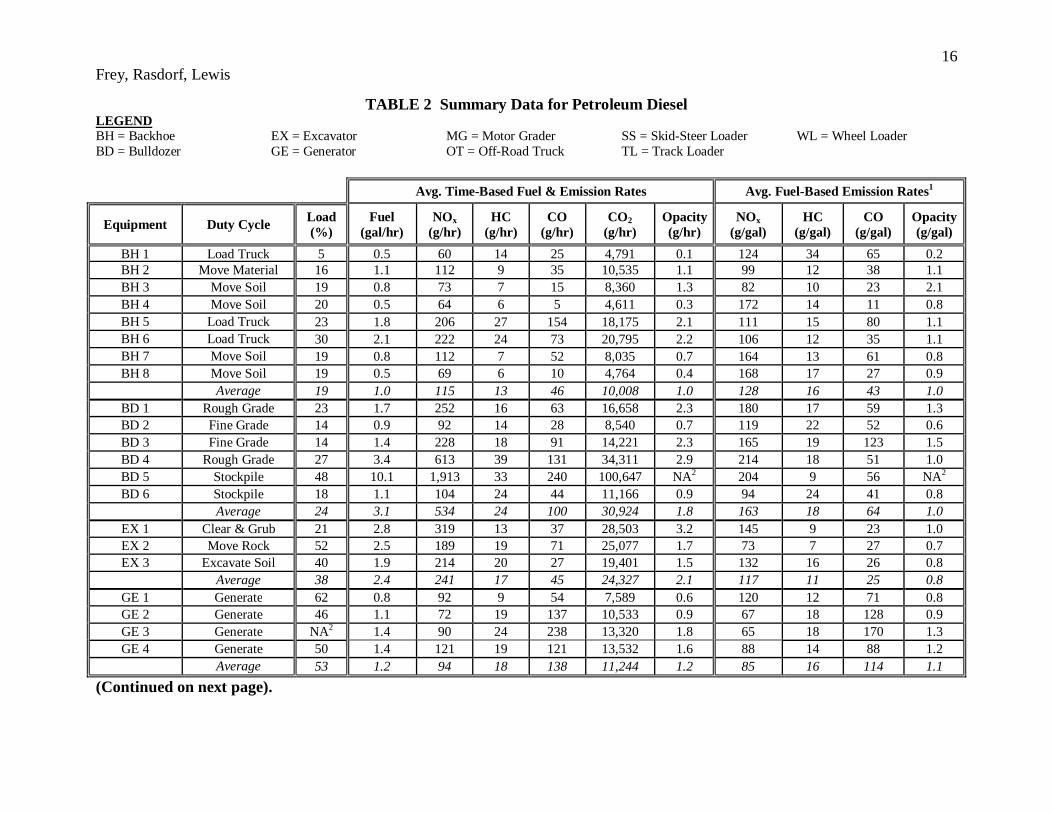
16 Frey, Rasdorf, Lewis
TABLE 2 Summary Data for Petroleum Diesel LEGEND
BH = Backhoe EX = Excavator MG = Motor Grader SS = Skid-Steer Loader WL = Wheel Loader BD = Bulldozer GE = Generator OT = Off-Road Truck TL = Track Loader Avg. Time-Based Fuel & Emission Rates Avg. Fuel-Based Emission Rates1
Equipment Duty Cycle Load (%)
Fuel (gal/hr)
NOx (g/hr)
HC (g/hr)
CO (g/hr)
CO2 (g/hr)
Opacity (g/hr)
NOx (g/gal)
HC (g/gal)
CO (g/gal)
Opacity (g/gal)
BH 1 Load Truck 5 0.5 60 14 25 4,791 0.1 124 34 65 0.2 BH 2 Move Material 16 1.1 112 9 35 10,535 1.1 99 12 38 1.1 BH 3 Move Soil 19 0.8 73 7 15 8,360 1.3 82 10 23 2.1 BH 4 Move Soil 20 0.5 64 6 5 4,611 0.3 172 14 11 0.8 BH 5 Load Truck 23 1.8 206 27 154 18,175 2.1 111 15 80 1.1 BH 6 Load Truck 30 2.1 222 24 73 20,795 2.2 106 12 35 1.1 BH 7 Move Soil 19 0.8 112 7 52 8,035 0.7 164 13 61 0.8 BH 8 Move Soil 19 0.5 69 6 10 4,764 0.4 168 17 27 0.9
Average 19 1.0 115 13 46 10,008 1.0 128 16 43 1.0 BD 1 Rough Grade 23 1.7 252 16 63 16,658 2.3 180 17 59 1.3 BD 2 Fine Grade 14 0.9 92 14 28 8,540 0.7 119 22 52 0.6 BD 3 Fine Grade 14 1.4 228 18 91 14,221 2.3 165 19 123 1.5 BD 4 Rough Grade 27 3.4 613 39 131 34,311 2.9 214 18 51 1.0 BD 5 Stockpile 48 10.1 1,913 33 240 100,647 NA2 204 9 56 NA2 BD 6 Stockpile 18 1.1 104 24 44 11,166 0.9 94 24 41 0.8
Average 24 3.1 534 24 100 30,924 1.8 163 18 64 1.0 EX 1 Clear & Grub 21 2.8 319 13 37 28,503 3.2 145 9 23 1.0 EX 2 Move Rock 52 2.5 189 19 71 25,077 1.7 73 7 27 0.7 EX 3 Excavate Soil 40 1.9 214 20 27 19,401 1.5 132 16 26 0.8
Average 38 2.4 241 17 45 24,327 2.1 117 11 25 0.8 GE 1 Generate 62 0.8 92 9 54 7,589 0.6 120 12 71 0.8 GE 2 Generate 46 1.1 72 19 137 10,533 0.9 67 18 128 0.9 GE 3 Generate NA2 1.4 90 24 238 13,320 1.8 65 18 170 1.3 GE 4 Generate 50 1.4 121 19 121 13,532 1.6 88 14 88 1.2
Average 53 1.2 94 18 138 11,244 1.2 85 16 114 1.1 (Continued on next page).
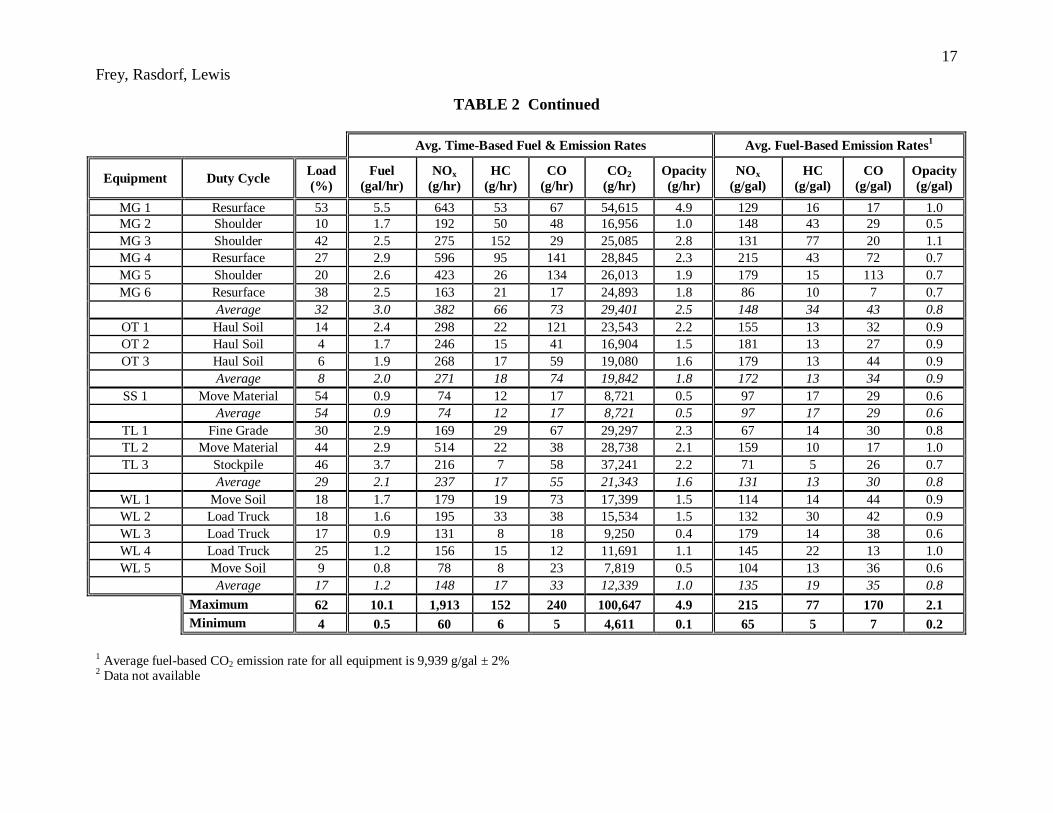
17 Frey, Rasdorf, Lewis
TABLE 2 Continued Avg. Time-Based Fuel & Emission Rates Avg. Fuel-Based Emission Rates1
Equipment Duty Cycle Load (%)
Fuel (gal/hr)
NOx (g/hr)
HC (g/hr)
CO (g/hr)
CO2 (g/hr)
Opacity (g/hr)
NOx (g/gal)
HC (g/gal)
CO (g/gal)
Opacity (g/gal)
MG 1 Resurface 53 5.5 643 53 67 54,615 4.9 129 16 17 1.0 MG 2 Shoulder 10 1.7 192 50 48 16,956 1.0 148 43 29 0.5 MG 3 Shoulder 42 2.5 275 152 29 25,085 2.8 131 77 20 1.1 MG 4 Resurface 27 2.9 596 95 141 28,845 2.3 215 43 72 0.7 MG 5 Shoulder 20 2.6 423 26 134 26,013 1.9 179 15 113 0.7 MG 6 Resurface 38 2.5 163 21 17 24,893 1.8 86 10 7 0.7
Average 32 3.0 382 66 73 29,401 2.5 148 34 43 0.8 OT 1 Haul Soil 14 2.4 298 22 121 23,543 2.2 155 13 32 0.9 OT 2 Haul Soil 4 1.7 246 15 41 16,904 1.5 181 13 27 0.9 OT 3 Haul Soil 6 1.9 268 17 59 19,080 1.6 179 13 44 0.9
Average 8 2.0 271 18 74 19,842 1.8 172 13 34 0.9 SS 1 Move Material 54 0.9 74 12 17 8,721 0.5 97 17 29 0.6
Average 54 0.9 74 12 17 8,721 0.5 97 17 29 0.6 TL 1 Fine Grade 30 2.9 169 29 67 29,297 2.3 67 14 30 0.8 TL 2 Move Material 44 2.9 514 22 38 28,738 2.1 159 10 17 1.0 TL 3 Stockpile 46 3.7 216 7 58 37,241 2.2 71 5 26 0.7
Average 29 2.1 237 17 55 21,343 1.6 131 13 30 0.8 WL 1 Move Soil 18 1.7 179 19 73 17,399 1.5 114 14 44 0.9 WL 2 Load Truck 18 1.6 195 33 38 15,534 1.5 132 30 42 0.9 WL 3 Load Truck 17 0.9 131 8 18 9,250 0.4 179 14 38 0.6 WL 4 Load Truck 25 1.2 156 15 12 11,691 1.1 145 22 13 1.0 WL 5 Move Soil 9 0.8 78 8 23 7,819 0.5 104 13 36 0.6
Average 17 1.2 148 17 33 12,339 1.0 135 19 35 0.8 Maximum 62 10.1 1,913 152 240 100,647 4.9 215 77 170 2.1 Minimum 4 0.5 60 6 5 4,611 0.1 65 5 7 0.2
1 Average fuel-based CO2 emission rate for all equipment is 9,939 g/gal ± 2% 2 Data not available
18 Frey, Rasdorf, Lewis
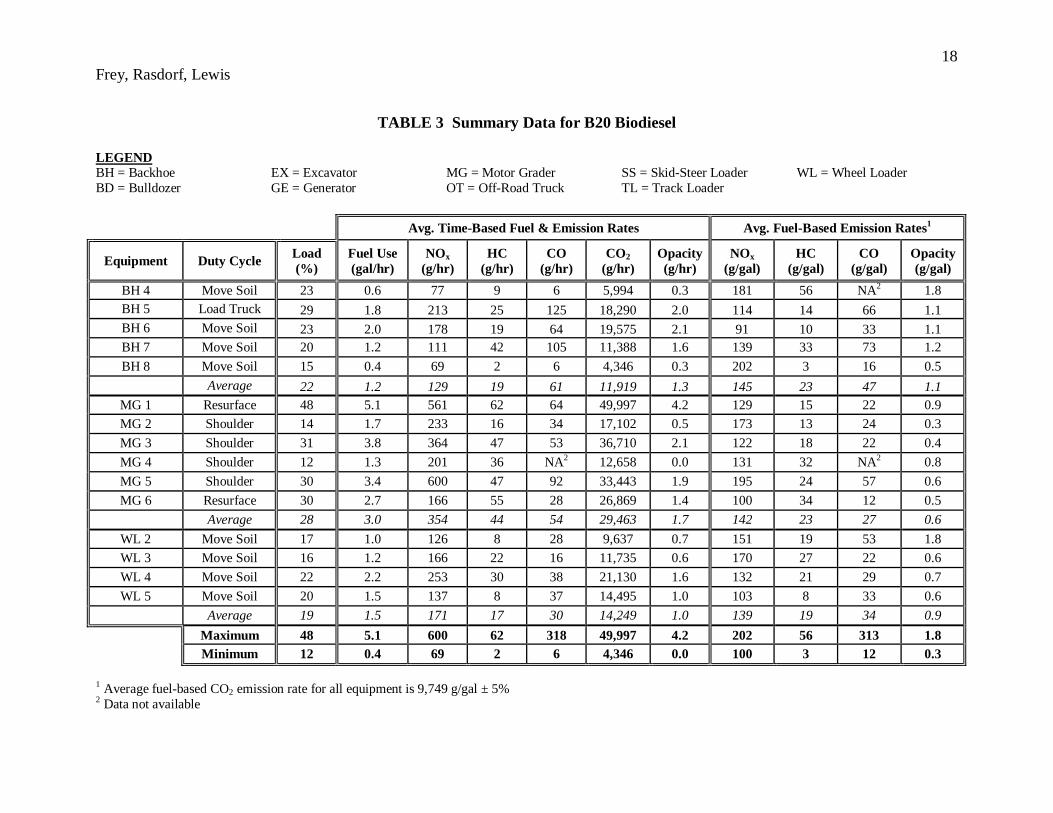
TABLE 3 Summary Data for B20 Biodiesel
LEGEND BH = Backhoe EX = Excavator MG = Motor Grader SS = Skid-Steer Loader WL = Wheel Loader BD = Bulldozer GE = Generator OT = Off-Road Truck TL = Track Loader Avg. Time-Based Fuel & Emission Rates Avg. Fuel-Based Emission Rates1
Equipment Duty Cycle Load (%)
Fuel Use (gal/hr)
NOx (g/hr)
HC (g/hr)
CO (g/hr)
CO2 (g/hr)
Opacity (g/hr)
NOx (g/gal)
HC (g/gal)
CO (g/gal)
Opacity (g/gal)
BH 4 Move Soil 23 0.6 77 9 6 5,994 0.3 181 56 NA2 1.8 BH 5 Load Truck 29 1.8 213 25 125 18,290 2.0 114 14 66 1.1 BH 6 Move Soil 23 2.0 178 19 64 19,575 2.1 91 10 33 1.1 BH 7 Move Soil 20 1.2 111 42 105 11,388 1.6 139 33 73 1.2 BH 8 Move Soil 15 0.4 69 2 6 4,346 0.3 202 3 16 0.5
Average 22 1.2 129 19 61 11,919 1.3 145 23 47 1.1 MG 1 Resurface 48 5.1 561 62 64 49,997 4.2 129 15 22 0.9 MG 2 Shoulder 14 1.7 233 16 34 17,102 0.5 173 13 24 0.3 MG 3 Shoulder 31 3.8 364 47 53 36,710 2.1 122 18 22 0.4 MG 4 Shoulder 12 1.3 201 36 NA2 12,658 0.0 131 32 NA2 0.8 MG 5 Shoulder 30 3.4 600 47 92 33,443 1.9 195 24 57 0.6 MG 6 Resurface 30 2.7 166 55 28 26,869 1.4 100 34 12 0.5
Average 28 3.0 354 44 54 29,463 1.7 142 23 27 0.6 WL 2 Move Soil 17 1.0 126 8 28 9,637 0.7 151 19 53 1.8 WL 3 Move Soil 16 1.2 166 22 16 11,735 0.6 170 27 22 0.6 WL 4 Move Soil 22 2.2 253 30 38 21,130 1.6 132 21 29 0.7 WL 5 Move Soil 20 1.5 137 8 37 14,495 1.0 103 8 33 0.6
Average 19 1.5 171 17 30 14,249 1.0 139 19 34 0.9 Maximum 48 5.1 600 62 318 49,997 4.2 202 56 313 1.8 Minimum 12 0.4 69 2 6 4,346 0.0 100 3 12 0.3
1 Average fuel-based CO2 emission rate for all equipment is 9,749 g/gal ± 5% 2 Data not available
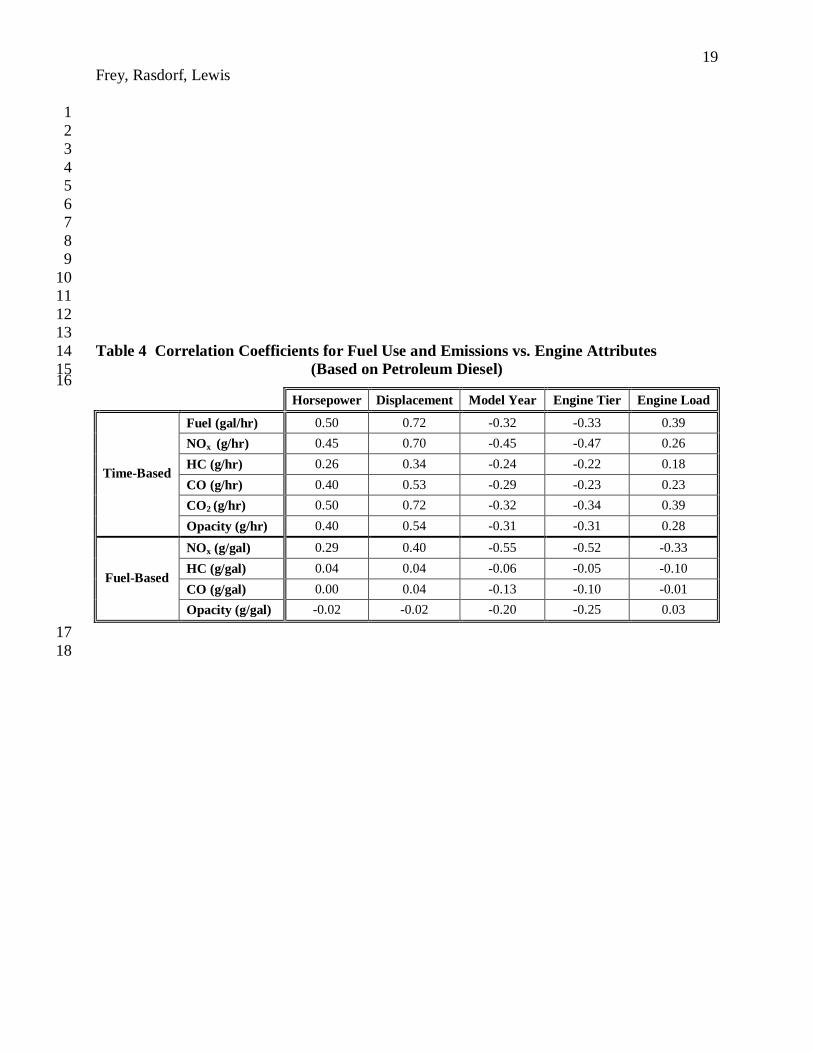
19 Frey, Rasdorf, Lewis 1 2 3 4 5 6 7 8 9 10 11 12 13 Table 4 Correlation Coefficients for Fuel Use and Emissions vs. Engine Attributes 14
(Based on Petroleum Diesel) 15 16
Horsepower Displacement Model Year Engine Tier Engine Load
Fuel (gal/hr) 0.50 0.72 -0.32 -0.33 0.39 NOx (g/hr) 0.45 0.70 -0.45 -0.47 0.26 HC (g/hr) 0.26 0.34 -0.24 -0.22 0.18 CO (g/hr) 0.40 0.53 -0.29 -0.23 0.23 CO2 (g/hr) 0.50 0.72 -0.32 -0.34 0.39
Time-Based
Opacity (g/hr) 0.40 0.54 -0.31 -0.31 0.28
NOx (g/gal) 0.29 0.40 -0.55 -0.52 -0.33 HC (g/gal) 0.04 0.04 -0.06 -0.05 -0.10 CO (g/gal) 0.00 0.04 -0.13 -0.10 -0.01
Fuel-Based
Opacity (g/gal) -0.02 -0.02 -0.20 -0.25 0.03
17 18
20 Frey, Rasdorf, Lewis
1 2 3 4 5 6 7 8 9 10 11 12 13
Table 5 Correlation Coefficients for Fuel Use and Emissions vs. Engine Attributes 14 (Based on B20 Biodiesel) 15
16 Horsepower Displacement Model Year Engine Tier Engine Load
Fuel (gal/hr) 0.66 0.68 -0.13 -0.19 0.87 NOx (g/hr) 0.56 0.71 -0.41 -0.44 0.71 HC (g/hr) 0.61 0.65 -0.31 -0.21 0.70 CO (g/hr) 0.10 0.32 -0.85 -0.64 -0.13 CO2 (g/hr) 0.66 0.68 -0.13 -0.18 0.87
Time-Based
Opacity (g/hr) 0.24 0.26 -0.06 -0.24 0.91
NOx (g/gal) -0.09 -0.03 -0.08 -0.02 -0.29 HC (g/gal) -0.01 -0.05 -0.10 0.08 -0.02 CO (g/gal) 0.04 0.26 -0.77 -0.52 -0.34
Fuel Based
Opacity (g/gal) -0.54 -0.52 -0.05 -0.16 -0.02
17 18
21 Frey, Rasdorf, Lewis
1 2 3 4 5 6 7 8 9 10 11 12 13
14
15 Figure 1 Time-Based Fuel Use and Emission Rates vs. Displacement 16
(Based on Petroleum Diesel) 17 18 19
22 Frey, Rasdorf, Lewis
1 2 3 4 5 6 7 8 9 10 11 12 13 14
15 Figure 2 Time-Based Fuel Use and Emission Rates vs. Engine Load 16
(Based on B20 Biodiesel) 17