Embed Size (px)
Citation preview

Level 31 / 35 Collins StreetMelbourne Vic 3000
T 03 8601 7000
—
—
Victorian Auditor -General’s Office
Results of 2016–17 Audits: Local Governm
ent2017–18:8
Novem
ber 2017
Victorian Auditor-General’s Report2017–18:8
Results of 2016–17 Audits:
Local Government
November 2017
10267 VAGO_Results of 2016–17 Audits-Local Government_Cover.pdf | Page 1 of 1 10267 VAGO_Results of 2016–17 Audits-Local Government_Cover.pdf | Page 1 of 1


Results of 2016–17 Audits:
Local Government
Ordered to be published
VICTORIAN GOVERNMENT PRINTER
November 2017
PP No 347, Session 2014–17

This report is printed on Monza Recycled paper. Monza Recycled is certified Carbon Neutral by The Carbon Reduction Institute
(CRI) in accordance with the global Greenhouse Gas Protocol and ISO 14040 framework. The Lifecycle Analysis (LCA) for Monza
Recycled is cradle to grave including Scopes 1, 2 and 3. It has FSC Mix Certification combined with 55% recycled content.
ISBN 978 1 925678 07 9

The Hon Bruce Atkinson MLC The Hon Colin Brooks MP
President Speaker
Legislative Council Legislative Assembly
Parliament House Parliament House
Melbourne Melbourne
Dear Presiding Officers
Under the provisions of section 16AB of the Audit Act 1994, I transmit my report Results of
2016–17 Audits: Local Government.
Yours faithfully
Andrew Greaves
Auditor-General
29 November 2017


Victorian Auditor-General’s Report Results of 2016–17 Audits: Local Government 5
Contents Audit overview ............................................................................................................. 7
Conclusion .................................................................................................................................. 7
Findings ...................................................................................................................................... 7
Recommendation ..................................................................................................................... 10
Submissions and comments .................................................................................................... 10
1 Audit context ......................................................................................................... 11
Local government sector ................................................................................................. 12
Sector events ................................................................................................................... 14
Report structure .............................................................................................................. 15
2 Results of audits .................................................................................................... 17
Audit opinions ................................................................................................................. 17
Quality of financial and performance reporting ............................................................. 18
Key audit themes ............................................................................................................. 21
3 Internal controls .................................................................................................... 25
Assessment of internal controls ...................................................................................... 25
Status of matters raised in previous audits ..................................................................... 30
4 Financial sustainability .......................................................................................... 31
Conclusion ....................................................................................................................... 31
Financial sustainability risks ............................................................................................ 32
Overall analysis ................................................................................................................ 32
Analysis of council categories .......................................................................................... 33
5 Rate capping impact assessment .......................................................................... 45
Conclusion ....................................................................................................................... 45
Rate revenue ................................................................................................................... 46
Short-term impacts of rate capping ................................................................................ 47
Longer-term impact and responses ................................................................................ 49

6 Results of 2016–17 Audits: Local Government Victorian Auditor-General’s Report
. Audit Act 1994 section 16—submissions and comments ..................... 53
. Audit opinions issued ............................................................................. 63
. Upcoming changes to financial reporting .............................................. 69
. Management letter risk ratings ............................................................. 73
. IT control deficiencies ............................................................................ 75
. Financial sustainability risk indicators .................................................... 77
. Glossary ............................................................................................... 103
Acronyms
AASB Australian Accounting Standards Board
DELWP Department of Environment, Land, Water and Planning
DPC Department of Premier and Cabinet
ESC Essential Services Commission
IT Information technology
LGPRF Local Government Performance Reporting Framework
LGV Local Government Victoria
KMP Key management personnel
VAGO Victorian Auditor-General’s Office
VCAT Victorian Civil and Administrative Tribunal

Victorian Auditor-General’s Report Results of 2016–17 Audits: Local Government 7
Audit overview In Victoria, the local government sector comprises 79 councils, their 10 regional
library corporations and 16 associated entities. While administered under the
Local Government Act 1989, each council operates autonomously and is directly
accountable to ratepayers. Local Government Victoria (LGV), within the
Department of Environment, Land, Water and Planning (DELWP), provides policy
advice, oversees legislation and works with the Minister for Local Government
and local councils.
In this report, we analyse and discuss the results of our 2016–17 audits of the
financial reports and performance statements of Victoria’s councils, regional
library corporations and associated entities.
We assess their financial performance during 2016–17, and their financial
position as at 30 June 2017. In addition, we discuss the financial sustainability
of the sector based on our analysis of council budgets and the 30 June 2017
audited financial reports. We also analyse the sector’s response to the
introduction of the Victorian Government’s rate capping policy in 2015.
The councils’ audited financial reports and performance statements for the year
ended 30 June 2017 are reliable, and Parliament and the wider community can
have confidence in them.
In the short term, the sector as a whole has a relatively low financial
sustainability risk. The longer-term impact of rate capping is yet to be fully
determined, but it has created the impetus for councils to review their cost
structures.
To mitigate and minimise any potential risks arising from issues in their internal
control environment, councils need to ensure they promptly resolve the issues
we have identified.
Results of audit
Financial reports
For the financial year 2016–17, we issued clear audit opinions for 104 financial
reports.
The opinion for MAPS Group Limited—an associated entity that has a
30 September balance date—remains outstanding at the date of this report.
Compared to the prior financial year, in 2016–17 councils made a small
improvement in the median time taken to certify their financial reports.
This could be significantly improved by bringing forward key elements of
the financial reporting work, such as the timing of asset revaluations.
Conclusion
Findings

8 Results of 2016–17 Audits: Local Government Victorian Auditor-General’s Report
As new Australian Accounting Standards will apply over the next few years, the
timely preparation and certification of financial reports is particularly important.
Councils are encouraged to assess these new standards and prepare for their
implementation at their earliest opportunity.
Performance statements
We issued 78 clear audit opinions on councils’ performance statements
for 2016–17. We qualified our audit opinion for Towong Shire Council’s
performance statement. As the council did not conduct or participate in a
2016−17 community satisfaction survey, it was unable to obtain information
for two indicators and, therefore, could not report the results.
Performance statements are important, as they communicate key financial
and non-financial results. Currently, in their performance statements, councils
explain significant variations in performance indicators in the context of results
from prior years. While this information is useful, setting a target would assist
readers to determine whether a council is operating efficiently and effectively.
Internal controls
We assess councils’ internal controls as generally well designed and operating as
intended by management.
However, we continue to observe issues in key IT internal controls and have
identified this as an increasing trend across the sector. Persistent high-risk IT
internal control issues include:
unsupported systems and software
weak user access management
lack of software patch management.
Combined, these matters increase the risk of a successful cyber attack and could
result in the destruction of data or recording of non-existent transactions.
Overall, councils have resolved over 60 per cent of the internal control issues
identified in our current and prior-year audits.
Found assets
In 2016–17, 29 councils identified $175.3 million of assets that they had not
known about or recorded (compared to 31 councils and $149.3 million assets
in 2015–16). Councils use asset information to plan and monitor their
maintenance and capital works planning. Therefore, it is important that they
know about all relevant assets.
In our November 2016 report Local Government: 2015–16 Audit Snapshot, we
highlighted the lack of completeness and accuracy of councils’ underlying data
about the assets they control as a recurring issue. This continued to be an issue
in 2016–17.

Victorian Auditor-General’s Report Results of 2016–17 Audits: Local Government 9
Financial sustainability
We have assessed the sector as having a relatively low financial sustainability
risk in the short term.
Our analysis shows a gradual decline in the asset renewal and maintenance
indicators. Overall, the sector forecasts spending less on asset renewal and
maintenance.
We also found that most councils are accumulating cash—in preference to
acquiring debt—to replace or expand their asset base. This is shown through
the declining trend in the indebtedness indicator, and the sector's increasing
cash and term deposit holdings.
We note that rural and regional councils have a higher financial sustainability
risk than metropolitan councils. This is linked to their relative inability to
generate sufficient own-sourced revenue streams as well as steady increases
in expenditure.
The impact of rate capping
Our analysis shows that, on average, councils are forecasting their revenue to
decrease by 1 per cent over the next three financial years, while expenditure is
set to increase by 2 per cent over the same period. Councils need to better
understand the impact this disparity may have on the services that they provide
to their communities.
It is encouraging that most councils have identified longer-term viability risks
that may result from rate capping, but many do not yet understand how they
can respond to this risk. To do this, a first step councils must take is to
understand the nature and cost of all services they provide to their
communities.
Councils also need to understand the impact of reduced revenue on their capital
works programs. We found that, in response to rate capping, councils have
started to reduce their longer-term capital expenditure programs. However,
these programs typically only focus on the next four years. We recommend that
councils develop longer-term plans, covering the next 10 to 20 years, to ensure
they make appropriate decisions.

10 Results of 2016–17 Audits: Local Government Victorian Auditor-General’s Report
We recommend that Local Government Victoria:
1. introduce targets for each of the performance indicators included in each
councils’ performance statements (see Part 2).
We have consulted with DELWP and the councils named in this report, and we
considered their views when reaching our audit conclusions. As required by
section 16(3) of the Audit Act 1994, we gave a draft copy of this report to those
agencies and asked for their submissions or comments. We also provided a copy
of the report to the Department of Premier and Cabinet.
The following is a summary of those responses. The full responses are included
in Appendix A.
DELWP notes our findings and supports in principal the report’s
recommendation. DELWP intends to write to all mayors and CEOs
recommending that they review the report and address matters relevant to
their council.
Horsham Rural City Council provides further information on its case study. City
of Kingston, Moreland City Council and City of Stonnington comment on found
assets. City of Moonee Valley and Moreland City Council provide information
regarding their management letter issues.
Recommendation
Submissions and comments

Victorian Auditor-General’s Report Results of 2016–17 Audits: Local Government 11
Victoria’s Constitution recognises local government as one tier of government.
Democratically elected councillors govern councils, and their operations are
managed by a council-appointed chief executive officer. While administered
under the Local Government Act 1989, each council operates autonomously and
is directly accountable to ratepayers.
The sector includes 79 councils, 10 regional library corporations and
16 associated entities. We classified councils into two categories, made up
of five cohorts based on size, demographics and funding—see Figure 1A.
These cohorts are consistent with LGV’s classification of council types.
Appendix B lists the councils included in each cohort and the results of our
audits of each entity.
Cohort Definition Number of councils
Metropolitan councils
Metropolitan A metropolitan council is predominantly urban in character and located within Melbourne’s densely populated urban core.
22
Interface An interface council is one of the nine municipalities that form a ring around metropolitan Melbourne.
9
Total metropolitan councils 31
Rural and regional councils
Regional city A regional city council is urban and partly rural in character. 10
Large shire A large shire is a municipality with more than 16 000 inhabitants that is predominantly rural in character.
19
Small shire A small shire council is a municipality with less than 16 000 inhabitants that is predominantly rural in character.
19
Total rural and regional councils 48
Total councils 79
VAGO.
Audit context
In this report, the local government sector refers to the 79 Victorian councils.

12 Results of 2016–17 Audits: Local Government Victorian Auditor-General’s Report
The local government sector is primarily funded though rates and charges, and
government grants to deliver various services for the local community. Figure 1B
shows the funding sources and how the sector spends these funds.
VAGO, based on Local Government Victoria, Victoria Grants Commission—Questionnaire 2015–16 responses from councils.
Local government
sector

Victorian Auditor-General’s Report Results of 2016–17 Audits: Local Government 13
The two categories of councils—metropolitan, and rural and regional—have
different demographics and face separate challenges and opportunities. This is
evident, for example, in rural and regional councils’ reliance on grants compared
to the metropolitan councils.
Figure 1C compares these two categories of councils and provides key sector
information.
VAGO, based on Local Government Victoria, Victoria Grants Commission—Questionnaire 2015–16 responses from councils; and Australian Bureau of Statistics.

14 Results of 2016–17 Audits: Local Government Victorian Auditor-General’s Report
Two recent developments—rate capping and governance interventions—have
had or will have a considerable impact on the local government sector.
Rate capping
In 2015, the Victorian Government introduced rate capping legislation in the
form of its Fair Go Rates System. This system introduces an annual rate cap,
set by the Minister for Local Government, which controls general rate increases
for all councils. The 2016–17 financial year is the first year of rate capping, with
rate increases capped at 2.5 per cent (2 per cent in 2017–18).
We explore the short- and long-term implications of rate capping for the local
government sector in Part 5 of this report.
Governance interventions
Effective governance is essential for maintaining strong internal controls.
Although most councils have appropriate controls to govern themselves, there
have been a number of recent legal interventions by the state government in
response to governance failures. Figure 1D summarises the status of some
recent governance issues.
Council Description
Ararat Rural City Council In June 2017, a Commission of Inquiry was appointed. In August 2017, the Minister for Local Government appointed a municipal monitor to observe the council’s operations.
Central Goldfields Shire Council In October 2016, the minister appointed a municipal monitor.
On 18 August 2017, the Local Government Investigations and Compliance Inspectorate released its report Protecting integrity: Central Goldfields Shire Council investigation. Following the release of the report, the state government dismissed the council on 23 August 2017.
On 26 August 2017, the state government appointed an interim administrator.
Casey City Council In June 2016, a municipal monitor was appointed. The municipal monitor report was received in September 2016.
Darebin City Council On 25 June 2015, special inspectors were appointed.
Greater Geelong City Council In December 2015, an independent Commission of Inquiry was appointed.
The state government dismissed the council in April 2016 and appointed three administrators until the council election in October 2017. A new council was elected in October 2017.
Municipal monitors are appointed by the Minister for Local Government to observe governance processes and provide advice to councils that are experiencing governance difficulties. Commissioners are appointed by the Minister for Local Government where there are more serious governance failures.
VAGO.
Sector events

Victorian Auditor-General’s Report Results of 2016–17 Audits: Local Government 15
In this report, we detail the outcomes of the 2016–17 financial audits of
Victoria’s local government sector. We discuss key matters arising from our
audits, and provide an analysis of information included in councils’ financial
reports.
Figure 1E outlines the structure of this report.
Part Description
Part 2—Results of audits
Presents results of our audit of local government sector entities for the 2016–17 financial year. This section also provides commentary on:
key audit themes for 2016–17
quality of financial and performance reporting
outcomes of the audits of the 79 councils.
Part 3—Internal controls
Summarises the results of our internal control evaluations of local government sector entities for the 2016–17 financial year.
Part 4—Financial sustainability
Provides an insight into the sector’s long-term viability risks, based on our analysis of financial sustainability risk indicators.
Part 5—Rate capping impact assessment
Provides commentary on the impact of rate capping on councils, based on the sector’s response.
VAGO.
We undertake our financial audits according to section 8 of the Audit Act 1994
and Australian Auditing Standards. These audits are paid for by each entity.
The results of these audits were used in preparing the report. The cost of
preparing this report was $250 000, which is funded by Parliament.
Report structure


Victorian Auditor-General’s Report Results of 2016–17 Audits: Local Government 17
Councils prepare a financial report and performance statement annually.
Their financial report shows the council’s financial results and is prepared in line
with relevant Australian Accounting Standards and applicable legislation. The
performance statement outlines the council’s performance against performance
indicators set by the Minister for Local Government. We audit both the financial
reports and the performance statements.
Independent audit opinions add credibility to financial reports and performance
statements by providing reasonable assurance that the information reported is
accurate and reliable.
A clear audit opinion confirms that the financial report presents fairly the
transactions and balances for the reporting period, in keeping with the
requirements of relevant Australian Accounting Standards and applicable
legislation. A clear audit opinion for the performance statement confirms
that the actual results reported are fairly presented and comply with the
performance indicators set by the minister. We carried out our financial audits
of the local government sector in accordance with the Australian Auditing
Standards.
Figured 2A outlines the status of the sector’s 2016–17 financial report and
performance statement audits, and the types of opinions issued to each entity.
Appendix B lists the local government entities, type of audit opinion and when
they were issued.
Results of audits
Audit opinions

18 Results of 2016–17 Audits: Local Government Victorian Auditor-General’s Report
Entities Clear audit opinions
Qualified opinion
Number of opinions issued Incomplete
Financial report
Council 79 – 79 –
Regional library corporations
10 – 10 –
Other(a) 15 – 15 1
Total 104 – 104 1
Performance statements
Council 78 1 79 –
MAPS Group Limited has a 30 September balance date—no audit opinion had been issued at the date of this report for the year ending 30 September 2017.
VAGO.
Qualified audit opinion for Towong Shire Council’s performance
statement
We qualified the performance statement audit opinion of Towong Shire Council
due to the fact that the council did not conduct or participate in the required
community satisfaction survey for the 2016–17 financial year. The survey
obtains information from the community on the following service-related
performance measures:
satisfaction with council decisions
satisfaction with sealed local roads within the municipality.
Accordingly, the council was unable to report results for these performance
indicators in its 2016–17 performance statement. The inability to report these
performance indicators constitutes a departure from the performance
statement requirements under Part 6 of the Local Government Act 1989.
The quality of an entity’s financial and performance reporting can be measured
by the timeliness and accuracy of these reports.
Timeliness
Timely financial reports and performance statements enable users to make
better informed and prompt decisions. The later these reports are produced,
the less relevant the information is.
A qualified audit opinion is issued when the auditor concludes that a clear opinion cannot be expressed because of a conflict with the applicable reporting framework or a limitation of scope.
Quality of financial and performance
reporting

Victorian Auditor-General’s Report Results of 2016–17 Audits: Local Government 19
Councils are required to submit their financial reports and performance
statements to the Minister for Local Government and have them certified by
30 September each year. Figure 2B shows when councils’ reports were certified
in 2016 and 2017.
The certification date for Central Goldfields Shire Council is omitted from this figure.
VAGO.
With the exception of Central Goldfields Shire Council’s reports—which were
certified on 9 November 2017 and received an extension from the minister until
30 November 2017—all councils met the statutory deadline, as in 2016.
While the sector made a small improvement in the median time taken to certify
the reports compared to the prior year, further improvements could be made by
bringing forward work such as:
conducting asset valuations prior to the balance date
evaluating and mitigating key risks during the year such as the completeness and accuracy of landfill provisions
preparing shell accounts for audit review.
Accuracy
The number and size of errors identified through our audit of the financial
reports and performance statements is a direct measure of the quality of those
documents. Ideally, there should be no errors or adjustments required as a
result of an audit. When material errors are detected through the audit process,
they are brought to management’s attention for correction.
Material errors identified during the audit process need to be corrected before a
clear audit opinion can be issued. While some errors may appear immaterial in
isolation, a series of smaller errors when considered together may have a
material impact on the entity’s financial report or performance statement.
Statutory deadline
11 September 2017
Median
13 September 2016
Median
015.5
016.5
017.5
1.5 2 2.5 3
2016
● Certi fication dates for councils' financial reports and performance statements
15 August 31 August 15 September 30 September
2017
Shell accounts are a set of financial reports and performance statements prepared by management prior to the balance date. These assist with planning the structure and contents of the actual financial report and performance statement.
Material errors are significant misstatements or omissions of information that may influence a user’s decision-making.

20 Results of 2016–17 Audits: Local Government Victorian Auditor-General’s Report
Financial reports
Aggregated errors that required adjustment include:
a $727.7 million understatement of total assets due to incorrect valuation of non-current assets—we explore these matters further in the Section 2.3
$81.9 million in term deposits incorrectly classified as either other financial assets or cash equivalents
a $25.6 million overstatement in total revenue due to developer contributions reported in the incorrect financial year
a $3.5 million understatement and a $1.7 million overstatement in total liabilities due to errors in landfill provision calculations.
In 2016–17, LGV provided guidance to the sector regarding accounting for
landfills. We encourage councils to review this information when evaluating the
reasonableness of their landfill provisions.
Performance statements
LGV issues the Local Government Performance Reporting Framework (LGPRF)
which outlines the requirements for councils’ performance statements. Based
on our analysis of errors identified through the audit process, performance
indicators that were more susceptible to error include:
statutory planning—council planning decisions upheld by the Victorian Civil and Administrative Tribunal (VCAT)
food safety—critical and major noncompliance outcome notifications
aquatic facilities—utilisation.
These errors were generally due to a lack of awareness of the LGPRF or
challenges the council faced in interpreting whether an item should be included
in a specific performance indicator.
When preparing their statements, councils are required to explain significant
variations in performance indicators compared to prior years. While this
information is useful, the current performance reporting framework does not
impose targets. As a result, management and readers of the performance
statement are unable to determine if a council is operating efficiently and
effectively.
Setting a target would assist management and users of performance statements
to understand where a council’s performance can be improved.
Developer contributions are physical assets such as roads and drains that are transferred to councils once their construction is complete.
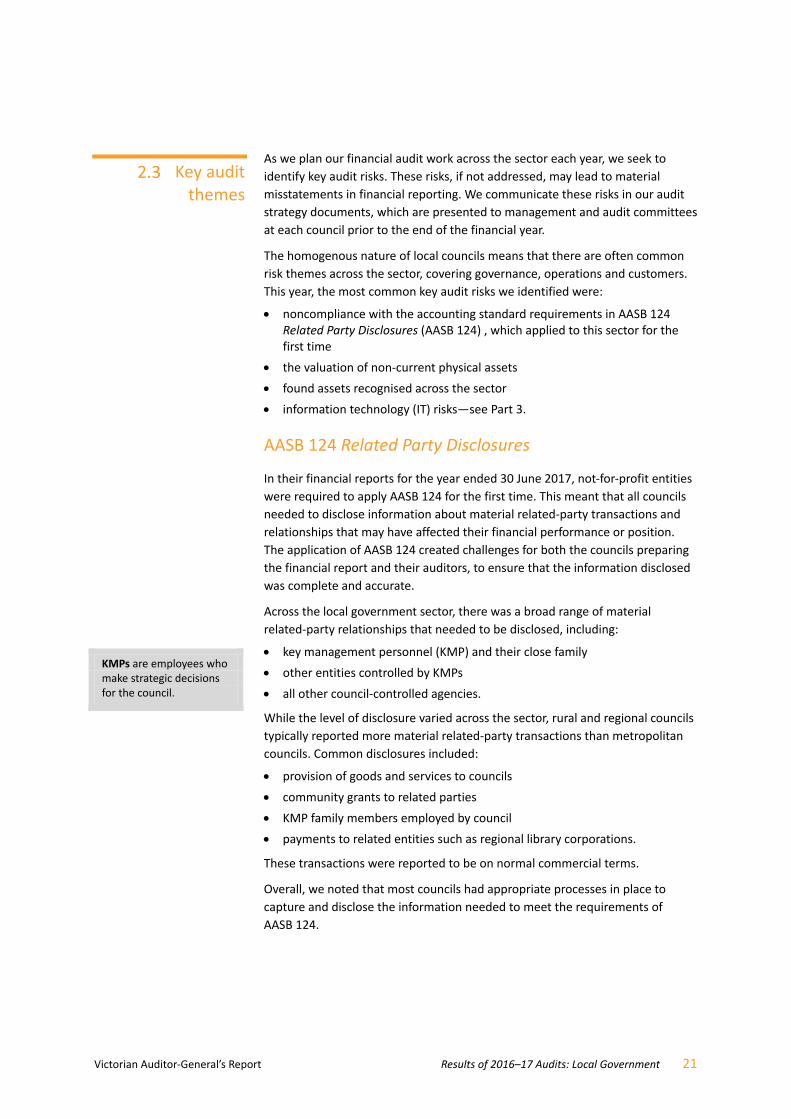
Victorian Auditor-General’s Report Results of 2016–17 Audits: Local Government 21
As we plan our financial audit work across the sector each year, we seek to
identify key audit risks. These risks, if not addressed, may lead to material
misstatements in financial reporting. We communicate these risks in our audit
strategy documents, which are presented to management and audit committees
at each council prior to the end of the financial year.
The homogenous nature of local councils means that there are often common
risk themes across the sector, covering governance, operations and customers.
This year, the most common key audit risks we identified were:
noncompliance with the accounting standard requirements in AASB 124 Related Party Disclosures (AASB 124) , which applied to this sector for the first time
the valuation of non-current physical assets
found assets recognised across the sector
information technology (IT) risks—see Part 3.
AASB 124 Related Party Disclosures
In their financial reports for the year ended 30 June 2017, not-for-profit entities
were required to apply AASB 124 for the first time. This meant that all councils
needed to disclose information about material related-party transactions and
relationships that may have affected their financial performance or position.
The application of AASB 124 created challenges for both the councils preparing
the financial report and their auditors, to ensure that the information disclosed
was complete and accurate.
Across the local government sector, there was a broad range of material
related-party relationships that needed to be disclosed, including:
key management personnel (KMP) and their close family
other entities controlled by KMPs
all other council-controlled agencies.
While the level of disclosure varied across the sector, rural and regional councils
typically reported more material related-party transactions than metropolitan
councils. Common disclosures included:
provision of goods and services to councils
community grants to related parties
KMP family members employed by council
payments to related entities such as regional library corporations.
These transactions were reported to be on normal commercial terms.
Overall, we noted that most councils had appropriate processes in place to
capture and disclose the information needed to meet the requirements of
AASB 124.
Key audit themes
KMPs are employees who make strategic decisions for the council.

22 Results of 2016–17 Audits: Local Government Victorian Auditor-General’s Report
In its first year, the implementation of AASB 124 went relatively well. Other
significant changes to standards in the next few years—summarised in
Appendix C—will also impact council financial reporting. Councils are
encouraged to examine these changes, identify potential impacts and
prepare for their implementation.
Physical asset fair value assessments and revaluations
At 30 June 2017, the 79 councils held $91.2 billion in infrastructure, property,
plant and equipment ($84.6 billion at 30 June 2016). In particular, there was a
$5.2 billion asset revaluation increment across the local government sector.
To comply with Australian Accounting Standards, each council must annually
determine and disclose the fair value of its infrastructure, property, plant and
equipment assets in its financial report.
There are two common methods used to calculate fair value across the local
government sector:
Market approach—based on market sales of similar assets. This method is generally used to value land and buildings.
Current replacement cost—reflects the expected cost in today’s dollars of replacing an asset to a similar standard and at a similar age. This method is generally used to value infrastructure such as roads and bridges.
As the total value of infrastructure, property, plant and equipment represents a
significant percentage of a council’s total assets, our audits allocate a significant
amount of time and effort to verifying their fair value estimates. As valuing
infrastructure, property, plant and equipment involves significant management
judgement across a range of values, there is a higher risk of material financial
report errors.
We found that the practices governing asset revaluations varied across the
sector. Key issues include:
incorrect unit costs applied to assets
underlying data integrity issues resulting in found, ghost or duplicate assets
lack of review of underlying spreadsheets resulting in calculation errors.
All material errors identified were resolved before we signed relevant councils’
financial reports.
Found assets
Included in the $91.2 billion in infrastructure, property, plant and equipment,
the Victorian local government sector recognised $175.3 million in found assets
this year (compared to $149.3 million in 2015–16). Figures 2C and 2D show the
spread of these assets across Victoria and metropolitan Melbourne.
The fair value is the estimated cost to purchase or replace an asset. Calculation of fair value should take into account any conditions or restrictions placed on the asset.
Found assets are physical assets controlled by the council that have previously been omitted from their records.
Ghost assets are items recorded by a council that no longer exist.
Duplicate assets are additional items recognised for an existing asset.

Victorian Auditor-General’s Report Results of 2016–17 Audits: Local Government 23
VAGO.
VAGO.
<1% of revenue
1% to <2% of revenue
2% to <5% of revenue
5% to <10% of revenue
>10% of revenue
<1% of revenue
1% to <2% of revenue
2% to <5% of revenue
5% to <10% of revenue
>10% of revenue
24 Results of 2016–17 Audits: Local Government Victorian Auditor-General’s Report
The value of found assets varied across the local government sector. The
majority of these relate to infrastructure.
Common challenges included:
underground assets such as drains which are difficult to inspect
uncertainty over ownership of assets between entities, such as drains with water entities.
Technological advances, including GPS information, have assisted councils
in improving the accuracy of data in their asset registers. Nevertheless, further
work is required to reduce the number of found assets across the sector. Those
assets that are not captured are obviously not subject to regular maintenance
and may continue to deteriorate, resulting in considerable long-term costs.

Victorian Auditor-General’s Report Results of 2016–17 Audits: Local Government 25
Effective internal controls help entities meet their objectives reliably and
cost-effectively. Entities also require strong internal controls to deliver reliable,
accurate and timely external and internal financial reports.
In our annual financial audits, we consider the internal controls relevant to
financial reporting and assess whether entities have managed the risk that their
financial reports may not be complete and accurate. Poor internal controls make
it more difficult for entities to comply with relevant legislation and increase the
risk of fraud and error.
As part of our audit, we assess the design and implementation of councils’
internal controls and, where we identify ones that we intend to rely on, we test
how effectively they are operating. If we assess an entity’s internal controls as
not being well designed, not operating as intended or missing, we communicate
this finding to the entity’s management and audit committee.
In 2016–17, we reported 359 extreme-, high- and medium-risk internal control
issues across the 79 councils, comprising:
110 newly identified issues
updates on 249 issues identified through previous years’ financial audits.
Figure 3A summarises these control issues by area and risk. Appendix D
provides additional information on our risk ratings and our expected time lines
for councils to resolve issues.
Internal controls
Assessment of internal controls

26 Results of 2016–17 Audits: Local Government Victorian Auditor-General’s Report
Area of issue Extreme High Medium Total
Governance – 2 48 50
Information systems 4 36 69 109
General ledger – – 10 10
Revenue and receivables – – 20 20
Expenditure and payables – 2 33 35
Employee benefits – – 23 23
Infrastructure, property, plant and equipment
1 8 91 100
Cash and other assets – 1 11 12
Total 5 49 305 359
We reported 339 low-risk internal control issues in 2016–17, made up of 93 newly identified issues and an update on 246 previously reported ones. As these matters are minor and/or may present opportunities to improve existing processes, they have been excluded from this figure.
VAGO.
Extreme-risk issues
Figure 3B shows the extreme-risk issues we identified and their current status.
There were two extreme-risk issues carried forward from 2015–16 and three
new issues raised in 2016–17.
Council Description of finding Year raised
Current status
Cardinia Shire Council Insufficient software patch and support management
2015–16 Closed
Casey City Council Insufficient software patch and support management
2015–16 Closed
Bayside City Council Inappropriate password management controls
2016–17 Closed
Bayside City Council Weak user access management controls
2016–17 Closed
West Wimmera Shire Council
Lack of a detailed asset register
2016–17 Open
VAGO.
Extreme-risk issues are internal control issues that could cause severe disruption to operations and/or result in a material misstatement in the financial report.

Victorian Auditor-General’s Report Results of 2016–17 Audits: Local Government 27
Cardinia Shire Council and Casey City Council
Both Cardinia Shire Council and Casey City Council had severe weaknesses
relating to their IT. Specifically:
critical software patches had not been applied to numerous devices
some devices had been missing software patches since 2007
council was still using software that was no longer supported by the vendor.
We note that unsupported and unpatched software increases the risk that a
cyber attacker may gain access to systems and sensitive information.
We confirmed that these deficiencies were resolved in 2016–17. These councils
have since implemented procedures to address these controls in the future.
Bayside City Council
Our review of the Bayside City Council’s IT environment identified internal
control issues regarding password and user access management.
Key issues concerning password management included:
passwords being maintained insecurely on the network
active account passwords being configured to never expire
system password settings and an organisational policy that did not comply with industry better practices.
If passwords are not stored securely, there is a high risk that accounts might be
exploited—particularly those with ‘super user’ privileges. Additionally,
permitting users to select weak passwords that are not changed periodically
increases the risk of unauthorised access to systems.
Key issues concerning user access management included:
accounts being assigned ‘super user’ privileges when they were not required
‘super user’ access being assigned to shared accounts, which limited the ability to make individual users accountable for their usage.
Inappropriate and excessive user access rights may result in unauthorised
access to data and programs or potential financial fraud.
The council has undertaken corrective actions for password and user access
management to strengthen its IT environment.
West Wimmera Shire Council
West Wimmera Shire Council does not have a detailed fixed asset register that
lists individual items such as bridges, road segments and drainage assets. As a
result, we determined movements for each asset class by referring to other
supporting documentation or calculations.
West Wimmera Shire Council accepted this finding and is currently arranging a
complete network revaluation to the segment level. This will provide a new
detailed asset register that should improve asset management in 2017–18 and
beyond.

28 Results of 2016–17 Audits: Local Government Victorian Auditor-General’s Report
High-risk issues
We reported 49 high-risk internal control issues, comprising:
13 newly identified issues
updates on 36 issues identified in previous years’ financial audits.
Figure 3C shows these high-risk issues by council and area.
Council
Issue type Issue status(a)
IT controls Fixed assets Other Total
Resolved Unresolved
Ballarat City Council 3 – – 3 3 –
Bayside City Council 3 – – 3 – 3
Benalla Rural City Council – 2 – 2 – 2
Boroondara City Council 2 – – 2 2 –
Borough of Queenscliffe 1 – 1 2 2 –
Campaspe Shire Council – – 1 1 1 –
Cardinia Shire Council 2 – – 2 2 –
Casey City Council 1 – – 1 1 –
Central Goldfields Shire Council 1 – – 1 – 1
East Gippsland Shire Council – 1 – 1 – 1
Frankston City Council – 1 – 1 1 –
Greater Dandenong City Council 3 – – 3 2 1
Greater Geelong City Council 2 – – 2 2 –
Hobsons Bay City Council 2 – – 2 2 –
Mitchell Shire Council – 1 1 2 2 –
Moonee Valley City Council 4 – – 4 1 3
Moreland City Council 1 – – 1 – 1
Mornington Peninsula Shire Council – 1 – 1 1 –
Port Phillip City Council 1 – – 1 1 –
South Gippsland Shire Council 2 – – 2 1 1
Southern Grampians Shire Council 1 – 1 2 1 1
Strathbogie Shire Council – 1 1 2 – 2
West Wimmera Shire Council 1 1 – 2 1 1
Whitehorse City Council 4 – – 4 4 –
Wodonga City Council 2 – – 2 2 –
Total 36 8 5 49 32 17
(a) Status of issue as reported to management.
VAGO.
High-risk issues are internal control issues that could cause a major disruption to operations or are likely to result in a material misstatement in the financial report.

Victorian Auditor-General’s Report Results of 2016–17 Audits: Local Government 29
Poor IT controls and cyber risk
IT control activities support the operating capability of an IT system. Strong IT
controls ensure smooth day-to-day operations of councils and the reliability of
data used for financial reporting and preparing performance statements. They
reduce the risk that employees or third parties can circumvent processes and
help maintain the integrity of information and the security of data.
In our audits of the 79 councils, we identified 18 with high-risk IT control issues
related to:
unsupported systems and software
user access controls
software patch management controls
other general IT controls.
Appendix E lists IT control issues for each council.
The severity of these IT control issues determined whether they were rated
extreme, high or medium.
Poorly designed and implemented IT controls increase the risk of unauthorised
access to systems, which may result in the destruction of data or recording of
non-existent transactions. They also increase the risk of a successful cyber
attack.
Medium-risk issues
We reported 305 medium risk internal control issues, comprising:
94 newly identified issues
updates on 211 issues identified through previous years’ financial audits.
Figure 3D shows the number of issues by area and current status.
VAGO.
A cyber attack is a deliberate act by a third party to gain unauthorised access to an entity’s data, with the objective to damage, deny, manipulate or steal information. To reduce the risk of a successful cyber attack, it is imperative that IT control issues are addressed in a timely manner.
Medium-risk issues are internal control issues that could cause moderate disruption to operations or a misstatement that is not material in the financial report.

30 Results of 2016–17 Audits: Local Government Victorian Auditor-General’s Report
Information systems and fixed assets continue to be areas of major internal
control weakness across the sector. Nevertheless, it is pleasing to note that
councils resolved a number of issues during the 2016–17 audits.
We monitor the status of prior-year internal control issues in our management
letters, to ensure they are resolved. Figure 3E shows the status of these issues,
as reported in our management letters to councils.
Issue status Extreme High Medium Total
Resolved 2 28 121 151
Unresolved – 8 90 98
Total 2 36 211 249
Issues rated as low risk are excluded from this analysis.
VAGO.
We found that councils showed significant improvement in resolving extreme-
and high-risk internal control issues. The eight remaining unresolved high-risk
matters primarily relate to six IT control issues that councils are still addressing.
While there was an improvement in resolving medium-risk issues, further work
is required to address these matters within the recommended six-month time
frame.
Status of matters raised in
previous audits

Victorian Auditor-General’s Report Results of 2016–17 Audits: Local Government 31
In this part, we analyse the financial sustainability risks that local councils face,
including the impact of emerging funding challenges due to rate capping and
reduced government grants.
We discuss the trends in key balances, such as types of revenue, expenses,
capital expenditure and borrowings. We also analyse the sector against seven
financial sustainability risk indicators, from financial years 2012–13 to 2019–20.
The information is drawn from councils’ audited financial reports for the five
years 2012–13 to 2016–17, and the unaudited 2017–18 budget for the three
future financial years.
We include a new sustainability risk indicator this year—the adjusted underlying
result. Our analysis of this indicator is based on six financial years’ data from
2014–15 to 2019–20, sourced from councils’ published performance
statements.
Appendix F details the seven financial sustainability indicators, risk assessment
criteria and benchmarks we use in this report. Appendix F also contains the
results for each council against the seven sustainability risk indicators.
As at 30 June 2017, we assessed the local government sector as having a
relatively low financial sustainability risk. The sector as a whole continues to
generate positive results, display strong liquidity ratios and hold low levels of
debt.
The sector’s short-term financial sustainability risk indicators remain strong.
However, our analysis of the data shows a declining trend in the financial
sustainability risk indicators for asset renewal and maintenance. Councils are
reducing their capital spending in response to rate capping and a reduction in
government grants. To meet community expectations, they need to identify and
respond to long-term asset replacement and renewal requirements for
infrastructure in a timely manner.
We note that rural and regional councils have a higher financial sustainability
risk than metropolitan councils. This is mainly due to smaller year-on-year
revenue increases, steady increases in expenditure, and their relative inability to
generate significant own-sourced revenue streams.
Financial sustainability
Rate capping introduces an annual rate cap set by the Minister for Local Government, which controls general rate increases for all councils.
Conclusion

32 Results of 2016–17 Audits: Local Government Victorian Auditor-General’s Report
To be financially sustainable, councils should make enough money from their
operations to meet their financial obligations and fund their asset management
plans.
Figure 4A summarises the sector’s financial sustainability risk indicators for
30 June 2017.
Key: High risk medium risk; low risk.
VAGO.
The sector, overall, generated a surplus from operations this year.
At 30 June 2017, councils collectively held current assets valued at $4.4 billion in
the form of cash and term deposits ($3.4 billion at 30 June 2016) and
borrowings of $1.2 billion ($1.2 billion at 30 June 2016). Those councils with
debt are able to service it.
The indebtedness indicator shows that, as a sector, councils prefer not to
borrow funds. Instead, most prefer to accumulate cash to replace or expand
their asset base. This raises questions of intergenerational equity, as the
investment in new assets is effectively being funded by past and current
ratepayers.
We note that the asset renewal and maintenance indicators are gradually
declining and are forecast to decline further.
All councils Metro Interface Regional Large Small
Net resul t per cent 19.71% 16.90% 33.96% 16.49% 15.67% 15.54%
Adjusted underlying resul t per cent 8.50% 12.62% 12.45% 3.52% 6.88% 7.05%
Liquidi ty ratio 2.97 2.59 3.64 2.43 2.70 3.48
Internal financing per cent 166% 169% 191% 147% 161% 161%
Indebtedness per cent 23.78% 13.93% 24.81% 33.54% 28.75% 17.86%
Capi ta l replacement ratio 1.48 1.56 1.84 1.48 1.31 1.21
Renewal gap ratio 0.99 1.15 0.93 0.91 1.01 0.93
Financial performance
Financial position
Asset renewal and maintenance indicators
Indicator
Average across councils for year ended 30 June 2017
Financial sustainability risks
Overall analysis
Victorian Auditor-General’s Report Results of 2016–17 Audits: Local Government 33
Financial performance analysis
Net result indicator
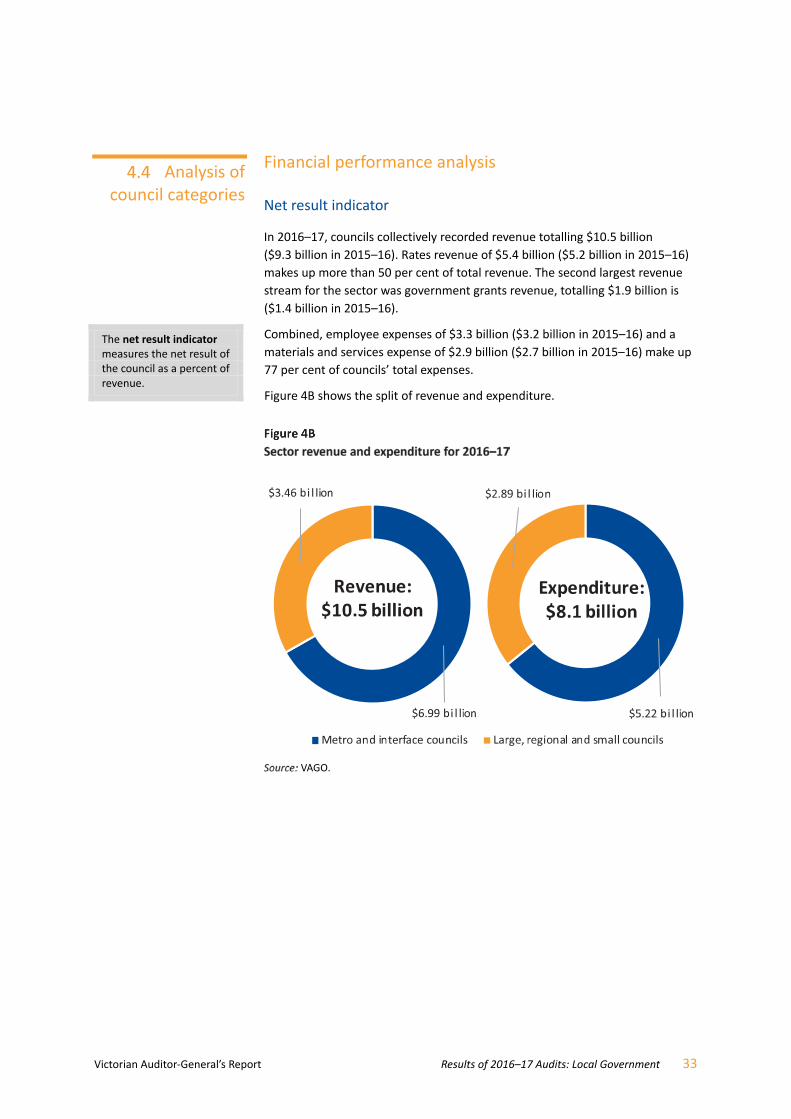
In 2016–17, councils collectively recorded revenue totalling $10.5 billion
($9.3 billion in 2015–16). Rates revenue of $5.4 billion ($5.2 billion in 2015–16)
makes up more than 50 per cent of total revenue. The second largest revenue
stream for the sector was government grants revenue, totalling $1.9 billion is
($1.4 billion in 2015–16).
Combined, employee expenses of $3.3 billion ($3.2 billion in 2015–16) and a
materials and services expense of $2.9 billion ($2.7 billion in 2015–16) make up
77 per cent of councils’ total expenses.
Figure 4B shows the split of revenue and expenditure.
VAGO.
Analysis of council categories
The net result indicator measures the net result of the council as a percent of revenue.

34 Results of 2016–17 Audits: Local Government Victorian Auditor-General’s Report
Figure 4C shows a summary of the net result indicator from 2011−12 to
2019−20.
VAGO.
Taken as a whole, the local government sector has been able to generate a
surplus from operations in each of the past five years. The sector is budgeting a
surplus over the next three years. However, the net result indicator is forecast to
decline over this period as the impact of rate capping on revenue growth takes
effect. The impact of rate capping and the sector’s response is discussed in
Part 5.
The net result indicator for the sector during the last five years is distorted by
the timing of Commonwealth financial assistance received by the sector. In
Figure 4C, the spike in the reported net result indicator during 2014–15 and
2016–17 is mainly due to the advance receipt of Commonwealth grant funds
and does not reflect operational performance. Figure 4C also presents the
normalised net results—that is, after adjusting for the advance receipt of
Commonwealth grant funding.
Looking forward
Over the budget period, our analysis shows that councils are forecasting an
average increase in rate revenue of 3 percent—in line with rate capping—and an
average 10 per cent reduction in government grant revenue. However, over the
same period, expenses are budgeted to increase at 2 per cent.
0%
2%
4%
6%
8%
10%
12%
14%
16%
18%
20%
2011–12 2012–13 2013–14 2014–15 2015–16 2016–17 2017–18 2018–19 2019–20
Net result indicator
Net result / Total revenue
Net result / Total revenue (forecast)
Normalised result / Adjusted total revenue
Normalised result / Adjusted total revenue (forecast)
Normalised result is net result adjusted for receipts of Commonwealth financial assistance grants ahead of need.
Victorian Auditor-General’s Report Results of 2016–17 Audits: Local Government 35
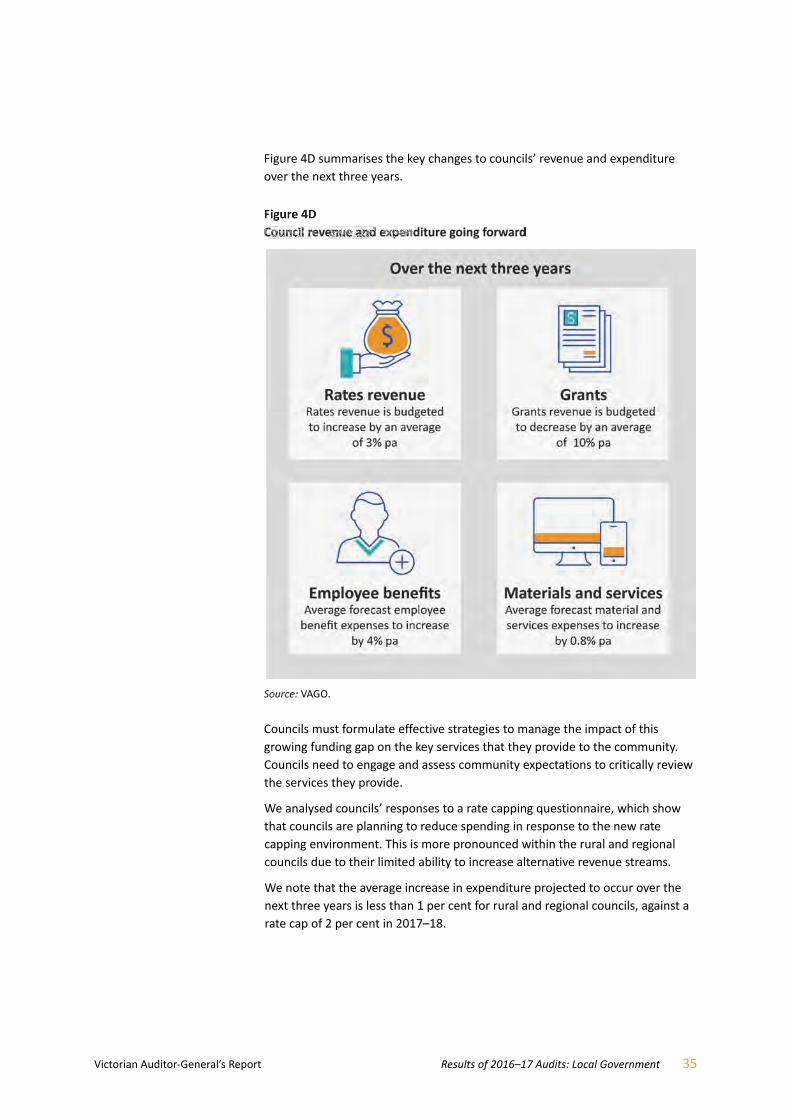
Figure 4D summarises the key changes to councils’ revenue and expenditure
over the next three years.
VAGO.
Councils must formulate effective strategies to manage the impact of this
growing funding gap on the key services that they provide to the community.
Councils need to engage and assess community expectations to critically review
the services they provide.
We analysed councils’ responses to a rate capping questionnaire, which show
that councils are planning to reduce spending in response to the new rate
capping environment. This is more pronounced within the rural and regional
councils due to their limited ability to increase alternative revenue streams.
We note that the average increase in expenditure projected to occur over the
next three years is less than 1 per cent for rural and regional councils, against a
rate cap of 2 per cent in 2017–18.

36 Results of 2016–17 Audits: Local Government Victorian Auditor-General’s Report
Adjusted underlying result indicator
This indicator measures a council’s ability to generate surplus from its ordinary
course of business. Figure 4E shows the results of this indicator across two
categories of councils.
Councils began preparing performance statements in 2014–15.
VAGO.
For metropolitan councils, the actual and forecast adjusted underlying result are
consistently above 5 per cent. This highlights their ability to generate surpluses
from various revenue streams and service larger populations.
Rural and regional councils are budgeting to spend more that they can raise.
More than 30 per cent of councils in this category are forecasting deficits for the
next three years. The majority of councils in this category are facing additional
financial pressures due to smaller year-on-year revenue increases and steady
increases in expenditure.
A longer-term negative trend in this indicator will have an adverse impact on the
services that these councils are able to offer to their communities. It is
important that councils can generate positive surpluses, and councils’ ability to
do so will assist them in the longer term to generate sufficient funds to keep
delivering the service levels that their communities expect.
-10%
-5%
0%
5%
10%
15%
2014–15 2015–16 2016–17 2017–18 2018–19 2019–20
Percentageof Revenue
Metro and interface councils
Metro and interface councils (forecast)
Large, regional and small councils
Large, regional and small councils (forecast)
The adjusted underlying result indicator excludes non-recurrent capital grants, non-monetary asset contributions, and other contributions to fund capital expenditure from net result.
Victorian Auditor-General’s Report Results of 2016–17 Audits: Local Government 37
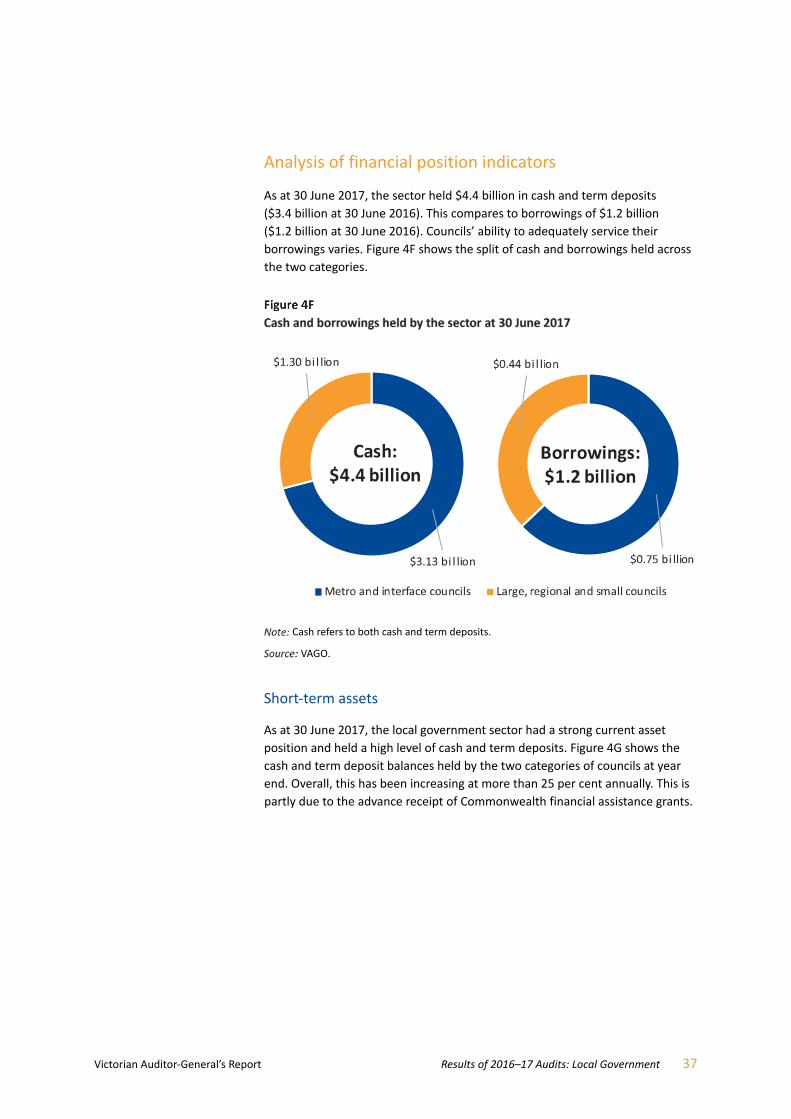
Analysis of financial position indicators
As at 30 June 2017, the sector held $4.4 billion in cash and term deposits
($3.4 billion at 30 June 2016). This compares to borrowings of $1.2 billion
($1.2 billion at 30 June 2016). Councils’ ability to adequately service their
borrowings varies. Figure 4F shows the split of cash and borrowings held across
the two categories.
Cash refers to both cash and term deposits.
VAGO.
Short-term assets
As at 30 June 2017, the local government sector had a strong current asset
position and held a high level of cash and term deposits. Figure 4G shows the
cash and term deposit balances held by the two categories of councils at year
end. Overall, this has been increasing at more than 25 per cent annually. This is
partly due to the advance receipt of Commonwealth financial assistance grants.

38 Results of 2016–17 Audits: Local Government Victorian Auditor-General’s Report
VAGO.
As shown in Figure 4G, metropolitan councils holds substantially more cash than
the rural and regional category. However, we note that the majority of
associated liabilities for metropolitan councils are longer term, to fund the
infrastructure needs of growing communities.
Rural and regional councils show a stable level of cash and term deposits in the
forecast period.
Indebtedness indicator
Our indebtedness indicator assesses whether councils are able to meet their
debt servicing and repayment obligations from their own-sourced revenue.
Figure 4H details the results of this indicator for the sector.
Of the 79 councils, 69 had some level of debt on their balance sheet at
30 June 2017. Analysis of these councils shows:
interest-bearing liabilities to total revenue of 12 per cent
net borrowing costs to total revenue of less than 1 per cent and net borrowing costs to rate revenue of less than 2 per cent.
0.0
0.5
1.0
1.5
2.0
2.5
3.0
3.5
2012–13 2013–14 2014–15 2015–16 2016–17 2017–18 2018–19 2019–20
$ billion
Metro and interface councils
Metro and interface councils (forecast)
Large, regional and small councils
Large, regional and small councils (forecast)
The indebtedness indicator looks at whether entities are able to meet their longer-term liabilities from their own-sourced revenue.

Victorian Auditor-General’s Report Results of 2016–17 Audits: Local Government 39
VAGO.
Across the sector, the average percentage of indebtedness over the five-year
period to 2016–17 is around 24.5 per cent. This percentage is trending lower,
underlining the sector’s preference to avoid borrowing. The average debt
balance of the sector over a five-year period from 2012–13 to 2016–17 was
$1.1 billion, compared to the average cash and term deposit balance of
$2.9 billion.
Figure 4I shows the borrowings balance from 2012–13 to 2019-20 by the two
categories and across the sector.
VAGO.
0%
5%
10%
15%
20%
25%
30%
2012–13 2013–14 2014–15 2015–16 2016–17 2017–18 2018–19 2019–20
All councils All councils (forecast)
Debt as a percentage
of revenue
0.0
0.2
0.4
0.6
0.8
1.0
1.2
1.4
1.6
2012–13 2013–14 2014–15 2015–16 2016–17 2017–18 2018–19 2019–20
$ billion
Metro and interface councilsMetro and interface councils (forecast)Large, regional and small councilsLarge, regional and small councils (forecast)All councilsAll councils (forecast)

40 Results of 2016–17 Audits: Local Government Victorian Auditor-General’s Report
Figure 4I shows stable levels of long-term debt by rural and regional councils. In
contrast, metropolitan councils are forecasting an increase in borrowings. We
note that this increase in partly due to borrowings planned by Melbourne City
Council for infrastructure redevelopment.
Internal financing indicator
This indicator examines the capacity of the sector to fund capital expenditure
using cash generated from operations and government funding each year.
Figure 4J shows the results of the sector for this indicator between 2012–13 and
2019–20.
VAGO.
The internal financing indicator result is influenced by the timing of
Commonwealth grant funding received by the sector. In most of the past five
years, a proportion of this annual funding has been granted toward the end of
the financial year. However, this is not always the case—the dip in 2013–2014
is due to the receipt of Commonwealth grant funding after 30 June for that
year. In contrast, the significant increase in this indicator at 30 June 2017 is
also due to the advance receipt of a Commonwealth funding for 2017–18 on
7 June 2017.
0%
20%
40%
60%
80%
100%
120%
140%
160%
180%
2012–13 2013–14 2014–15 2015–16 2016–17 2017–18 2018–19 2019–20
All councils All councils (forecast)

Victorian Auditor-General’s Report Results of 2016–17 Audits: Local Government 41
Asset renewal and maintenance indicators analysis
A key risk for councils is maintaining and renewing their extensive infrastructure
networks while operating at sustainable levels. We assess councils’ spending on
assets through the capital replacement and renewal gap indicators.
Capital replacement indicator
The sector’s result for this indicator is shown in Figure 4K.
VAGO.
Figure 4K shows that the sector is budgeting for a sharp increase in capital
spending during 2017–18. This spending is then forecast to decline. Councils
are reducing their capital spending mainly in response to rate capping and a
reduction in government grants.
Although spending on capital replacement is budgeted to improve significantly
in the near term for the sector as a whole, our analysis shows that this
longer-term asset planning measure has been declining across the majority
of councils in the last three years.
0.0
0.2
0.4
0.6
0.8
1.0
1.2
1.4
1.6
1.8
2.0
2012–13 2013–14 2014–15 2015–16 2016–17 2017–18 2018–19 2019–20
Ratio
All councils All councils (forecast)
The capital replacement indicator measures the level of spending on new and renewed assets compared to the depreciation expense associated with these assets.

42 Results of 2016–17 Audits: Local Government Victorian Auditor-General’s Report
As shown in Figure 4L, metropolitan councils are increasing their asset base at a
higher rate than their rural and regional counterparts. The challenge for rural
and regional councils is to generate enough cash through own-sourced revenue
streams to invest in new and replacement assets. This will also have a direct
impact on the level of service these councils can provide to their communities.
VAGO.
Renewal gap indicator
The renewal gap indicator provides more information on the types of assets
being acquired by councils. It provides an indication of whether spending has
focused on purchasing new assets or renewing and upgrading existing ones.
-
10
20
30
40
50
60
70
80
90
100
2012–13 2013–14 2014–15 2015–16 2016–17 2017–18 2018–19 2019–20
$ billion
Metro and interface councils
Metro and interface councils (forecast)
Large, regional and small councils
Large, regional and small councils (forecast)
All councils
All councils (forecast)

Victorian Auditor-General’s Report Results of 2016–17 Audits: Local Government 43
Figure 4M shows the results of this indicator over eight financial years, for the
two categories.
VAGO.
The renewal gap indicator broadly mirrors the trend of the capital replacement
indicator. Similar to capital replacement, 2017–18 council budgets for asset
renewals do not reflect the historic declining trend.
With regard to the renewal gap indicator, rural and regional councils are
trending below 1:1. This highlights the need for councils to prioritise asset
maintenance as part of their planning processes. This renewal gap is forecast to
trend sharply downward in response to rate capping. In order for these councils
to meet community needs and expectations, they must actively monitor their
rate of spending and remain focused on maintaining assets at serviceable levels
as they age.
In the short to medium term, rural and regional councils may need to defer
spending on new assets or consider adding debt as a funding measure, to
improve their existing assets. This will ensure current ratepayers who are using
these assets now—rather than future ratepayers— bear the costs associated
with them.
0.75
0.85
0.95
1.05
1.15
1.25
1.35
2012–13 2013–14 2014–15 2015–16 2016–17 2017–18 2018–19 2019–20
Renewal gap indicator
Metropolitan and interface councilsMetropolitan and interface councils (forecast)Large, regional and small councilsLarge, regional and small councils (forecast)
The renewal gap indicator compares the rate of spending through renewing, restoring and replacing existing assets to its depreciation expense.
Spending above the rate at which an asset is being used indicates that an entity is sufficiently renewing its assets and optimising their use.


Victorian Auditor-General’s Report Results of 2016–17 Audits: Local Government 45
In 2015, the Victorian Government introduced rate capping legislation in the
form of its Fair Go Rates System. This system controls general rate increases for
all councils. The annual rate cap is set by the Minister for Local Government.
We assessed local councils’ response to the rate capping regime in the short
term and their budgeting process from a medium- to long-term perspective.
The majority of councils identified rate capping as a long-term viability risk.
Longer-term planning tools—for the next 10 to 20 years—are essential for
assessing and responding to community expectations. Further, this will assist
councils to develop robust asset maintenance programs.
Councils need to clearly identify the individual services they provide and
determine the cost of providing them to the community. This will assist them to
determine the community’s service requirements and find efficient ways to
provide them. In this regard, community consultation is critical.
Councils must also consider collaborative arrangements with other councils as a
cost-effective way to deliver services.
Rate cappingimpact assessment
Conclusion
The 2016–17 financial year is the first year of rate capping—rate increases are capped at 2.5 per cent (2 per cent in 2017–18).

46 Results of 2016–17 Audits: Local Government Victorian Auditor-General’s Report
Rate revenue, as a proportion of total revenue, increased between 2012–13 and
2016–17, as shown in Figure 5A. Councils forecast this trend to continue despite
the impact of rate capping. This is partly due to decreases in government grant
funding for the sector.
VAGO.
Councils—especially rural and regional cohorts—have a limited capacity to
generate additional own-sourced revenue. Therefore, reducing expenditure and
prioritising service delivery become key considerations for managing their cash
flow in the future. Figure 5B shows the estimated impact of the rate capping
regime across the local government sector.
VAGO, based on analysis of published council budgets prepared before and after rate capping.
52% 56% 54% 56% 56% 58% 59% 60%
0%
20%
40%
60%
80%
100%
2012–13 2013–14 2014–15 2015–16 2016–17 2017–18 2018–19 2019–20
Rates and charges Other revenue
Rates and charges (forecast) Other revenue (forecast)
0
1
2
3
4
5
6
7
8
2011–12 2012–13 2013–14 2014–15 2015–16 2016–17 2017–18 2018–19 2019–20 2020–21
$ billion
Annual shortfall Cumulative shortfallActual Pre-rate capping estimateProjected pre-rate capping estimate Post-rate capping estimate
Rate revenue

Victorian Auditor-General’s Report Results of 2016–17 Audits: Local Government 47
The sector forecasts that the cumulative projected rate revenue gap is
approximately $1.6 billion over the next three years. This highlights the
requirement for councils to use the budgeting process appropriately, to adjust
their operational and capital spending in future years. In responding to this
shortfall, councils must also assess community expectations on service delivery
and its financial viability.
Review of council services and cost of provision
The cost of individual services that councils provide—broken down into direct
and overhead elements—is a key tool for council management to assess
efficiencies in service provision. Coupled with service reviews to identify
non-essential services, a comprehensive costing analysis of services would be
a powerful tool for councils to mitigate some of the expected funding pressures
that the sector will face as a result of rate capping.
This costing could be partially informed by councils’ analysis and reporting for
their annual baseline data submissions to the Essential Services Commission.
A majority of councils have predicted short-term impacts on their operations
following the introduction of rate capping. Common council responses through
the budgeting process include:
seeking additional revenue streams, such as full user-pays models for service delivery and the sale of council-owned surplus assets
reducing capital programs, including freezing new capital works in the short term and focusing more on asset renewal than asset acquisitions
increasing efficiency in service delivery through the use of new technology and cost reduction.
We note that a small number of councils are also opting to apply for a rate
increase above the capped amount, as a short-term funding measure.
Importance of community consultation
To understand the impact of rate capping on the users of their services, councils
need to engage with their communities. This can provide a council with a clear
idea of the services and projects that their community expects and values. It is
also a useful tool for communicating the actions that the council needs to take
in response to having less revenue to fund the services that it provided
previously.
Where councils are engaging with the community, consultation varies from
workshops to media campaigns, to promote awareness, engage community
members and collect valuable input for council decision-making.
Figure 5C is a case study of better practice community engagement at Casey City
Council.
Short-term impacts of rate
capping

48 Results of 2016–17 Audits: Local Government Victorian Auditor-General’s Report
Background
Casey City Council is located in Melbourne’s south-eastern suburbs, covering an area of 409 square kilometres. It includes Berwick, Cranbourne, Hallam, Hampton Park and Narre Warren. Casey is Victoria’s largest council, with an approximate population of 304 000 residents, which is forecast to grow to over 500 000 by 2040.
Council assessment of the impact of rate capping on future operations
Due to rate capping, the council forecast a $168 million decrease in rate revenue over 10 years and estimated a decrease of $3 million per year in funds available for capital works. The expected impact on operations included:
delaying non-critical capital works and reducing the asset maintenance program to match funding
funding major capital projects with new debt
being unable to deliver required services to the community in the longer term
future enterprise bargaining agreements being aligned with future rate increases.
Council responses to rate capping
In March 2016, Casey applied to the Essential Services Commission for a rate capping variation of 0.97 per cent above the cap limit of 2.5 per cent for 2016–17. Council performed a detailed assessment on the impact of rate capping as part of the application process.
The Essential Services Commission’s reasons for rejecting the application included the council’s underspending on its capital expenditure budget. Over the past five years, Casey had on an average underspent its capital expenditure budget by $14 million per year. The Essential Services Commission concluded that it was reasonable to expect Casey to manage its overall capital works program to match available funding.
During 2015–16, the council informed the community about the rate cap variation application through targeted community engagement programs, Casey Let’s Chat and Building Our Future. Further community engagement activities—People’s Panel and Casey Next—took place in 2016–17.
Feedback from Casey Next included recommendations on what the community thought the council should focus on. This feedback was captured by the council and conveyed through its planning document. People’s Panel provided recommendations about how the council should manage long-term financial challenges. The council incorporated all recommendations from this community consultation process into its long-term plan.
Casey also formulated strategic programs to manage council assets, expenditure and revenue:
The council completed an efficiency and effectiveness program, which resulted in an organisational restructure, a more agile workplace and, in turn, significant cost savings. The recommendations from People’s Panel and Casey Next confirmed and validated the importance and type of work being undertaken by the council’s efficiency and effectiveness program.
The council’s property strategy helped identify several surplus commercial properties as being owned by the council. The council has since decided to sell these properties over the next three years, forecasting cash inflows of $18 million.
The council set a clear debt policy, including setting a maximum leverage ratio of the total project cost.

Victorian Auditor-General’s Report Results of 2016–17 Audits: Local Government 49
Conclusion
Managing community expectations Casey engaged extensively with the community to understand its needs and used the knowledge to frame its response through various strategic initiatives.
Engagement with staff Rate capping will affect negotiations of future enterprise bargaining agreements. It is important that the council discusses these impacts with its staff and their bargaining representatives in a timely manner, to avoid any disputes that may affect operations.
Longer-term planning Councils need to have a longer-term plan that takes into consideration community expectations and asset management strategies.
VAGO.
Most councils identified rate capping as a strategic risk in their risk registers. In
response, they are planning various initiatives to assess the impact on the
services they provide and their asset renewal and maintenance programs.
Responses include:
increasing revenue through:
instituting a full user-pays model for selected council services
identifying additional revenue streams
reducing asset renewal programs over the medium to long term
funding new assets by borrowing rather than accessing cash reserves
reducing expenditure by:
setting enterprise bargaining agreement negotiations so that wage and salary costs increase in line with forecast rate cap increases
initiating collaborative projects and shared-service models between councils in the same region
introducing efficiency measures, particularly using new technologies such as automated solutions that allow customers to access council services online.
Longer-term capital project planning
Councils need to focus on delivering services to their communities now and
ensuring they can continue to meet community expectations in the future. The
sustainability issues that we highlighted across the sector require a longer-term
planning response. Given the nature of the assets involved, this longer-term
plan should incorporate robust asset management strategies as well.
Through our review, we identified Horsham Rural City Council as a better
practice example of a council reviewing their capital works program—see
Figure 5D.
Longer-term impact and
responses

50 Results of 2016–17 Audits: Local Government Victorian Auditor-General’s Report
Background
Horsham Rural City Council is a small council situated in the Wimmera region of Victoria, approximately 300 kilometres north-west of Melbourne. It has a population of 19 774 and covers an area of 4 267 square kilometres. At 30 June 2017, Horsham had $341 million of infrastructure assets, of which $279 million represented road assets. The council’s existing road network consists of 2 976 kilometres of local roads, of which 32 per cent represents sealed roads.
Road asset renewal versus asset additions
The council identified a growing gap in the level of renewal funding it required to maintain its existing road assets. Due to external factors such as soil conditions, the use of the local road network by larger vehicles and farming practices in the Wimmera region, the council’s road network deteriorates at an accelerated rate. The council also noted that when road assets deteriorate beyond a certain point, the renewal cost exponentially increases.
Horsham engaged an independent contractor during 2013–14 to perform a condition assessment of the council-owned road network. The report costed the gap in renewal funding at $6.5 million. The contractor recommended that the council increase its annual expenditure on road asset renewal by 3 per cent per annum over the subsequent 10 financial years.
The table below illustrates how the council plans to increase infrastructure renewal funding over the medium term by reduce funding allocations for new capital works.
Asset funding 2017–18 2018–19 2019–20 2020–21
Asset renewal ($m) 8.5 7.0 9.7 9.8
New assets ($m) 7.3 6.3 4.8 2.4
Total budgeted capital works expenditure ($m)
18.3 14.9 15.4 15.1
Asset renewal as percentage of total capital works
46% 47% 63% 65%
VAGO.
Internally, the council allocates a portion of each year’s rate increase as an infrastructure levy intended to close the asset renewal gap. One of the council’s objectives is to ensure that rate increases establish sustainable capital funding for asset renewal.
Increase in rate capping
Horsham successfully submitted an application to the Essential Services Commission for a rate capping exemption for the 2016–17 financial year. The council requested an increase of 1 per cent over the rate cap of 2.5 per cent. The main reason the council cited was the growing gap in the renewal funding it required to maintain the condition of its existing road assets.
VAGO.

Victorian Auditor-General’s Report Results of 2016–17 Audits: Local Government 51
Currently, many budgeting tools used by councils include only a four-year
strategic report plan and a one-year detailed budget. Proposed legislative
changes require councils to have longer-term forecasts. This will help councils
to manage funding pressures more proactively and deliver services more
efficiently.
Shared-service arrangements
One way that councils plan to rationalise costs is by sharing various services and
functions with other councils, to take advantage of collective bargaining
arrangements.


Victorian Auditor-General’s Report Results of 2016–17 Audits: Local Government 53
Audit Act 1994 section 16—submissions and comments We have consulted with DELWP and the councils named in this report, and we
considered their views when reaching our audit conclusions. As required by
section 16(3) of the Audit Act 1994, we gave a draft copy of this report, or
relevant extracts, to those agencies and asked for their submissions and
comments. We also provided a copy of the report to the Department of Premier
and Cabinet.
Responsibility for the accuracy, fairness and balance of those comments rests
solely with the agency head.
Responses were received as follows:
DELWP ................................................................................................................. 54
—Auditor-General’s response to the Secretary, DELWP ....................................... 56
Horsham Rural City Council ................................................................................. 57
City of Kingston .................................................................................................... 58
City of Moonee Valley.......................................................................................... 59
Moreland City Council ......................................................................................... 60
City of Stonnington .............................................................................................. 61

54 Results of 2016–17 Audits: Local Government Victorian Auditor-General’s Report
RESPONSE provided by the Secretary, DELWP

Victorian Auditor-General’s Report Results of 2016–17 Audits: Local Government 55
RESPONSE provided by the Secretary, DELWP—continued

56 Results of 2016–17 Audits: Local Government Victorian Auditor-General’s Report
Auditor-General’s response to the Secretary, DELWP
Since sending the proposed report to DELWP for comment, we have issued
three additional audit opinions—two for Central Goldfields Shire Council
(financial report and performance statement) and one for MomentumOne
Shared Services Pty Ltd. All three were clear audit opinions, and this report
reflects the final number of clear audit opinions issued.

Victorian Auditor-General’s Report Results of 2016–17 Audits: Local Government 57
RESPONSE provided by the Chief Executive, Horsham Rural City Council

58 Results of 2016–17 Audits: Local Government Victorian Auditor-General’s Report
RESPONSE provided by the Chief Executive Officer, City of Kingston
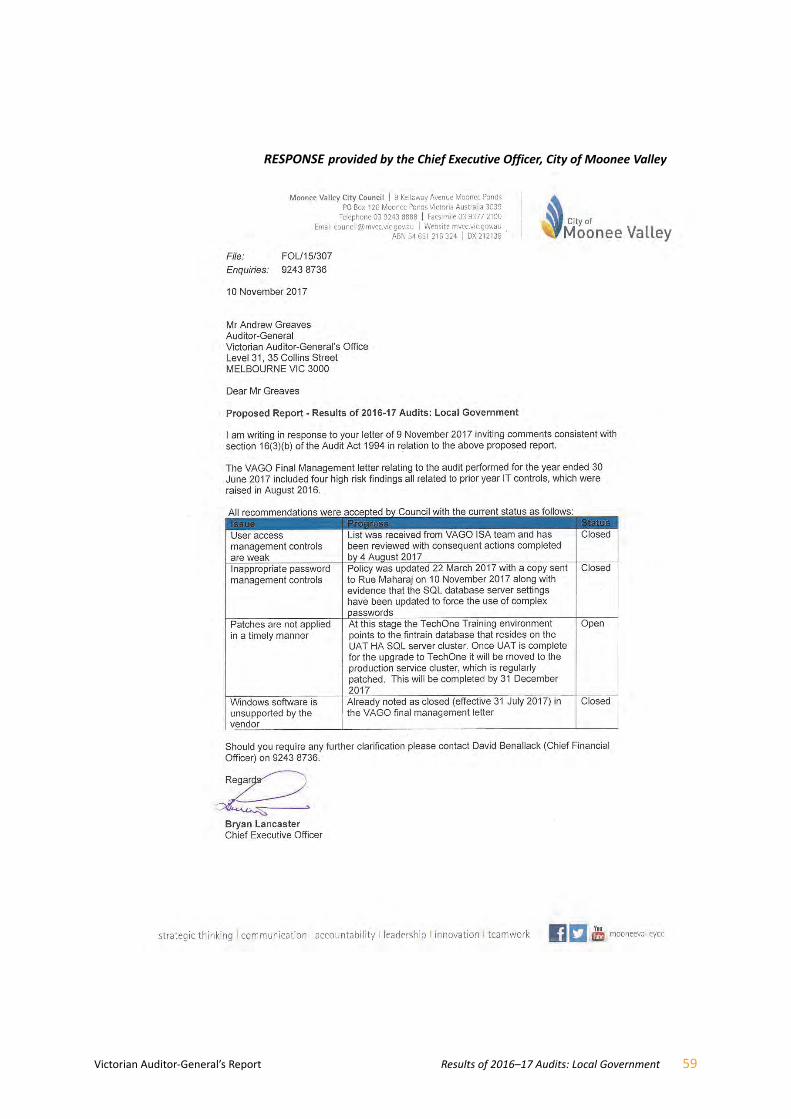
Victorian Auditor-General’s Report Results of 2016–17 Audits: Local Government 59
RESPONSE provided by the Chief Executive Officer, City of Moonee Valley

60 Results of 2016–17 Audits: Local Government Victorian Auditor-General’s Report
RESPONSE provided by the Chief Executive Officer, Moreland City Council

Victorian Auditor-General’s Report Results of 2016–17 Audits: Local Government 61
RESPONSE provided by the General Manager Corporate Services,
City of Stonnington

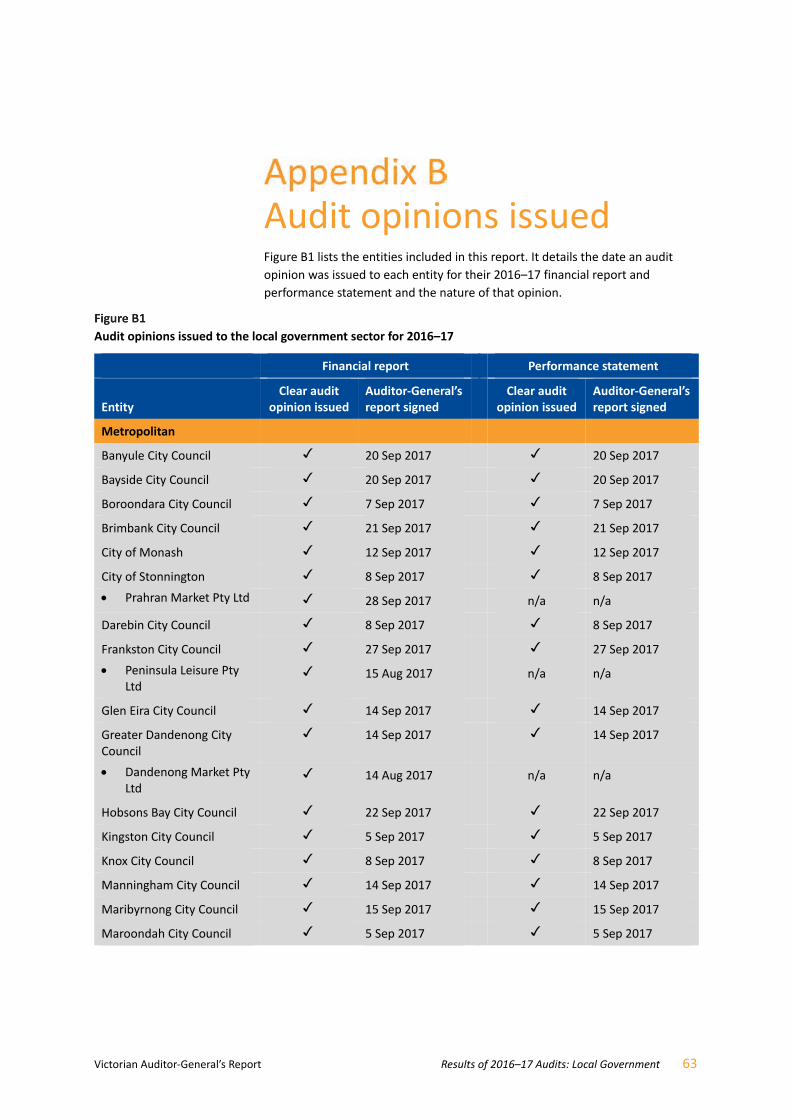
Victorian Auditor-General’s Report Results of 2016–17 Audits: Local Government 63
Audit opinions issued Figure B1 lists the entities included in this report. It details the date an audit
opinion was issued to each entity for their 2016–17 financial report and
performance statement and the nature of that opinion.
Audit opinions issued to the local government sector for 2016–17
Financial report Performance statement
Entity Clear audit
opinion issued Auditor-General’s report signed
Clear audit opinion issued
Auditor-General’s report signed
Metropolitan
Banyule City Council 20 Sep 2017 20 Sep 2017
Bayside City Council 20 Sep 2017 20 Sep 2017
Boroondara City Council 7 Sep 2017 7 Sep 2017
Brimbank City Council 21 Sep 2017 21 Sep 2017
City of Monash 12 Sep 2017 12 Sep 2017
City of Stonnington 8 Sep 2017 8 Sep 2017
Prahran Market Pty Ltd 28 Sep 2017 n/a n/a
Darebin City Council 8 Sep 2017 8 Sep 2017
Frankston City Council 27 Sep 2017 27 Sep 2017
Peninsula Leisure Pty Ltd
15 Aug 2017 n/a n/a
Glen Eira City Council 14 Sep 2017 14 Sep 2017
Greater Dandenong City Council
14 Sep 2017 14 Sep 2017
Dandenong Market Pty Ltd
14 Aug 2017 n/a n/a
Hobsons Bay City Council 22 Sep 2017 22 Sep 2017
Kingston City Council 5 Sep 2017 5 Sep 2017
Knox City Council 8 Sep 2017 8 Sep 2017
Manningham City Council 14 Sep 2017 14 Sep 2017
Maribyrnong City Council 15 Sep 2017 15 Sep 2017
Maroondah City Council 5 Sep 2017 5 Sep 2017

64 Results of 2016–17 Audits: Local Government Victorian Auditor-General’s Report
Figure B1
Audit opinions issued to the local government sector for 2016–17—continued
Financial report Performance statement
Entity Clear audit
opinion issued Auditor-General’s report signed
Clear audit opinion issued
Auditor-General’s report signed
Melbourne City Council 11 Sep 2017 11 Sep 2017
Citywide Service Solutions Pty Ltd
30 Aug 2017 n/a n/a
Queen Victoria Market Pty Ltd
4 Sep 2017 n/a n/a
Regent Management Company Pty Ltd
25 Sep 2017 n/a n/a
SMF Investment Management Pty Ltd
4 Sep 2017 n/a n/a
Sustainable Melbourne Fund
4 Sep 2017 n/a n/a
Moonee Valley City Council 14 Sep 2017 14 Sep 2017
Moreland City Council 25 Sep 2017 25 Sep 2017
Port Phillip City Council 12 Sep 2017 12 Sep 2017
Whitehorse City Council 22 Aug 2017 22 Aug 2017
Yarra City Council 25 Sep 2017 25 Sep 2017
Interface
Cardinia Shire Council 19 Sep 2017 19 Sep 2017
Casey City Council 8 Sep 2017 8 Sep 2017
City of Whittlesea 12 Sep 2017 12 Sep 2017
Hume City Council 13 Sep 2017 13 Sep 2017
Melton City Council 25 Sep 2017 25 Sep 2017
Mornington Peninsula Shire Council
22 Sep 2017 22 Sep 2017
Nillumbik Shire Council 5 Sep 2017 5 Sep 2017
Wyndham City Council 21 Sep 2017 21 Sep 2017
Western Leisure Services Pty Ltd
14 Sep 2017 n/a n/a
Yarra Ranges Shire Council 24 Aug 2017 24 Aug 2017

Victorian Auditor-General’s Report Results of 2016–17 Audits: Local Government 65
Figure B1
Audit opinions issued to the local government sector for 2016–17—continued
Financial report Performance statement
Entity Clear audit
opinion issued Auditor-General’s report signed
Clear audit opinion issued
Auditor-General’s report signed
Regional
Ballarat City Council 18 Sep 2017 18 Sep 2017
Greater Bendigo City Council
22 Sep 2017 22 Sep 2017
Greater Geelong City Council 8 Sep 2017 8 Sep 2017
Greater Shepparton City Council
25 Sep 2017 25 Sep 2017
Horsham Rural City Council 27 Sep 2017 27 Sep 2017
Latrobe City Council 13 Sep 2017 13 Sep 2017
Mildura Rural City Council 27 Sep 2017 27 Sep 2017
Mildura Airport Pty Ltd 27 Sep 2017 n/a n/a
Wangaratta Rural City Council
27 Sep 2017 27 Sep 2017
Warrnambool City Council 25 Sep 2017 25 Sep 2017
Wodonga City Council 25 Sep 2017 25 Sep 2017
Large shire
Bass Coast Shire Council 28 Sep 2017 28 Sep 2017
Baw Baw Shire Council 22 Sep 2017 22 Sep 2017
Campaspe Shire Council 25 Sep 2017 25 Sep 2017
Colac-Otway Shire Council 22 Sep 2017 22 Sep 2017
Corangamite Shire Council 27 Sep 2017 27 Sep 2017
East Gippsland Shire Council 19 Sep 2017 19 Sep 2017
Glenelg Shire Council 28 Sep 2017 28 Sep 2017
Golden Plains Shire Council 14 Sep 2017 14 Sep 2017
Macedon Ranges Shire Council
28 Sep 2017 28 Sep 2017
Mitchell Shire Council 21 Sep 2017 21 Sep 2017
Moira Shire Council 25 Sep 2017 25 Sep 2017
Moorabool Shire Council 14 Sep 2017 14 Sep 2017
Mount Alexander Shire Council
26 Sep 2017 26 Sep 2017
Moyne Shire Council 27 Sep 2017 27 Sep 2017

66 Results of 2016–17 Audits: Local Government Victorian Auditor-General’s Report
Figure B1
Audit opinions issued to the local government sector for 2016–17—continued
Financial report Performance statement
Entity Clear audit
opinion issued Auditor-General’s report signed
Clear audit opinion issued
Auditor-General’s report signed
South Gippsland Shire Council
28 Sep 2017 28 Sep 2017
Southern Grampians Shire Council
15 Sep 2017 15 Sep 2017
Surf Coast Shire Council 14 Sep 2017 14 Sep 2017
Swan Hill Rural City Council 27 Sep 2017 27 Sep 2017
Wellington Shire Council 27 Sep 2017 27 Sep 2017
Small shire
Alpine Shire Council 25 Sep 2017 25 Sep 2017
Ararat Rural City Council 27 Sep 2017 27 Sep 2017
Benalla Rural City Council 28 Sep 2017 28 Sep 2017
Borough of Queenscliffe 26 Sep 2017 26 Sep 2017
Buloke Shire Council 19 Sep 2017 19 Sep 2017
Central Goldfields Shire Council
9 Nov 2017 9 Nov 2017
Gannawarra Shire Council 26 Sep 2017 26 Sep 2017
Hepburn Shire Council 26 Sep 2017 26 Sep 2017
Hindmarsh Shire Council 25 Sep 2017 25 Sep 2017
Indigo Shire Council 25 Sep 2017 25 Sep 2017
Loddon Shire Council 29 Aug 2017 29 Aug 2017
Mansfield Shire Council 20 Sep 2017 20 Sep 2017
Murrindindi Shire Council 28 Sep 2017 28 Sep 2017
Northern Grampians Shire Council
27 Sep 2017 27 Sep 2017
Pyrenees Shire Council 26 Sep 2017 26 Sep 2017
Strathbogie Shire Council 26 Sep 2017 26 Sep 2017
Towong Shire Council 28 Sep 2017 Qualified(a) 28 Sep 2017
West Wimmera Shire Council
22 Sep 2017 22 Sep 2017
Yarriambiack Shire Council 27 Sep 2017 27 Sep 2017

Victorian Auditor-General’s Report Results of 2016–17 Audits: Local Government 67
Figure B1
Audit opinions issued to the local government sector for 2016–17—continued
Financial report Performance statement
Entity Clear audit
opinion issued Auditor-General’s report signed
Clear audit opinion issued
Auditor-General’s report signed
Regional Library Corporations(b)
Casey-Cardinia Regional Library Corporation
5 Sep 2017 n/a n/a
Corangamite Regional Library Corporation
15 Sep 2017 n/a n/a
Eastern Regional Library Corporation
29 Aug 2017 n/a n/a
Geelong Regional Library Corporation
28 Aug 2017 n/a n/a
Goulburn Valley Regional Library Corporation
19 Sep 2017 n/a n/a
North Central Goldfields Regional Library Corporation
25 Sep 2017 n/a n/a
West Gippsland Regional Library Corporation
13 Sep 2017 n/a n/a
Whitehorse-Manningham Regional Library Corporation
19 Sep 2017 n/a n/a
Wimmera Regional Library Corporation
27 Sep 2017 n/a n/a
Yarra Plenty Regional Library Corporation
21 Sep 2017 n/a n/a
Associated entities
Clayton Landfill Joint Venture 17 Aug 2017 n/a n/a
MAPS Group Limited(c) – Not yet issued n/a n/a
MomentumOne Shared Services Pty Ltd
13 Nov 2017 n/a n/a
RFK Pty Ltd / Community Chef
9 Oct 2017 n/a n/a
Regional Kitchen Pty Ltd 9 Oct 2017 n/a n/a
Wimmera Development Association
27 Sep 2017 n/a n/a
See Part 2 of this report for further information on the qualified audit opinion issued.
High Country Library Corporation ceased operations in 2016. An audit opinion had not been issued at the date of this report.
MAPS Group Limited has a 30 September balance date. The 2016 audit opinion was issued on 6 December 2016. The 2017 audit opinion has not been issued as at the date of this report.
n/a = not applicable.
VAGO.


Victorian Auditor-General’s Report Results of 2016–17 Audits: Local Government 69
Upcoming changes to financial reporting Upcoming changes accounting standards over the next three years may require
substantial adjustments by not-for-profit organisations, including councils.
Figure C1 shows a time line of changes impacting the sector.
Time line of upcoming changes in accounting and auditing standards
VAGO.
Streamlining of financial reports
15 December 2016ASA 701Communicating Key Audit Matters in the Independent Auditor’s Report
15 December 2016ASA 700Forming an Opinion and Reporting on a Financial Report
1 January 2018AASB 9Financial Instruments
1 January 2018AASB 15Revenue from Contracts with Customers
Changes in auditing standards
Changes in accounting standards
1 July 2017 1 July 2018 1 July 2019
1 January 2019AASB 16Leases
1 January 2019AASB 1058Income of Not-for-ProfitEntities
70 Results of 2016–17 Audits: Local Government Victorian Auditor‐General’s Report
What do councils need to do?
2017–18—Streamlining of financial reports
Councils should look at simplification of financial reporting as a real opportunity
to use financial reports to engage with various stakeholders in a more
meaningful manner. We encourage councils to:
implement effective internal systems and governance structures to enable accurate and timely month end and year end reporting
explain significant judgements and complex calculations impacting any material information presented through the financial report
fully communicate any financial risks including complex transactions, impairment and any financial sustainability risks
highlight and include commentary on unusual transactions
inform the reader through meaningful analysis of key balances and transactions
incorporate easy‐to‐read design features and plain English
remove irrelevant disclosures and notes
include only disclosures that are material to the entity.
2018–19—AASB 9 Financial Instruments
This new accounting standard will apply from financial year 2018–19 and
replaces the existing rules‐based approach to financial instruments with
simplified principles. A deeper understanding of how an entity manages its
financial instruments will be required to apply this standard. Depending on
circumstances, subsequent measurement of financial instruments will more
likely be at fair value.
This standard is not likely to have a significant impact in the local government
sector.
2018–19—AASB 15 Revenue from Contracts with Customers
(2019–20 for not‐for‐profit entities including councils)
While these new requirements are not mandatory for the not‐for‐profit sector
until 1 January 2019, they represent a major change in how the sector
recognises revenue.
This standard shifts the focus from transaction‐level accounting to a
contract‐based accounting approach. This accounting standard will have a
significant impact on council profit and loss statements, with revenue from
grants or donations recognised only when the specific performance obligation
to provide the goods or services is satisfied.

Victorian Auditor-General’s Report Results of 2016–17 Audits: Local Government 71
2019–20—AASB 16 Leases
The accounting standard on leases will apply from 2019–20, and entities can
elect not to restate comparatives.
This accounting standard will have a significant impact on council balance sheets
with various contractual arrangements including asset-dependent service
contracts (such as waste management contracts) potentially triggering lease
accounting requirements.
2019–20—AASB 1058 Income of Not-for-profit Entities
This standard applies to all income that is not captured by AASB 15 Revenue
from Contracts with Customers and will apply from 2019–20. Earlier application
is permitted, provided entities also apply AASB 15 to the same period.
This standard is likely to have a significant impact on councils in two key areas:
volunteer services—if fair value of the services can be reliably measured and would otherwise be purchased, the entity must elect to recognise the services as an expense and recognise a corresponding revenue
grant income—revenue recognition will depend on the nature of the grant and, in particular, if the grant agreement places specific, clear performance obligations on the council.
Exposure draft on Reporting Service Performance Information
This exposure draft establishes principles and requirements for an entity to
report service performance information. Councils, through existing performance
reporting activities, may achieve the objective of the standard.


Victorian Auditor-General’s Report Results of 2016–17 Audits: Local Government 73
Management letter risk ratings Figure D1 shows the risk ratings applied to management letter issues raised
during a financial audit.
Definitions of risk ratings for issues reported in audit management letters
Rating Definition Management action required
Extreme The issue represents:
a control weakness which could cause or is causing severe disruption of the process or severe adverse effect on the ability to achieve process objectives and comply with relevant legislation, or
a material misstatement in the financial report has occurred.
Requires immediate management intervention with a detailed action plan to be implemented within one month.
Requires executive management to correct the material misstatement in the financial report as a matter of urgency to avoid a modified audit opinion.
High The issue represents:
a control weakness which could have or is having a major adverse effect on the ability to achieve process objectives and comply with relevant legislation, or
a material misstatement in the financial report that is likely to occur.
Requires prompt management intervention with a detailed action plan implemented within two months.
Requires executive management to correct the material misstatement in the financial report to avoid a modified audit opinion.
Medium The issue represents:
a control weakness which could have or is having a moderate adverse effect on the ability to achieve process objectives and comply with relevant legislation, or
a misstatement in the financial report that is not material and has occurred.
Requires management intervention with a detailed action plan implemented within three to six months.
Low The issue represents:
a minor control weakness with minimal but reportable impact on the ability to achieve process objectives and comply with relevant legislation, or
a misstatement in the financial report that is likely to occur but is not expected to be material, or
an opportunity to improve an existing process or internal control.
Requires management intervention with a detailed action plan implemented within six to 12 months.
VAGO.


Victorian Auditor-General’s Report Results of 2016–17 Audits: Local Government 75
IT control deficiencies Figure E1 shows the IT control deficiencies for each council.
IT control deficiencies for each council
Council Name
Unsupported systems and
software User access
controls
Patch management
controls Other IT controls
Ballarat City Council – 2 1 –
Bayside City Council – – 1 2
Boroondara City Council – – 2 –
Borough of Queenscliff – 1 – –
Cardinia Shire Council 1 – 1 –
Casey City Council – – – 1
Central Goldfields Shire Council – – – 1
Greater Dandenong City Council 1 – 2 –
Greater Geelong City Council 1 – 1 –
Hobsons Bay City Council – – 2 –
Moonee Valley City Council 1 2 1 –
Moreland City Council – 1 – –
Port Phillip City Council – – 1 –
South Gippsland Shire Council 1 – – 1
Southern Grampians Shire Council – 1 – –
West Wimmera Shire Council – – – 1
Whitehorse City Council 1 2 1 –
Wodonga City Council – 2 – –
Total 6 11 13 6
VAGO.


Victorian Auditor-General’s Report Results of 2016–17 Audits: Local Government 77
Financial sustainability risk indicators Figure F1 lists the indicators used in assessing the financial sustainability risks of
local councils in Part 4 of this report. These indicators should be considered
collectively, and are more useful when assessed over time as part of a trend
analysis.
Our analysis of financial sustainability risk in this report reflects on the position
of each local council.
Financial sustainability risk indictors
Indicator Formula Description
Net result (%) Net result / Total revenue
A positive result indicates a surplus, and the larger the percentage, the stronger the result. A negative result indicates a deficit. Operating deficits cannot be sustained in the long term.
The net result and total revenue are obtained from the comprehensive operating statement.
Adjusted underlying result(a)
Adjusted underlying surplus (or deficit) / Adjusted underlying revenue
Indicator of the broad objective that an adjusted underlying surplus should be generated in the ordinary course of business. A surplus or increasing surplus suggests an improvement in the operating position.
Liquidity (ratio) Current assets / Current liabilities
This measures the ability to pay existing liabilities in the next 12 months.
A ratio of one or more means there are more cash and liquid assets than short-term liabilities.
Internal financing (%) Net operating cash flow / Net capital expenditure
This measures the ability of an entity to finance capital works from generated cash flow.
The higher the percentage, the greater the ability for the entity to finance capital works from their own funds.
Net operating cash flow and net capital expenditure are obtained from the cash flow statement.
Indebtedness (%) Non-current liabilities / own-sourced revenue
Comparison of non-current liabilities (mainly comprising borrowings) to own-sourced revenue. The higher the percentage, the less the entity is able to cover non-current liabilities from the revenues the entity generates itself.
Own-sourced revenue is used, rather than total revenue, because it does not include grants or contributions.

78 Results of 2016–17 Audits: Local Government Victorian Auditor-General’s Report
Figure F1
Financial sustainability risk indictors—continued
Indicator Formula Description
Capital replacement (ratio)
Cash outflows for property, plant and equipment / Depreciation
Comparison of the rate of spending on infrastructure with its depreciation. Ratios higher than 1:1 indicate that spending is faster than the depreciation rate. This is a long-term indicator, as capital expenditure can be deferred in the short term if there are insufficient funds available from operations, and borrowing is not an option. Cash outflows for infrastructure are taken from the cash flow statement. Depreciation is taken from the comprehensive operating statement.
Renewal gap (ratio) Renewal and upgrade expenditure / depreciation
Comparison of the rate of spending on existing assets through renewing, restoring, and replacing existing assets with depreciation. Ratios higher than 1:1 indicate that spending on existing assets is faster than the depreciation rate.
Similar to the investment gap, this is a long-term indicator, as capital expenditure can be deferred in the short term if there are insufficient funds available from operations, and borrowing is not an option. Renewal and upgrade expenditure are taken from the statement of capital works. Depreciation is taken from the comprehensive operating statement.
This is a new financial sustainability risk indicator in this report. The calculation is consistent with councils' performance statements.
VAGO.

Victorian Auditor-General’s Report Results of 2016–17 Audits: Local Government 79
Financial sustainability risk assessment criteria
The financial sustainability risk of each local council has been assessed using the
criteria outlined in Figure F2.
Financial sustainability risk indicators—risk assessment criteria
Risk Net result
Adjusted underlying result Liquidity
Internal financing Indebtedness
Capital replacement Renewal gap
High
Less than negative 10%
Insufficient revenue is being generated to fund operations and asset renewal.
Less than 0%
Insufficient surplus being generated to fund operations
Less than 0.75
Immediate sustainability issues with insufficient current assets to cover liabilities.
Less than 75%
Limited cash generated from operations to fund new assets and asset renewal.
More than 60%
Potentially long-term concern over ability to repay debt levels from own-source revenue.
Less than 1.0
Spending on capital works has not kept pace with consumption of assets.
Less than 0.5
Spending on existing assets has not kept pace with consumption of these assets.
Medium
Negative 10%–0%
A risk of long-term run down to cash reserves and inability to fund asset renewals.
0%–5%
Surplus being generated to fund operations
0.75–1.0
Need for caution with cash flow, as issues could arise with meeting obligations as they fall due.
75–100%
May not be generating sufficient cash from operations to fund new assets.
40–60%
Some concern over the ability to repay debt from own-source revenue.
1.0–1.5
May indicate spending on asset renewal is insufficient.
0.5–1.0
May indicate insufficient spending on renewal of existing assets.
Low
More than 0%
Generating surpluses consistently.
More than 5%
Generating strong surpluses to fund operations
More than 1.0
No immediate issues with repaying short-term liabilities as they fall due.
More than 100%
Generating enough cash from operations to fund new assets.
40% or less
No concern over the ability to repay debt from own-source revenue.
More than 1.5
Low risk of insufficient spending on asset renewal.
More than 1.0
Low risk of insufficient spending on asset base.
VAGO.
The financial sustainability risk for each council, for the financial years ended
30 June 2013 to 2020, are shown in Figures F3 to F37. For consolidated financial
statements, amounts obtained for calculating financial sustainability indicators
only relate to council.

80 Results of 2016–17 Audits: Local Government Victorian Auditor-General’s Report
Metropolitan councils
Metropolitan councils, net result 2013–2020
VAGO.
2017–18 2018–19 2019–20
Banyule City Council 3.69% 1.65% 10.96% 8.86% 11.79% 7.39% 2.70% 3.32% 4.52%
Bayside City Council 14.00% 13.92% 17.15% 21.88% 23.94% 18.18% 17.17% 13.25% 15.32%
Boroondara City Council 12.34% 11.75% 14.48% 18.48% 13.77% 14.16% 11.69% 16.08% 14.03%
Brimbank City Council 7.32% 3.12% 15.42% 10.01% 19.75% 11.12% 9.72% 12.20% 16.59%
Darebin City Council 8.53% 8.55% 3.50% 12.47% 12.60% 9.13% 7.52% 8.52% 9.64%
Frankston City Council 14.19% 15.25% 8.39% 14.41% 18.42% 14.13% 19.71% 12.77% 12.09%
Glen Eira City Council 8.29% 9.50% 9.19% 7.72% 16.76% 10.29% 10.00% 10.85% 11.52%
Greater Dandenong City Council 19.53% 25.49% 22.46% 22.24% 23.28% 22.60% 16.88% 19.54% 18.72%
Hobsons Bay City Council 8.14% 6.96% 9.71% 9.18% 17.12% 10.22% 11.00% 10.80% 10.14%
Kingston City Council 12.13% 10.46% 13.26% 22.11% 19.89% 15.57% 9.89% 7.15% 6.69%
Knox City Council 5.55% 3.54% 10.75% 14.89% 11.19% 9.18% 2.48% 6.37% 1.82%
Manningham City Council 12.99% 11.31% 11.80% 18.64% 25.78% 16.10% 13.28% 12.88% 12.62%
Maribyrnong City Council 7.28% 1.82% 15.03% 14.76% 10.99% 9.97% 5.00% 6.59% 4.02%
Maroondah City Council 2.70% 13.85% 13.49% 3.40% 16.50% 9.99% 5.02% 12.40% 4.59%
Melbourne City Council 12.49% 7.82% 17.95% 13.06% 19.27% 14.12% 6.54% 7.21% 6.85%
Monash City Council 0.48% 9.17% 9.92% 12.43% 12.62% 8.93% 8.93% 9.19% 4.02%
Moonee Valley City Council 4.78% 6.33% 11.25% 9.05% 11.34% 8.55% 6.57% 3.81% 3.42%
Moreland City Council 10.40% 9.30% 18.35% 11.66% 18.40% 13.62% 12.95% 13.77% 15.12%
Port Phillip City Council 8.76% 17.49% 2.11% 4.91% 14.57% 9.57% -2.98% 7.53% 6.42%
Stonnington City Council 16.61% 14.98% 19.46% 19.39% 22.89% 18.67% 20.08% 19.42% 21.92%
Whitehorse City Council 11.91% 8.49% 13.15% 25.26% 21.29% 16.02% 13.86% 18.28% 14.76%
Yarra City Council 4.98% 8.02% 6.04% 5.86% 9.69% 6.92% 4.90% 5.58% 6.98%
Average 9.41% 9.94% 12.45% 13.67% 16.90% 12.47% 9.68% 10.80% 10.08%
Metropolitan councils 2012–13 2013–14 2014–15 2015–16 2016–17 Average
Forecast

Victorian Auditor-General’s Report Results of 2016–17 Audits: Local Government 81
Metropolitan councils, adjusted underlying result 2015–2020
VAGO.
2017–18 2018–19 2019–20
Banyule City Council 9.00% 6.63% 8.58% 8.07% -0.55% 1.60% 2.82%
Bayside City Council 14.69% 17.42% 19.05% 17.05% 12.32% 11.75% 11.41%
Boroondara City Council 11.70% 14.20% 11.20% 12.37% 8.80% 13.40% 12.90%
Brimbank City Council 8.23% 4.74% 15.06% 9.34% 5.88% 4.32% 4.86%
Darebin City Council -1.90% 8.00% 8.60% 4.90% 3.10% 3.30% 4.40%
Frankston City Council 3.40% 8.90% 15.00% 9.10% 14.20% 12.30% 11.70%
Glen Eira City Council 9.00% 7.00% 16.00% 10.67% 9.00% 10.00% 10.00%
Greater Dandenong City Council 4.25% 1.87% 12.82% 6.31% 8.44% 8.17% 7.57%
Hobsons Bay City Council 9.53% 8.04% 15.89% 11.15% 9.92% 10.26% 9.65%
Kingston City Council 9.68% 19.77% 18.22% 15.89% 7.66% 6.08% 6.24%
Knox City Council 7.05% 13.59% 10.31% 10.32% -0.91% 2.91% 0.64%
Manningham City Council 7.00% 9.70% 11.40% 9.37% 8.40% 8.40% 8.60%
Maribyrnong City Council 12.93% 6.88% 8.00% 9.27% 5.00% 6.59% 4.02%
Maroondah City Council 3.65% -0.77% 8.10% 3.66% 3.60% 3.75% 4.22%
Melbourne City Council 6.24% 9.53% 16.11% 10.63% 1.38% 2.15% 1.82%
Monash City Council 4.67% 11.20% 11.57% 9.15% 6.52% 7.75% 4.03%
Moonee Valley City Council 9.70% 5.65% 10.14% 8.50% 3.94% 3.21% 2.83%
Moreland City Council 11.15% 8.30% 17.78% 12.41% 12.09% 13.23% 14.04%
Port Phillip City Council -0.64% 1.03% 1.25% 0.55% -9.28% 3.51% 3.74%
Stonnington City Council 14.29% 13.89% 15.48% 14.55% 15.25% 14.71% 14.90%
Whitehorse City Council 12.33% 15.25% 20.84% 16.14% 13.38% 18.28% 14.76%
Yarra City Council 2.11% 1.70% 6.31% 3.37% 2.44% 3.21% 4.71%
Average 7.64% 8.75% 12.62% 9.67% 6.39% 7.68% 7.27%
Average
Forecast
Metropolitan councils 2014–15 2015–16 2016–17

82 Results of 2016–17 Audits: Local Government Victorian Auditor-General’s Report
Metropolitan councils, liquidity 2013–2020
VAGO.
2017–18 2018–19 2019–20
Banyule City Council 2.80 4.09 3.97 4.26 3.04 3.63 3.21 2.93 2.84
Bayside City Council 1.86 2.20 2.59 2.98 3.57 2.64 3.15 2.98 2.86
Boroondara City Council 1.45 1.76 1.91 2.44 2.84 2.08 1.93 1.74 1.75
Brimbank City Council 1.18 0.94 2.01 1.45 2.19 1.55 1.44 1.50 1.49
Darebin City Council 1.80 1.64 1.60 2.30 2.60 1.98 1.77 1.63 1.30
Frankston City Council 1.63 1.80 1.64 2.24 3.35 2.13 2.89 3.01 3.29
Glen Eira City Council 0.82 0.96 0.99 0.99 1.24 1.00 1.18 1.13 1.08
Greater Dandenong City Council 2.10 1.51 1.72 1.79 2.02 1.83 1.65 1.62 1.76
Hobsons Bay City Council 1.22 0.99 1.45 2.09 2.42 1.64 1.95 1.93 1.94
Kingston City Council 1.33 1.43 1.95 2.85 3.49 2.21 2.46 1.97 2.23
Knox City Council 1.43 1.56 1.81 2.30 2.36 1.89 1.10 1.03 0.93
Manningham City Council 1.83 1.90 2.06 2.17 1.99 1.99 1.73 1.75 1.96
Maribyrnong City Council 2.90 2.62 2.98 2.95 3.14 2.92 2.09 2.25 2.24
Maroondah City Council 2.60 1.61 1.96 1.72 1.86 1.95 1.66 1.57 1.60
Melbourne City Council 1.63 1.33 1.65 1.41 2.30 1.67 1.27 0.41 0.34
Monash City Council 0.74 1.54 1.49 1.93 2.28 1.60 2.16 1.86 1.55
Moonee Valley City Council 1.37 1.61 2.00 2.16 2.48 1.92 2.69 2.60 2.54
Moreland City Council 1.39 1.49 1.38 2.42 2.67 1.87 2.94 3.11 3.50
Port Phillip City Council 1.71 1.59 2.21 2.43 2.32 2.05 2.02 2.13 2.17
Stonnington City Council 2.09 2.10 2.68 2.91 3.22 2.60 2.36 2.14 2.17
Whitehorse City Council 1.68 2.13 2.79 2.84 4.21 2.73 4.48 3.98 4.11
Yarra City Council 0.96 1.07 1.05 1.03 1.51 1.12 1.07 1.05 1.10
Average 1.66 1.72 2.00 2.26 2.59 2.05 2.15 2.02 2.03
2014–15Metropolitan councils 2012–13 2013–14 2015–16 2016–17 Average
Forecast

Victorian Auditor-General’s Report Results of 2016–17 Audits: Local Government 83
Metropolitan councils, internal financing 2013–2020
VAGO.
2017–18 2018–19 2019–20
Banyule City Council 63% 57% 725% 1607% 207% 532% 114% 91% 103%
Bayside City Council 124% 172% 210% 217% 172% 179% 88% 96% 99%
Boroondara City Council 77% 84% 156% 144% 155% 123% 104% 82% 108%
Brimbank City Council 39% 93% 146% 60% 188% 105% 97% 115% 108%
Darebin City Council 71% 123% 134% 162% 134% 125% 73% 78% 81%
Frankston City Council 114% 75% 125% 92% 261% 133% 131% 135% 130%
Glen Eira City Council 95% 140% 117% 121% 157% 126% 106% 104% 104%
Greater Dandenong City Council 95% 61% 156% 158% 256% 145% 123% 105% 100%
Hobsons Bay City Council 119% 146% 162% 104% 154% 137% 109% 105% 108%
Kingston City Council 140% 119% 152% 231% 165% 161% 96% 82% 124%
Knox City Council 122% 76% 133% 298% 157% 157% 48% 71% 67%
Manningham City Council 190% 86% 122% 141% 102% 128% 99% 133% 128%
Maribyrnong City Council 129% 124% 125% 111% 137% 125% 73% 120% 112%
Maroondah City Council 107% 69% 70% 94% 133% 94% 113% 109% 102%
Melbourne City Council 71% 93% 111% 65% 141% 96% 260% 44% 39%
Monash City Council 47% 576% 149% 179% 146% 220% 99% 73% 105%
Moonee Valley City Council 128% 150% 181% 141% 203% 161% 104% 104% 105%
Moreland City Council 110% 58% 148% 210% 270% 159% 116% 130% 157%
Port Phillip City Council 82% 57% 134% 115% 155% 109% 82% 118% 137%
Stonnington City Council 107% 92% 182% 136% 131% 130% 65% 72% 110%
Whitehorse City Council 59% 87% 202% 158% 201% 141% 130% 540% 98%
Yarra City Council 106% 61% 107% 105% 99% 96% 96% 107% 114%
Average 100% 118% 170% 211% 169% 154% 106% 119% 106%
Forecast
Metropolitan councils 2012–13 2013–14 2014–15 2015–16 2016–17 Average

84 Results of 2016–17 Audits: Local Government Victorian Auditor-General’s Report
Metropolitan councils, indebtedness 2013–2020
VAGO.
2017–18 2018–19 2019–20
Banyule City Council 32.82% 56.67% 45.36% 43.25% 29.89% 41.60% 27.32% 24.91% 23.24%
Bayside City Council 15.47% 12.37% 8.28% 2.95% 0.90% 7.99% 1.27% 1.44% 1.59%
Boroondara City Council 33.01% 33.66% 31.14% 26.08% 23.34% 29.45% 14.09% 13.09% 12.05%
Brimbank City Council 21.09% 16.45% 33.50% 43.39% 38.97% 30.68% 40.06% 38.08% 35.68%
Darebin City Council 1.10% 1.24% 1.10% 1.23% 1.22% 1.18% 1.17% 1.14% 1.10%
Frankston City Council 1.37% 23.29% 18.86% 27.66% 25.02% 19.24% 23.88% 18.98% 18.29%
Glen Eira City Council 22.74% 17.97% 19.99% 19.13% 15.72% 19.11% 13.08% 10.35% 7.59%
Greater Dandenong City Council 51.86% 47.03% 46.86% 39.94% 34.54% 44.05% 31.68% 32.60% 36.66%
Hobsons Bay City Council 10.10% 0.88% 9.65% 13.71% 12.96% 9.46% 13.10% 12.83% 12.59%
Kingston City Council 14.97% 14.00% 13.01% 9.73% 9.65% 12.27% 4.90% 1.60% 0.77%
Knox City Council 14.19% 12.96% 14.41% 12.36% 4.54% 11.69% 23.90% 32.53% 38.61%
Manningham City Council 9.23% 8.39% 8.17% 7.50% 7.19% 8.10% 7.29% 4.09% 3.99%
Maribyrnong City Council 6.35% 4.53% 3.34% 0.83% 0.76% 3.16% 1.02% 1.10% 1.18%
Maroondah City Council 1.24% 1.65% 25.24% 21.60% 19.07% 13.76% 17.69% 16.05% 14.50%
Melbourne City Council 0.76% 0.85% 0.76% 8.18% 7.19% 3.55% 9.25% 21.17% 59.09%
Monash City Council 10.72% 7.92% 2.91% 2.70% 2.08% 5.26% 3.00% 2.95% 2.89%
Moonee Valley City Council 12.03% 6.99% 2.13% 1.33% 1.21% 4.74% 4.33% 3.00% 1.80%
Moreland City Council 32.49% 35.74% 25.83% 31.44% 24.73% 30.05% 29.09% 27.56% 26.14%
Port Phillip City Council 1.52% 2.52% 6.64% 6.29% 5.85% 4.57% 5.84% 5.65% 5.50%
Stonnington City Council 2.95% 11.09% 10.45% 8.46% 7.06% 8.00% 16.86% 23.61% 22.39%
Whitehorse City Council 1.71% 5.70% 6.81% 5.75% 5.10% 5.01% 5.18% 2.10% 2.17%
Yarra City Council 10.98% 24.05% 23.87% 22.89% 29.39% 22.24% 27.92% 26.50% 25.00%
Average 14.03% 15.73% 16.29% 16.20% 13.93% 15.23% 14.63% 14.60% 16.04%
Average
Forecast
2012–13 2013–14 2014–15 2015–16 2016–17Metropolitan councils

Victorian Auditor-General’s Report Results of 2016–17 Audits: Local Government 85
Metropolitan councils, capital replacement 2013–2020
VAGO.
2017–18 2018–19 2019–20
Banyule City Council 1.56 2.46 1.15 1.22 1.86 1.65 1.23 1.54 1.45
Bayside City Council 1.70 1.53 1.34 1.58 1.84 1.60 2.66 1.98 2.05
Boroondara City Council 2.73 1.98 1.75 1.81 1.51 1.95 2.02 3.07 2.20
Brimbank City Council 1.73 1.27 1.59 2.82 1.38 1.76 1.69 1.52 1.87
Darebin City Council 1.01 1.08 1.25 1.08 1.39 1.16 2.28 2.19 2.42
Frankston City Council 1.51 2.65 1.60 2.02 0.87 1.73 1.86 1.34 1.33
Glen Eira City Council 1.92 1.28 1.62 1.72 1.58 1.62 1.73 1.81 1.87
Greater Dandenong City Council 1.79 2.36 1.29 1.26 1.54 1.65 1.43 1.61 1.62
Hobsons Bay City Council 1.42 1.12 1.10 1.55 1.45 1.33 1.87 1.78 1.69
Kingston City Council 1.73 1.62 1.35 1.61 1.66 1.59 1.81 1.80 1.15
Knox City Council 1.31 1.25 1.47 1.55 1.52 1.42 2.54 2.36 2.05
Manningham City Council 1.47 1.43 1.48 1.72 2.30 1.68 1.99 1.42 1.45
Maribyrnong City Council 0.85 1.67 1.95 1.82 1.59 1.57 1.91 1.24 1.22
Maroondah City Council 1.13 2.44 3.07 1.73 1.66 2.01 1.29 1.87 1.26
Melbourne City Council 2.11 1.90 1.52 2.50 1.27 1.86 2.09 3.61 4.20
Monash City Council 1.13 0.97 1.22 1.00 1.35 1.13 1.81 2.92 2.04
Moonee Valley City Council 1.21 0.93 1.00 1.28 1.05 1.09 1.70 1.47 1.42
Moreland City Council 1.80 1.83 1.67 1.14 1.28 1.55 2.04 1.70 1.48
Port Phillip City Council 2.37 1.40 1.25 1.48 1.42 1.58 1.48 1.59 1.59
Stonnington City Council 1.71 2.48 1.59 2.33 2.77 2.18 4.60 3.99 2.99
Whitehorse City Council 2.43 1.76 1.14 1.56 1.41 1.66 1.65 2.39 2.22
Yarra City Council 1.54 2.27 1.51 1.56 1.68 1.71 1.60 1.46 1.47
Average 1.64 1.71 1.50 1.65 1.56 1.61 1.97 2.03 1.87
Metropolitan councils 2012–13 2013–14 2015–16 2016–17 Average
Forecast
2014–15

86 Results of 2016–17 Audits: Local Government Victorian Auditor-General’s Report
Metropolitan councils, renewal gap 2013–2020
VAGO.
2017–18 2018–19 2019–20
Banyule City Council 0.75 0.83 0.96 0.75 1.66 0.99 1.12 1.50 1.41
Bayside City Council 1.04 1.11 1.13 1.28 1.52 1.22 1.58 1.33 1.40
Boroondara City Council 2.47 1.73 1.64 1.43 1.19 1.69 1.45 1.52 1.43
Brimbank City Council 0.90 0.90 0.76 0.77 0.87 0.84 0.82 0.84 1.07
Darebin City Council 1.21 1.26 0.89 0.87 0.91 1.03 1.58 1.28 1.57
Frankston City Council 0.86 0.96 1.14 1.13 0.68 0.95 1.36 1.05 1.15
Glen Eira City Council 1.75 1.15 1.21 1.42 1.24 1.35 1.29 1.67 1.69
Greater Dandenong City Council 0.92 0.90 0.79 1.09 1.05 0.95 0.78 0.80 0.86
Hobsons Bay City Council 1.15 0.98 1.14 1.13 1.15 1.11 1.42 1.47 1.65
Kingston City Council 1.80 1.55 1.35 1.60 1.57 1.57 1.52 1.42 1.11
Knox City Council 1.22 1.19 1.38 1.28 1.39 1.29 2.14 1.97 1.72
Manningham City Council 1.00 1.01 0.85 0.93 1.41 1.04 1.16 1.09 1.09
Maribyrnong City Council 1.11 1.99 1.62 1.22 0.96 1.38 1.66 1.11 1.09
Maroondah City Council 0.76 1.87 2.07 1.16 1.29 1.43 1.13 1.18 1.15
Melbourne City Council 1.06 1.98 0.73 0.67 0.87 1.06 1.39 2.14 2.81
Monash City Council 0.95 0.93 1.09 1.00 1.09 1.01 1.45 1.60 1.18
Moonee Valley City Council 0.96 0.54 0.72 1.09 0.85 0.83 1.54 0.97 0.97
Moreland City Council 1.34 1.01 0.94 0.86 0.80 0.99 1.68 1.50 1.25
Port Phillip City Council 0.65 1.04 0.89 0.91 1.15 0.93 1.22 1.26 1.23
Stonnington City Council 1.55 1.51 1.37 1.99 1.33 1.55 1.86 1.68 1.53
Whitehorse City Council 1.58 1.29 0.91 1.07 1.09 1.19 1.10 1.71 1.51
Yarra City Council 1.26 1.32 0.95 1.04 1.15 1.14 1.28 1.43 1.46
Average 1.19 1.23 1.11 1.12 1.15 1.16 1.39 1.39 1.38
Forecast
Metropolitan councils 2012–13 2013–14 2014–15 2015–16 2016–17 Average

Victorian Auditor-General’s Report Results of 2016–17 Audits: Local Government 87
Interface councils
Interface councils, net result 2013–2020
VAGO.
Interface councils, adjusted underlying result 2015–2020
VAGO.
Interface councils, liquidity 2013–2020
VAGO.
2017–18 2018–19 2019–20
Cardinia Shire Council 26.17% 22.04% 35.90% 41.63% 43.59% 33.87% 6.84% 1.82% 1.76%
Casey City Council 35.46% 20.78% 31.14% 40.33% 42.70% 34.08% 25.23% 22.71% 24.01%
Hume City Council 23.88% 20.79% 31.29% 37.49% 48.85% 32.46% 36.19% 32.11% 29.23%
Melton City Council 45.09% 31.79% 28.57% 45.23% 47.09% 39.55% 38.02% 35.52% 35.28%
Mornington Peninsula Shire Council 8.26% 3.24% 7.16% 8.81% 9.91% 7.48% 6.47% 4.66% 3.36%
Nillumbik Shire Council 1.87% 7.87% 16.41% 4.92% 16.99% 9.61% 8.25% 17.94% 22.31%
Whittlesea City Council 30.19% 29.00% 34.36% 37.10% 36.69% 33.47% 39.49% 38.59% 37.69%
Wyndham City Council 31.36% 25.30% 26.67% 38.21% 45.44% 33.39% 36.52% 39.22% 33.90%
Yarra Ranges Shire Council 6.17% -1.51% 11.11% 7.01% 14.36% 7.43% 10.90% 8.04% 7.72%
Average 23.16% 17.70% 24.73% 28.97% 33.96% 25.70% 23.10% 22.29% 21.69%
Average
Forecast
2016–17Interface councils 2012–13 2013–14 2014–15 2015–16
2017–18 2018–19 2019–20
Cardinia Shire Council 4.29% 3.88% 13.09% 7.09% 2.17% -0.09% 0.60%
Casey City Council 19.57% 10.26% 19.90% 16.58% 3.68% 5.32% 6.47%
Hume City Council 11.00% 11.81% 24.34% 15.72% 18.06% 13.87% 11.91%
Melton City Council 2.78% 1.81% 13.69% 6.09% 2.73% 4.27% 5.78%
Mornington Peninsula Shire Council 5.21% 2.66% 5.12% 4.33% 2.58% 3.80% 2.51%
Nillumbik Shire Council 9.79% -12.92% 8.46% 1.78% 4.07% 4.31% 5.15%
Whittlesea City Council 5.15% -6.58% 13.72% 4.10% 4.65% 6.58% 4.99%
Wyndham City Council -4.00% -1.20% 7.80% 0.87% 3.30% 4.60% 4.30%
Yarra Ranges Shire Council 6.51% 2.46% 5.93% 4.97% 8.07% 6.97% 7.21%
Average 6.70% 1.35% 12.45% 6.83% 5.48% 5.51% 5.44%
Forecast
Interface councils 2014–15 2015–16 2016–17 Average
2017–18 2018–19 2019–20
Cardinia Shire Council 2.25 1.97 1.98 2.36 2.92 2.30 1.43 1.24 1.15
Casey City Council 3.14 3.95 4.18 4.11 4.42 3.96 4.81 4.75 4.76
Hume City Council 1.42 1.20 1.91 2.20 3.12 1.97 3.12 3.84 4.50
Melton City Council 1.65 1.62 1.88 3.05 5.85 2.81 3.44 4.72 5.57
Mornington Peninsula Shire Council 1.14 1.31 1.51 1.90 1.99 1.57 1.41 1.40 1.32
Nillumbik Shire Council 2.23 2.23 2.66 3.51 3.53 2.83 2.36 2.64 3.61
Whittlesea City Council 3.69 3.36 3.03 3.16 3.79 3.41 3.58 3.26 3.28
Wyndham City Council 2.88 1.78 2.97 3.73 4.90 3.25 5.23 4.51 4.47
Yarra Ranges Shire Council 2.04 1.44 2.18 2.28 2.28 2.04 1.73 1.40 1.09
Average 2.27 2.10 2.48 2.92 3.64 2.68 3.01 3.09 3.30
Interface councils 2012–13 2013–14 2014–15 2015–16 2016–17 Average
Forecast

88 Results of 2016–17 Audits: Local Government Victorian Auditor-General’s Report
Interface councils, internal financing 2013–2020
VAGO.
Interface councils, indebtedness 2013–2020
VAGO.
Interface councils, capital replacement 2013–2020
VAGO.
2017–18 2018–19 2019–20
Cardinia Shire Council 110% 67% 99% 219% 476% 194% 109% 91% 108%
Casey City Council 218% 124% 175% 165% 136% 164% 87% 129% 141%
Hume City Council 82% 88% 187% 155% 184% 139% 102% 131% 154%
Melton City Council 93% 131% 117% 235% 216% 158% 107% 105% 160%
Mornington Peninsula Shire Council 139% 111% 143% 193% 135% 144% 109% 100% 101%
Nillumbik Shire Council 93% 99% 254% 172% 125% 149% 112% 134% 190%
Whittlesea City Council 115% 85% 141% 142% 113% 119% 115% 88% 95%
Wyndham City Council 70% 103% 92% 150% 204% 124% 93% 88% 108%
Yarra Ranges Shire Council 45% 76% 131% 115% 125% 98% 84% 80% 77%
Average 107% 98% 149% 172% 191% 143% 102% 105% 126%
2012–13Interface councils 2013–14 2014–15 2015–16 2016–17 Average
Forecast
2017–18 2018–19 2019–20
Cardinia Shire Council 61.01% 50.92% 71.28% 61.10% 58.21% 60.50% 53.43% 50.07% 45.90%
Casey City Council 29.38% 32.99% 30.90% 19.46% 29.24% 28.40% 40.28% 34.30% 29.01%
Hume City Council 16.85% 15.75% 35.75% 21.71% 15.07% 21.02% 13.06% 13.18% 12.28%
Melton City Council 21.98% 20.22% 25.06% 21.79% 18.53% 21.52% 16.94% 13.60% 11.15%
Mornington Peninsula Shire Council 19.43% 21.93% 17.94% 12.99% 9.48% 16.35% 9.19% 6.83% 5.59%
Nillumbik Shire Council 34.25% 32.61% 27.93% 28.11% 26.81% 29.94% 25.47% 22.82% 21.12%
Whittlesea City Council 26.05% 23.00% 22.11% 19.85% 16.15% 21.43% 22.62% 29.24% 32.31%
Wyndham City Council 12.46% 11.77% 33.89% 34.15% 33.21% 25.10% 34.40% 32.75% 31.08%
Yarra Ranges Shire Council 13.24% 10.96% 23.27% 19.92% 16.56% 16.79% 17.28% 22.93% 25.31%
Average 26.07% 24.46% 32.02% 26.57% 24.81% 26.78% 25.85% 25.08% 23.75%
2012–13 2013–14 2014–15 2015–16 Average
Forecast
2016–17Interface councils
2017–18 2018–19 2019–20
Cardinia Shire Council 2.16 2.10 3.83 1.40 1.20 2.14 2.05 1.48 1.24
Casey City Council 1.26 1.40 2.07 2.54 3.57 2.17 2.93 2.03 1.90
Hume City Council 1.64 1.92 1.26 1.39 1.75 1.59 2.32 1.56 1.14
Melton City Council 1.81 1.36 1.52 1.08 1.12 1.38 1.77 1.86 1.43
Mornington Peninsula Shire Council 1.13 1.09 1.31 1.12 1.63 1.26 1.45 1.30 1.28
Nillumbik Shire Council 0.75 1.58 1.34 1.99 2.32 1.60 2.23 2.98 3.15
Whittlesea City Council 0.95 1.73 1.97 1.85 2.26 1.75 2.19 2.86 2.42
Wyndham City Council 2.23 1.71 1.79 1.24 1.16 1.63 2.07 2.66 1.87
Yarra Ranges Shire Council 1.48 1.67 1.33 1.42 1.54 1.49 2.20 2.16 2.16
Average 1.49 1.62 1.82 1.56 1.84 1.67 2.13 2.10 1.84
Interface councils 2012–13 2013–14 2014–15 2015–16 2016–17 Average
Forecast

Victorian Auditor-General’s Report Results of 2016–17 Audits: Local Government 89
Interface councils, renewal gap 2013–2020
VAGO.
2017–18 2018–19 2019–20
Cardinia Shire Council 0.76 0.79 0.65 0.60 0.47 0.66 1.07 0.69 0.67
Casey City Council 0.73 0.97 0.74 0.75 0.89 0.81 1.19 1.32 1.21
Hume City Council 1.19 0.83 0.80 0.53 0.55 0.78 1.10 0.75 0.65
Melton City Council 0.34 0.29 0.57 0.38 0.57 0.43 0.67 0.53 0.54
Mornington Peninsula Shire Council 0.84 0.97 1.16 0.92 1.29 1.03 1.04 0.95 0.93
Nillumbik Shire Council 0.55 1.49 1.15 1.24 1.91 1.27 1.53 1.45 2.84
Whittlesea City Council 0.55 1.08 0.63 0.86 1.04 0.83 1.16 1.15 0.82
Wyndham City Council 1.08 0.97 1.29 0.75 0.51 0.92 0.90 0.73 0.38
Yarra Ranges Shire Council 1.64 1.29 1.07 0.98 1.11 1.22 1.57 1.86 1.80
Average 0.85 0.96 0.90 0.78 0.93 0.88 1.14 1.05 1.09
Average
Forecast
2012–13 2013–14 2014–15 2015–16 2016–17Interface councils

90 Results of 2016–17 Audits: Local Government Victorian Auditor-General’s Report
Regional city councils
Regional city councils, net result 2013–2020
VAGO.
Regional city councils, adjusted underlying result 2015–2020
VAGO.
2017–18 2018–19 2019–20
Ballarat City Council 20.25% 12.80% 20.29% 17.25% 22.16% 18.55% 16.81% 15.12% 14.38%
Greater Bendigo City Council 16.56% 11.64% 5.41% 19.71% 20.32% 14.73% 12.06% 16.48% 16.96%
Greater Geelong City Council 18.06% 12.54% 20.52% 15.50% 11.32% 15.59% 10.77% 13.72% 8.90%
Greater Shepparton City Council 12.68% 4.75% 5.64% 0.07% 19.60% 8.55% 5.63% 16.58% 14.03%
Horsham Rural City Council 13.18% 6.11% 17.13% 2.71% 14.93% 10.81% 8.26% 1.86% 1.24%
Latrobe City Council 8.21% 6.38% 17.48% 9.08% 21.60% 12.55% 7.82% 10.93% 10.21%
Mildura Rural City Council 16.59% 2.27% 18.18% 6.53% 16.19% 11.95% 4.52% 3.08% 2.91%
Wangaratta Rural City Council 4.68% -2.51% 10.13% 0.17% 9.80% 4.45% 5.78% 6.30% 0.71%
Warrnambool City Council 8.44% 12.22% 10.56% 15.32% 13.92% 12.09% 11.63% 10.22% 8.75%
Wodonga City Council 28.00% 5.22% 25.79% 7.69% 15.06% 16.35% 6.93% 6.79% 6.53%
Average 14.67% 7.14% 15.11% 9.40% 16.49% 12.56% 9.02% 10.11% 8.46%
Average
Forecast
2016–17Regional councils 2012–13 2013–14 2014–15 2015–16
2017–18 2018–19 2019–20
Ballarat City Council 13.58% 4.02% -1.67% 5.31% 2.29% 0.94% 1.11%
Greater Bendigo City Council -6.35% -5.40% -12.44% -8.06% -0.80% 6.92% 7.77%
Greater Geelong City Council 5.74% 0.32% -3.54% 0.84% -2.46% 3.02% 1.75%
Greater Shepparton City Council -6.00% -9.00% 14.00% -0.33% -0.50% 8.00% 8.00%
Horsham Rural City Council 6.00% -11.00% 6.00% 0.33% -4.00% -8.00% -8.00%
Latrobe City Council 5.80% -1.10% 13.20% 5.97% 2.00% 1.50% 0.90%
Mildura Rural City Council 9.52% -3.26% 10.84% 5.70% -6.39% 0.27% 0.17%
Wangaratta Rural City Council 3.00% -6.00% 2.00% -0.33% -7.00% -1.00% -2.00%
Warrnambool City Council -0.26% -3.21% -2.32% -1.93% 0.74% -1.56% 0.23%
Wodonga City Council 2.34% -2.61% 9.09% 2.94% 6.93% 6.79% 6.53%
Average 3.34% -3.72% 3.52% 1.04% -0.92% 1.69% 1.65%
Forecast
Regional councils 2014–15 2015–16 2016–17 Average

Victorian Auditor-General’s Report Results of 2016–17 Audits: Local Government 91
Regional city councils, liquidity 2013–2020
VAGO.
Regional city councils, internal financing 2013–2020
VAGO.
2017–18 2018–19 2019–20
Ballarat City Council 1.90 2.33 2.01 2.64 2.64 2.30 1.24 1.04 1.02
Greater Bendigo City Council 1.92 2.06 1.67 2.52 2.37 2.11 1.32 1.48 1.57
Greater Geelong City Council 1.62 1.42 1.32 1.26 1.47 1.42 1.15 1.13 1.07
Greater Shepparton City Council 2.33 2.24 2.35 1.87 2.49 2.25 1.74 1.83 1.85
Horsham Rural City Council 2.74 2.73 2.29 2.45 2.98 2.64 2.10 2.00 1.94
Latrobe City Council 1.57 1.50 2.09 2.71 3.02 2.18 2.44 1.85 2.41
Mildura Rural City Council 1.73 1.56 2.63 2.51 2.67 2.22 1.37 1.40 1.43
Wangaratta Rural City Council 1.49 1.52 1.42 1.48 2.54 1.69 1.49 1.56 1.15
Warrnambool City Council 1.61 1.46 1.38 1.25 1.44 1.43 1.08 1.19 1.26
Wodonga City Council 2.66 1.74 1.55 2.10 2.69 2.15 1.11 1.11 1.16
Average 1.96 1.86 1.87 2.08 2.43 2.04 1.50 1.46 1.49
Regional councils 2012–13 2013–14 2014–15 2015–16 2016–17 Average
Forecast
2017–18 2018–19 2019–20
Ballarat City Council 73% 97% 102% 99% 126% 99% 93% 89% 92%
Greater Bendigo City Council 88% 106% 136% 101% 102% 106% 84% 121% 109%
Greater Geelong City Council 54% 73% 92% 111% 139% 94% 47% 53% 69%
Greater Shepparton City Council 108% 130% 104% 84% 103% 106% 71% 94% 106%
Horsham Rural City Council 143% 130% 107% 76% 154% 122% 104% 95% 99%
Latrobe City Council 136% 78% 165% 107% 190% 135% 105% 98% 110%
Mildura Rural City Council 73% 82% 180% 119% 121% 115% 81% 115% 113%
Wangaratta Rural City Council 106% 72% 125% 77% 221% 120% 62% 72% 81%
Warrnambool City Council 115% 92% 96% 93% 123% 104% 104% 113% 104%
Wodonga City Council 109% 68% 122% 251% 187% 147% 75% 125% 138%
Average 100% 93% 123% 112% 147% 115% 83% 98% 102%
2012–13Regional councils 2013–14 2014–15 2015–16 2016–17 Average
Forecast

92 Results of 2016–17 Audits: Local Government Victorian Auditor-General’s Report
Regional city councils, indebtedness 2013–2020
VAGO.
Regional city councils, capital replacement 2013–2020
VAGO.
2017–18 2018–19 2019–20
Ballarat City Council 8.46% 28.35% 22.01% 36.77% 35.13% 26.14% 38.70% 38.17% 40.59%
Greater Bendigo City Council 27.29% 31.84% 33.35% 33.28% 36.94% 32.54% 39.29% 38.04% 36.53%
Greater Geelong City Council 20.85% 20.19% 22.88% 17.74% 13.42% 19.02% 23.04% 32.82% 35.48%
Greater Shepparton City Council 20.02% 18.25% 21.24% 26.44% 27.04% 22.60% 29.88% 34.51% 33.92%
Horsham Rural City Council 24.11% 19.03% 14.70% 24.74% 26.45% 21.81% 27.78% 29.71% 35.06%
Latrobe City Council 33.09% 27.63% 36.91% 42.91% 30.20% 34.15% 35.11% 23.81% 25.64%
Mildura Rural City Council 41.97% 42.98% 39.88% 48.17% 43.27% 43.25% 45.57% 42.47% 39.39%
Wangaratta Rural City Council 49.56% 56.91% 45.78% 56.32% 57.62% 53.24% 60.52% 70.91% 58.36%
Warrnambool City Council 19.27% 19.47% 19.93% 16.63% 13.51% 17.76% 14.55% 13.05% 13.55%
Wodonga City Council 80.68% 73.90% 67.26% 58.91% 51.84% 66.52% 48.76% 44.07% 39.41%
Average 32.53% 33.85% 32.39% 36.19% 33.54% 33.70% 36.32% 36.76% 35.79%
2012–13 2013–14 2014–15 2015–16 Average
Forecast
2016–17Regional councils
2017–18 2018–19 2019–20
Ballarat City Council 1.91 1.89 1.86 1.64 2.07 1.87 1.33 1.33 1.30
Greater Bendigo City Council 1.64 1.46 1.44 1.46 2.57 1.71 1.83 1.47 1.66
Greater Geelong City Council 1.36 1.45 2.16 1.62 1.41 1.60 1.93 2.06 1.49
Greater Shepparton City Council 1.25 1.16 1.21 1.70 1.89 1.44 1.75 2.12 1.76
Horsham Rural City Council 1.79 1.14 1.92 1.33 1.18 1.47 1.53 1.25 1.28
Latrobe City Council 1.21 1.09 1.35 1.46 0.99 1.22 1.14 1.49 1.38
Mildura Rural City Council 2.08 1.41 1.64 1.50 1.42 1.61 1.71 1.12 1.13
Wangaratta Rural City Council 1.28 0.90 1.12 1.42 0.68 1.08 2.19 1.52 1.08
Warrnambool City Council 1.02 2.04 2.14 1.55 1.37 1.62 1.68 1.53 1.52
Wodonga City Council 2.52 1.86 2.07 1.14 1.20 1.76 2.15 1.28 1.14
Average 1.61 1.44 1.69 1.48 1.48 1.54 1.72 1.52 1.38
Regional councils 2012–13 2013–14 2014–15 2015–16 2016–17 Average
Forecast

Victorian Auditor-General’s Report Results of 2016–17 Audits: Local Government 93
Regional city councils, renewal gap 2013–2020
n/a = not able to provide an indicator result
VAGO.
2017–18 2018–19 2019–20
Ballarat City Council 0.91 0.97 0.91 1.26 0.85 0.98 1.12 0.96 0.94
Greater Bendigo City Council 1.28 1.25 1.17 0.84 1.21 1.15 1.12 1.05 1.08
Greater Geelong City Council 0.79 0.61 0.67 0.85 0.70 0.72 0.54 n/a n/a
Greater Shepparton City Council 0.98 0.89 0.83 0.96 1.23 0.98 1.38 1.27 1.06
Horsham Rural City Council 1.54 0.95 1.45 1.01 0.86 1.16 0.94 0.72 0.88
Latrobe City Council 1.01 0.93 0.92 0.69 0.86 0.88 0.83 0.71 0.71
Mildura Rural City Council 1.49 1.16 1.08 1.02 1.02 1.15 0.95 0.98 0.99
Wangaratta Rural City Council 0.86 0.54 0.84 0.84 0.54 0.72 1.09 0.87 0.63
Warrnambool City Council 0.90 1.61 1.19 0.90 1.27 1.18 1.55 1.43 1.43
Wodonga City Council 0.46 0.57 0.73 0.69 0.59 0.61 1.59 0.82 0.77
Average 1.02 0.95 0.98 0.91 0.91 0.95 1.11 0.98 0.94
Average
Forecast
2012–13 2013–14 2014–15 2015–16 2016–17Regional councils

94 Results of 2016–17 Audits: Local Government Victorian Auditor-General’s Report
Large shire councils
Large shire councils, net result 2013–2020
VAGO.
2017–18 2018–19 2019–20
Bass Coast Shire Council 9.68% 3.72% 9.12% -1.78% 14.83% 7.11% 5.15% 3.36% 2.23%
Baw Baw Shire Council 14.24% 8.41% 22.94% 11.10% 17.81% 14.90% 24.36% 17.43% 24.19%
Campaspe Shire Council 10.51% 0.49% 2.66% 0.60% 12.37% 5.33% 9.59% 1.21% 0.03%
Colac-Otw ay Shire Council 3.82% 6.19% 22.29% 3.58% 21.67% 11.51% 13.60% 9.55% 11.48%
Corangamite Shire Council 3.14% 1.55% 9.42% 0.03% 11.32% 5.09% 11.98% 24.16% 7.41%
East Gippsland Shire Council 17.12% 16.84% 15.56% 2.57% 11.91% 12.80% 7.70% 9.35% 7.69%
Glenelg Shire Council -38.30% 13.41% -6.46% -13.84% -0.28% -9.10% 3.31% 3.05% 2.81%
Golden Plains Shire Council 26.85% 12.84% 16.08% 4.72% 11.12% 14.32% 7.42% 7.54% 6.75%
Macedon Ranges Shire Council 24.23% 17.27% 12.47% 11.76% 25.43% 18.23% 21.83% 18.83% 18.45%
Mitchell Shire Council 17.09% 5.73% 21.73% 10.74% 30.05% 17.07% 19.94% 12.62% 17.11%
Moira Shire Council -7.89% 9.51% 7.55% 4.55% 16.46% 6.04% -6.55% 6.15% 5.81%
Moorabool Shire Council 14.88% 3.68% 14.47% 14.97% 23.17% 14.23% 16.71% 12.38% 12.76%
Mount Alexander Shire Council 21.67% -0.22% 5.07% 0.50% 11.77% 7.76% 5.19% 17.62% 15.63%
Moyne Shire Council 13.09% 3.37% 22.87% 5.08% 22.01% 13.28% 7.89% 4.34% 2.12%
South Gippsland Shire Council 2.92% -3.49% 15.04% 6.70% 17.53% 7.74% 2.48% 5.84% 9.92%
Southern Grampians Shire Council 14.54% -11.66% 8.42% -6.65% -8.14% -0.70% 34.79% 17.91% -2.26%
Surf Coast Shire Council 8.34% 4.73% 17.96% 20.36% 19.95% 14.27% 16.88% 18.13% 20.89%
Sw an Hill Rural City Council 5.06% 1.50% 11.84% 3.89% 13.53% 7.17% 12.13% 8.00% 12.87%
Wellington Shire Council 8.93% 0.19% 13.80% 13.45% 25.12% 12.30% 13.84% 14.21% 12.11%
Average 8.94% 4.95% 12.78% 4.86% 15.67% 9.44% 12.01% 11.14% 9.89%
Average
Forecast
2016–17Large shire councils 2012–13 2013–14 2014–15 2015–16

Victorian Auditor-General’s Report Results of 2016–17 Audits: Local Government 95
Large shire councils, adjusted underlying result 2015–2020
VAGO.
Large shire councils, liquidity 2013–2020
VAGO.
2017–18 2018–19 2019–20
Bass Coast Shire Council -3.02% -8.06% 3.76% -2.44% 2.03% 2.67% 0.89%
Baw Baw Shire Council 7.20% -5.90% 7.60% 2.97% 1.20% -0.60% 0.00%
Campaspe Shire Council 0.93% -7.93% 9.00% 0.67% 0.32% -1.47% -2.63%
Colac-Otw ay Shire Council 10.34% 1.88% 9.27% 7.16% 0.26% 3.47% 1.73%
Corangamite Shire Council 4.49% -11.85% 5.55% -0.60% 2.56% 2.68% 2.51%
East Gippsland Shire Council 3.62% -6.31% 7.25% 1.52% -0.68% 5.72% 4.20%
Glenelg Shire Council -15.47% -21.21% -11.25% -15.98% -8.51% -8.50% -8.56%
Golden Plains Shire Council 11.12% -3.48% 6.85% 4.83% -0.23% 0.22% -0.54%
Macedon Ranges Shire Council -2.53% -2.40% 11.10% 2.06% 4.96% 5.72% 6.01%
Mitchell Shire Council 1.76% -13.43% 12.19% 0.17% -7.41% -1.74% -1.95%
Moira Shire Council -0.87% 0.20% 14.30% 4.54% -8.82% 4.58% 2.31%
Moorabool Shire Council -0.43% -2.64% 7.44% 1.46% 1.68% 2.45% -0.64%
Mount Alexander Shire Council -5.62% -16.63% 9.27% -4.33% -6.69% 4.04% 4.19%
Moyne Shire Council 9.53% 0.34% 15.48% 8.45% 5.00% 1.21% 1.03%
South Gippsland Shire Council 12.36% 0.99% 12.11% 8.49% -6.94% 4.97% 3.76%
Southern Grampians Shire Council 1.63% -13.07% -24.46% -11.97% -5.40% -0.19% -7.45%
Surf Coast Shire Council 6.17% 3.59% 6.70% 5.49% -3.89% 2.96% 7.21%
Sw an Hill Rural City Council 6.50% -7.21% 11.65% 3.65% 2.25% 4.92% 5.33%
Wellington Shire Council 8.46% 3.63% 16.82% 9.64% 1.89% 6.61% 7.85%
Average 2.96% -5.76% 6.88% 1.36% -1.39% 2.09% 1.33%
Forecast
Large shire councils 2014–15 2015–16 2016–17 Average
2017–18 2018–19 2019–20
Bass Coast Shire Council 1.79 1.53 1.97 2.33 2.79 2.08 1.40 1.53 1.55
Baw Baw Shire Council 1.51 1.38 2.06 1.95 2.29 1.84 1.60 1.74 1.95
Campaspe Shire Council 2.46 1.54 3.20 3.49 2.45 2.63 2.58 2.52 2.45
Colac-Otw ay Shire Council 2.67 1.93 2.05 1.97 3.48 2.42 1.56 1.32 1.43
Corangamite Shire Council 1.71 1.90 2.84 2.77 2.96 2.44 2.65 2.57 2.58
East Gippsland Shire Council 3.21 2.18 2.28 1.88 3.04 2.52 1.84 1.97 2.03
Glenelg Shire Council 2.83 2.23 2.22 1.50 1.54 2.07 0.79 0.50 0.47
Golden Plains Shire Council 3.16 2.72 2.84 2.19 2.34 2.65 1.88 1.98 1.81
Macedon Ranges Shire Council 1.51 1.65 1.71 1.67 2.30 1.77 1.67 1.42 1.69
Mitchell Shire Council 1.42 1.23 1.55 1.90 2.57 1.74 1.71 2.11 1.93
Moira Shire Council 1.32 2.15 3.32 3.34 3.99 2.82 2.55 2.97 2.87
Moorabool Shire Council 1.36 0.93 1.83 1.95 1.64 1.54 2.22 2.42 2.64
Mount Alexander Shire Council 2.80 1.77 1.84 1.59 1.94 1.99 2.28 1.93 1.36
Moyne Shire Council 1.47 1.48 1.87 1.62 2.18 1.72 1.26 1.27 1.36
South Gippsland Shire Council 1.70 1.23 2.70 2.40 2.82 2.17 2.16 1.57 1.97
Southern Grampians Shire Council 2.72 1.99 2.28 1.93 3.07 2.40 1.80 3.56 3.54
Surf Coast Shire Council 1.85 1.91 2.62 2.53 2.70 2.32 3.42 3.37 2.82
Sw an Hill Rural City Council 1.33 1.63 2.29 1.84 2.93 2.00 2.09 2.54 2.78
Wellington Shire Council 2.41 2.92 3.21 3.83 4.16 3.31 3.62 2.88 3.48
Average 2.06 1.80 2.35 2.25 2.70 2.23 2.06 2.11 2.14
Large shire councils 2012–13 2013–14 2014–15 2015–16 2016–17 Average
Forecast
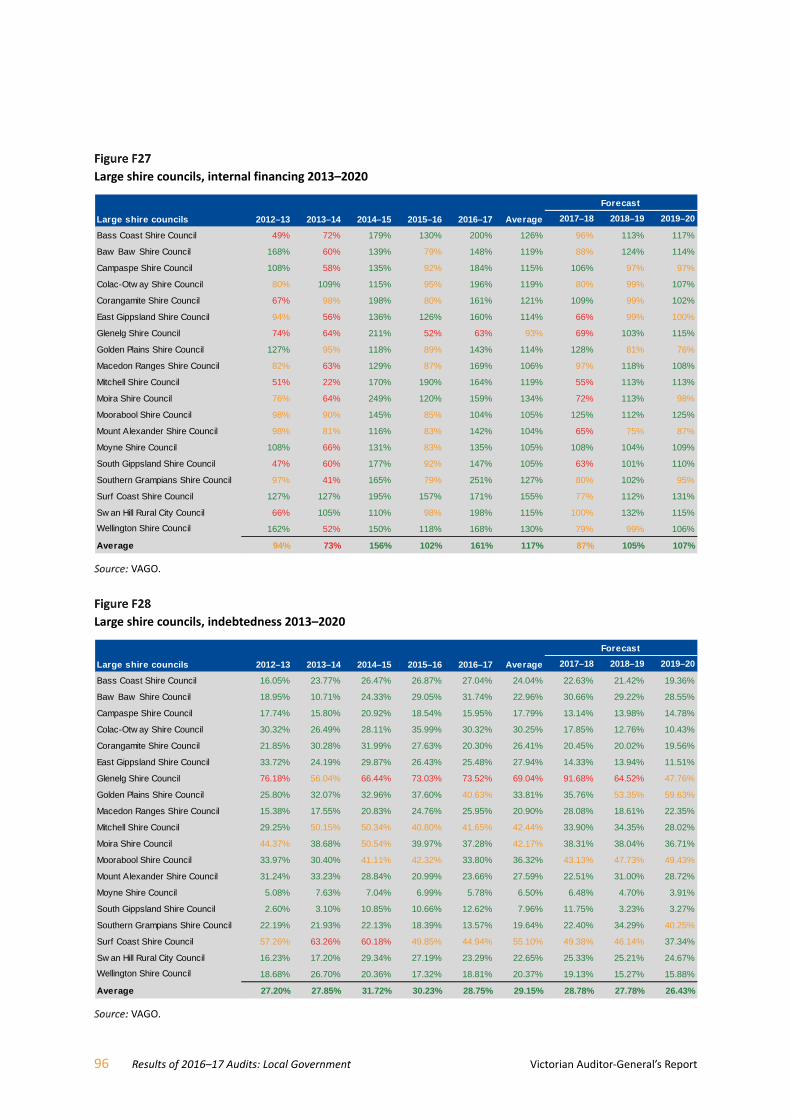
96 Results of 2016–17 Audits: Local Government Victorian Auditor-General’s Report
Large shire councils, internal financing 2013–2020
VAGO.
Large shire councils, indebtedness 2013–2020
VAGO.
2017–18 2018–19 2019–20
Bass Coast Shire Council 49% 72% 179% 130% 200% 126% 96% 113% 117%
Baw Baw Shire Council 168% 60% 139% 79% 148% 119% 88% 124% 114%
Campaspe Shire Council 108% 58% 135% 92% 184% 115% 106% 97% 97%
Colac-Otw ay Shire Council 80% 109% 115% 95% 196% 119% 80% 99% 107%
Corangamite Shire Council 67% 98% 198% 80% 161% 121% 109% 99% 102%
East Gippsland Shire Council 94% 56% 136% 126% 160% 114% 66% 99% 100%
Glenelg Shire Council 74% 64% 211% 52% 63% 93% 69% 103% 115%
Golden Plains Shire Council 127% 95% 118% 89% 143% 114% 128% 81% 76%
Macedon Ranges Shire Council 82% 63% 129% 87% 169% 106% 97% 118% 108%
Mitchell Shire Council 51% 22% 170% 190% 164% 119% 55% 113% 113%
Moira Shire Council 76% 64% 249% 120% 159% 134% 72% 113% 98%
Moorabool Shire Council 98% 90% 145% 85% 104% 105% 125% 112% 125%
Mount Alexander Shire Council 98% 81% 116% 83% 142% 104% 65% 75% 87%
Moyne Shire Council 108% 66% 131% 83% 135% 105% 108% 104% 109%
South Gippsland Shire Council 47% 60% 177% 92% 147% 105% 63% 101% 110%
Southern Grampians Shire Council 97% 41% 165% 79% 251% 127% 80% 102% 95%
Surf Coast Shire Council 127% 127% 195% 157% 171% 155% 77% 112% 131%
Sw an Hill Rural City Council 66% 105% 110% 98% 198% 115% 100% 132% 115%
Wellington Shire Council 162% 52% 150% 118% 168% 130% 79% 99% 106%
Average 94% 73% 156% 102% 161% 117% 87% 105% 107%
2012–13Large shire councils 2013–14 2014–15 2015–16 2016–17 Average
Forecast
2017–18 2018–19 2019–20
Bass Coast Shire Council 16.05% 23.77% 26.47% 26.87% 27.04% 24.04% 22.63% 21.42% 19.36%
Baw Baw Shire Council 18.95% 10.71% 24.33% 29.05% 31.74% 22.96% 30.66% 29.22% 28.55%
Campaspe Shire Council 17.74% 15.80% 20.92% 18.54% 15.95% 17.79% 13.14% 13.98% 14.78%
Colac-Otw ay Shire Council 30.32% 26.49% 28.11% 35.99% 30.32% 30.25% 17.85% 12.76% 10.43%
Corangamite Shire Council 21.85% 30.28% 31.99% 27.63% 20.30% 26.41% 20.45% 20.02% 19.56%
East Gippsland Shire Council 33.72% 24.19% 29.87% 26.43% 25.48% 27.94% 14.33% 13.94% 11.51%
Glenelg Shire Council 76.18% 56.04% 66.44% 73.03% 73.52% 69.04% 91.68% 64.52% 47.76%
Golden Plains Shire Council 25.80% 32.07% 32.96% 37.60% 40.63% 33.81% 35.76% 53.35% 59.63%
Macedon Ranges Shire Council 15.38% 17.55% 20.83% 24.76% 25.95% 20.90% 28.08% 18.61% 22.35%
Mitchell Shire Council 29.25% 50.15% 50.34% 40.80% 41.65% 42.44% 33.90% 34.35% 28.02%
Moira Shire Council 44.37% 38.68% 50.54% 39.97% 37.28% 42.17% 38.31% 38.04% 36.71%
Moorabool Shire Council 33.97% 30.40% 41.11% 42.32% 33.80% 36.32% 43.13% 47.73% 49.43%
Mount Alexander Shire Council 31.24% 33.23% 28.84% 20.99% 23.66% 27.59% 22.51% 31.00% 28.72%
Moyne Shire Council 5.08% 7.63% 7.04% 6.99% 5.78% 6.50% 6.48% 4.70% 3.91%
South Gippsland Shire Council 2.60% 3.10% 10.85% 10.66% 12.62% 7.96% 11.75% 3.23% 3.27%
Southern Grampians Shire Council 22.19% 21.93% 22.13% 18.39% 13.57% 19.64% 22.40% 34.29% 40.25%
Surf Coast Shire Council 57.26% 63.26% 60.18% 49.85% 44.94% 55.10% 49.38% 46.14% 37.34%
Sw an Hill Rural City Council 16.23% 17.20% 29.34% 27.19% 23.29% 22.65% 25.33% 25.21% 24.67%
Wellington Shire Council 18.68% 26.70% 20.36% 17.32% 18.81% 20.37% 19.13% 15.27% 15.88%
Average 27.20% 27.85% 31.72% 30.23% 28.75% 29.15% 28.78% 27.78% 26.43%
2012–13 2013–14 2014–15 2015–16 Average
Forecast
2016–17Large shire councils

Victorian Auditor-General’s Report Results of 2016–17 Audits: Local Government 97
Large shire councils, capital replacement 2013–2020
VAGO.
Large shire councils, renewal gap 2013–2020
VAGO.
2017–18 2018–19 2019–20
Bass Coast Shire Council 1.27 1.12 0.76 0.73 0.86 0.95 1.52 1.22 1.10
Baw Baw Shire Council 1.03 1.95 1.63 2.21 1.72 1.71 2.30 1.27 1.78
Campaspe Shire Council 1.81 2.41 1.15 1.10 1.14 1.52 1.38 1.10 1.05
Colac-Otw ay Shire Council 1.32 1.70 2.18 1.39 1.06 1.53 2.16 1.53 1.50
Corangamite Shire Council 1.08 0.95 1.19 1.38 1.09 1.14 1.48 2.25 1.33
East Gippsland Shire Council 1.45 1.73 1.40 1.20 0.99 1.35 1.53 1.19 1.17
Glenelg Shire Council 1.59 1.78 1.14 1.71 1.27 1.50 1.75 1.06 0.83
Golden Plains Shire Council 1.76 1.95 1.45 1.51 1.41 1.62 1.10 1.66 1.77
Macedon Ranges Shire Council 1.58 1.16 1.26 1.71 1.24 1.39 1.81 1.24 1.37
Mitchell Shire Council 1.72 1.55 0.85 0.65 1.53 1.26 1.94 0.91 1.12
Moira Shire Council 0.90 0.75 0.94 1.02 1.26 0.97 1.02 1.37 1.62
Moorabool Shire Council 1.68 1.50 1.19 1.84 2.76 1.79 1.49 1.35 1.25
Mount Alexander Shire Council 2.33 1.56 1.10 1.03 1.05 1.42 1.98 2.94 2.50
Moyne Shire Council 1.45 1.40 1.33 1.42 1.52 1.43 1.22 1.13 1.02
South Gippsland Shire Council 1.29 1.24 1.04 1.57 1.61 1.35 1.92 1.35 1.45
Southern Grampians Shire Council 1.34 0.96 1.05 1.17 0.88 1.08 3.68 1.90 1.08
Surf Coast Shire Council 1.51 1.61 1.08 1.27 1.21 1.34 1.56 1.43 1.41
Sw an Hill Rural City Council 1.84 1.19 1.78 1.46 0.92 1.44 2.13 1.32 1.70
Wellington Shire Council 0.87 1.10 1.08 1.14 1.28 1.10 2.16 1.66 1.37
Average 1.46 1.45 1.24 1.34 1.31 1.36 1.80 1.47 1.39
Large shire councils 2012–13 2013–14 2014–15 2015–16 2016–17 Average
Forecast
2017–18 2018–19 2019–20
Bass Coast Shire Council 0.90 0.94 0.64 0.64 0.81 0.79 1.07 0.92 1.05
Baw Baw Shire Council 1.31 1.78 1.62 1.82 1.28 1.56 1.73 0.83 0.84
Campaspe Shire Council 1.42 0.54 1.06 0.91 0.95 0.98 1.31 1.19 1.24
Colac-Otw ay Shire Council 0.97 1.34 1.86 1.23 0.99 1.28 1.38 1.53 1.50
Corangamite Shire Council 1.06 0.90 1.11 1.08 0.93 1.01 1.40 1.56 1.25
East Gippsland Shire Council 1.13 0.95 0.99 1.02 0.90 1.00 1.07 1.09 1.12
Glenelg Shire Council 1.06 1.09 1.01 1.13 1.13 1.09 1.31 0.84 0.71
Golden Plains Shire Council 1.13 1.38 0.85 0.89 1.13 1.07 0.70 0.62 0.57
Macedon Ranges Shire Council 1.29 0.89 0.86 1.19 0.97 1.04 1.46 1.19 1.17
Mitchell Shire Council 1.02 0.90 0.64 0.40 0.68 0.73 0.74 0.56 0.52
Moira Shire Council 0.80 0.64 0.80 0.71 0.97 0.78 0.87 1.03 1.06
Moorabool Shire Council 1.62 1.43 1.07 1.55 1.51 1.43 1.23 1.11 1.03
Mount Alexander Shire Council 1.34 1.01 0.58 0.78 0.82 0.91 1.62 2.11 1.69
Moyne Shire Council 1.07 1.04 1.25 1.29 1.48 1.23 1.18 1.13 1.02
South Gippsland Shire Council 1.08 1.18 0.98 1.23 1.43 1.18 1.59 1.28 1.05
Southern Grampians Shire Council 0.92 0.94 0.92 0.82 0.74 0.87 3.30 1.82 0.82
Surf Coast Shire Council 0.72 0.91 0.82 0.65 0.56 0.73 1.03 0.96 1.07
Sw an Hill Rural City Council 1.37 1.02 1.07 0.93 0.79 1.03 1.22 0.96 1.30
Wellington Shire Council 0.84 1.01 1.01 1.07 1.17 1.02 1.79 1.47 1.28
Average 1.11 1.05 1.01 1.02 1.01 1.04 1.37 1.17 1.07
Average
Forecast
2012–13 2013–14 2014–15 2015–16 2016–17Large shire councils
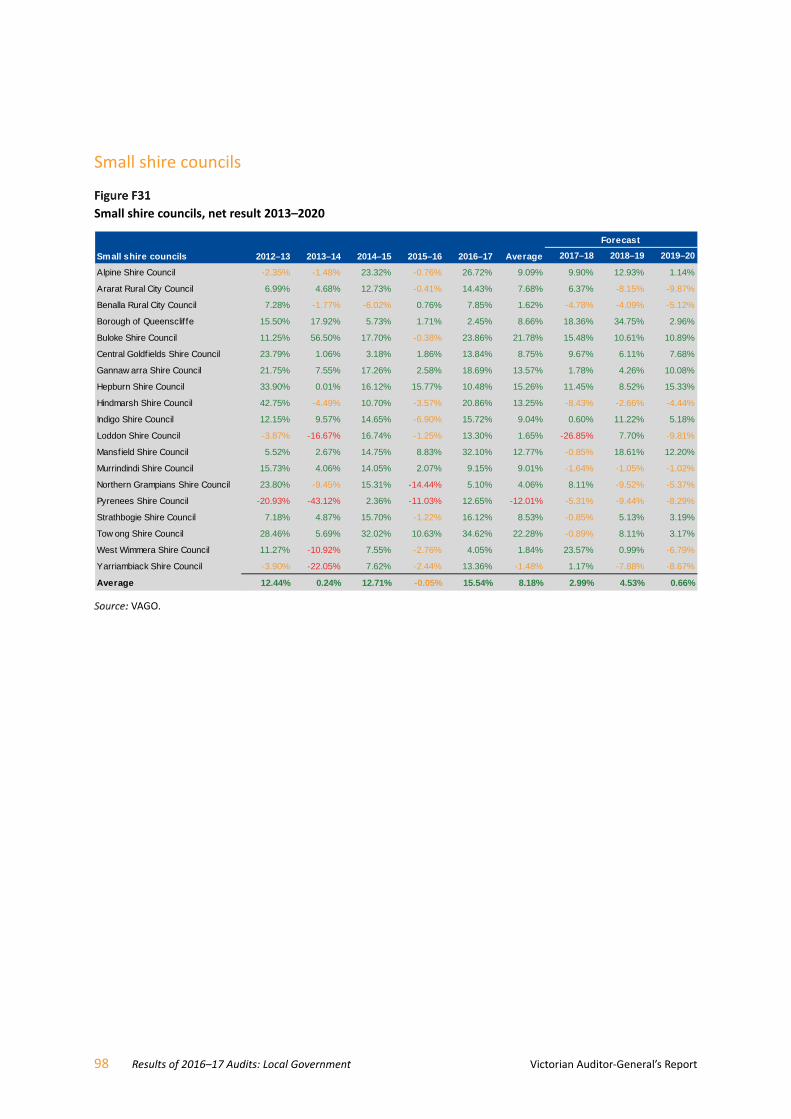
98 Results of 2016–17 Audits: Local Government Victorian Auditor-General’s Report
Small shire councils
Small shire councils, net result 2013–2020
VAGO.
2017–18 2018–19 2019–20
Alpine Shire Council -2.35% -1.48% 23.32% -0.76% 26.72% 9.09% 9.90% 12.93% 1.14%
Ararat Rural City Council 6.99% 4.68% 12.73% -0.41% 14.43% 7.68% 6.37% -8.15% -9.87%
Benalla Rural City Council 7.28% -1.77% -6.02% 0.76% 7.85% 1.62% -4.78% -4.09% -5.12%
Borough of Queensclif fe 15.50% 17.92% 5.73% 1.71% 2.45% 8.66% 18.36% 34.75% 2.96%
Buloke Shire Council 11.25% 56.50% 17.70% -0.38% 23.86% 21.78% 15.48% 10.61% 10.89%
Central Goldfields Shire Council 23.79% 1.06% 3.18% 1.86% 13.84% 8.75% 9.67% 6.11% 7.68%
Gannaw arra Shire Council 21.75% 7.55% 17.26% 2.58% 18.69% 13.57% 1.78% 4.26% 10.08%
Hepburn Shire Council 33.90% 0.01% 16.12% 15.77% 10.48% 15.26% 11.45% 8.52% 15.33%
Hindmarsh Shire Council 42.75% -4.49% 10.70% -3.57% 20.86% 13.25% -8.43% -2.66% -4.44%
Indigo Shire Council 12.15% 9.57% 14.65% -6.90% 15.72% 9.04% 0.60% 11.22% 5.18%
Loddon Shire Council -3.87% -16.67% 16.74% -1.25% 13.30% 1.65% -26.85% 7.70% -9.81%
Mansfield Shire Council 5.52% 2.67% 14.75% 8.83% 32.10% 12.77% -0.85% 18.61% 12.20%
Murrindindi Shire Council 15.73% 4.06% 14.05% 2.07% 9.15% 9.01% -1.64% -1.05% -1.02%
Northern Grampians Shire Council 23.80% -9.45% 15.31% -14.44% 5.10% 4.06% 8.11% -9.52% -5.37%
Pyrenees Shire Council -20.93% -43.12% 2.36% -11.03% 12.65% -12.01% -5.31% -9.44% -8.29%
Strathbogie Shire Council 7.18% 4.87% 15.70% -1.22% 16.12% 8.53% -0.85% 5.13% 3.19%
Tow ong Shire Council 28.46% 5.69% 32.02% 10.63% 34.62% 22.28% -0.89% 8.11% 3.17%
West Wimmera Shire Council 11.27% -10.92% 7.55% -2.76% 4.05% 1.84% 23.57% 0.99% -6.79%
Yarriambiack Shire Council -3.90% -22.05% 7.62% -2.44% 13.36% -1.48% 1.17% -7.88% -8.67%
Average 12.44% 0.24% 12.71% -0.05% 15.54% 8.18% 2.99% 4.53% 0.66%
Average
Forecast
2016–17Small shire councils 2012–13 2013–14 2014–15 2015–16

Victorian Auditor-General’s Report Results of 2016–17 Audits: Local Government 99
Small shire councils, adjusted underlying result 2015–2020
VAGO.
Small shire councils, liquidity 2013–2020
VAGO.
2017–18 2018–19 2019–20
Alpine Shire Council 12.00% -5.00% 12.00% 6.33% 0.00% 2.00% 0.00%
Ararat Rural City Council 5.00% -13.97% 3.90% -1.69% -6.33% -8.15% -9.87%
Benalla Rural City Council -12.00% -3.00% 5.00% -3.33% -5.00% -4.00% -5.00%
Borough of Queensclif fe -2.00% -2.00% 2.00% -0.67% -8.00% -7.00% -3.00%
Buloke Shire Council 5.40% -3.67% 7.42% 3.05% -1.82% -1.56% -1.06%
Central Goldfields Shire Council -7.10% -6.99% -1.01% -5.03% -10.00% 6.11% 7.25%
Gannaw arra Shire Council 9.69% -2.92% 12.56% 6.44% -5.09% 1.49% 4.24%
Hepburn Shire Council 9.90% 3.00% 7.60% 6.83% 7.60% 4.30% 4.70%
Hindmarsh Shire Council 5.90% -10.40% 10.80% 2.10% -2.60% -5.30% -11.30%
Indigo Shire Council 8.13% -10.18% 11.08% 3.01% -15.20% -5.82% -5.82%
Loddon Shire Council 10.82% -37.73% 2.18% -8.24% -36.16% -2.08% -36.11%
Mansfield Shire Council 5.00% -5.00% 15.00% 5.00% -4.00% 7.00% 2.00%
Murrindindi Shire Council 3.51% -2.55% 6.25% 2.40% -2.24% -1.66% -1.61%
Northern Grampians Shire Council 14.80% -21.40% 2.40% -1.40% -2.60% -9.50% -5.40%
Pyrenees Shire Council -10.53% -39.98% 10.47% -13.35% -6.35% -14.51% -14.27%
Strathbogie Shire Council 10.24% -16.00% 11.41% 1.88% -4.78% 4.47% 2.51%
Tow ong Shire Council 26.57% 8.64% 29.87% 21.69% -8.81% 4.20% -0.18%
West Wimmera Shire Council 3.06% -5.22% -24.91% -9.02% -7.20% -4.94% -7.75%
Yarriambiack Shire Council 5.00% -5.00% 10.00% 3.33% -12.00% -13.00% -14.00%
Average 5.44% -9.44% 7.05% 1.02% -6.87% -2.52% -4.98%
Forecast
Small shire councils 2014–15 2015–16 2016–17 Average
2017–18 2018–19 2019–20
Alpine Shire Council 2.40 1.85 2.89 2.31 2.85 2.46 1.82 1.34 1.47
Ararat Rural City Council 3.40 2.52 3.49 3.84 4.22 3.49 3.52 3.74 3.91
Benalla Rural City Council 1.65 1.22 1.27 1.20 1.57 1.38 1.14 1.14 1.13
Borough of Queensclif fe 2.03 2.39 2.50 2.96 3.06 2.59 2.02 1.23 1.32
Buloke Shire Council 0.57 0.18 1.69 2.49 4.69 1.92 3.98 1.47 3.12
Central Goldfields Shire Council 1.52 1.23 1.31 1.52 1.47 1.41 1.13 1.21 1.22
Gannaw arra Shire Council 2.63 2.63 2.99 2.36 3.10 2.74 2.62 2.59 2.55
Hepburn Shire Council 2.50 1.85 2.79 3.20 2.96 2.66 2.18 2.26 2.28
Hindmarsh Shire Council 3.30 2.02 3.56 2.88 4.14 3.18 1.44 1.38 1.06
Indigo Shire Council 2.31 2.17 1.50 1.29 2.19 1.89 1.14 1.05 1.05
Loddon Shire Council 4.54 4.12 5.88 6.41 7.90 5.77 3.84 2.90 2.18
Mansfield Shire Council 2.61 1.50 1.81 1.63 2.15 1.94 2.07 1.72 1.00
Murrindindi Shire Council 3.29 2.75 3.98 3.90 5.38 3.86 3.86 4.15 4.12
Northern Grampians Shire Council 1.90 1.64 1.97 2.12 3.01 2.13 2.38 2.27 2.11
Pyrenees Shire Council 3.57 2.25 2.33 1.97 3.09 2.64 1.64 1.55 1.41
Strathbogie Shire Council 2.12 1.61 1.98 2.04 2.44 2.04 1.38 1.54 1.51
Tow ong Shire Council 4.74 4.00 6.33 5.61 6.95 5.53 4.86 4.49 4.77
West Wimmera Shire Council 2.72 2.90 3.56 3.21 3.38 3.15 3.36 2.70 2.75
Yarriambiack Shire Council 1.72 0.96 1.29 0.89 1.59 1.29 1.18 1.20 1.21
Average 2.61 2.09 2.80 2.73 3.48 2.74 2.40 2.10 2.11
Small shire councils 2012–13 2013–14 2014–15 2015–16 2016–17 Average
Forecast

100 Results of 2016–17 Audits: Local Government Victorian Auditor-General’s Report
Small shire councils, internal financing 2013–2020
VAGO.
Small shire councils, indebtedness 2013–2020
VAGO.
2017–18 2018–19 2019–20
Alpine Shire Council 83% 124% 175% 87% 105% 115% 89% 67% 119%
Ararat Rural City Council 80% 105% 108% 91% 175% 112% 92% 121% 117%
Benalla Rural City Council 49% 75% 119% 98% 153% 99% 92% 108% 103%
Borough of Queensclif fe 106% 109% 160% 56% 183% 123% 89% 84% 52%
Buloke Shire Council 97% 88% 136% 139% 228% 137% 121% 133% 129%
Central Goldfields Shire Council 70% 86% 139% 125% 123% 109% 87% 134% 120%
Gannaw arra Shire Council 73% 89% 118% 65% 131% 95% 74% 104% 101%
Hepburn Shire Council 121% 57% 141% 91% 54% 93% 84% 110% 105%
Hindmarsh Shire Council 100% 32% 143% 80% 145% 100% 63% 95% 86%
Indigo Shire Council 110% 90% 85% 85% 197% 113% 80% 99% 108%
Loddon Shire Council 141% 62% 158% 95% 156% 122% 37% 80% 79%
Mansfield Shire Council 50% 56% 103% 91% 178% 96% 73% 92% 77%
Murrindindi Shire Council 178% 149% 218% 115% 124% 157% 124% 144% 102%
Northern Grampians Shire Council 225% 58% 133% 96% 192% 141% 188% 94% 95%
Pyrenees Shire Council -9% 11% 135% 87% 177% 80% 101% 98% 94%
Strathbogie Shire Council 98% 120% 139% 99% 172% 126% 43% 108% 101%
Tow ong Shire Council 151% 61% 168% 93% 203% 135% -18% -10% -15%
West Wimmera Shire Council 112% 42% 154% 99% 182% 118% 96% 79% 108%
Yarriambiack Shire Council 43% 68% 147% 80% 183% 104% 108% 105% 101%
Average 99% 78% 141% 93% 161% 114% 85% 97% 94%
2012–13Small shire councils 2013–14 2014–15 2015–16 2016–17 Average
Forecast
2017–18 2018–19 2019–20
Alpine Shire Council 31.06% 29.92% 26.10% 22.62% 16.90% 25.32% 17.16% 15.96% 15.36%
Ararat Rural City Council 2.27% 1.42% 12.78% 12.51% 12.01% 8.20% 17.08% 16.75% 16.42%
Benalla Rural City Council 50.00% 47.89% 68.37% 62.03% 57.04% 57.06% 52.99% 53.44% 52.21%
Borough of Queensclif fe 0.49% 0.59% 0.80% 2.09% 1.08% 1.01% 2.39% 5.27% 7.46%
Buloke Shire Council 11.20% 6.03% 62.78% 60.45% 57.10% 39.51% 56.54% 6.82% 6.74%
Central Goldfields Shire Council 31.38% 26.91% 19.90% 25.69% 10.75% 22.93% 18.96% 12.53% 7.00%
Gannaw arra Shire Council 16.57% 14.89% 13.46% 12.24% 10.77% 13.58% 11.16% 10.48% 9.79%
Hepburn Shire Council 11.25% 12.43% 16.35% 13.66% 24.91% 15.72% 22.06% 19.61% 17.40%
Hindmarsh Shire Council 1.39% 1.52% 1.24% 2.30% 2.84% 1.86% 1.39% 1.36% 1.33%
Indigo Shire Council 20.86% 22.45% 26.66% 38.01% 35.95% 28.79% 32.31% 31.71% 29.48%
Loddon Shire Council 16.37% 20.34% 16.95% 17.73% 12.52% 16.78% 21.50% 23.84% 25.69%
Mansfield Shire Council 9.81% 23.21% 27.57% 24.14% 20.19% 20.99% 18.31% 16.75% 15.19%
Murrindindi Shire Council 25.04% 22.00% 17.60% 30.79% 29.48% 24.98% 28.82% 27.61% 26.46%
Northern Grampians Shire Council 13.88% 26.48% 17.14% 28.80% 23.43% 21.94% 21.94% 20.24% 18.76%
Pyrenees Shire Council 22.66% 19.84% 5.46% 1.59% 1.47% 10.20% 1.55% 1.56% 1.60%
Strathbogie Shire Council 16.02% 16.26% 15.08% 14.01% 9.57% 14.19% 4.35% 5.24% 4.56%
Tow ong Shire Council 8.41% 4.07% 5.97% 7.43% 6.66% 6.51% 10.57% 12.32% 28.37%
West Wimmera Shire Council 1.73% 5.44% 4.71% 3.86% 2.29% 3.61% 5.25% 5.12% 5.10%
Yarriambiack Shire Council 8.85% 9.58% 6.21% 4.67% 4.41% 6.74% 5.73% 5.74% 5.57%
Average 15.75% 16.38% 19.22% 20.24% 17.86% 17.89% 18.42% 15.39% 15.50%
2012–13 2013–14 2014–15 2015–16 Average
Forecast
2016–17Small shire councils

Victorian Auditor-General’s Report Results of 2016–17 Audits: Local Government 101
Small shire councils, capital replacement 2013–2020
VAGO.
Small shire councils, renewal gap 2013–2020
n/a = not able to provide an indicator result.
VAGO.
2017–18 2018–19 2019–20
Alpine Shire Council 1.13 1.24 1.43 1.40 1.92 1.42 1.90 2.49 0.95
Ararat Rural City Council 1.10 1.42 1.49 1.07 1.01 1.22 1.40 0.65 0.64
Benalla Rural City Council 1.82 1.77 1.79 0.95 1.10 1.49 1.11 0.76 0.73
Borough of Queensclif fe 2.19 2.43 1.64 1.96 1.22 1.89 3.90 6.86 1.48
Buloke Shire Council 1.59 5.79 1.55 0.89 0.92 2.15 1.41 1.10 1.11
Central Goldfields Shire Council 2.41 1.64 1.22 0.99 1.12 1.48 2.01 1.19 1.27
Gannaw arra Shire Council 2.33 1.33 1.94 1.73 1.66 1.80 1.55 1.26 1.59
Hepburn Shire Council 3.09 1.71 1.36 1.53 1.87 1.91 1.91 1.30 1.69
Hindmarsh Shire Council 4.06 2.01 1.24 1.14 1.32 1.95 1.16 0.94 1.00
Indigo Shire Council 1.33 1.61 2.51 1.31 1.05 1.56 1.36 1.67 1.16
Loddon Shire Council 0.97 1.24 0.94 1.18 0.90 1.05 0.99 1.57 0.96
Mansfield Shire Council 1.35 3.03 1.84 1.19 1.54 1.79 1.57 2.48 2.33
Murrindindi Shire Council 0.96 1.18 0.79 1.03 1.11 1.01 0.83 0.67 0.89
Northern Grampians Shire Council 0.95 1.25 1.11 0.87 0.71 0.98 0.77 0.77 0.90
Pyrenees Shire Council 1.72 0.79 0.87 0.99 0.95 1.06 0.97 0.82 0.89
Strathbogie Shire Council 1.41 1.41 1.58 1.43 1.24 1.42 2.77 1.33 1.30
Tow ong Shire Council 1.56 1.81 1.80 1.63 1.45 1.65 1.67 1.51 1.26
West Wimmera Shire Council 1.00 1.03 0.96 1.02 1.00 1.00 2.05 1.31 0.81
Yarriambiack Shire Council 1.51 1.17 1.12 1.33 0.97 1.22 1.08 0.80 0.79
Average 1.71 1.78 1.43 1.25 1.21 1.48 1.60 1.55 1.14
Small shire councils 2012–13 2013–14 2014–15 2015–16 2016–17 Average
Forecast
2017–18 2018–19 2019–20
Alpine Shire Council 1.10 1.08 0.98 1.21 1.78 1.23 1.81 2.49 0.95
Ararat Rural City Council 1.05 1.07 1.06 0.79 0.76 0.95 1.22 0.65 0.63
Benalla Rural City Council 1.21 1.72 1.10 0.71 0.58 1.06 0.76 0.66 0.56
Borough of Queensclif fe 1.96 0.98 1.23 1.64 0.82 1.33 2.48 4.60 1.07
Buloke Shire Council 1.31 5.97 0.84 0.74 0.89 1.95 1.13 1.09 1.11
Central Goldfields Shire Council 2.04 1.01 0.95 0.83 0.80 1.13 1.71 0.93 1.08
Gannaw arra Shire Council 1.87 1.24 1.68 1.27 1.49 1.51 1.29 0.92 1.17
Hepburn Shire Council 2.74 1.08 1.26 1.46 0.93 1.49 1.50 1.21 1.44
Hindmarsh Shire Council 2.64 1.83 0.91 0.96 0.84 1.43 1.08 0.90 0.96
Indigo Shire Council 1.16 1.56 2.34 1.17 0.70 1.39 0.68 n/a n/a
Loddon Shire Council 0.78 1.12 0.71 0.51 0.77 0.78 0.43 0.87 0.54
Mansfield Shire Council 1.05 2.58 1.54 0.96 1.01 1.43 1.31 1.69 1.85
Murrindindi Shire Council 0.64 0.82 0.69 0.62 0.92 0.74 0.72 0.62 0.57
Northern Grampians Shire Council 1.96 1.23 0.62 0.75 0.53 1.02 1.20 0.77 0.88
Pyrenees Shire Council 1.07 0.58 0.75 0.87 0.79 0.81 0.85 0.73 0.80
Strathbogie Shire Council 0.98 1.25 1.52 1.35 1.05 1.23 2.01 1.23 1.23
Tow ong Shire Council 2.46 1.46 1.03 1.00 1.18 1.43 1.53 0.88 0.94
West Wimmera Shire Council 0.91 0.98 0.83 0.96 0.95 0.93 1.94 3.84 1.25
Yarriambiack Shire Council 1.23 0.93 1.10 1.29 0.94 1.10 0.23 0.12 0.12
Average 1.48 1.50 1.11 1.00 0.93 1.21 1.26 1.34 0.95
Average
Forecast
2012–13 2013–14 2014–15 2015–16 2016–17Small shire councils


Victorian Auditor-General’s Report Results of 2016–17 Audits: Local Government 103
Glossary Accountability
Responsibility of public entities to achieve their objectives in reliability of
financial reporting, effectiveness and efficiency of operations, compliance with
applicable laws, and reporting to interested parties.
Adverse opinion
An audit opinion expressed if the auditor has sufficient appropriate audit
evidence and concludes that misstatements, individually and in aggregate, are
both material and pervasive in the financial report.
Amortisation
The systematic allocation of the depreciable amount of an intangible asset over
its expected useful life.
Asset
An item or resource controlled by an entity that will be used to generate
economic benefits.
Asset valuation
The fair value of a non-current asset on a specified date.
Audit Act 1994
Victorian legislation establishing the Auditor-General’s operating powers and
responsibilities and detailing the nature and scope of audits that the
Auditor-General may carry out.
Audit committee
Helps a governing board to fulfil its governance and oversight responsibilities
and strengthen accountability of senior management.
Audit opinion
A written expression, within a specified framework, indicating the auditor’s
overall conclusion about a financial (or performance) report based on audit
evidence.
Calendar year
A period of a year beginning with January 1 and ending with December 31.

104 Results of 2016–17 Audits: Local Government Victorian Auditor-General’s Report
Capital expenditure
Money an entity spends on:
new physical assets, including property, infrastructure, plant and equipment
renewing existing physical assets to extend the service potential or life.
Capital grant/capital purpose income
Government funding for an agency to acquire or build capital assets such as
land, buildings or equipment.
Carrying value
The original cost of an asset, less the accumulated amount of any depreciation
or amortisation, less the accumulated amount of any asset impairment.
Clear audit opinion
A positive written expression provided when the financial report has been
prepared and presents fairly the transactions and balances for the reporting
period in keeping with the requirements of the relevant legislation and
Australian Accounting Standards. Also referred to as an unqualified audit
opinion.
Control environment
Processes within an entity’s governance and management structure that
provide reasonable assurance about the achievement of an entity’s objectives in
reliability of financial reporting, effectiveness and efficiency of operations, and
compliance with applicable laws and regulations.
Corporations Act 2001
Commonwealth legislation governing corporations, including their financial
reporting framework.
Credit rating
The rating that credit rating agencies assign to the bonds of an issuer.
Current asset
An asset that will be sold or realised within 12 months of the end of the
financial year being reported on, such as term deposits maturing in three
months or stock items available for sale.
Current liability
A liability that will be settled within 12 months of the end of the financial year
being reported on, such as payment of a creditor for services provided to the
entity.

Victorian Auditor-General’s Report Results of 2016–17 Audits: Local Government 105
Debt
Money owed by one party to another party.
Deficit
When total expenditure is more than total revenue.
Depreciated replacement cost
Current replacement cost less accumulated depreciation to reflect the economic
benefits of the assets that have been consumed.
Depreciation
Systematic allocation of the value of an asset over its expected useful life,
recorded as an expense.
Disclaimer of opinion
Conclusion expressed if the auditor is unable to obtain sufficient appropriate
audit evidence on which to base an audit opinion, and the auditor concludes
that the possible effects on the financial (or performance) report of undetected
misstatements, if any, could be both material and pervasive.
Eliminations
Removing the effect of transactions between entities when preparing
consolidated financial statements.
Emphasis of matter
A paragraph included in an audit opinion of a financial report that refers to a
matter appropriately presented or disclosed that, in the auditor’s judgement, is
of such importance that it is fundamental to users’ understanding of the
financial report.
Entity
A corporate or unincorporated body that has a public function to exercise on
behalf of the State or is wholly owned by the State, including departments,
statutory authorities, statutory corporations and government business
enterprises.
Equity or net assets
Residual interest in the assets of an entity after deducting its liabilities.

106 Results of 2016–17 Audits: Local Government Victorian Auditor-General’s Report
Expense
The outflow of assets or the depletion of assets an entity controls during the
financial year, including expenditure and the depreciation of physical assets. An
expense can also be the incurrence of liabilities during the financial year, such as
increases to a provision.
Fair value
The price that would be received if an asset was sold or the price paid to
transfer a liability in an orderly transaction between market participants at the
measurement date.
Financial report
A document reporting the financial outcome and position of an entity for a
financial year, which contains financial statements, including a comprehensive
income statement, a balance sheet, a cash flow statement, a comprehensive
statement of equity, and notes.
Financial sustainability
An entity’s ability to manage financial resources so it can meet its current and
future spending commitments, while maintaining assets in the condition
required to provide services.
Financial year
A period of 12 months for which a financial report is prepared, which may be a
different period to the calendar year.
Going concern
An entity that is expected to be able to pay its debts when they fall due, and
continue in operation without any intention or necessity to liquidate or
otherwise wind up its operations.
Governance
The control arrangements used to govern and monitor an entity’s activities to
achieve its strategic and operational goals.
Impairment (loss)
The amount by which the value of an entity’s asset exceeds its recoverable
value.
Income
The inflow of assets or decrease of liabilities during the financial year, including
receipt of cash and the reduction of a provision.

Victorian Auditor-General’s Report Results of 2016–17 Audits: Local Government 107
Income approach
A valuation technique that converts future amounts, such as cash flows or
income and expense, to a single current (discounted) amount. The fair value of
those future amounts is measured as the value indicated by current market
expectations.
Intangible asset
An identifiable non-financial asset, controlled by an entity, that cannot be
physically seen, such as software licences or a patent.
Internal audit
A function of an entity’s governance framework that examines and reports to
management on the effectiveness of the entity’s risk management, internal
controls and governance processes.
Internal control
A method of directing, monitoring and measuring an entity’s resources and
processes to prevent and detect error and fraud.
Investment
Public or private sector expenditure for the development and/or use of
infrastructure assets, intended to result in medium- to long-term service and/or
financial benefits.
Issues
Weaknesses or other concerns in the governance structure of an entity
identified during a financial audit, which are reported to the entity in a
management letter.
Liability
A present obligation of the entity arising from past events, the settlement of
which is expected to result in an outflow of assets from the entity.
Local Government Act 1989
An Act of the state of Victoria that establishes the:
purpose of local authorities
powers that will enable local authorities to meet the needs of their communities
accountable system of local government
reform of law relating to local government.
108 Results of 2016–17 Audits: Local Government Victorian Auditor-General’s Report
Management letter
A letter the auditor writes to the governing body, the audit committee and the
management of an entity outlining issues identified during the financial audit.
Material error or adjustment
An error that may result in the omission or misstatement of information, which
could influence the economic decision of users taken on the basis of the
financial statements.
Materiality
Information is material if its omission, misstatement or non-disclosure has the
potential to affect the economic decisions of users of the financial report, or the
discharge of accountability by management or those charged with governance.
The size, value and nature of the information and the circumstances of its
omission or misstatement help in deciding how material it is.
Modified opinion
The auditor’s expressed qualified opinion, adverse opinion or disclaimer of
opinion.
Net result
The value that an entity has earned or lost over the stated period—usually a
financial year—calculated by subtracting an entity’s total expenses from its total
revenue for that period.
Non-current asset
An asset that will be sold or realised later than 12 months after the end of the
financial year being reported on, such as investments with a maturity date of
two years or physical assets the entity holds for long-term use.
Non-current liability
A liability that will be settled later than 12 months after the end of the financial
year being reported on, such as repayments on a five-year loan that are not due
in the next 12 months.
Non-reciprocal transfers
Transfers in which an entity receives assets without directly giving equal value in
exchange to the other party to the transfer.
Other comprehensive income
Revenues, expenses, gains and losses under Australian Accounting Standards
that are excluded from net income on the income statement and are instead
listed after net income.

Victorian Auditor-General’s Report Results of 2016–17 Audits: Local Government 109
Performance statement
A statement detailing an entity’s predetermined performance indicators and
targets for the financial year, and the actual results achieved, along with
explanations for any significant variations between the actual result and the
target.
Physical asset
A non-financial asset that is a tangible item an entity controls, and that will be
used by the entity for more than 12 months to generate profit or provide
services, such as building, equipment or land.
Present value
A current estimate of the present discounted value of the future net cash flows
in the normal course of business.
Qualified audit opinion
An opinion issued when the auditor concludes that an unqualified opinion
cannot be expressed because of:
disagreement with those charged with governance or
conflict between applicable financial reporting frameworks or
limitation of scope.
A qualified opinion is considered to be unqualified except for the effects of the
matter that relates to the qualification.
Regulatory period
A statutory defined period that reflects all of the financial/operational activities
that took place during that time.
Relevant measures and indicators
Measures and indicators an entity uses if they have a logical and consistent
relationship to its objectives and are linked to the outcomes to be achieved.
Revaluation
The restatement of a value of non-current assets at a particular point in time.
Revenue
Inflows of funds or other assets or savings in outflows of service potential, or
future economic benefits in the form of increases in assets or reductions in
liabilities of an entity, other than those relating to contributions by owners, that
result in an increase in equity during the reporting period.

110 Results of 2016–17 Audits: Local Government Victorian Auditor-General’s Report
Risk
The chance of a negative or positive impact on the objectives, outputs or
outcomes of an entity.
Risk register
A tool an entity uses to help identify, monitor and mitigate risks. The register
may appear in the form of a plot graph or a table.
Specific purpose funds/specific purpose grants
Grant funding provided by the Commonwealth to the state government for a
particular area or service.
Strategic plan
A document an entity provides to its staff and board to communicate its
organisational goals, the actions needed to achieve those goals and other
critical elements developed during the planning exercise.
Unmodified opinion
The audit opinion that the auditor expresses when concluding that the financial
(or performance) report is prepared, in all material respects, in keeping with the
applicable reporting framework.
Whole-of-life cost
The cost to buy or construct an asset, plus the cost of maintaining the asset over
its life.
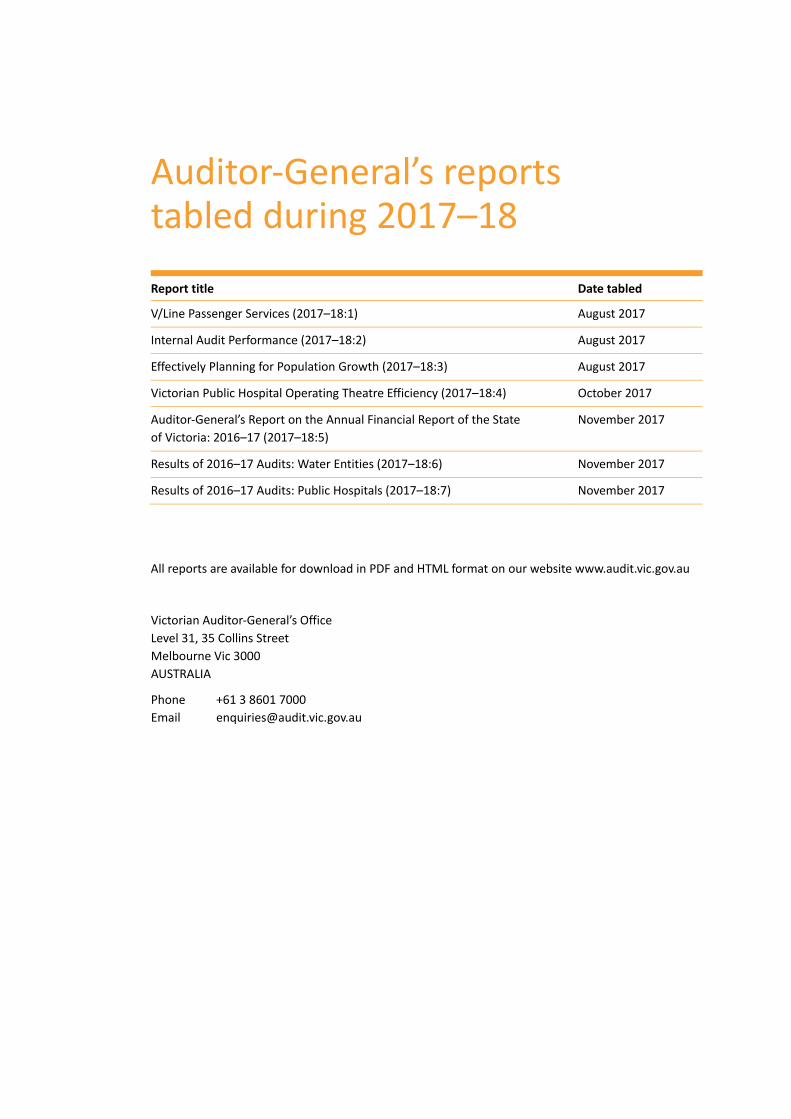
Auditor-General’s reports tabled during 2017–18
Report title Date tabled
V/Line Passenger Services (2017–18:1) August 2017
Internal Audit Performance (2017–18:2) August 2017
Effectively Planning for Population Growth (2017–18:3) August 2017
Victorian Public Hospital Operating Theatre Efficiency (2017–18:4) October 2017
Auditor-General’s Report on the Annual Financial Report of the State
of Victoria: 2016–17 (2017–18:5)
November 2017
Results of 2016–17 Audits: Water Entities (2017–18:6) November 2017
Results of 2016–17 Audits: Public Hospitals (2017–18:7) November 2017
All reports are available for download in PDF and HTML format on our website www.audit.vic.gov.au
Victorian Auditor-General’s Office
Level 31, 35 Collins Street
Melbourne Vic 3000
AUSTRALIA
Phone +61 3 8601 7000
Email [email protected]