Embed Size (px)
Citation preview

Level 31 / 35 Collins StreetMelbourne Vic 3000
T 03 8601 7000
—
—
Victorian Auditor -General’s Office
Results of 2016–17 Audits: Water Entities
2017–18:6N
ovember 2017
Victorian Auditor-General’s Report2017–18:6
Results of 2016–17 Audits:
Water Entities
November 2017
9990 VAGO_Results of 2016–17 Audits- Water Entities_Cover.pdf | Page 1 of 1 9990 VAGO_Results of 2016–17 Audits- Water Entities_Cover.pdf | Page 1 of 1

Results of 2016–17 Audits: Water Entities
Ordered to be published
VICTORIAN GOVERNMENT PRINTER
November 2017
PP No 346, Session 2014–17

This report is printed on Monza Recycled paper. Monza Recycled is certified Carbon Neutral by The Carbon Reduction Institute
(CRI) in accordance with the global Greenhouse Gas Protocol and ISO 14040 framework. The Lifecycle Analysis for Monza
Recycled is cradle to grave including Scopes 1, 2 and 3. It has FSC Mix Certification combined with 55% recycled content.
ISBN 978 1 925678 06 2
The Hon Bruce Atkinson MLC The Hon Colin Brooks MP
President Speaker
Legislative Council Legislative Assembly
Parliament House Parliament House
Melbourne Melbourne
Dear Presiding Officers
Under the provisions of section 16AB of the Audit Act 1994, I transmit my report
Results of 2016–17 Audits: Water Entities.
Yours faithfully
Andrew Greaves
Auditor-General
15 November 2017

Victorian Auditor-General’s Report Results of 2016–17 Audits: Water Entities 5
Contents Audit overview ............................................................................................................. 7
Conclusion .................................................................................................................................. 7
Findings ...................................................................................................................................... 7
Recommendations ..................................................................................................................... 9
Submissions and comments .................................................................................................... 10
1 Audit context ......................................................................................................... 11
What do water entities do? ............................................................................................. 13
Framework for water regulation ..................................................................................... 14
How water entities fund their operations ....................................................................... 16
Report structure .............................................................................................................. 19
2 Results of audits .................................................................................................... 21
Financial report audit opinions ....................................................................................... 21
Performance report audit opinions ................................................................................. 27
3 Internal controls .................................................................................................... 29
Context ............................................................................................................................ 29
Assessment of internal controls ...................................................................................... 29
Post asset revaluation implementation ........................................................................... 33
4 Financial outcomes ................................................................................................ 39
Overview of the sector’s financial results ....................................................................... 40
Metropolitan water entities ............................................................................................ 41
Regional urban water entities ......................................................................................... 48
Rural water entities ......................................................................................................... 52
Appendix A. Audit Act 1994 section 16—submissions and comments ..................... 57
Appendix B. Water entities ........................................................................................ 61
Appendix C. Acquittal of audits .................................................................................. 63
Appendix D. Management letter risk ratings ............................................................. 65
Appendix E. Financial sustainability risk indicators and summaries .......................... 67
Appendix F. Financial and performance reporting framework .................................. 89
Appendix G. Glossary ................................................................................................. 97

6 Results of 2016–17 Audits: Water Entities Victorian Auditor-General’s Report
Acronyms
AASB Australian Accounting Standards Board
AIMS Asset information management system
AMAF Asset Management Accountability Framework
CMA Catchment management authority
CO2 Carbon dioxide
DELWP Department of Environment, Land, Water and Planning
DRP Disaster recovery plan
EBITDA Earnings before interest, tax, depreciation and amortisation
EPA Environment Protection Authority
ESC Essential Services Commission
EWOV Energy and Water Ombudsman of Victoria
FASL Fixed asset sub-ledger
FMA Financial Management Act 1994
FRD Financial Reporting Direction
FTE Full-time equivalent
IASB International Accounting Standards Board
IT Information technology
KPI Key performance indicator
MRD Ministerial Reporting Direction
PREMO Performance, Risk, Engagement, Management and Outcomes
VAGO Victorian Auditor-General’s Office
VGV Valuer-General Victoria
WIRO Water Industry Regulatory Order
WRRG Waste and Resource Recovery Group

Victorian Auditor-General’s Report Results of 2016–17 Audits: Water Entities 7
Audit overview Water entities provide a range of water services, including supplying water
and sewerage services, managing bulk water storage and looking after specific
recreational areas, such as caravan parks. Victoria’s water sector is made up of
19 water entities and one controlled entity.
The board of each water entity reports to the Minister for Water through the
Department of Environment, Land, Water and Planning (DELWP).
The Essential Services Commission (ESC) is responsible for regulating and
approving the maximum prices each water entity charges its customers for
supplying water and providing sewerage and other services.
This report outlines the results of our financial audits of the water entities, and
our observations, for the year ended 30 June 2017. We also discuss our audits
of entities’ performance reports and analyse the financial results and outcomes
for the water entities.
We have assessed the sector as financially sustainable, with no immediate
short-term risks identified. In the longer term, some water entities will need to
consider the risks associated with their ability to replace or renew assets and
repay debt.
Results of financial audits
We issued clear audit opinions to the 19 water entities for the financial year
ended 30 June 2017, consistent with our 2015–16 results.
We assessed the quality of financial reporting processes against better practice
criteria. Overall, the water entities used good-quality processes to prepare their
financial reports, and they presented timely and accurate draft statements for
audit. However, they need to improve the preparation and quality of financial
statements and the development of their financial report preparation plans.
The sector began to streamline its financial reports in 2016–17, to improve the
structure and disclosure content of financial statements, which will enhance
their readability. We commend the sector for its commitment to this process.
Overall, the sector has used the streamlined financial reporting process as an
opportunity to realign and refresh the structure and content of its financial
statements, however there are further areas for improvement that will allow
entities to better customise their financial reports.
Results of performance report audits
We issued clear audit opinions on the performance reports for all 19 water
entities, consistent with the 2015–16 reporting period.
Conclusion
Findings
8 Results of 2016–17 Audits: Water Entities Victorian Auditor-General’s Report
Our past reports have highlighted that the water sector’s performance reporting
processes are not as mature as those used for financial reporting. This was again
apparent in the 2016–17 reporting period.
We encourage the sector to focus more on the processes and quality of its
performance reporting and to shift its mindset when preparing annual
performance reports. Instead of being seen as a compliance document,
performance reports can serve a far greater purpose in communicating key
financial and non-financial results to water entities’ customers.
Internal controls
To the extent that we test water entities’ internal controls, we found them
adequate for ensuring reliable financial reporting. However, we found instances
where entities need to strengthen their key internal controls.
In particular, we identified weaknesses in two key areas in 2016–17:
information technology (IT) controls, which protect computer applications,
infrastructure and information assets from threats to security and access
the monitoring and maintenance of infrastructure assets, property, plant
and equipment records and data.
In relation to IT controls, we continue to observe weaknesses in key financial
and operational systems each year, depending on which systems we test. This
indicates that water entities are not taking the lessons learnt from audit issues
reported against particular key systems and applying them to other relevant
systems to minimise risks across the organisation.
As part of the financial audit process, we also monitored internal control
weaknesses identified in previous audits, to ensure entities are resolving them
promptly. Encouragingly, 77 per cent of prior-year high- and medium-risk
matters were resolved during 2016–17.
Post asset revaluation implementation
Each year, we select one internal control area and perform a more detailed
review of the controls and related operating environment. This year, we focused
on how well water entities input their asset revaluation results from the
2015−16 revaluation into their internal systems.
Comprehensive, accurate and up-to-date asset information is vital for effective
asset management, particularly in asset-intensive organisations such as water
entities.
Our assessment showed mixed results. Entities with better implementation
processes reported that improved quality of asset data allowed them to make
better asset-related decisions across the organisation. In contrast, entities that
were unable to update their asset systems with revaluation data in a timely
fashion were at an increased risk of making business decisions based on
inaccurate or unreliable data.
Victorian Auditor-General’s Report Results of 2016–17 Audits: Water Entities 9
Our review highlighted the importance of entities having a detailed plan in place
to guide their actions throughout an asset revaluation process. Those entities
with better implementation processes had a deeper understanding of their
asset data, which enabled them to provide quality data to the valuer, in a format
that could be incorporated into their existing asset systems.
Financial outcomes
The sector generated a combined net result before tax of $543.9 million in
2016–17, a decrease of $173.0 million from the year before. This was largely
due to a decline in revenue because of lower consumption—2016–17 was a
wetter year than 2015–16—and lower wholesaler revenue in the first year of
their new pricing structure.
The sector’s total asset base grew by $633.9 million to $46.2 billion, largely due
to funds spent on asset works, renewal and replacement. Liabilities grew by
$218.5 million to $21.4 billion, from increases in short-term payables and
borrowings.
We separately assessed the financial performance, position and risks to financial
sustainability of each cohort over the 2016–17 financial reporting period, given
each cohort’s results are affected by different circumstances.
We recommend that water entities:
1. further refine their financial reporting processes by developing a financial
statement preparation plan and preparing quality proforma financial
statements (see Section 2.1)
2. continue investing in streamlining their financial statements and better
customising their disclosures, including only using model financial
statements as a starting point for further streamlining and customisation
(see Section 2.1)
3. focus more on the processes and quality of performance reporting,
ensuring full compliance with Ministerial Reporting Direction 01
Performance Reporting and preparing proforma performance reports
prior to year end (see Section 2.2)
4. assess whether any findings related to IT control weaknesses in specific
systems reported by audit are relevant to other financial and operational
systems, to minimise risk across the organisation (see Section 3.1)
5. address issues raised in audit management letters on a timely basis so
that any weaknesses in their control environment are resolved promptly
(see Section 3.1)
6. perform a post-revaluation review exercise to identify areas for
improvement that could be carried to the next revaluation exercise or used
to help prepare for the Asset Management Framework requirements of the
Asset Management Framework, which supports the Standing Direction
Requirement 4.2.3 Asset management accountability of the Minister for
Finance in 2017–18 (see Section 3.3).
Recommendations
10 Results of 2016–17 Audits: Water Entities Victorian Auditor-General’s Report
We recommend that the Department of Environment, Land, Water and
Planning:
7. review the effectiveness of water entities’ performance reporting, focusing
on whether the performance reports are meeting the overall purpose of
Ministerial Reporting Direction 01 Performance Reporting, as initially
intended (see Section 2.2).
We have consulted with DELWP, the 19 water entities, ESC and the Victorian
Water Industry Association (VicWater), and we considered their views when
preparing this report. As required by section 16(3) of the Audit Act 1994, we
gave a draft copy of this report to those agencies and asked for their
submissions or comments. We also provided a copy of the report to the
Department of Premier and Cabinet.
The following is a summary of those responses. The full responses are included
in Appendix A.
DELWP provided a response for inclusion in this report, stating that it is
committed to conducting a comprehensive review of its performance reporting
framework. This review will look at the effectiveness and appropriateness of key
performance indicators (KPI) under the current Ministerial Reporting Direction
(MRD) 01 Performance Reporting.
DELWP also noted its plans to address specific recommendations through water
sector forums and VicWater.
Coliban Water provided a response for inclusion in the report, outlining its
remediation plans for the high-risk issues that we highlighted and its intention
to demonstrate that these issues have been addressed as part of the 2017–18
audit.
Submissions and comments

Victorian Auditor-General’s Report Results of 2016–17 Audits: Water Entities 11
Water entities provide a range of water services, including supplying water and
sewerage services. Entities may also manage bulk water storage and specific
recreational areas, such as caravan parks. Water entities are standalone
businesses responsible for their own management and performance.
Victoria’s water sector is made up of 19 water entities and one controlled entity.
Since the results of the controlled entity are consolidated into its parent entity,
we do not discuss this entity separately in our report. Appendix B includes a list
of all 20 entities.
In this report, we use the cohorts defined by DELWP and VicWater—
metropolitan, regional urban and rural—to report on the sector. Figure 1A
defines these cohorts.
Cohorts—water entities
Cohort Description
Metropolitan Consists of:
a wholesaler, which supplies retail water entities, controls headworks and major
sewerage treatment plants, and is responsible for drainage and waterways to the
Greater Melbourne area
three retail water entities, which operate the water distribution and sewerage
systems for the Melbourne metropolitan area, within a specified geographic
region, as well as operating a small number of treatment plants.
Regional urban Provide water supply and sewerage services to regional urban customers outside the metropolitan zone of Victoria. Two of these water entities also supply rural water services.
Rural Provide rural water services for irrigation, domestic and stock purposes. These services include water supply, drainage and salinity mitigation. Some also provide bulk water supply services to other water entities in regional Victoria.
VAGO, based on information provided by DELWP.
Audit context

12 Results of 2016–17 Audits: Water Entities Victorian Auditor-General’s Report
A constituted board governs each water entity, responsible for:
overseeing the entity’s strategic direction
setting objectives and performance targets
ensuring that the entity complies with legislation and government policy.
Figure 1B shows the areas serviced by Victoria’s metropolitan and urban
regional water entities and average litres consumed, per person, per day in each
specific service area. Areas serviced by the rural water entities can be found in
Appendix B.
Regions serviced by metropolitan and regional urban retailers, includes 2016–17 average litres consumed,
per person, per day
VAGO, based on information provided by DELWP.

Victorian Auditor-General’s Report Results of 2016–17 Audits: Water Entities 13
Metropolitan and regional urban retail services
Water entities manage, maintain and operate reservoirs and water storage
within their respective regions to provide water and sewerage services to
households, and commercial and industrial businesses.
In Victoria, most water is captured, protected and stored in catchment
reservoirs. Collected from various sources––dams, catchments and the
desalination plant––water then travels through drains and pipes to water
treatment plants. Here, it is treated and tested for quality before it is made
available for use.
Sewage flows down household and commercial drains to sewerage treatment
plants. It undergoes various treatment processes ensuring it can be either
recycled or returned to waterways.
Water entities invest significant effort and funds in maintaining, repairing and
renewing their assets to ensure availability of quality water and delivery of
sewerage services.
Figure 1C details the water cycle, highlighting the key inputs, assets and outputs.
Operator perspective—inputs, processes and outputs to the water cycle
VAGO.
What do water entities do?
Catchment—an area where water is collected by the natural landscape. In a catchment, rainwater run-off will eventually flow to a creek, river, dam, lake, ocean, or into a groundwater system.

14 Results of 2016–17 Audits: Water Entities Victorian Auditor-General’s Report
Rural services
Rural water entities own and maintain dam/reservoir infrastructure assets used
to store water on behalf of their customers—typically farmers, graziers and
growers.
Rural water customers:
hold water shares, which represent an ongoing entitlement to a share of
water available within a specific water region
order water from their relevant rural water entity, which is delivered via
pipelines and channels—the maximum annual amount of water available is
set by their water share.
Rural water entities do not provide sewerage-related services.
Legislative and regulatory framework
The board of each water entity reports to the Minister for Water through
DELWP. In turn, the minister reports to Parliament on the performance of each
water entity.
The Water Act 1989 is the central legislation for Victoria’s water industry. Its
objectives are to:
promote the orderly, equitable and efficient use of water resources
ensure that water resources are conserved and properly managed for
sustainable use for the benefit of all Victorians
maximise community involvement in making and implementing
arrangements for using, conserving and managing water resources.
The Financial Management Act 1994 (FMA) establishes a governance
framework mandating governance and accountability for the financial
management of organisations in the public sector. The FMA aims to:
improve financial administration of the public sector
make better provision for the accountability of the public sector
provide for annual reporting to the Parliament by departments and public
sector bodies.
In addition to the 19 water entities, Victoria has 10 catchment management
authorities (CMA), established under Victoria’s Catchment and Land Protection
Act 1994. CMAs are responsible for coordinated catchment management in
their region. The Water Act 1989 gives them powers to manage regional
waterways, floodplains, drainage and environmental water reserves. The
Auditor-General’s Report on the Annual Financial Report of the State of Victoria,
2016–17 includes the results for the audits of CMAs for the 2016–17 reporting
period.
Framework for water regulation
Victorian Auditor-General’s Report Results of 2016–17 Audits: Water Entities 15
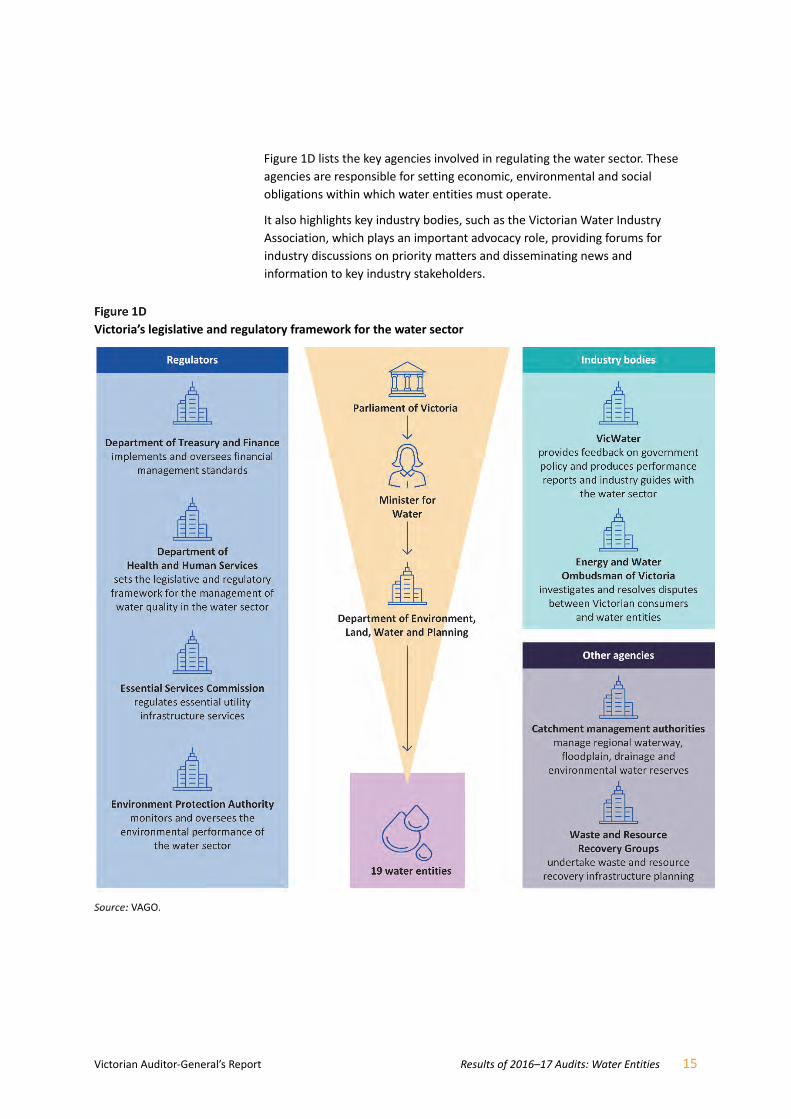
Figure 1D lists the key agencies involved in regulating the water sector. These
agencies are responsible for setting economic, environmental and social
obligations within which water entities must operate.
It also highlights key industry bodies, such as the Victorian Water Industry
Association, which plays an important advocacy role, providing forums for
industry discussions on priority matters and disseminating news and
information to key industry stakeholders.
Victoria’s legislative and regulatory framework for the water sector
VAGO.

16 Results of 2016–17 Audits: Water Entities Victorian Auditor-General’s Report
Water entities get most of their revenue from charges for water, sewerage and
other related activities, collected under the Water Act 1989 and approved
through the sector regulator, ESC.
Total revenue in 2016–17 for sector service and usage charges was $5.2 billion,
89.7 per cent of the total $5.8 billion revenue generated. Figure 1E shows a
breakdown of these regulated revenue streams.
Service and usage charges by water entities 2016–17
Melbourne Water, as the wholesaler of Melbourne’s water supply to the metropolitan retail water entities, is responsible for managing catchments, waterways and major drainage systems, treating water and transferring water to the metropolitan water retailers. The costs incurred by Melbourne Water for these activities are charged to the metropolitan water retailers by way of bulk water and sewerage charges.
VAGO.
ESC is responsible for regulating and approving the maximum prices each water
entity charges its customers for supplying water and providing sewerage and
other services. This is in accordance with the requirements of the Essential
Services Commission Act 2001, the Water Industry Act 1994, the Water Industry
Regulatory Order and the Commonwealth Water Charge Infrastructure Rules,
where applicable.
1,466.33 131.42
2016–17 Total revenue from
water, sewerage and other water‐related
charges
$5.2b
Water usage
$1 834 million
Metropolitan wholesaler—bulk water and sewerage
$1 332 million
Rural water
$173 millionSewerage
$1 466 million
Trade waste and recycled water
$131 million
Metropolitan wholesaler—waterways and drainage charge
$246 million
How water entities fund
their operations
Victorian Auditor-General’s Report Results of 2016–17 Audits: Water Entities 17
ESC has reviewed and approved prices for metropolitan and regional urban
businesses since 1 July 2005, and for rural businesses since 1 July 2006.
ESC’s approach to price reviews remained largely unchanged until
23 October 2014, when the Water Industry Regulatory Order 2014 (WIRO 2014)
was released in the Victoria Government Gazette, following approval from the
Governor in Council. The purpose of WIRO 2014 is to provide a framework for
economic regulation by ESC for services provided by the water industry. WIRO
2014 revoked the former WIRO 2012.
The revised order provides ESC with greater flexibility in how it delivers efficient
pricing and service outcomes for Victorian water and sewerage customers.
As a result, following extensive consultation with water entities and key
stakeholders, ESC made changes to its framework for water pricing and
approach to price reviews.
The new approach is designed to deliver better outcomes for Victorian water
customers, with incentives for water entities to put forward quality price
submissions that reflect their customers’ expectations and offer value for the
prices proposed.
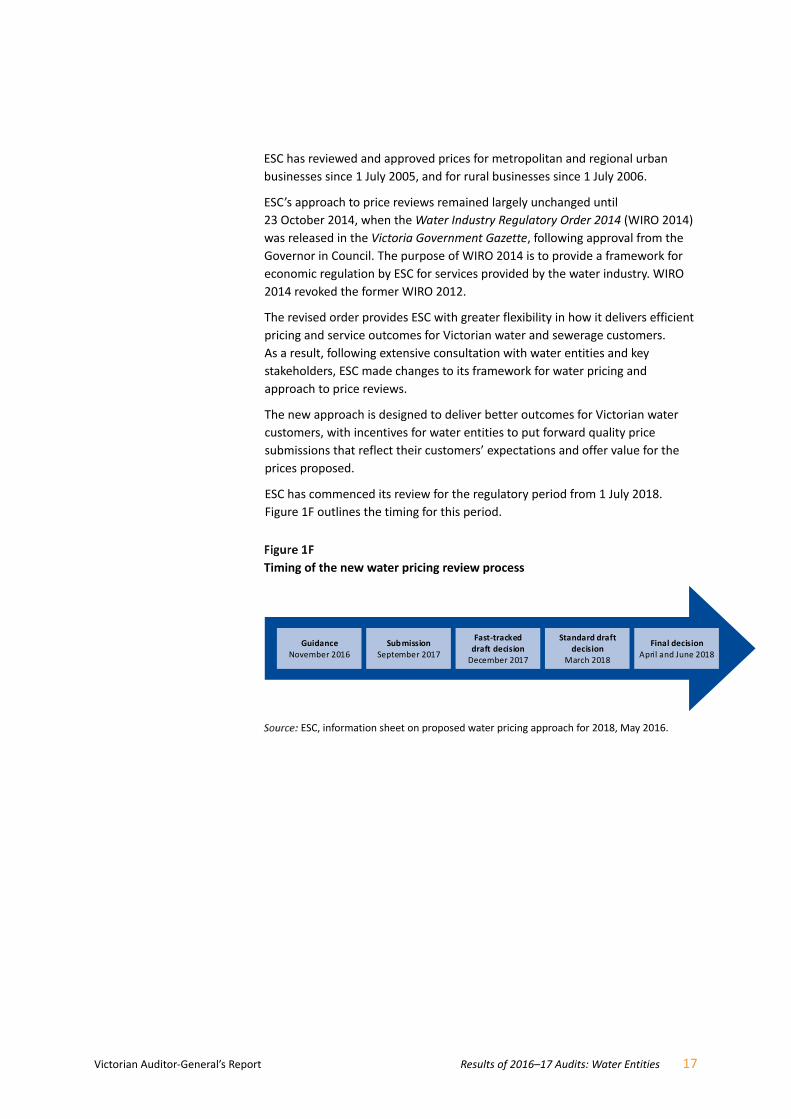
ESC has commenced its review for the regulatory period from 1 July 2018.
Figure 1F outlines the timing for this period.
Timing of the new water pricing review process
ESC, information sheet on proposed water pricing approach for 2018, May 2016.
Final decisionApril and June 2018
Standard draft decision
March 2018
Fast‐trackeddraft decision
December 2017
SubmissionSeptember 2017
GuidanceNovember 2016

18 Results of 2016–17 Audits: Water Entities Victorian Auditor-General’s Report
Figure 1G outlines the new approach for the 2018 price review.
New pricing approach
Step 1. Outcomes for customers
Water entity will engage with customers to understand what they value and establish a set of outcomes from this process.
Step 2. Expenditure and price proposal
Water entity will develop operating and capital expenditure forecasts to deliver the outcomes from Step 1 and proposed price and tariff structures
to recover required revenue from customer base.
Step 3. Price submission review
Water entity will rate its price submission based on performance, risk, engagement, management and outcomes. ESC will then assess the price submission.
Step 4. Revenue and prices
ESC confirms required revenue, price and tariff structures, and the financial viability of the water entity.
Step 5. Performance monitoring
Ongoing review and reporting of a water entity’s delivery against the outcomes—this includes ESC oversight.
Where necessary, ESC or the water entity may adjust revenue or prices based on performance.
VAGO, based on ESC, Water Pricing Framework and Approach, Implementing PREMO from 2018, October 2016.
In the first step, each water entity will engage with its customers and
community to inform the outcomes to be delivered in a pricing period.
In the second step, each water entity will develop an estimate of expenditure to
deliver the outcomes identified in step 1, and any other obligations imposed by
government and regulators. This results in the development of a price
submission, including proposed prices and tariff structures.
The third step involves a new approach to the assessment of price submissions
which influences the returns allowed in prices for each water entity. The return
on equity established at the start of a pricing period could vary for each
business, depending on the ‘ambition’ of its price submission.
Victorian Auditor-General’s Report Results of 2016–17 Audits: Water Entities 19
In its price submission, a water entity will self-rate the ‘ambition’ of its
submission against PREMO elements—Performance, Risk, Engagement,
Management and Outcomes. ESC will also rate the submission against PREMO
elements. This assessment process will inform the return on equity to be
reflected in revenue and prices, which forms the fourth step.
The final step is the ongoing review of outcomes delivered by water entities.
It is important to note that the water price reviews effective for 1 July 2018
exclude Melbourne Water and Goulburn-Murray Water, as these entities are on
a different price review cycle.
Government funding
In contrast to the other cohorts, the two rural water entities receive significant
government funding (both state and Commonwealth) for the delivery of key
modernisation projects, such as the $2 billion Connections Project currently
being delivered by Goulburn-Murray Water.
In this report, we detail the 2016–17 financial audit outcomes of Victoria’s
19 water entities. We identify and discuss the key matters arising from our
audits, and provide an analysis of information included in water entities’
financial and performance reports. Figure 1H outlines the structure of the
report.
Report structure
Part Description
Part 2—Results of audits Evaluates the audit opinion results for financial and performance report audits, and the timeliness, accuracy and quality of reporting
Part 3—Internal controls Assesses the strength of internal controls designed, implemented and maintained by the water entities
Part 4—Financial outcomes
Analyses the financial performance, position and sustainability of the water sector to enhance the accountability and transparency for transactions and events during the year
The financial audits included in this report were undertaken under section 15 of
the Audit Act 1994 and Australian Auditing Standards, and the audited entities
pay the cost of these audits. We used the results of these audits in preparing
this report. The cost of preparing this report was $185 000, which is funded by
Parliament.
Report structure

Victorian Auditor-General’s Report Results of 2016–17 Audits: Water Entities 21
Independent audit opinions add credibility to financial reports by providing
reasonable assurance that the information reported is reliable and accurate.
A clear audit opinion confirms that the financial report presents fairly the
transactions and balances for the reporting period, in keeping with the
requirements of relevant Australian Accounting Standards and applicable
legislation. We carried out our financial audits of the water entities in
accordance with the Australian Auditing Standards.
We issued clear audit opinions for the 19 water entities for the financial year
ended 30 June 2017, consistent with our 2015–16 results.
Quality of financial reporting
Entities that adopt effective financial reporting practices throughout the year
should be able to produce accurate and reliable financial reports in a timely
manner.
The timeliness and accuracy of an entity’s financial reports are important
attributes. Entities also need to have well-planned and managed processes
to enable them to prepare cost-effective and efficient financial reporting.
Overall, the water entities used good-quality processes to prepare their financial
reports, and they presented timely and accurate draft reports for audit.
Timeliness
Timely financial reporting is a critical element of entities’ accountability to
stakeholders and enables informed decision-making. The later reports are
produced and published after year end, the less useful they are.
The FMA requires entities to finalise their financial reports within 12 weeks of
the end of the financial year. Appendix C sets out the dates on which entities’
2016–17 financial reports were certified and auditor’s reports were issued.
Results of audits
Financial report audit
opinions
22 Results of 2016–17 Audits: Water Entities Victorian Auditor-General’s Report
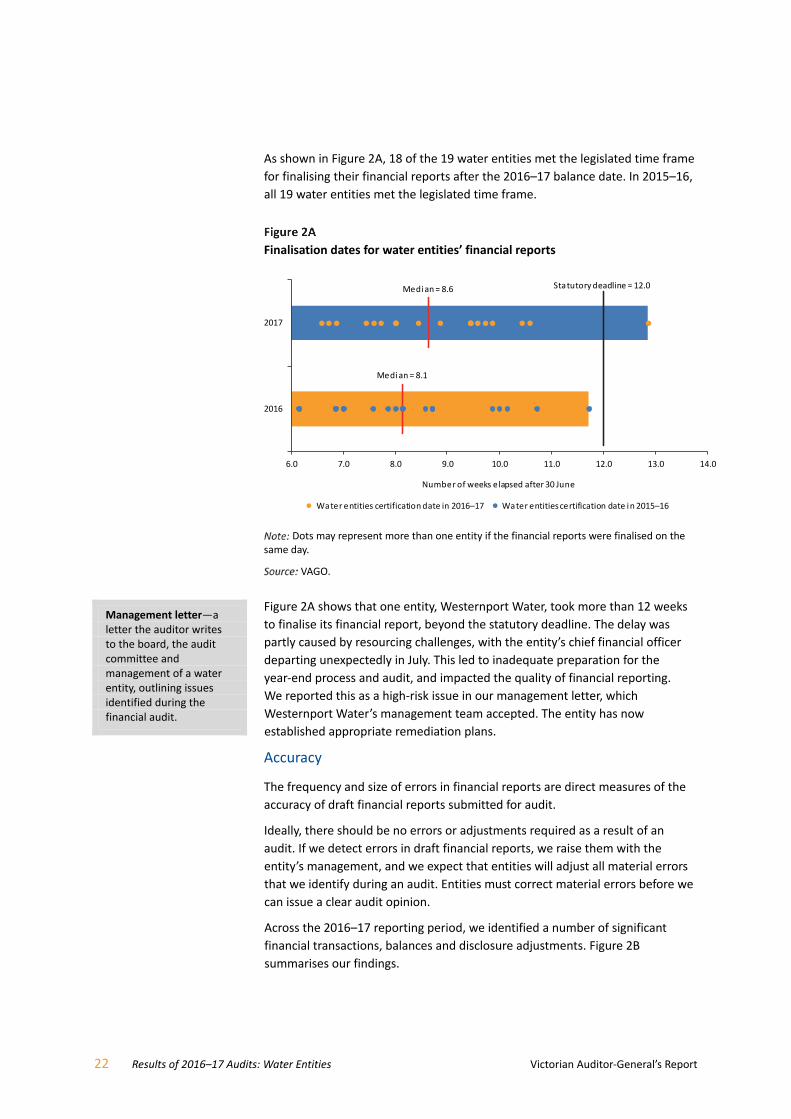
As shown in Figure 2A, 18 of the 19 water entities met the legislated time frame
for finalising their financial reports after the 2016–17 balance date. In 2015–16,
all 19 water entities met the legislated time frame.
Finalisation dates for water entities’ financial reports
Dots may represent more than one entity if the financial reports were finalised on the same day.
VAGO.
Figure 2A shows that one entity, Westernport Water, took more than 12 weeks
to finalise its financial report, beyond the statutory deadline. The delay was
partly caused by resourcing challenges, with the entity’s chief financial officer
departing unexpectedly in July. This led to inadequate preparation for the
year-end process and audit, and impacted the quality of financial reporting.
We reported this as a high-risk issue in our management letter, which
Westernport Water’s management team accepted. The entity has now
established appropriate remediation plans.
Accuracy
The frequency and size of errors in financial reports are direct measures of the
accuracy of draft financial reports submitted for audit.
Ideally, there should be no errors or adjustments required as a result of an
audit. If we detect errors in draft financial reports, we raise them with the
entity’s management, and we expect that entities will adjust all material errors
that we identify during an audit. Entities must correct material errors before we
can issue a clear audit opinion.
Across the 2016–17 reporting period, we identified a number of significant
financial transactions, balances and disclosure adjustments. Figure 2B
summarises our findings.
6.0 7.0 8.0 9.0 10.0 11.0 12.0 13.0 14.0
2016
2017
Number of weeks elapsed after 30 June
● Water entities certification date in 2016–17 ● Water entities certification date in 2015–16
Statutory deadline = 12.0Median = 8.6
Median = 8.1
Management letter—a letter the auditor writes to the board, the audit committee and management of a water entity, outlining issues identified during the financial audit.

Victorian Auditor-General’s Report Results of 2016–17 Audits: Water Entities 23
Significant dollar and disclosure adjustments identified across the 2016–17
reporting period
Dollar adjustments
Significant dollar adjustments that we identified resulted in:
a $51.8 million understatement of total assets, mainly caused by adjustments to the valuation of infrastructure assets under a discounted cashflow model in 2016–17 and depreciation impacts associated with the 2015–16 formal revaluation of non-current physical assets
a $13.7 million overstatement of total assets, mainly driven by overestimation of accrued revenue
an $11.6 million overstatement to total revenue, relating to water and sewerage revenue in connection with the accrued revenue adjustment above.
Disclosure adjustments
Common financial statement disclosure adjustments we identified related to:
application of new accounting standards and Financial Reporting Directions (FRD), in particular AASB 124 Related Parties Disclosures and FRD 21C Disclosures of responsible persons and executive officers in the financial report, over:
determination and disclosure of key management
personnel, including the responsible Minister
accuracy in calculating the remuneration of
responsible persons and key management
personnel
completeness of related-party disclosures,
including government entity related-party
transactions
formula errors when transposing data from worksheets into the financial report, most noticeably with commitment and asset movement reconciliation notes
fair value disclosure of non-current physical assets, where enhancements were required to commentary associated with valuation techniques and significant unobservable inputs
customising accounting policy disclosures ensuring relevance to the individual water entity’s transactions and balances
customising financial instrument disclosures ensuring relevance to the individual water entity.
VAGO.

24 Results of 2016–17 Audits: Water Entities Victorian Auditor-General’s Report
We raised three high-risk issues in our management letters surrounding the
accuracy of financial reporting in 2016–17:
Gippsland Water—delayed resolution of a 2012–13 prior-period issue
relating to untimely capitalisation of assets, which increased the risk of
material misstatement in depreciation and asset classifications
Grampians Wimmera Mallee Water (GWMWater)—omission of a Committee
of Management controlled by the entity that needed to be consolidated as
per AASB 10 Consolidated Financial Statements, however information was
not available to adequately value assets and liabilities to allow for adequate
consolidation
Westernport Water—failure to adequately prepare for changes to AASB 124
Related Parties Disclosures.
Management accepted our recommendations and established appropriate
remediation plans.
Quality of the financial report preparation process
We assessed the quality of financial reporting processes against better practice
criteria, detailed in Appendix F. Overall, the financial report preparation
processes of most of the water entities were sound, as summarised in Figure 2C.
Assessment of financial report preparation processes against better practice criteria
Preparation plan
Proforma financial statements
Monthly financial reporting
over 65% non-existent or developing
over 50% non-existent or developing
over 85% developed or better practice
Quality control and assurance procedures
Supporting documentation
Analytical reviews
over 70% developed
over 70% developed
over 85% developing or developed
Appendix F2 includes a detailed breakdown of the sector results of financial report preparation processes against better practice elements.
VAGO.

Victorian Auditor-General’s Report Results of 2016–17 Audits: Water Entities 25
As shown in Figure 2C, two areas that entities need to address are:
the preparation and quality of proforma financial statements
the development of financial report preparation plans, including the entity’s
approach to streamlining the financial report and materiality determination.
The quality of the financial report preparation process was a particular concern
at Westernport Water and Lower Murray Water, leading to significant delays
and extensive reworking over key financial reporting and accounting standard
changes, which also influenced their ability to achieve internal and external
deadlines. Staff resourcing challenges around balance date further compounded
these issues.
Streamlining financial reports
The International Accounting Standards Board (IASB) identified a ‘disclosure
problem’ in the information that entities disclose in its financial reports. IASB
observed three main disclosure concerns:
not enough relevant information
irrelevant information
ineffective communication of the information provided.
IASB is focusing on projects that will improve communication in financial
reporting—a strategic theme of IASB’s work plans for 2017–21.
While IASB develop and finalise their response to disclosure concerns, the
accounting profession has begun to address them by streamlining their financial
reports.
The objectives of streamlining financial reports are to:
maintain compliance with accounting standards and other relevant
requirements
present only relevant information by removing disclosures that are
immaterial and including only entity-specific commentary
communicate financial information in a manner that aligns with the
objectives, service delivery, financial performance and financial position
of the entity
enhance the readability of the financial report and making it more
user-friendly.
VAGO, the Department of Treasury and Finance and DELWP strongly encouraged
water entities to streamline their financial reports, although it is not a
mandatory accounting requirement.
As a result, the water sector worked proactively with its industry body,
VicWater, to develop a streamlined financial statement model to assist water
entities to prepare their financial reports for the 2016–17 reporting period. We
commend the sector for its commitment to this streamlining process.
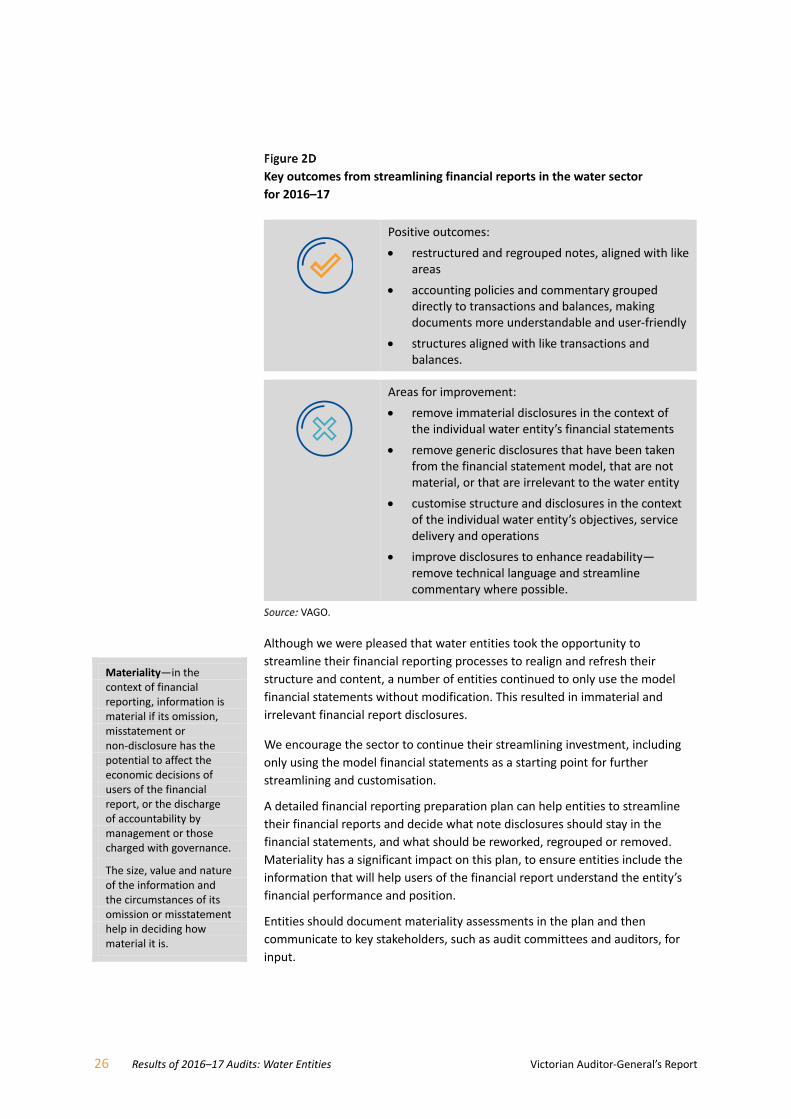
In the first year of this approach, we observed positive results and further areas
for improvement—see Figure 2D.
Proforma financial statements—a set of financial statements prepared by management prior to balance date to assist with planning the structure and contents of the actual financial statements.
26 Results of 2016–17 Audits: Water Entities Victorian Auditor-General’s Report
Key outcomes from streamlining financial reports in the water sector
for 2016–17
Positive outcomes:
restructured and regrouped notes, aligned with like areas
accounting policies and commentary grouped directly to transactions and balances, making documents more understandable and user-friendly
structures aligned with like transactions and balances.
Areas for improvement:
remove immaterial disclosures in the context of the individual water entity’s financial statements
remove generic disclosures that have been taken from the financial statement model, that are not material, or that are irrelevant to the water entity
customise structure and disclosures in the context of the individual water entity’s objectives, service delivery and operations
improve disclosures to enhance readability—remove technical language and streamline commentary where possible.
VAGO.
Although we were pleased that water entities took the opportunity to
streamline their financial reporting processes to realign and refresh their
structure and content, a number of entities continued to only use the model
financial statements without modification. This resulted in immaterial and
irrelevant financial report disclosures.
We encourage the sector to continue their streamlining investment, including
only using the model financial statements as a starting point for further
streamlining and customisation.
A detailed financial reporting preparation plan can help entities to streamline
their financial reports and decide what note disclosures should stay in the
financial statements, and what should be reworked, regrouped or removed.
Materiality has a significant impact on this plan, to ensure entities include the
information that will help users of the financial report understand the entity’s
financial performance and position.
Entities should document materiality assessments in the plan and then
communicate to key stakeholders, such as audit committees and auditors, for
input.
Materiality—in the context of financial reporting, information is material if its omission, misstatement or non-disclosure has the potential to affect the economic decisions of users of the financial report, or the discharge of accountability by management or those charged with governance.
The size, value and nature of the information and the circumstances of its omission or misstatement help in deciding how material it is.
Victorian Auditor-General’s Report Results of 2016–17 Audits: Water Entities 27
Further, by preparing early proforma financial statements, water entities can
provide the proposed document to key stakeholders such as boards, audit
committees and audit well before the balance date for review and input. This
helps avoid inefficiencies and reworking when it comes to the preparation of
draft financial reports closer to or after balance date.
FRD 27C Presentation and Reporting of Performance Information requires all
water entities to annually prepare a report on their performance and have it
audited.
The Minister for Water updated MRD 01 Performance Reporting on 11 April
2017 under section 51 of the FMA. This update supports the requirement under
FRD 27C and specifies the format, content and KPIs that water entities must
include in their performance reports.
DELWP require water entities to reflect the agreed KPIs as per MRD 01 in their
corporate plans, which are submitted annually for review and noting. The
corporate plans must contain all KPIs, along with targets for all indicators.
Appendix F provides further detail on the financial and non-financial indicators
for each entity type.
We issued clear audit opinions on all 19 performance reports, consistent with
the 2015–16 reporting period. A clear audit opinion confirms that the actual
results reported on the performance report were fairly presented and complied
with MRD 01.
We do not form an opinion on the relevance or appropriateness of the reported
KPIs, as these are set by the minister. We carried out these audits in accordance
with the Australian Auditing Standards.
Quality and timeliness of performance reporting
Generally, water entities prepare and finalise their performance reports
concurrently with their financial reports. Our audit of the 2016–17 performance
reports resulted in a number of audit adjustments. Common themes included:
poor quality explanatory notes to support significant variances, providing
limited information or purpose to the reader
compliance issues with explanatory notes, where detailing steps taken or
plans to reduce unfavourable variances in the future were not initially
disclosed in performance reports, as required by MRD 01
calculation errors in deriving variance figures, as required by MRD 01.
Our past reports have highlighted that the water sector’s performance reporting
processes are not as mature as those used for financial reporting. This was again
apparent for the 2016–17 reporting period, where entities prioritise financial
reporting over performance reporting.
Performance report audit
opinions

28 Results of 2016–17 Audits: Water Entities Victorian Auditor-General’s Report
Water entities need to focus more on the processes for performance
reporting and its quality, ensuring their performance reports comply with
MRD 01. Preparing proforma performance reports, including draft variance
explanations, prior to year end can help entities to reduce the number of
disclosure deficiencies in their draft performance reports and improve the
efficiency of the year-end reporting process.
We also encourage the sector to shift its mindset when preparing annual
performance reports—rather than being seen as a compliance document,
they can help to communicate key financial and non-financial results to water
entities’ customers.
In light of both the quality issues we identified with entities’ performance
reporting, and the sector having applied a consistent performance reporting
approach for four years, we recommend that DELWP review the effectiveness
of water entities’ performance reporting. This review should consider whether
the process and final performance reporting outputs are meeting the overall
purpose of MRD 01, as initially intended.
Victorian Auditor-General’s Report Results of 2016–17 Audits: Water Entities 29
Effective internal controls help entities meet their objectives reliably and
cost-effectively. Entities require strong internal controls to deliver reliable,
accurate and timely external and internal financial reports.
In our annual financial audits, we consider the internal controls relevant to
financial reporting and assess whether entities have managed the risk that their
financial reports may not be complete and accurate. Poor internal controls make
it more difficult for entities to comply with relevant legislation and increase the
risk of fraud and error.
Water entity boards are responsible for establishing and maintaining internal
controls that help to:
prepare and maintain accurate financial records
report promptly and reliably, externally and internally
appropriately safeguard assets
prevent and detect errors and other irregularities.
The Standing Directions of the Minister for Finance require each entity’s
management to build effective internal control structures.
In this section, we discuss:
internal control weaknesses common with the 19 water entities in 2016–17
the status of control weaknesses identified in prior years’ audits.
We also discuss results of our assessment on how well entities input their asset
revaluation results from the 2015–16 asset revaluation into their internal
systems.
As part of our audit, we assess the design and implementation of water entities’
controls and, where we identify controls that we intend to rely on, we test how
effectively these controls are operating. If we assess an entity’s internal controls
as not being well designed, not operating as intended or missing controls that
should be in place, the Australian Auditing Standards require us to communicate
those deficiencies to the entity’s management and audit committee.
Internal controls
Context
Assessment of internal controls

30 Results of 2016–17 Audits: Water Entities Victorian Auditor-General’s Report
To the extent that we test water entities’ internal controls, we found them
adequate for ensuring reliable financial reporting. However, we found instances
where entities need to strengthen their key internal controls.
During our 2016–17 audits, we identified 83 internal control weaknesses
across the 19 water entities. Figure 3A shows the number of issues identified
by risk rating, excluding 43 low-risk issues and four business improvement
opportunities that we reported directly to the entity. These are normally minor
control weaknesses or opportunities to improve existing processes or internal
controls. See Appendix D for definitions of our risk ratings.
Reported internal control weaknesses by area and risk rating
Risk rating
Area of issue High Medium Total
IT controls 9 15 24
Infrastructure assets, property, plant and equipment
2 1 3
Expenses and payables – 3 3
Revenue and receivables – 2 2
Employee benefits – 2 2
Other – 2 2
Total 11 25 36
VAGO.
Common high- and medium-risk issues
Across our 2016–17 audits, we identified several common high- and
medium-risk control weaknesses that require improvement:
IT controls, which are needed to protect computer applications,
infrastructure and information assets from threats to security and access
the monitoring and maintenance of infrastructure assets, property, plant
and equipment records and data.
Information technology
IT controls protect computer applications, infrastructure and information assets
from a wide range of security and access threats. They also promote business
continuity, minimise business risk, reduce the risk of fraud and error, and help
meet business objectives.
The water sector relies on IT in its operations and financial management
processes. IT systems are regularly upgraded and replaced across the sector. The
need to upgrade and maintain existing systems, and the vigilance needed from
increasing external IT security threats, means the sector needs to maintain a
strong focus on this part of the business.
Victorian Auditor-General’s Report Results of 2016–17 Audits: Water Entities 31
Consistent with our prior-year findings, we have again identified issues related
to user access management controls, patch management, and periodic review
and testing of IT disaster recovery plans (DRP).
Nine of the high-risk issues we identified in this area relate to three water
entities:
Weak user access management controls for both the finance and revenue
systems were identified at Coliban Water and Melbourne Water, where
several accounts held super-user access. This level of access was not
required, and the entities had not performed periodic user access reviews in
line with internal procedure documents for the operational system during
2016–17.
A number of cumulative patches had not been applied to either revenue,
finance and/or operating systems at Coliban Water and Yarra Valley Water.
The entities had not conducted, documented or formally approved an
assessment of the decision to not implement these patches. Further, patches
were not applied in a timely manner to servers for operating and finance
systems and the domain controller of Melbourne Water.
IT DRPs were outdated at Coliban Water and Melbourne Water. We found
shortfalls where the DRPs were not commensurate with the current system
environment or lacked specific, detailed end-to-end processes. The entities
had not performed required annual disaster recovery testing.
Weak change management controls were in place at Coliban Water—we
found numerous instances where changes to the finance and revenue
systems were not actioned through the internal change management system
and no evidence of testing was available.
Password management controls were not in line with policy for both the
finance and revenue systems at Coliban Water.
We reported these high-risk issues and they were accepted by the entities’
management. The entities have established appropriate remediation plans.
We continue to identify these significant IT issues each year—however, they
relate to varying key financial and operational systems within the water entities,
depending on which systems we actually test. For example, in one audit cycle,
we may raise issues relating to untimely patches or inappropriate user access
relating to a finance system and, in a subsequent cycle, we may test controls
over an operational system, such as a billings system, where patching and
unauthorised access issues are again identified for that specific system.
This indicates that water entity management teams are not taking the lessons
learnt from audit issues reported against particular key systems and applying
them to other relevant systems to minimise risks across the organisation.
Patch—an additional piece of software designed to fix new or emerging security vulnerabilities or operational issues. Periodic patching reduces the risk of security vulnerabilities in systems and enhances the overall security of the IT infrastructure.
User access management controls—can help ensure systems are appropriately secured to prevent unauthorised access, disclosure and loss of data. Inappropriate and excessive user access rights assigned to systems may result in unauthorised access to data and programs, leading to potential errors, financial fraud and reputational loss.
IT disaster recovery plan (DRP)—a documented process or set of procedures to assist in the recovery of a water entity’s IT infrastructure in the event of a disaster. Periodic review and update of the DRP is critical to ensuring it can be used to adequately recover critical systems within required business timeframes.
32 Results of 2016–17 Audits: Water Entities Victorian Auditor-General’s Report
Monitoring, maintenance and accounting for infrastructure assets, property, plant and equipment
In 2016–17, the 19 water entities controlled more than $44.2 billion of physical
assets. Entities need to appropriately record and maintain these assets, and
monitor their condition and use, so that decisions can be made about whether
they are appropriately valued and when they need to be replaced. Inadequate
recording and monitoring of assets can lead to poor asset management or may
trigger material misstatements in financial reports.
We found several common issues:
poor records management over asset data
untimely capitalisation of work in progress and developer-contributed assets
inappropriate capitalisation of labour costs
failure to upload asset valuation data into the fixed-asset ledger following
the asset valuation in 2015–16.
The high-risk issues we identified in this area related to two water entities:
At Goulburn-Murray Water, poor project management and lack of
supporting documentation led to a backlog of decommissioned assets during
the 2016–17 reporting period and contributed to a further $16.8 million
impairment of assets.
At Gippsland Water, asset valuation results from the 2015–16 scheduled
valuation were not processed in the fixed-asset ledger until April 2017. As
a result of this delay, the fixed asset module for the 2016–17 financial year
was not activated until April 2017, impacting asset accounting across the
reporting period.
Status of matters raised in previous audits
As part of the financial audit process, we monitor internal control weaknesses
identified in previous audits to ensure that entities resolve them promptly. We
provide information to management and their respective audit committees
about the status of these issues.
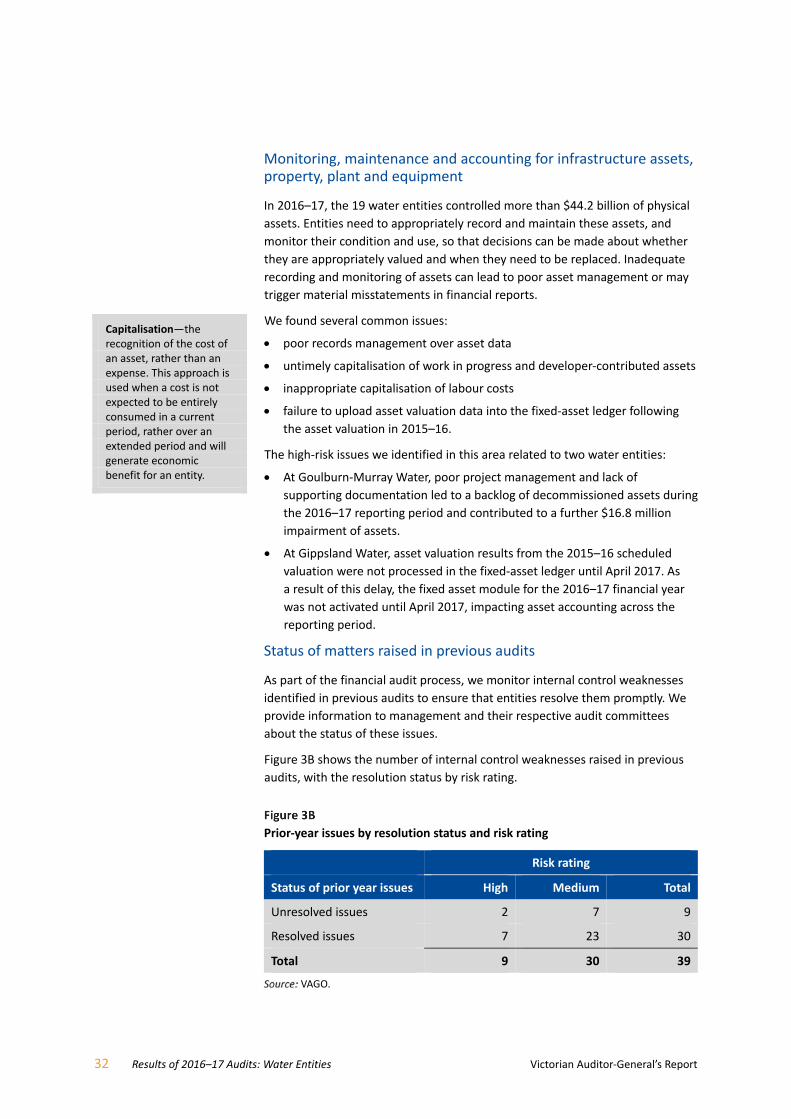
Figure 3B shows the number of internal control weaknesses raised in previous
audits, with the resolution status by risk rating.
Prior‐year issues by resolution status and risk rating
Risk rating
Status of prior year issues High Medium Total
Unresolved issues 2 7 9
Resolved issues 7 23 30
Total 9 30 39
VAGO.
Capitalisation—the recognition of the cost of an asset, rather than an expense. This approach is used when a cost is not expected to be entirely consumed in a current period, rather over an extended period and will generate economic benefit for an entity.
Victorian Auditor-General’s Report Results of 2016–17 Audits: Water Entities 33
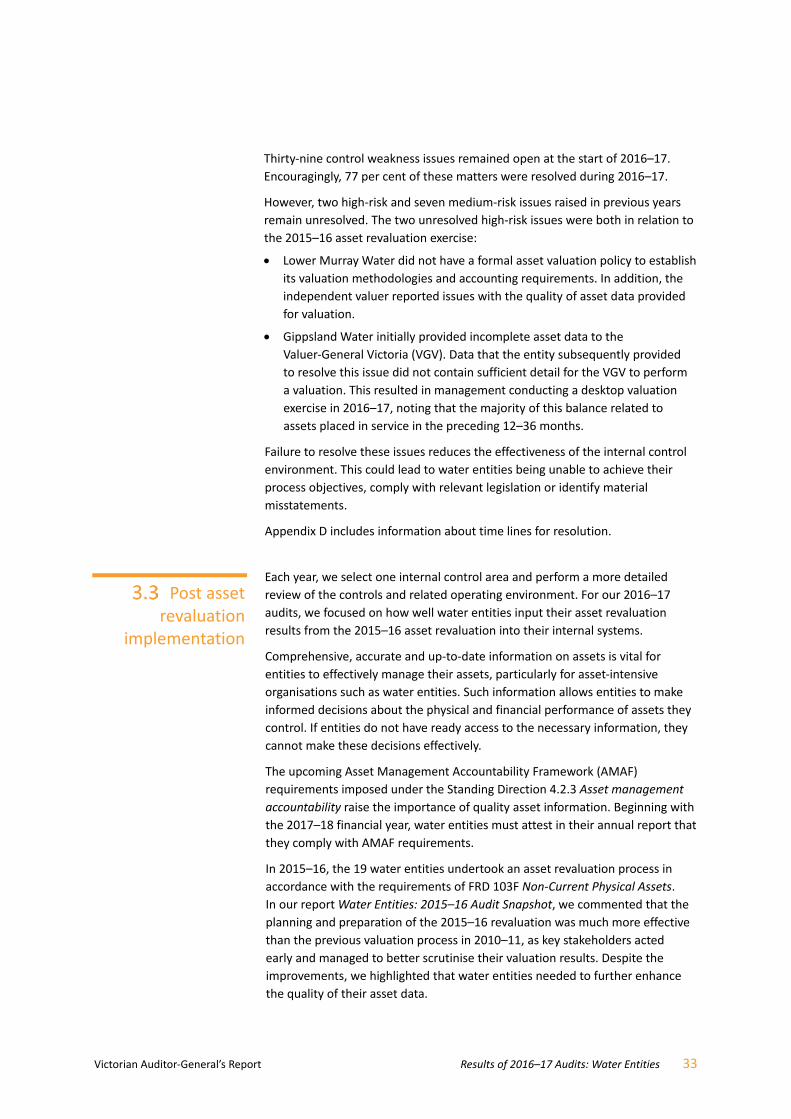
Thirty-nine control weakness issues remained open at the start of 2016–17.
Encouragingly, 77 per cent of these matters were resolved during 2016–17.
However, two high-risk and seven medium-risk issues raised in previous years
remain unresolved. The two unresolved high-risk issues were both in relation to
the 2015–16 asset revaluation exercise:
Lower Murray Water did not have a formal asset valuation policy to establish
its valuation methodologies and accounting requirements. In addition, the
independent valuer reported issues with the quality of asset data provided
for valuation.
Gippsland Water initially provided incomplete asset data to the
Valuer-General Victoria (VGV). Data that the entity subsequently provided
to resolve this issue did not contain sufficient detail for the VGV to perform
a valuation. This resulted in management conducting a desktop valuation
exercise in 2016–17, noting that the majority of this balance related to
assets placed in service in the preceding 12–36 months.
Failure to resolve these issues reduces the effectiveness of the internal control
environment. This could lead to water entities being unable to achieve their
process objectives, comply with relevant legislation or identify material
misstatements.
Appendix D includes information about time lines for resolution.
Each year, we select one internal control area and perform a more detailed
review of the controls and related operating environment. For our 2016–17
audits, we focused on how well water entities input their asset revaluation
results from the 2015–16 asset revaluation into their internal systems.
Comprehensive, accurate and up-to-date information on assets is vital for
entities to effectively manage their assets, particularly for asset-intensive
organisations such as water entities. Such information allows entities to make
informed decisions about the physical and financial performance of assets they
control. If entities do not have ready access to the necessary information, they
cannot make these decisions effectively.
The upcoming Asset Management Accountability Framework (AMAF)
requirements imposed under the Standing Direction 4.2.3 Asset management
accountability raise the importance of quality asset information. Beginning with
the 2017–18 financial year, water entities must attest in their annual report that
they comply with AMAF requirements.
In 2015–16, the 19 water entities undertook an asset revaluation process in
accordance with the requirements of FRD 103F Non-Current Physical Assets.
In our report Water Entities: 2015–16 Audit Snapshot, we commented that the
planning and preparation of the 2015–16 revaluation was much more effective
than the previous valuation process in 2010–11, as key stakeholders acted
early and managed to better scrutinise their valuation results. Despite the
improvements, we highlighted that water entities needed to further enhance
the quality of their asset data.
Post asset revaluation
implementation

34 Results of 2016–17 Audits: Water Entities Victorian Auditor-General’s Report
For most entities last year, the results of the 2015–16 asset revaluation were
processed directly to the balance sheet and not reflected in entities’ supporting
systems. The tight timing of the revaluation process and the statutory financial
reporting deadlines did not allow for a direct upload of the revaluation results.
We expected water entities to have uploaded the valuation data to supporting
systems early in the 2016–17 year. Revaluation planning processes should have
included a post revaluation result phase, to implement the revaluation results
into key systems.
Information management and record keeping requirements
The AMAF, which supports Standing Direction 4.2.3 Asset management
accountability, addresses the importance of information management and
record keeping over assets. To meet operational needs and to satisfy relevant
accounting standards and disclosure requirements, managing directors of water
entities must establish appropriate record keeping processes.
Assessment of the post asset revaluation implementation
Figure 3C shows our approach for reviewing the post asset revaluation
implementation into asset accounting systems.
Our approach to reviewing post asset revaluation implementation into asset accounting systems
VAGO.
Victorian Auditor‐General’s Report Results of 2016–17 Audits: Water Entities 35
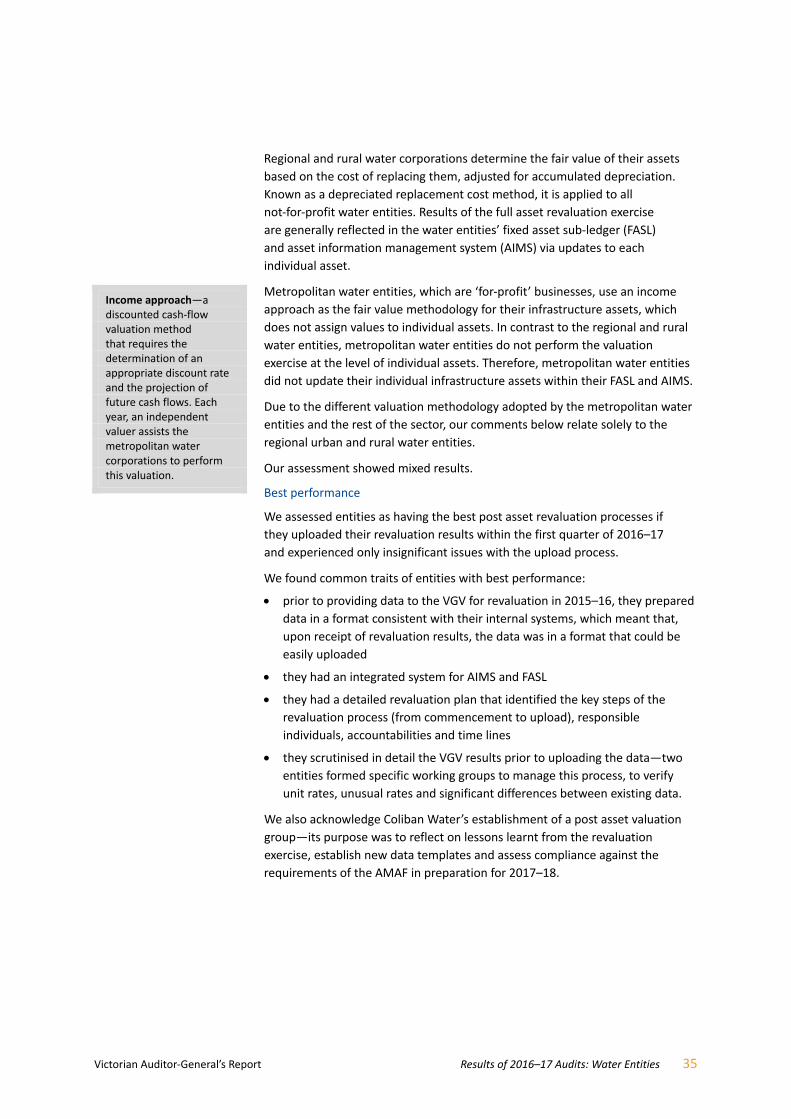
Regional and rural water corporations determine the fair value of their assets
based on the cost of replacing them, adjusted for accumulated depreciation.
Known as a depreciated replacement cost method, it is applied to all
not‐for‐profit water entities. Results of the full asset revaluation exercise
are generally reflected in the water entities’ fixed asset sub‐ledger (FASL)
and asset information management system (AIMS) via updates to each
individual asset.
Metropolitan water entities, which are ‘for‐profit’ businesses, use an income
approach as the fair value methodology for their infrastructure assets, which
does not assign values to individual assets. In contrast to the regional and rural
water entities, metropolitan water entities do not perform the valuation
exercise at the level of individual assets. Therefore, metropolitan water entities
did not update their individual infrastructure assets within their FASL and AIMS.
Due to the different valuation methodology adopted by the metropolitan water
entities and the rest of the sector, our comments below relate solely to the
regional urban and rural water entities.
Our assessment showed mixed results.
Best performance
We assessed entities as having the best post asset revaluation processes if
they uploaded their revaluation results within the first quarter of 2016–17
and experienced only insignificant issues with the upload process.
We found common traits of entities with best performance:
prior to providing data to the VGV for revaluation in 2015–16, they prepared
data in a format consistent with their internal systems, which meant that,
upon receipt of revaluation results, the data was in a format that could be
easily uploaded
they had an integrated system for AIMS and FASL
they had a detailed revaluation plan that identified the key steps of the
revaluation process (from commencement to upload), responsible
individuals, accountabilities and time lines
they scrutinised in detail the VGV results prior to uploading the data—two
entities formed specific working groups to manage this process, to verify
unit rates, unusual rates and significant differences between existing data.
We also acknowledge Coliban Water’s establishment of a post asset valuation
group—its purpose was to reflect on lessons learnt from the revaluation
exercise, establish new data templates and assess compliance against the
requirements of the AMAF in preparation for 2017–18.
Income approach—a discounted cash‐flow valuation method that requires the determination of an appropriate discount rate and the projection of future cash flows. Each year, an independent valuer assists the metropolitan water corporations to perform this valuation.
36 Results of 2016–17 Audits: Water Entities Victorian Auditor-General’s Report
Better performance
Compared to the best performing entities, this group generally:
had no—or a less detailed—revaluation plan in place
did not have integrated systems for AIMS and FASL
experienced some data mismatches between the AIMS and FASL
provided incomplete or inaccurate data to the VGV for valuation
provided data to the VGV that was not in a suitable format to be uploaded
into their FASL—as a result, revaluation results returned from the VGV
required further manipulation or formatting before they could be uploaded.
Basic performance
These entities experienced significant delays or were yet to upload valuation
results to their FASL and AIMS by 30 June 2017. They also encountered
significant issues which not only impacted the timing of implementation,
but also indicated poor-quality asset data and highlighted a general lack of
preparedness for the overall revaluation exercise. These entities generally:
lacked a detailed revaluation plan
had resourcing constraints
did not perform reconciliations between the AIMS and FASL
experienced significant data mismatches between the AIMS and FASL, which
were only identified toward the end of the revaluation process—for
example, once the VGV issued the revaluation results to the water entity
encountered errors with the initial asset data provided to the VGV for
valuation
failed to consider the complexities and resources required to perform the
data upload into the AIMS and FASL.
The delays and issues with the upload of asset data had a number of
consequences:
manual maintenance of fixed assets transactions and balances occurred
outside of the FASL across the 2016–17 reporting period
controls that would have normally existed, such as reconciliation of the FASL
to the general ledger, did not exist, increasing the risk that asset data was
not complete and accurate
project managers lacked visibility of the actual status of work in progress
depreciation impact of asset additions, disposals and write-offs for the year
was required to be manually calculated
lack of up-to-date asset information resulted in suboptimal reporting to
those charged with governance.
Victorian Auditor-General’s Report Results of 2016–17 Audits: Water Entities 37
Benefits
The best-performing entities reported that the improved quality of their asset
data allowed them to make better asset-related decisions across the business.
Opportunities included:
improved condition assessments, resulting in more accurate asset life-cycle
planning and costing
forming a post-revaluation review group to reflect on lessons learnt and to
assist with preparing for the AMAF requirements
increased reliability of asset data used across the overall business, including
by engineers
having an extremely detailed understanding of their asset base and reliable
data to allow for a full revaluation exercise to be conducted in-house on an
annual basis
enhanced costing of future capital projects.
In contrast, entities that were unable to update their asset systems with
revaluation data in a timely fashion are at an increased risk that business
decisions are based upon inaccurate or unreliable data.
Our review highlights the importance of having a detailed plan in place to guide
the asset revaluation process. Entities with better performing implementation
processes had a deeper understanding of their asset data which enabled them
to provide quality data to the valuer, in a format that could be readily
incorporated into their existing systems.
However, we noted that the majority of entities are yet to perform a formal
post revaluation review exercise, to consider lessons learnt and identify areas
for improvement that could be carried for the next revaluation exercise or to
assist in preparing for AMAF requirements in 2017–18.

Victorian Auditor-General’s Report Results of 2016–17 Audits: Water Entities 39
We consider an entity to be financially sustainable if it can maintain operations
over the long term based on existing revenue and expenditure policies. It must
also be able to absorb short-term fluctuations in income and expenditure from
reasonably foreseeable internal and external factors.
We separately assess the financial performance and position of each cohort
over the 2016–17 financial reporting period, because their results are affected
by varying circumstances.
We analyse financial data for the past five years, and consider whether water
entities generate enough surpluses from operations to provide services,
maintain or renew assets and repay debt. Their ability to do so is subject to
the regulatory environment in which they operate and their ability to minimise
costs and maximise revenue. We also consider forecast data, where appropriate,
for the next five years based on data obtained from the water entities’ most
recent 2017–18 corporate plans.
Financial outcomes
40 Results of 2016–17 Audits: Water Entities Victorian Auditor-General’s Report
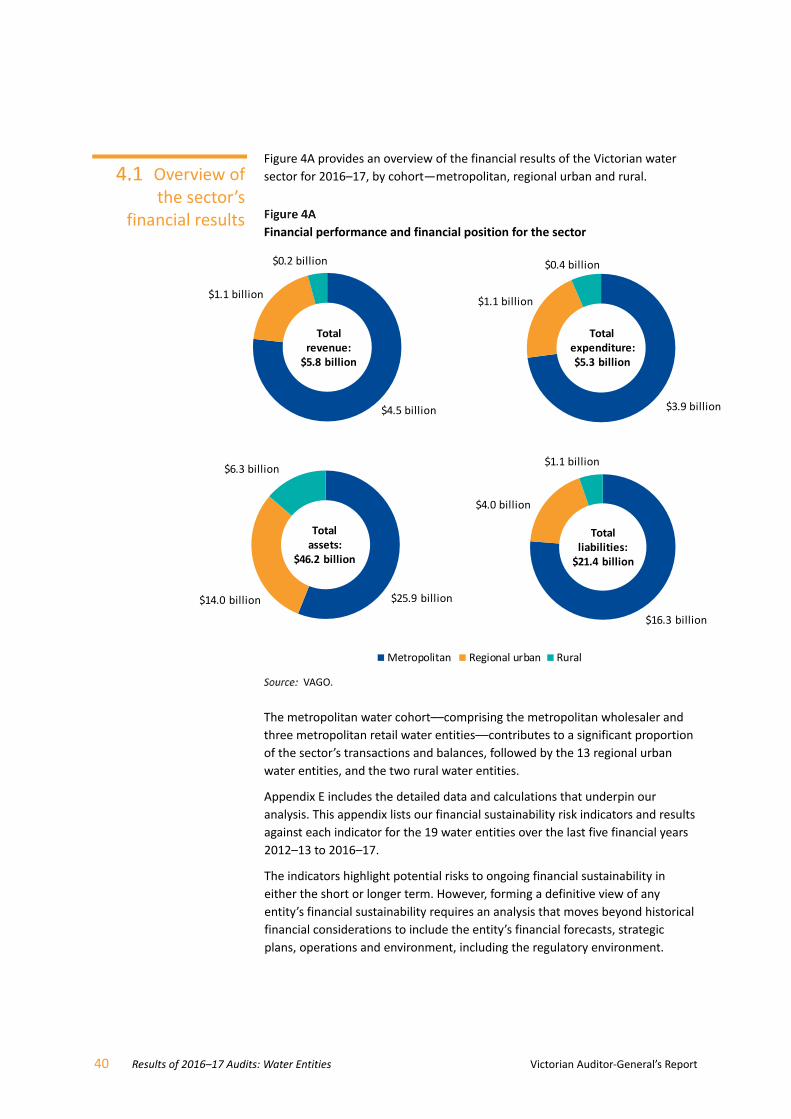
Figure 4A provides an overview of the financial results of the Victorian water
sector for 2016–17, by cohort—metropolitan, regional urban and rural.
Financial performance and financial position for the sector
VAGO.
The metropolitan water cohort––comprising the metropolitan wholesaler and
three metropolitan retail water entities––contributes to a significant proportion
of the sector’s transactions and balances, followed by the 13 regional urban
water entities, and the two rural water entities.
Appendix E includes the detailed data and calculations that underpin our
analysis. This appendix lists our financial sustainability risk indicators and results
against each indicator for the 19 water entities over the last five financial years
2012–13 to 2016–17.
The indicators highlight potential risks to ongoing financial sustainability in
either the short or longer term. However, forming a definitive view of any
entity’s financial sustainability requires an analysis that moves beyond historical
financial considerations to include the entity’s financial forecasts, strategic
plans, operations and environment, including the regulatory environment.
$16.3 billion
$4.0 billion
$1.1 billion
Metropolitan Regional urban Rural
Total liabilities:$21.4 billion
$25.9 billion$14.0 billion
$6.3 billion
Total assets:
$46.2 billion
$3.9 billion
$1.1 billion
$0.4 billion
Total expenditure:$5.3 billion
$4.5 billion
$1.1 billion
$0.2 billion
Total revenue:$5.8 billion
Overview of the sector’s
financial results

Victorian Auditor-General’s Report Results of 2016–17 Audits: Water Entities 41
Understanding financial performance
The four metropolitan water entities generated a combined net result after
income tax of $416.6 million for 2016–17, an increase of $42.1 million, or
11.2 per cent, on 2015–16.
Average net result
The average net result margin is calculated based on the net result after tax, as
a percentage of an entity’s total revenue. Figure 4B shows the average net result
margin of the cohort for a five-year period. Since 2012–13, the increase in the
average net result margin for this cohort aligns with upward trends in revenue
and net result after tax, indicating strong historical financial performance. This
continued in 2016–17.
Average net result margin for the metropolitan cohort
VAGO.
0%
2%
4%
6%
8%
10%
12%
2012–13 2013–14 2014–15 2015–16 2016–17
Metropolitan water entities
Average net result margin—shows how much of each dollar collected by the metropolitan cohort translates into operating profit.

42 Results of 2016–17 Audits: Water Entities Victorian Auditor-General’s Report
We analyse the key drivers behind the financial performance results of the
metropolitan cohort below.
Events affecting revenue
In 2016–17, the four metropolitan water entities generated total revenue of
$4.5 billion. Figure 4C shows the key revenue components for the metropolitan
cohort.
Key revenue components for metropolitan water entities in 2016–17
Wholesalerrevenue
Metropolitan retailer service and usage charges
Developer contributions
$1 332.1 million $2 327.8 million $429.8 million
VAGO.
The metropolitan water entities’ combined revenue decreased by $109.6 million
(2.4 per cent) in 2015–16, due to a significant decrease of $174.8 million in
Melbourne Water’s bulk water and sewage services, and revenue from
waterways and drainage charges.
Effective from 1 July 2016, Melbourne Water commenced the first year of its
four-year ESC price determination. The new price determination decreased bulk
water and sewage tariff rates, incorporating efficiency savings from the
Government Water Rebate initiative, which was previously provided to the
metropolitan retailers as a separate rebate.
The decline in revenue is further compounded by a reduction in water supplied
to the metropolitan retailers due to:
lower consumption by metropolitan households, commercial and industrial
businesses across the 2016–17 reporting period
the metropolitan region experiencing higher-than-average rainfalls
compared to the prior year.
Both of these factors have resulted in a decline in service and usage charge
revenue of the metropolitan retailers.
The decline in total revenue was offset by developer contributions increasing by
$36.0 million from 2015–16, reflecting the continual expansion of services in
Melbourne’s outer suburbs and growth corridors.
Government Water Rebate initiative (from the retailer perspective)—a rebate back to customers provided by the metropolitan retailer on behalf of the state government on water bills of residential water customers. It was first issued in 2014–15 on the first quarter bill (July, August, September) and is due to be provided each year until 2017–18.

Victorian Auditor-General’s Report Results of 2016–17 Audits: Water Entities 43
Events affecting expenditure
In 2016–17, the four metropolitan water entities incurred $3.9 billion in total
expenditure, a decrease of $71.4 million (1.8 per cent) from the prior year.
Figure 4D shows the metropolitan cohort’s key expenses.
Key expenditure components for metropolitan water entities in 2016–17
Finance cost
$929.1 million
Bulk water purchase from the
wholesaler
$1 317.8 million
Operating, admin and
other expenses
$737.7 million
Depreciation and
amortisation
$618.4 million
Employee expenses
$262.7 million
VAGO.
The main factor affecting the cohorts’ expenditure is the bulk water charges
paid by the metropolitan retailers to Melbourne Water, which decreased by
approximately $91.7 million. This is due to the reduction in tariff rates and water
consumption, in line with Melbourne Water’s revenue movement explained in
our revenue analysis.
Further, total finance costs for the cohort decreased by $15.3 million, or
1.6 per cent. This decline is largely a result of Melbourne Water experiencing
lower interest expenses of $10.9 million due to repaying some debt and
refinancing maturing debt at lower interest rates in 2015–16. There was also
a reduction in finance costs associated with the Victorian Desalination Plant of
$8.6 million, due to refinancing savings.
While Melbourne Water’s finance costs decreased by $19.5 million, this was
offset by the metropolitan retailers—their finance costs increased by a
combined $4.1 million, due to a $177.8 million increase in borrowings held.
Other movements in expenditure items include:
depreciation and amortisation increasing by $12.6 million (2.1 per cent),
driven by a net revaluation increment of $217.2 million for the metropolitan
water entities’ physical assets from prior year’s formal valuation exercise
employee benefits increasing by $14.1 million (5.7 per cent), due to an
increase in the overall full-time equivalent (FTE) base of 3.9 per cent for the
cohort and increases in salaries and wages in line with enterprise bargaining
agreements.
44 Results of 2016–17 Audits: Water Entities Victorian Auditor-General’s Report
Events affecting income tax expense
The metropolitan water entities are subject to the National Tax Equivalent
Regime (NTER), administered by the Australian Taxation Office.
Total income tax expense for the 2016–17 reporting period was $207.7 million.
This represents a decline of $77.3 million, largely driven by a reduction in
income tax payable by Melbourne Water, resulting from a change in the
income tax treatment associated with the Victorian Desalination Plant.
Understanding financial position
Assets
At 30 June 2017, the four metropolitan water entities had assets of $25.9 billion,
an increase of $491.8 million, or 1.9 per cent, compared to the prior year. The
cohort’s most significant assets are property, plant, equipment and
infrastructure (PPEI) worth $24.7 billion.
PPEI assets grew by $437.6 million in 2016–17. The key drivers affecting this
growth are:
a $19.3 million net revaluation increase in infrastructure assets, comprising:
Yarra Valley Water and City West Water’s increments of $41.0 million
and $36.4 million respectively
South East Water’s decrement of $58.1 million.
additions to infrastructure assets across all four water entities of
$418.3 million relating to asset renewal and replacement across the
Melbourne metropolitan network.
Asset management is a key area that impacts the long-term financial
sustainability of a water entity. A key financial challenge is how well water
entities plan and carry out asset renewal and replacement. To understand
this challenge, we analyse a longer-term indicator—capital replacement.
Capital replacement
The capital replacement ratio illustrates whether water entities are spending
more on replacing or renewing assets each year compared with their
depreciation expense—depreciation being considered an indicator of
consumption.
We calculate this ratio based on a five-year rolling average, as can be seen
in Figure 4E. The five-year rolling average allows for better phasing of asset
spending by the four metropolitan water entities, as it closely aligns to their
water pricing cycle.
National Tax Equivalent Regime (NTER)—an administrative arrangement that results in government-owned enterprises paying a tax equivalent to the state government.
Property, plant, equipment and infrastructure assets represented 95.6 per cent of the total asset base in the metropolitan cohort.
Capital replacement ratio—in 2016–17, for every $1 of depreciation expense incurred, entities have spent on average $2.12 on infrastructure, property, plant and equipment.
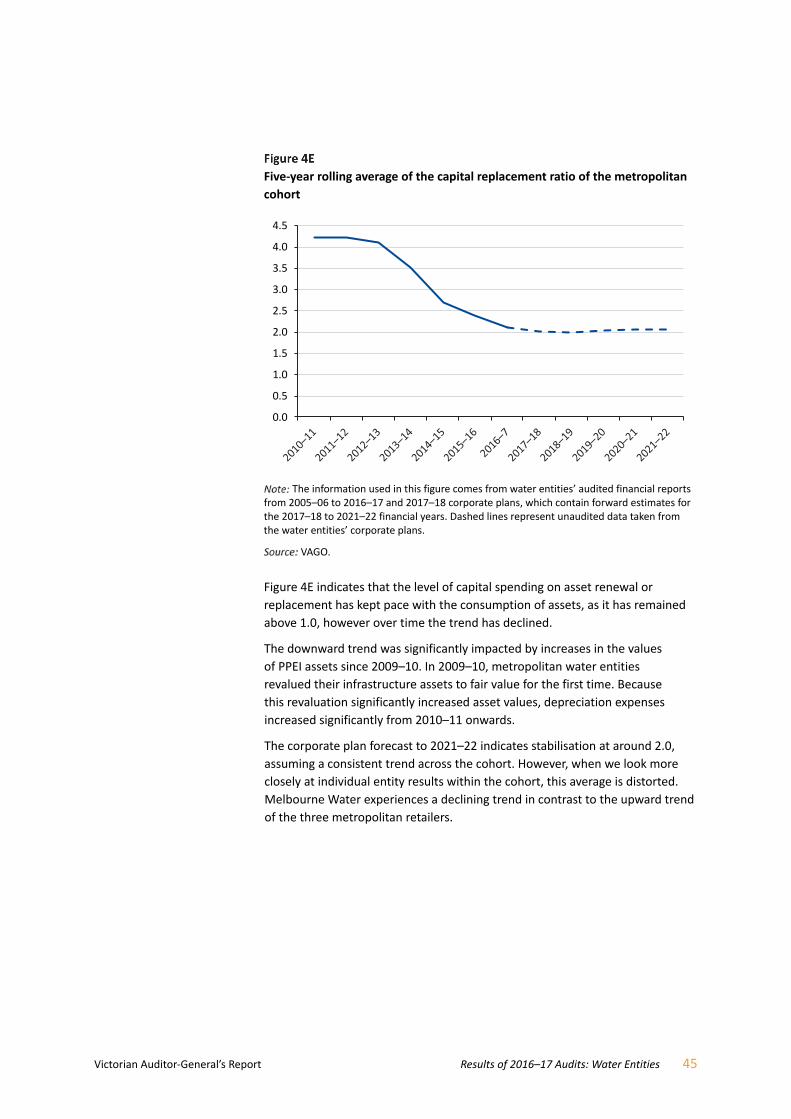
Victorian Auditor-General’s Report Results of 2016–17 Audits: Water Entities 45
Five‐year rolling average of the capital replacement ratio of the metropolitan
cohort
The information used in this figure comes from water entities’ audited financial reports from 2005–06 to 2016–17 and 2017–18 corporate plans, which contain forward estimates for the 2017–18 to 2021–22 financial years. Dashed lines represent unaudited data taken from the water entities’ corporate plans.
VAGO.
Figure 4E indicates that the level of capital spending on asset renewal or
replacement has kept pace with the consumption of assets, as it has remained
above 1.0, however over time the trend has declined.
The downward trend was significantly impacted by increases in the values
of PPEI assets since 2009–10. In 2009–10, metropolitan water entities
revalued their infrastructure assets to fair value for the first time. Because
this revaluation significantly increased asset values, depreciation expenses
increased significantly from 2010–11 onwards.
The corporate plan forecast to 2021–22 indicates stabilisation at around 2.0,
assuming a consistent trend across the cohort. However, when we look more
closely at individual entity results within the cohort, this average is distorted.
Melbourne Water experiences a declining trend in contrast to the upward trend
of the three metropolitan retailers.
0.0
0.5
1.0
1.5
2.0
2.5
3.0
3.5
4.0
4.5
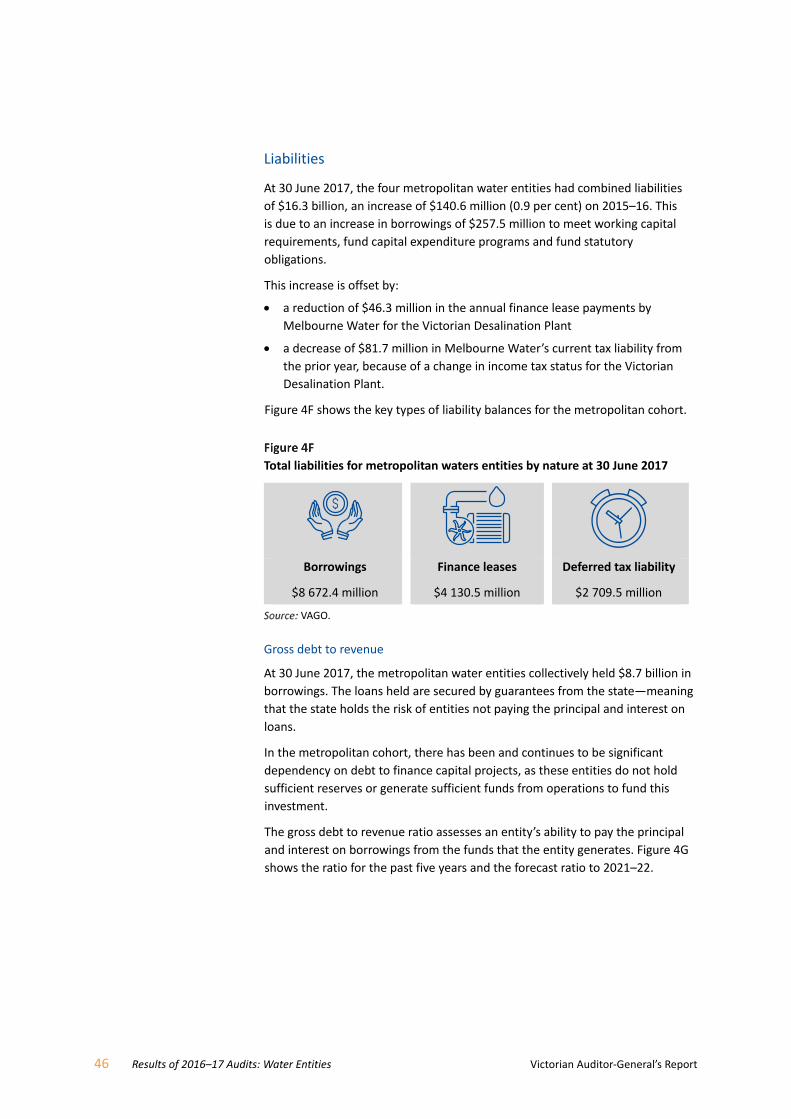
46 Results of 2016–17 Audits: Water Entities Victorian Auditor-General’s Report
Liabilities
At 30 June 2017, the four metropolitan water entities had combined liabilities
of $16.3 billion, an increase of $140.6 million (0.9 per cent) on 2015–16. This
is due to an increase in borrowings of $257.5 million to meet working capital
requirements, fund capital expenditure programs and fund statutory
obligations.
This increase is offset by:
a reduction of $46.3 million in the annual finance lease payments by
Melbourne Water for the Victorian Desalination Plant
a decrease of $81.7 million in Melbourne Water’s current tax liability from
the prior year, because of a change in income tax status for the Victorian
Desalination Plant.
Figure 4F shows the key types of liability balances for the metropolitan cohort.
Total liabilities for metropolitan waters entities by nature at 30 June 2017
Borrowings Finance leases Deferred tax liability
$8 672.4 million $4 130.5 million $2 709.5 million
VAGO.
Gross debt to revenue
At 30 June 2017, the metropolitan water entities collectively held $8.7 billion in
borrowings. The loans held are secured by guarantees from the state—meaning
that the state holds the risk of entities not paying the principal and interest on
loans.
In the metropolitan cohort, there has been and continues to be significant
dependency on debt to finance capital projects, as these entities do not hold
sufficient reserves or generate sufficient funds from operations to fund this
investment.
The gross debt to revenue ratio assesses an entity’s ability to pay the principal
and interest on borrowings from the funds that the entity generates. Figure 4G
shows the ratio for the past five years and the forecast ratio to 2021–22.
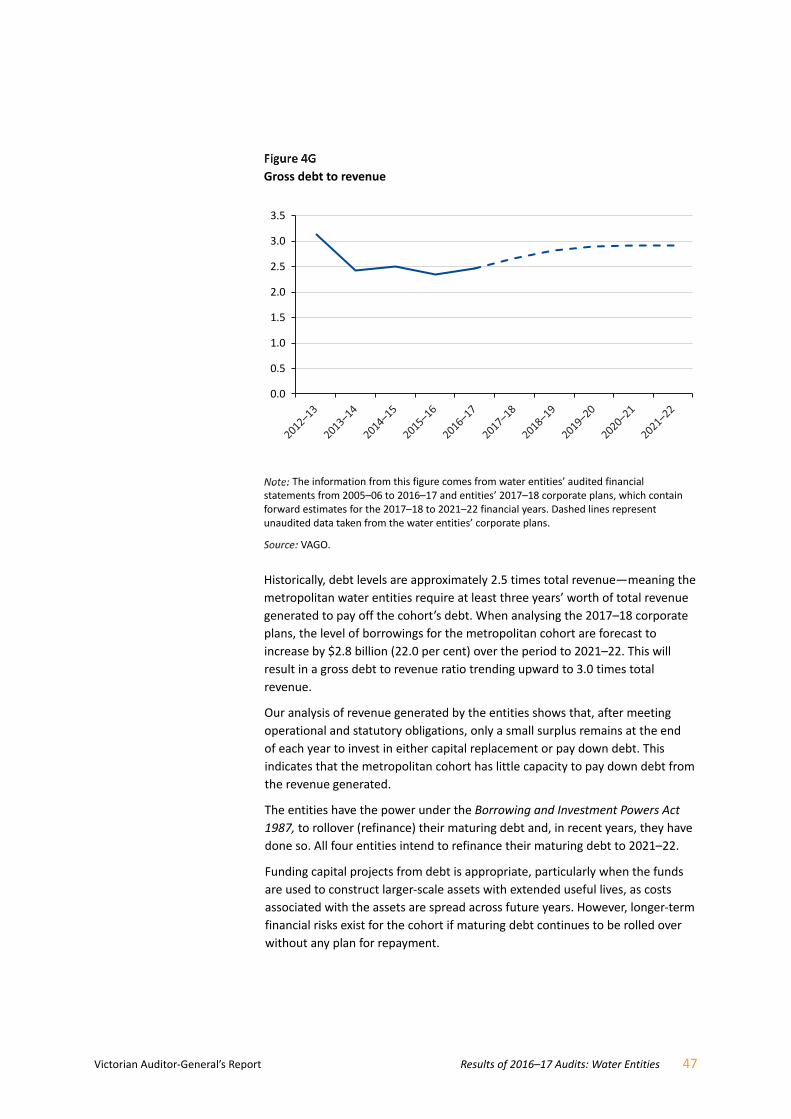
Victorian Auditor-General’s Report Results of 2016–17 Audits: Water Entities 47
Gross debt to revenue
The information from this figure comes from water entities’ audited financial statements from 2005–06 to 2016–17 and entities’ 2017–18 corporate plans, which contain forward estimates for the 2017–18 to 2021–22 financial years. Dashed lines represent unaudited data taken from the water entities’ corporate plans.
VAGO.
Historically, debt levels are approximately 2.5 times total revenue—meaning the
metropolitan water entities require at least three years’ worth of total revenue
generated to pay off the cohort’s debt. When analysing the 2017–18 corporate
plans, the level of borrowings for the metropolitan cohort are forecast to
increase by $2.8 billion (22.0 per cent) over the period to 2021–22. This will
result in a gross debt to revenue ratio trending upward to 3.0 times total
revenue.
Our analysis of revenue generated by the entities shows that, after meeting
operational and statutory obligations, only a small surplus remains at the end
of each year to invest in either capital replacement or pay down debt. This
indicates that the metropolitan cohort has little capacity to pay down debt from
the revenue generated.
The entities have the power under the Borrowing and Investment Powers Act
1987, to rollover (refinance) their maturing debt and, in recent years, they have
done so. All four entities intend to refinance their maturing debt to 2021–22.
Funding capital projects from debt is appropriate, particularly when the funds
are used to construct larger-scale assets with extended useful lives, as costs
associated with the assets are spread across future years. However, longer-term
financial risks exist for the cohort if maturing debt continues to be rolled over
without any plan for repayment.
0.0
0.5
1.0
1.5
2.0
2.5
3.0
3.5
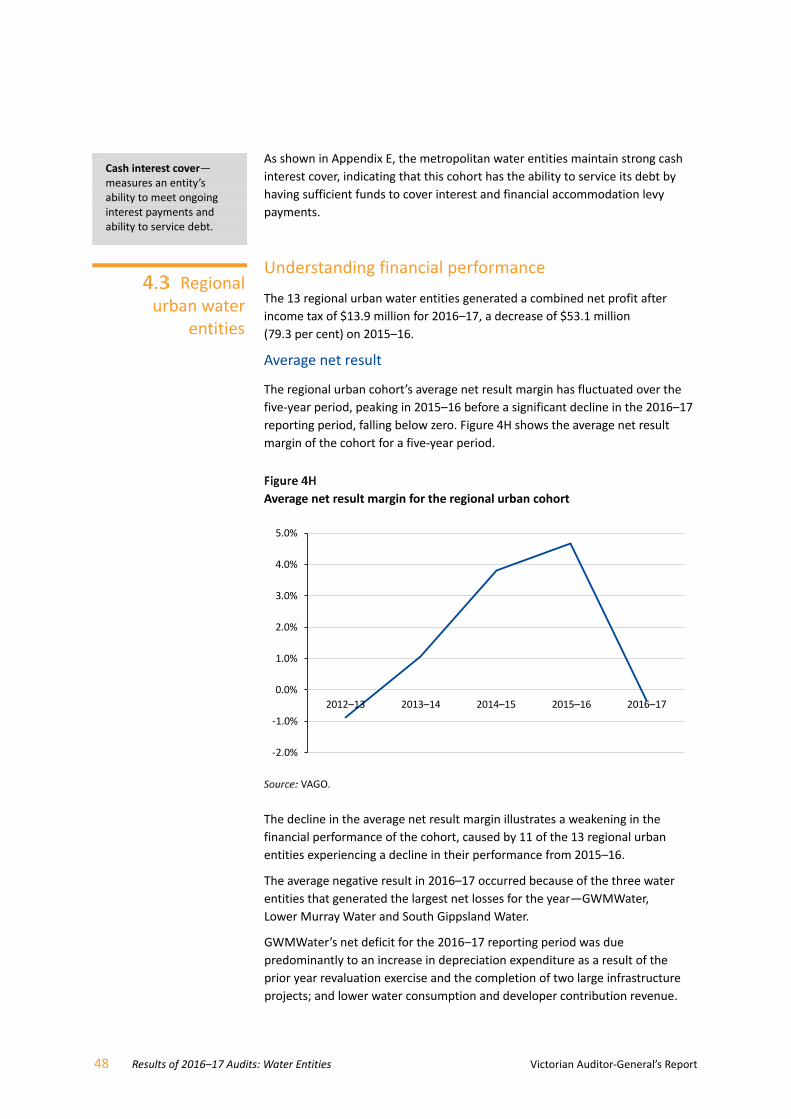
48 Results of 2016–17 Audits: Water Entities Victorian Auditor-General’s Report
As shown in Appendix E, the metropolitan water entities maintain strong cash
interest cover, indicating that this cohort has the ability to service its debt by
having sufficient funds to cover interest and financial accommodation levy
payments.
Understanding financial performance
The 13 regional urban water entities generated a combined net profit after
income tax of $13.9 million for 2016–17, a decrease of $53.1 million
(79.3 per cent) on 2015–16.
Average net result
The regional urban cohort’s average net result margin has fluctuated over the
five-year period, peaking in 2015–16 before a significant decline in the 2016–17
reporting period, falling below zero. Figure 4H shows the average net result
margin of the cohort for a five-year period.
Average net result margin for the regional urban cohort
VAGO.
The decline in the average net result margin illustrates a weakening in the
financial performance of the cohort, caused by 11 of the 13 regional urban
entities experiencing a decline in their performance from 2015–16.
The average negative result in 2016–17 occurred because of the three water
entities that generated the largest net losses for the year—GWMWater,
Lower Murray Water and South Gippsland Water.
GWMWater’s net deficit for the 2016–17 reporting period was due
predominantly to an increase in depreciation expenditure as a result of the
prior year revaluation exercise and the completion of two large infrastructure
projects; and lower water consumption and developer contribution revenue.
-2.0%
-1.0%
0.0%
1.0%
2.0%
3.0%
4.0%
5.0%
2012–13 2013–14 2014–15 2015–16 2016–17
Cash interest cover—measures an entity’s ability to meet ongoing interest payments and ability to service debt.
Regional urban water
entities
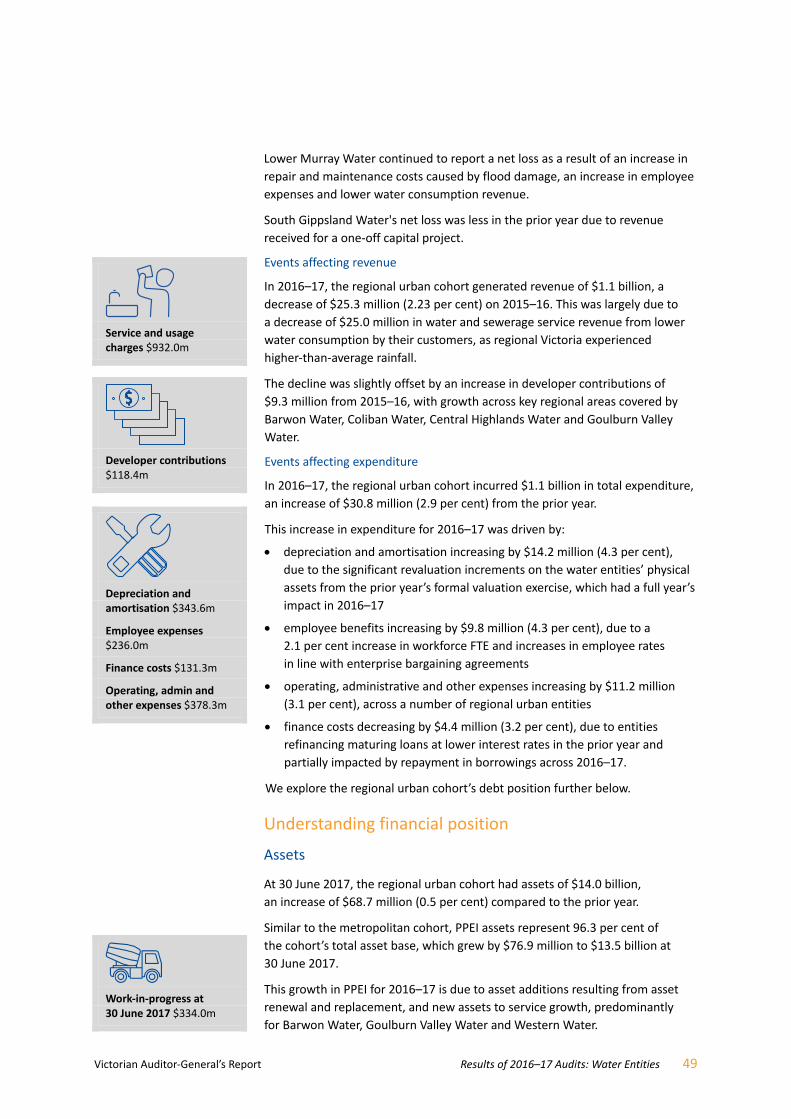
Victorian Auditor-General’s Report Results of 2016–17 Audits: Water Entities 49
Lower Murray Water continued to report a net loss as a result of an increase in
repair and maintenance costs caused by flood damage, an increase in employee
expenses and lower water consumption revenue.
South Gippsland Water's net loss was less in the prior year due to revenue
received for a one-off capital project.
Events affecting revenue
In 2016–17, the regional urban cohort generated revenue of $1.1 billion, a
decrease of $25.3 million (2.23 per cent) on 2015–16. This was largely due to
a decrease of $25.0 million in water and sewerage service revenue from lower
water consumption by their customers, as regional Victoria experienced
higher-than-average rainfall.
The decline was slightly offset by an increase in developer contributions of
$9.3 million from 2015–16, with growth across key regional areas covered by
Barwon Water, Coliban Water, Central Highlands Water and Goulburn Valley
Water.
Events affecting expenditure
In 2016–17, the regional urban cohort incurred $1.1 billion in total expenditure,
an increase of $30.8 million (2.9 per cent) from the prior year.
This increase in expenditure for 2016–17 was driven by:
depreciation and amortisation increasing by $14.2 million (4.3 per cent),
due to the significant revaluation increments on the water entities’ physical
assets from the prior year’s formal valuation exercise, which had a full year’s
impact in 2016–17
employee benefits increasing by $9.8 million (4.3 per cent), due to a
2.1 per cent increase in workforce FTE and increases in employee rates
in line with enterprise bargaining agreements
operating, administrative and other expenses increasing by $11.2 million
(3.1 per cent), across a number of regional urban entities
finance costs decreasing by $4.4 million (3.2 per cent), due to entities
refinancing maturing loans at lower interest rates in the prior year and
partially impacted by repayment in borrowings across 2016–17.
We explore the regional urban cohort’s debt position further below.
Understanding financial position
Assets
At 30 June 2017, the regional urban cohort had assets of $14.0 billion,
an increase of $68.7 million (0.5 per cent) compared to the prior year.
Similar to the metropolitan cohort, PPEI assets represent 96.3 per cent of
the cohort’s total asset base, which grew by $76.9 million to $13.5 billion at
30 June 2017.
This growth in PPEI for 2016–17 is due to asset additions resulting from asset
renewal and replacement, and new assets to service growth, predominantly
for Barwon Water, Goulburn Valley Water and Western Water.
Service and usage charges $932.0m
Developer contributions $118.4m
Depreciation and amortisation $343.6m
Employee expenses $236.0m
Finance costs $131.3m
Operating, admin and other expenses $378.3m
Work‐in‐progress at 30 June 2017 $334.0m

50 Results of 2016–17 Audits: Water Entities Victorian Auditor-General’s Report
Capital replacement
We calculate the capital replacement ratio for the regional urban cohort on a
five-year rolling average, over a period of 16 years, as can be seen in Figure 4I.
Five‐year rolling average of the capital replacement ratio for the regional
urban cohort
The information used in this figure comes from water entities’ audited financial reports from 2005–06 to 2016–17 and 2017–18 corporate plans, which contain forward estimates for the 2017–18 to 2021–22 financial years. Dashed lines represent unaudited data taken from the water entities’ corporate plans.
VAGO.
Figure 4I indicates that the level of capital spending for asset renewal or
replacement has kept pace with the consumption of assets, as it has remained
above 1.0. However, over time the trend has declined.
The downward trend was significantly impacted by changes in the valuation
of PPEI assets since 2010–11. In 2010–11, infrastructure assets across the
regional urban entities were revalued to fair value for the first time and again
in 2015−16, causing the depreciation expense to increase significantly across
the period as a result of the higher asset values.
The corporate plan forecasts indicate a slight upward trend for the cohort.
However, we note this average trend is significantly distorted by the forecast
for Barwon Water and GWMWater, which both show a declining trend, with
a capital replacement ratio of equal or less than 0.5 by 2021–22.
A further five regional urban entities are also at greater risk relative to the
cohort, with an average below 1.0 in their capital replacement ratio over the
next five years. Refer to Appendix E for breakdowns of the individual entities’
results for the last five years.
0.0
0.5
1.0
1.5
2.0
2.5
3.0Capital replacement ratio—in 2016–17, for every $1 of depreciation expense incurred, entities have spent on average $1.15 on infrastructure, property, plant and equipment.
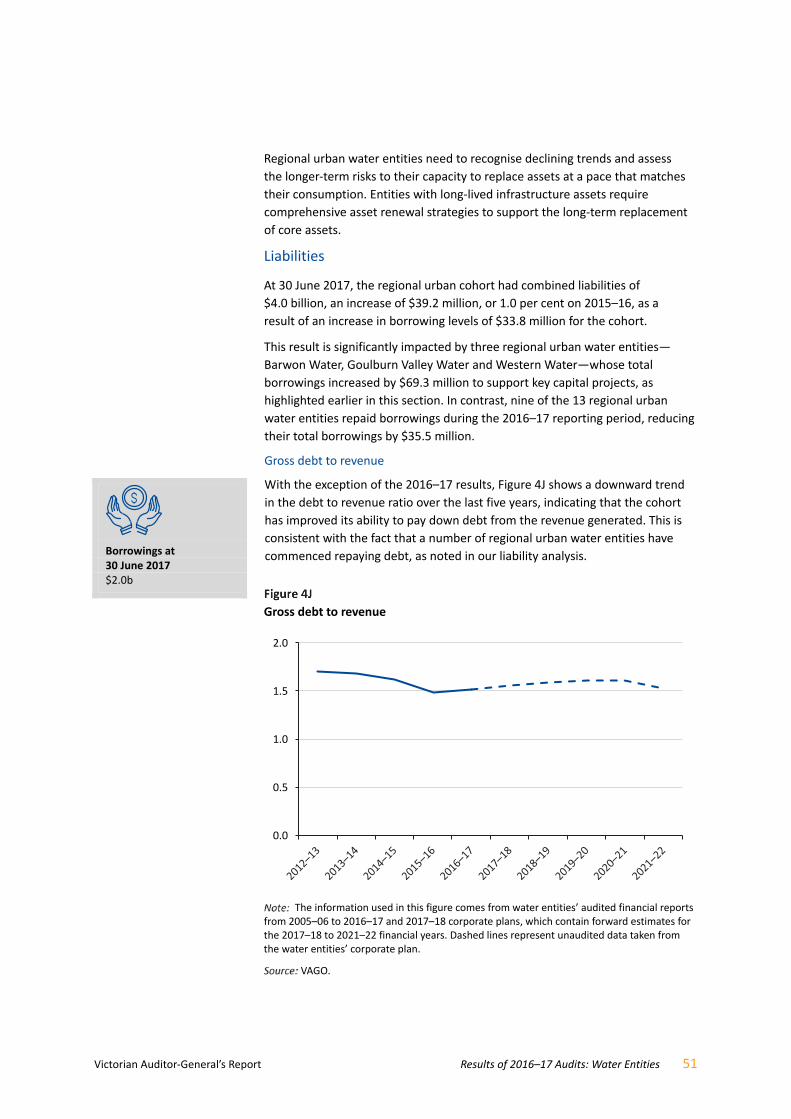
Victorian Auditor-General’s Report Results of 2016–17 Audits: Water Entities 51
Regional urban water entities need to recognise declining trends and assess
the longer-term risks to their capacity to replace assets at a pace that matches
their consumption. Entities with long-lived infrastructure assets require
comprehensive asset renewal strategies to support the long-term replacement
of core assets.
Liabilities
At 30 June 2017, the regional urban cohort had combined liabilities of
$4.0 billion, an increase of $39.2 million, or 1.0 per cent on 2015–16, as a
result of an increase in borrowing levels of $33.8 million for the cohort.
This result is significantly impacted by three regional urban water entities—
Barwon Water, Goulburn Valley Water and Western Water—whose total
borrowings increased by $69.3 million to support key capital projects, as
highlighted earlier in this section. In contrast, nine of the 13 regional urban
water entities repaid borrowings during the 2016–17 reporting period, reducing
their total borrowings by $35.5 million.
Gross debt to revenue
With the exception of the 2016–17 results, Figure 4J shows a downward trend
in the debt to revenue ratio over the last five years, indicating that the cohort
has improved its ability to pay down debt from the revenue generated. This is
consistent with the fact that a number of regional urban water entities have
commenced repaying debt, as noted in our liability analysis.
Gross debt to revenue
The information used in this figure comes from water entities’ audited financial reports from 2005–06 to 2016–17 and 2017–18 corporate plans, which contain forward estimates for the 2017–18 to 2021–22 financial years. Dashed lines represent unaudited data taken from the water entities’ corporate plan.
VAGO.
0.0
0.5
1.0
1.5
2.0
Borrowings at 30 June 2017 $2.0b
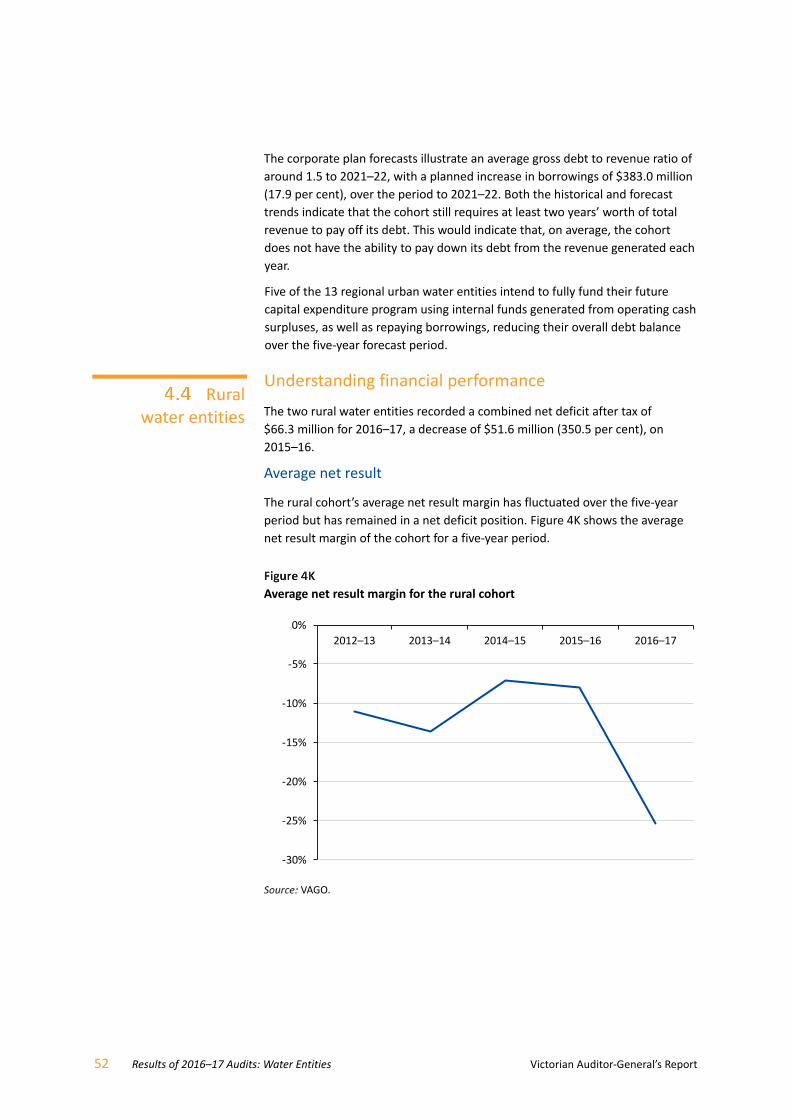
52 Results of 2016–17 Audits: Water Entities Victorian Auditor-General’s Report
The corporate plan forecasts illustrate an average gross debt to revenue ratio of
around 1.5 to 2021–22, with a planned increase in borrowings of $383.0 million
(17.9 per cent), over the period to 2021–22. Both the historical and forecast
trends indicate that the cohort still requires at least two years’ worth of total
revenue to pay off its debt. This would indicate that, on average, the cohort
does not have the ability to pay down its debt from the revenue generated each
year.
Five of the 13 regional urban water entities intend to fully fund their future
capital expenditure program using internal funds generated from operating cash
surpluses, as well as repaying borrowings, reducing their overall debt balance
over the five-year forecast period.
Understanding financial performance
The two rural water entities recorded a combined net deficit after tax of
$66.3 million for 2016–17, a decrease of $51.6 million (350.5 per cent), on
2015–16.
Average net result
The rural cohort’s average net result margin has fluctuated over the five-year
period but has remained in a net deficit position. Figure 4K shows the average
net result margin of the cohort for a five-year period.
Average net result margin for the rural cohort
VAGO.
-30%
-25%
-20%
-15%
-10%
-5%
0%
2012–13 2013–14 2014–15 2015–16 2016–17
Rural water entities
Victorian Auditor‐General’s Report Results of 2016–17 Audits: Water Entities 53
Events affecting revenue
In 2016–17, the two rural cohort entities generated revenue of $246.3 million,
a decrease of $47.6 million (16.2 per cent) on 2015–16. The decline related to
Goulburn Murray Water, where:
government funding recognised as revenue was lower by $33.9 million,
due to the reset of the Connections Project by government
service and usage charges decreased by $8.0 million, due to lower water
orders given higher average rainfall across the 2016–17 reporting period.
Events affecting expenditure
In 2016–17, the two rural water entities incurred $348.1 million in total
expenditure, an increase of $34.0 million (10.8 per cent) from the prior year.
This decline was due to the depreciation expense increasing by $36.0 million
(43.8 per cent).
The increase was expected given the significant revaluation increment
experienced in 2015–16, adding $621.6 million into the value of the
cohort’s physical asset base—Goulburn Murray Water had an increment of
$586.5 million and Southern Rural Water had an increment of $35.1 million.
Average net result margin and EBITDA margin comparison
Figure 4K highlights that rural water entities have experienced significant net
deficits over the five‐year period. Operating losses are amplified for rural
entities due to:
the regulatory asset values set by the former Minister for Water, being at
0 to 2 per cent of the total asset values as at 1 July 2004
these entities being responsible for the delivery and construction of
significant capital programs, largely funded by state and Commonwealth
governments.
Both these factors mean that the regulatory asset base used by ESC to set prices
for these entities is substantially lower than the value of assets in their financial
reports. As a result, these entities recover less through the prices they levy in
comparison to the depreciation expense in their financial reports, leading to the
operating losses reported.
Another indicator used to consider short‐term financial sustainability risks is the
EBITDA margin. Figure 4L shows the difference between the average net result
margin and the EBITDA margin for the rural entities over the review period.
Government funding $71.4m
Depreciation and amortisation $343.6m
Earnings before interest, tax, depreciation and amortisation (EBITDA) margin—measures an entity’s ability to fund financing charges, tax obligations and asset renewal—the higher the EBITDA margin, the greater availability of funds for this purpose.

54 Results of 2016–17 Audits: Water Entities Victorian Auditor-General’s Report
Average net result margin and EBITDA margin comparison
VAGO.
When removing the effect of interest, tax, depreciation and amortisation, the
rural water entities achieve a positive result, indicating their ability to meet
financial obligations in the short term. Despite the downward trend in 2016–17,
a positive EBITDA result still does not indicate short term financial sustainability
concerns.
Understanding performance position
Assets
At 30 June 2017, the two rural water entities had assets of $6.3 billion, an
increase of $77.3 million (1.2 per cent) compared to the prior year. This cohort
has historically held large amounts of cash and cash equivalents at balance date,
due to funding received from government for the delivery of significant capital
projects. As at 30 June 2017, Goulburn Murray Water held $283.1 million in cash
and cash equivalents.
Similar to the other two cohorts, PPEI assets represented 94.6 per cent of the
cohort’s total asset base.
-30%
-20%
-10%
0%
10%
20%
30%
2012–13 2013–14 2014–15 2015–16 2016–17
EBITDA Margin Net result
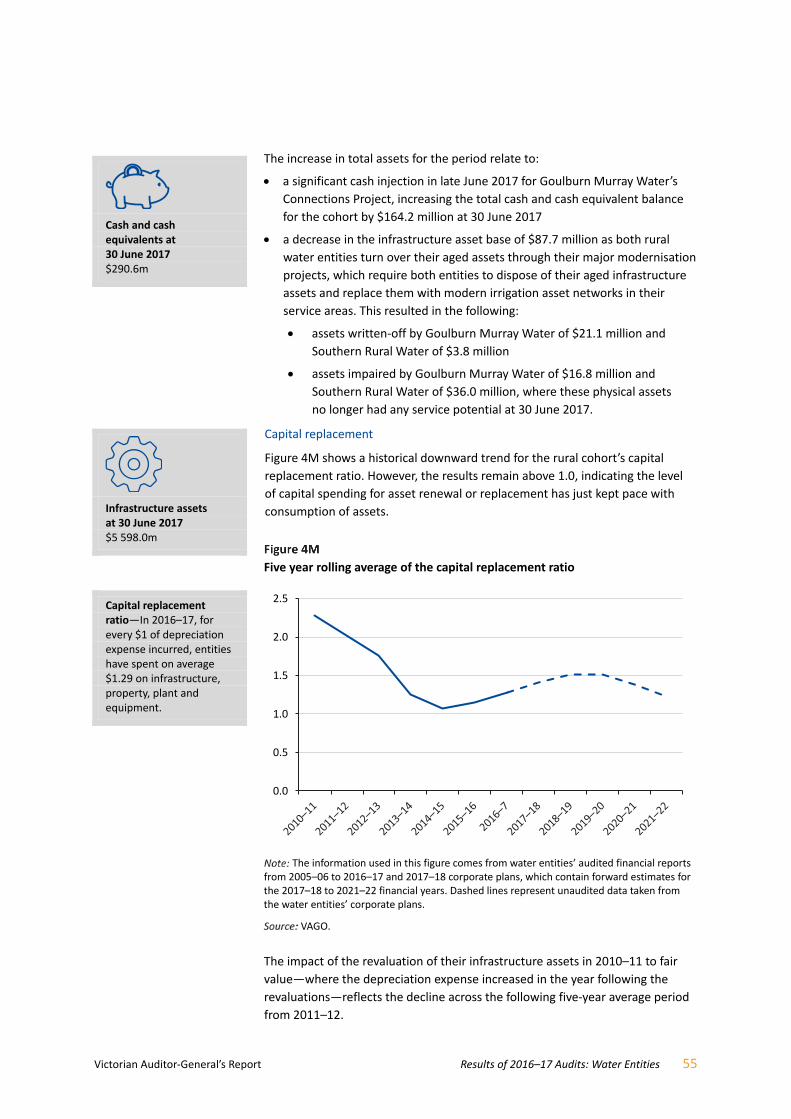
Victorian Auditor-General’s Report Results of 2016–17 Audits: Water Entities 55
The increase in total assets for the period relate to:
a significant cash injection in late June 2017 for Goulburn Murray Water’s
Connections Project, increasing the total cash and cash equivalent balance
for the cohort by $164.2 million at 30 June 2017
a decrease in the infrastructure asset base of $87.7 million as both rural
water entities turn over their aged assets through their major modernisation
projects, which require both entities to dispose of their aged infrastructure
assets and replace them with modern irrigation asset networks in their
service areas. This resulted in the following:
assets written-off by Goulburn Murray Water of $21.1 million and
Southern Rural Water of $3.8 million
assets impaired by Goulburn Murray Water of $16.8 million and
Southern Rural Water of $36.0 million, where these physical assets
no longer had any service potential at 30 June 2017.
Capital replacement
Figure 4M shows a historical downward trend for the rural cohort’s capital
replacement ratio. However, the results remain above 1.0, indicating the level
of capital spending for asset renewal or replacement has just kept pace with
consumption of assets.
Five year rolling average of the capital replacement ratio
The information used in this figure comes from water entities’ audited financial reports from 2005–06 to 2016–17 and 2017–18 corporate plans, which contain forward estimates for the 2017–18 to 2021–22 financial years. Dashed lines represent unaudited data taken from the water entities’ corporate plans.
VAGO.
The impact of the revaluation of their infrastructure assets in 2010–11 to fair
value—where the depreciation expense increased in the year following the
revaluations—reflects the decline across the following five-year average period
from 2011–12.
0.0
0.5
1.0
1.5
2.0
2.5
Cash and cash equivalents at 30 June 2017 $290.6m
Infrastructure assets at 30 June 2017 $5 598.0m
Capital replacement ratio—In 2016–17, for every $1 of depreciation expense incurred, entities have spent on average $1.29 on infrastructure, property, plant and equipment.

56 Results of 2016–17 Audits: Water Entities Victorian Auditor-General’s Report
Unlike the other two cohorts, the rolling average of the capital replacement
ratio for the two rural entities has been on the incline since 2014–15 and we
expect this to continue until 2019–20, based on corporate plan forecasts. This
period of growth in the ratio aligns to the significant capital expenditure by both
rural entities planning for their respective modernisation projects, which are
funded by state and Commonwealth governments. These current injections of
cash are for new infrastructure assets only.
The consumption of these assets will increase the depreciation charge and
further widen the gap of the rural cohort’s net result and EBITDA margin, as
detailed above. The challenge will arise in the longer term, when these entities
will be required to replace and renew their significant infrastructure assets.
Further support from the state and/or Commonwealth governments may again
be required.
Liabilities
At 30 June 2017, the two rural entities had combined liabilities of $1.1 billion,
an increase of $42.5 million (4.0 per cent) on 2015–16. This is mainly due to an
increase in unearned revenue for Goulburn Murray Water, relating to their
Connections Project of $113.1 million.
The movement in unearned revenue was offset by a decrease in deferred tax
liabilities of $59.6 million—a direct result of the decrease to the infrastructure
asset balance resulting from decommissioning and impairments highlighted
above.

Victorian Auditor-General’s Report Results of 2016–17 Audits: Water Entities 57
Appendix A Audit Act 1994 section 16—submissions and comments We have consulted with all water entities, DELWP, ESC and VicWater throughout
the course of the audit. As required by section 16(3) of the Audit Act 1994, we
gave a draft copy of this report, or relevant extracts, to those entities and asked
for their submissions and comments. We also provided a copy of the report to
the Department of Premier and Cabinet.
Responsibility for the accuracy, fairness and balance of those comments rests
solely with the entity head.
Responses were received as follows:
DELWP ................................................................................................................. 58
Coliban Water ...................................................................................................... 59
58 Results of 2016–17 Audits: Water Entities Victorian Auditor-General’s Report
RESPONSE provided by the Secretary, DELWP

Victorian Auditor-General’s Report Results of 2016–17 Audits: Water Entities 59
RESPONSE provided by the Managing Director, Coliban Water

60 Results of 2016–17 Audits: Water Entities Victorian Auditor-General’s Report
RESPONSE provided by the Managing Director, Coliban Water—continued
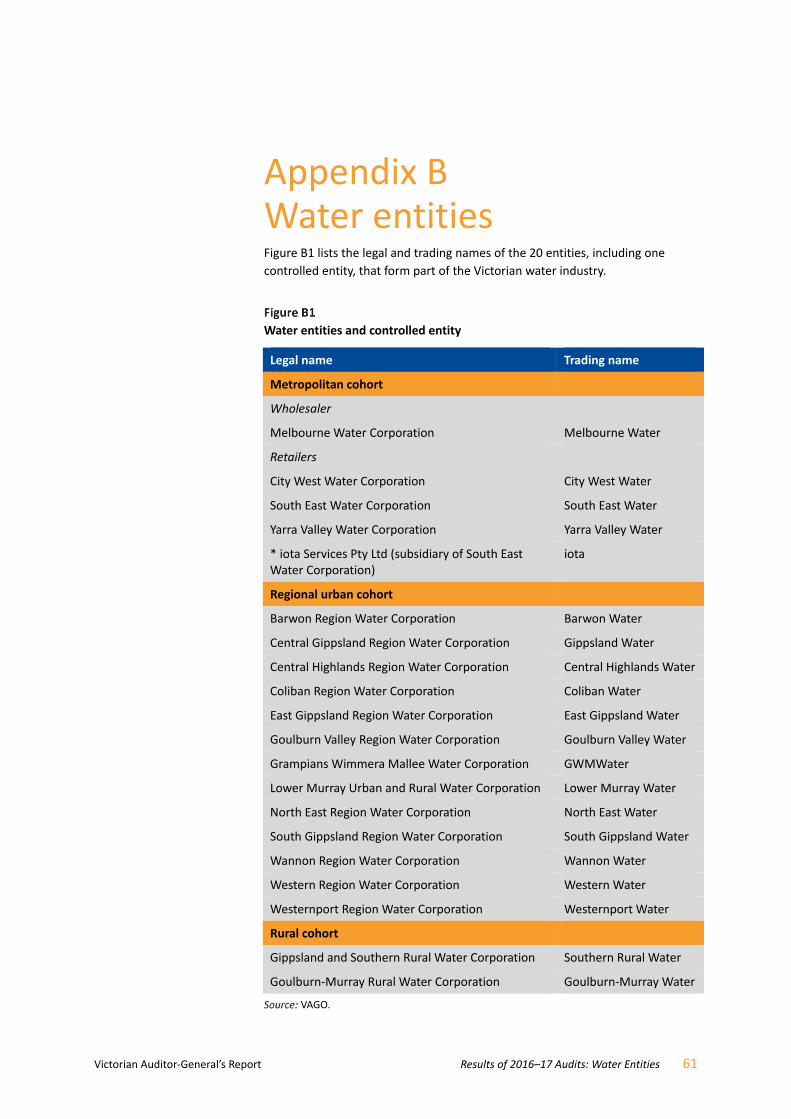
Victorian Auditor-General’s Report Results of 2016–17 Audits: Water Entities 61
Appendix B Water entities Figure B1 lists the legal and trading names of the 20 entities, including one
controlled entity, that form part of the Victorian water industry.
Water entities and controlled entity
Legal name Trading name
Metropolitan cohort
Wholesaler
Melbourne Water Corporation
Melbourne Water
Retailers
City West Water Corporation
South East Water Corporation
Yarra Valley Water Corporation
City West Water
South East Water
Yarra Valley Water
* iota Services Pty Ltd (subsidiary of South East Water Corporation)
iota
Regional urban cohort
Barwon Region Water Corporation Barwon Water
Central Gippsland Region Water Corporation Gippsland Water
Central Highlands Region Water Corporation Central Highlands Water
Coliban Region Water Corporation Coliban Water
East Gippsland Region Water Corporation East Gippsland Water
Goulburn Valley Region Water Corporation Goulburn Valley Water
Grampians Wimmera Mallee Water Corporation GWMWater
Lower Murray Urban and Rural Water Corporation Lower Murray Water
North East Region Water Corporation North East Water
South Gippsland Region Water Corporation South Gippsland Water
Wannon Region Water Corporation Wannon Water
Western Region Water Corporation Western Water
Westernport Region Water Corporation Westernport Water
Rural cohort
Gippsland and Southern Rural Water Corporation Southern Rural Water
Goulburn-Murray Rural Water Corporation Goulburn-Murray Water
VAGO.

62 Results of 2016–17 Audits: Water Entities Victorian Auditor-General’s Report
iota Services Pty Ltd (iota) is a wholly-owned subsidiary of South East Water,
incorporated on 29 October 2014 under the Corporations Act 2001 and it
commenced trading on 1 January 2015. The then Minister for Water approved
the establishment of iota under the provisions of the Water Act 1989. iota is
responsible for the profitable commercialisation of South East Water’s
innovations, products and services.
The entity is consolidated into the financial report of South East Water, as per
the requirements of AASB 10 Consolidated Financial Statements. As the entity is
consolidated, the results of that audit are addressed throughout this report as
part of the South East Water results.
Four of the water entities provide rural water services, which comprise water
supply, drainage, and salinity mitigation services for irrigation and domestic and
stock purposes. These are:
Southern Rural Water
Goulburn-Murray Water
GWMWater
Lower Murray Water.
Southern Rural Water, Goulburn-Murray Water and GWMWater also provide
bulk water supply services to other water entities in regional Victoria. See
Figure 2B for rural service areas.
Rural service areas
VAGO.
Controlled entity
Rural service areas

Victorian Auditor-General’s Report Results of 2016–17 Audits: Water Entities 63
Appendix C Acquittal of audits Figure C1 shows the dates when entities’ 2016–17 financial and performance
reports were certified and auditor's reports were issued.
Acquittal of audits
FMA—Financial Management Act 1994.
VAGO.
Entity
FMA Non‐FMA
Clear
opinion
issued
Certification
date
Auditor‐
General’s
report signed
Within
12 weeks
More than
12 weeks
Clear
opinion
issued
Certification
date
Auditor‐
General’s
report signed
Within
12 weeks
More than
12 weeks
Metropolitan
Wholesaler
Melbourne Water 25-Aug 31-Aug 25-Aug 31-Aug
Retailers
City West Water 22-Aug 29-Aug 22-Aug 29-Aug
South East Water 4-Sep 5-Sep 4-Sep 5-Sep
iota Services Pty Ltd 4-Sep 5-Sep NA NA NA NA
Yarra Valley Water 25-Aug 31-Aug 25-Aug 31-Aug
Regional urban
Barwon Water 17-Aug 22-Aug 17-Aug 22-Aug
Central Highlands Water 4-Sep 5-Sep 4-Sep 5-Sep
Coliban Water 28-Aug 1-Sep 28-Aug 1-Sep
East Gippsland Water 6-Sep 7-Sep 6-Sep 7-Sep
Gippsland Water 25-Aug 4-Sep 25-Aug 4-Sep
Goulburn Valley Water 23-Aug 25-Aug 23-Aug 25-Aug
GWM Water 21-Aug 23-Aug 21-Aug 23-Aug
Lower Murray Water 11-Sep 12-Sep 11-Sep 12-Sep
North East Water 15-Aug 22-Aug 15-Aug 22-Aug
South Gippsland Water 12-Sep 13-Sep 12-Sep 13-Sep
Wannon Water 31-Aug 1-Sep 31-Aug 1-Sep
Western Water 7-Sep 8-Sep 7-Sep 8-Sep
Westernport Water 28-Sep 10-Oct 28-Sep 10-Oct
Rural
Southern Rural Water 5-Sep 7-Sep 5-Sep 7-Sep
Goulburn-Murray Water 16-Aug 28-Aug 16-Aug 28-Aug
2016–17 total 19 1 95% 5% 95% 5%
2015–16 total 19 1 100% ‐ 100% ‐
Completed audits with 30 June 2017 balance dates
Audit types Financial report
Timeliness of audited
financial report
completion Performance report
Timeliness of audited
performance report
completion

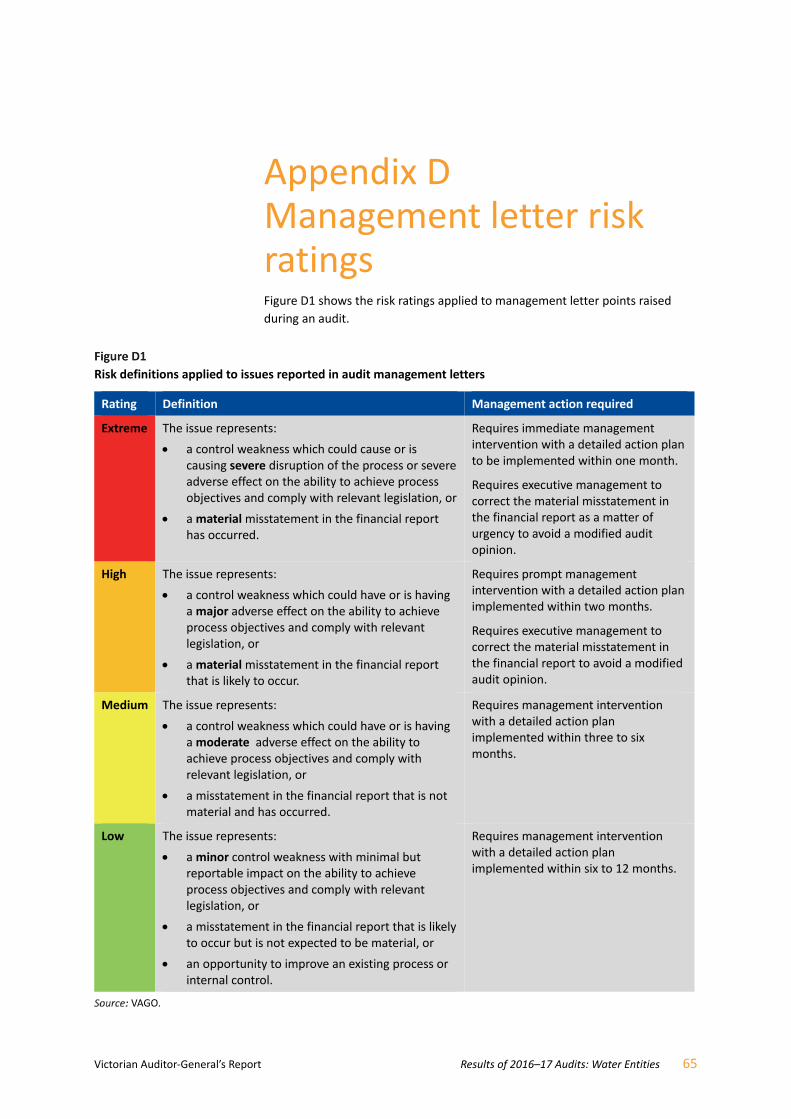
Victorian Auditor-General’s Report Results of 2016–17 Audits: Water Entities 65
Appendix D Management letter risk ratings Figure D1 shows the risk ratings applied to management letter points raised
during an audit.
Risk definitions applied to issues reported in audit management letters
Rating Definition Management action required
Extreme The issue represents:
a control weakness which could cause or is causing severe disruption of the process or severe adverse effect on the ability to achieve process objectives and comply with relevant legislation, or
a material misstatement in the financial report has occurred.
Requires immediate management intervention with a detailed action plan to be implemented within one month.
Requires executive management to correct the material misstatement in the financial report as a matter of urgency to avoid a modified audit opinion.
High The issue represents:
a control weakness which could have or is having a major adverse effect on the ability to achieve process objectives and comply with relevant legislation, or
a material misstatement in the financial report that is likely to occur.
Requires prompt management intervention with a detailed action plan implemented within two months.
Requires executive management to correct the material misstatement in the financial report to avoid a modified audit opinion.
Medium The issue represents:
a control weakness which could have or is having a moderate adverse effect on the ability to achieve process objectives and comply with relevant legislation, or
a misstatement in the financial report that is not material and has occurred.
Requires management intervention with a detailed action plan implemented within three to six months.
Low The issue represents:
a minor control weakness with minimal but reportable impact on the ability to achieve process objectives and comply with relevant legislation, or
a misstatement in the financial report that is likely to occur but is not expected to be material, or
an opportunity to improve an existing process or internal control.
Requires management intervention with a detailed action plan implemented within six to 12 months.
VAGO.


Victorian Auditor-General’s Report Results of 2016–17 Audits: Water Entities 67
Appendix E Financial sustainability risk indicators and summaries Appendix E sets out the definitions we use for the current and prior years that
assist us in assessing and reporting on financial sustainability risks across the
water sector.
However, these financial sustainability indicators are only indicative, highlighting
financial sustainability risks at a cohort level—metropolitan, regional urban and
rural—looking at each entity relative to the cohort against a five-year average.
It is important to note that a more definitive view of financial sustainability
requires a more holistic analysis beyond historical financial reporting to also
include forward looking financial forecasts and plans, operations and an entity’s
environment, particularly the regulatory environment within which these water
entities must operate.
Figure E1 shows the indicators used to assess the financial sustainability risks
of entities covered by this report. These indicators should be considered
collectively, and are more useful when assessed over time as part of trend
analysis.
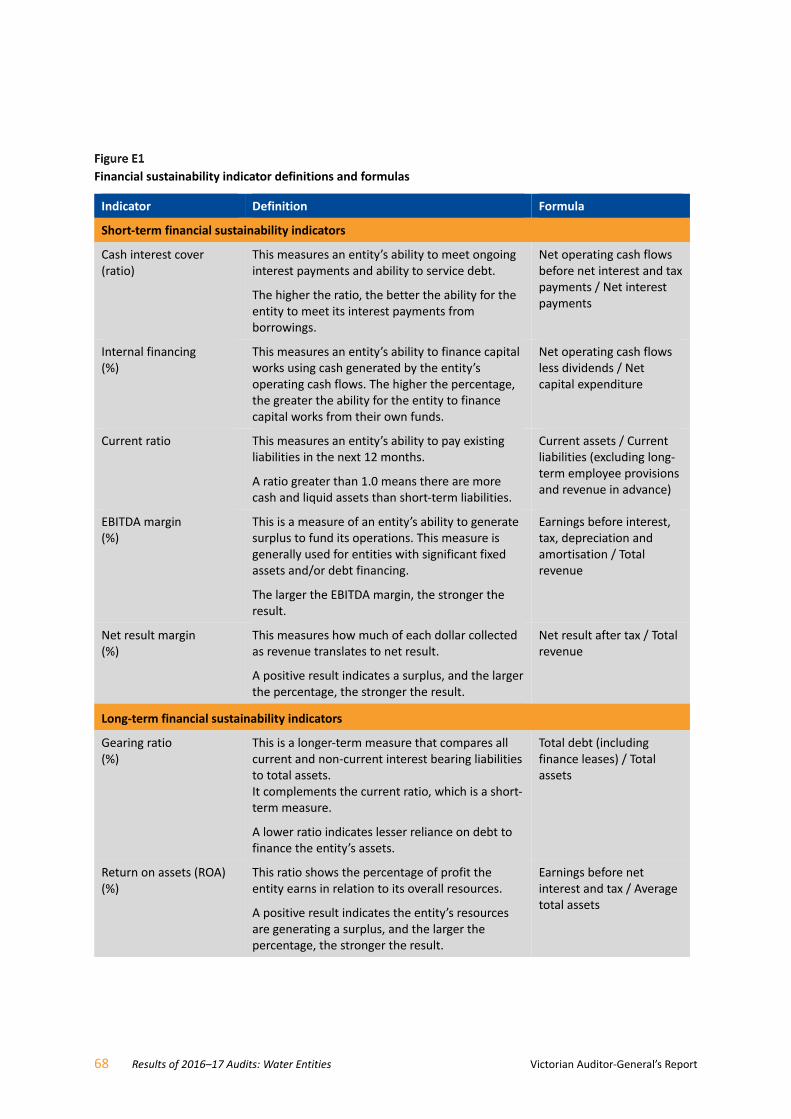
68 Results of 2016–17 Audits: Water Entities Victorian Auditor-General’s Report
Financial sustainability indicator definitions and formulas
Indicator Definition Formula
Short‐term financial sustainability indicators
Cash interest cover (ratio)
This measures an entity’s ability to meet ongoing interest payments and ability to service debt.
The higher the ratio, the better the ability for the entity to meet its interest payments from borrowings.
Net operating cash flows before net interest and tax payments / Net interest payments
Internal financing (%)
This measures an entity’s ability to finance capital works using cash generated by the entity’s operating cash flows. The higher the percentage, the greater the ability for the entity to finance capital works from their own funds.
Net operating cash flows less dividends / Net capital expenditure
Current ratio This measures an entity’s ability to pay existing liabilities in the next 12 months.
A ratio greater than 1.0 means there are more cash and liquid assets than short-term liabilities.
Current assets / Current liabilities (excluding long-term employee provisions and revenue in advance)
EBITDA margin (%)
This is a measure of an entity’s ability to generate surplus to fund its operations. This measure is generally used for entities with significant fixed assets and/or debt financing.
The larger the EBITDA margin, the stronger the result.
Earnings before interest, tax, depreciation and amortisation / Total revenue
Net result margin (%)
This measures how much of each dollar collected as revenue translates to net result.
A positive result indicates a surplus, and the larger the percentage, the stronger the result.
Net result after tax / Total revenue
Long‐term financial sustainability indicators
Gearing ratio (%)
This is a longer-term measure that compares all current and non-current interest bearing liabilities to total assets. It complements the current ratio, which is a short-term measure.
A lower ratio indicates lesser reliance on debt to finance the entity’s assets.
Total debt (including finance leases) / Total assets
Return on assets (ROA) (%)
This ratio shows the percentage of profit the entity earns in relation to its overall resources.
A positive result indicates the entity’s resources are generating a surplus, and the larger the percentage, the stronger the result.
Earnings before net interest and tax / Average total assets
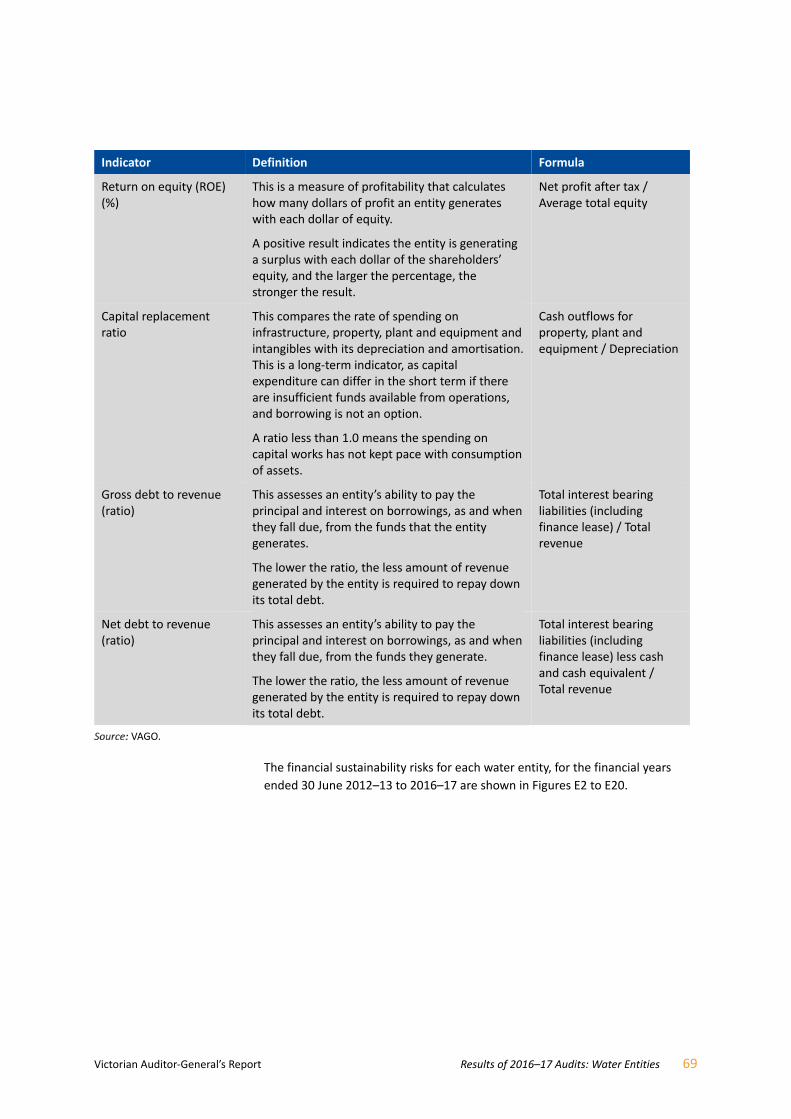
Victorian Auditor-General’s Report Results of 2016–17 Audits: Water Entities 69
Indicator Definition Formula
Return on equity (ROE) (%)
This is a measure of profitability that calculates how many dollars of profit an entity generates with each dollar of equity.
A positive result indicates the entity is generating a surplus with each dollar of the shareholders’ equity, and the larger the percentage, the stronger the result.
Net profit after tax / Average total equity
Capital replacement ratio
This compares the rate of spending on infrastructure, property, plant and equipment and intangibles with its depreciation and amortisation. This is a long-term indicator, as capital expenditure can differ in the short term if there are insufficient funds available from operations, and borrowing is not an option.
A ratio less than 1.0 means the spending on capital works has not kept pace with consumption of assets.
Cash outflows for property, plant and equipment / Depreciation
Gross debt to revenue (ratio)
This assesses an entity’s ability to pay the principal and interest on borrowings, as and when they fall due, from the funds that the entity generates.
The lower the ratio, the less amount of revenue generated by the entity is required to repay down its total debt.
Total interest bearing liabilities (including finance lease) / Total revenue
Net debt to revenue (ratio)
This assesses an entity’s ability to pay the principal and interest on borrowings, as and when they fall due, from the funds they generate.
The lower the ratio, the less amount of revenue generated by the entity is required to repay down its total debt.
Total interest bearing liabilities (including finance lease) less cash and cash equivalent / Total revenue
VAGO.
The financial sustainability risks for each water entity, for the financial years
ended 30 June 2012–13 to 2016–17 are shown in Figures E2 to E20.
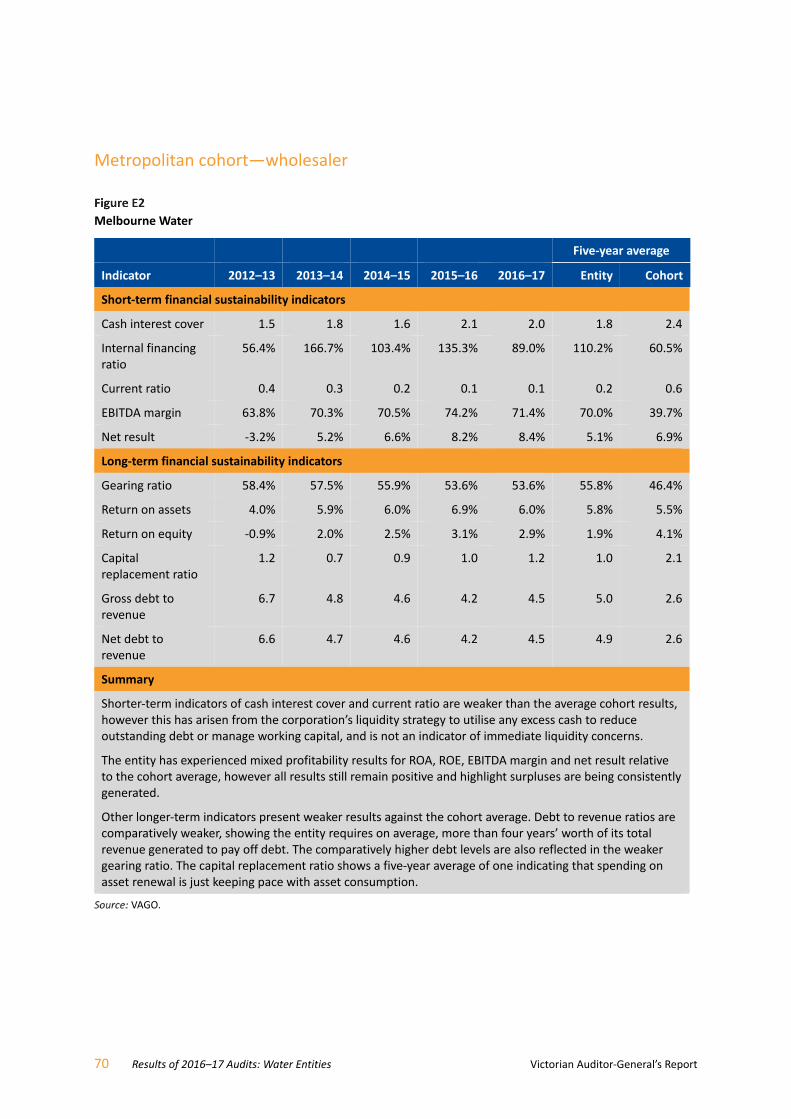
70 Results of 2016–17 Audits: Water Entities Victorian Auditor-General’s Report
Metropolitan cohort—wholesaler
Melbourne Water
Five‐year average
Indicator 2012–13 2013–14 2014–15 2015–16 2016–17 Entity Cohort
Short‐term financial sustainability indicators
Cash interest cover 1.5 1.8 1.6 2.1 2.0 1.8 2.4
Internal financing ratio
56.4% 166.7% 103.4% 135.3% 89.0% 110.2% 60.5%
Current ratio 0.4 0.3 0.2 0.1 0.1 0.2 0.6
EBITDA margin 63.8% 70.3% 70.5% 74.2% 71.4% 70.0% 39.7%
Net result -3.2% 5.2% 6.6% 8.2% 8.4% 5.1% 6.9%
Long‐term financial sustainability indicators
Gearing ratio 58.4% 57.5% 55.9% 53.6% 53.6% 55.8% 46.4%
Return on assets 4.0% 5.9% 6.0% 6.9% 6.0% 5.8% 5.5%
Return on equity -0.9% 2.0% 2.5% 3.1% 2.9% 1.9% 4.1%
Capital replacement ratio
1.2 0.7 0.9 1.0 1.2 1.0 2.1
Gross debt to revenue
6.7 4.8 4.6 4.2 4.5 5.0 2.6
Net debt to revenue
6.6 4.7 4.6 4.2 4.5 4.9 2.6
Summary
Shorter-term indicators of cash interest cover and current ratio are weaker than the average cohort results, however this has arisen from the corporation’s liquidity strategy to utilise any excess cash to reduce outstanding debt or manage working capital, and is not an indicator of immediate liquidity concerns.
The entity has experienced mixed profitability results for ROA, ROE, EBITDA margin and net result relative to the cohort average, however all results still remain positive and highlight surpluses are being consistently generated.
Other longer-term indicators present weaker results against the cohort average. Debt to revenue ratios are comparatively weaker, showing the entity requires on average, more than four years’ worth of its total revenue generated to pay off debt. The comparatively higher debt levels are also reflected in the weaker gearing ratio. The capital replacement ratio shows a five-year average of one indicating that spending on asset renewal is just keeping pace with asset consumption.
VAGO.
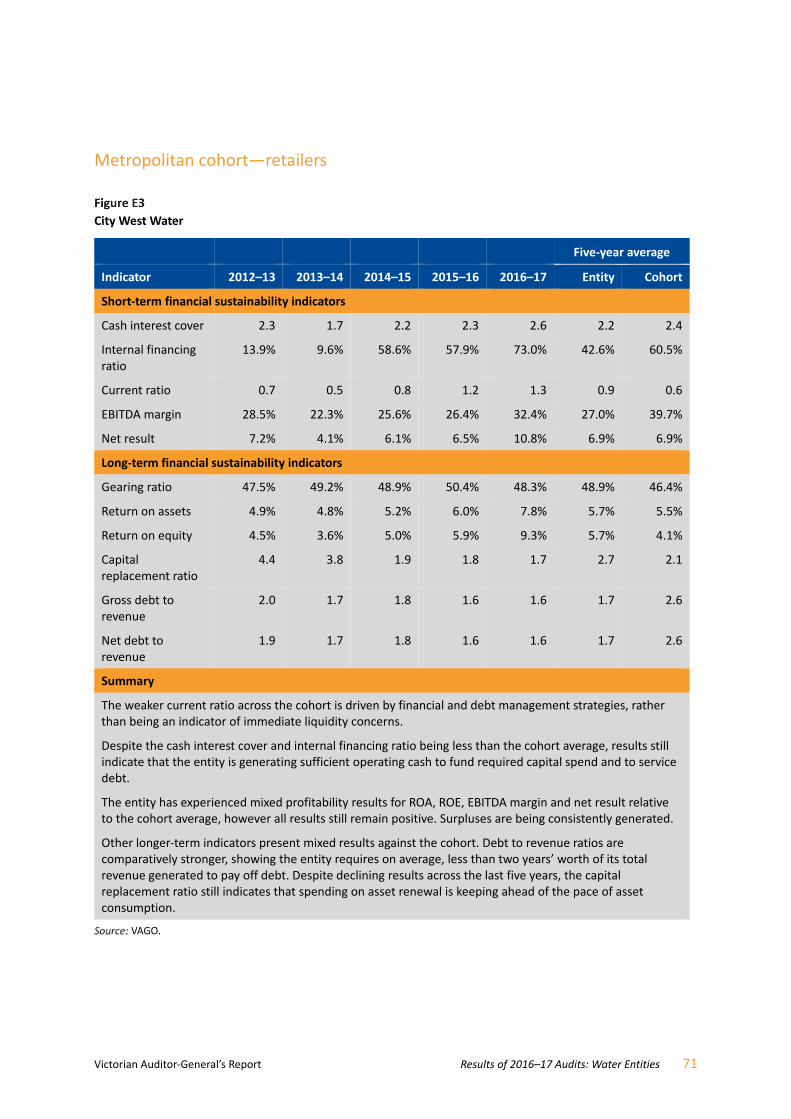
Victorian Auditor-General’s Report Results of 2016–17 Audits: Water Entities 71
Metropolitan cohort—retailers
City West Water
Five‐year average
Indicator 2012–13 2013–14 2014–15 2015–16 2016–17 Entity Cohort
Short‐term financial sustainability indicators
Cash interest cover 2.3 1.7 2.2 2.3 2.6 2.2 2.4
Internal financing ratio
13.9% 9.6% 58.6% 57.9% 73.0% 42.6% 60.5%
Current ratio 0.7 0.5 0.8 1.2 1.3 0.9 0.6
EBITDA margin 28.5% 22.3% 25.6% 26.4% 32.4% 27.0% 39.7%
Net result 7.2% 4.1% 6.1% 6.5% 10.8% 6.9% 6.9%
Long‐term financial sustainability indicators
Gearing ratio 47.5% 49.2% 48.9% 50.4% 48.3% 48.9% 46.4%
Return on assets 4.9% 4.8% 5.2% 6.0% 7.8% 5.7% 5.5%
Return on equity 4.5% 3.6% 5.0% 5.9% 9.3% 5.7% 4.1%
Capital replacement ratio
4.4 3.8 1.9 1.8 1.7 2.7 2.1
Gross debt to revenue
2.0 1.7 1.8 1.6 1.6 1.7 2.6
Net debt to revenue
1.9 1.7 1.8 1.6 1.6 1.7 2.6
Summary
The weaker current ratio across the cohort is driven by financial and debt management strategies, rather than being an indicator of immediate liquidity concerns.
Despite the cash interest cover and internal financing ratio being less than the cohort average, results still indicate that the entity is generating sufficient operating cash to fund required capital spend and to service debt.
The entity has experienced mixed profitability results for ROA, ROE, EBITDA margin and net result relative to the cohort average, however all results still remain positive. Surpluses are being consistently generated.
Other longer-term indicators present mixed results against the cohort. Debt to revenue ratios are comparatively stronger, showing the entity requires on average, less than two years’ worth of its total revenue generated to pay off debt. Despite declining results across the last five years, the capital replacement ratio still indicates that spending on asset renewal is keeping ahead of the pace of asset consumption.
VAGO.

72 Results of 2016–17 Audits: Water Entities Victorian Auditor-General’s Report
South East Water
Five‐year average
Indicator 2012–13 2013–14 2014–15 2015–16 2016–17 Entity Cohort
Short‐term financial sustainability indicators
Cash interest cover 3.2 2.8 3.4 3.1 3.4 3.2 2.4
Internal financing ratio
30.1% 38.5% 32.6% 65.2% 54.0% 44.1% 60.5%
Current ratio 0.7 0.6 0.9 0.9 1.1 0.8 0.6
EBITDA margin 29.7% 28.0% 30.1% 33.1% 35.2% 31.2% 39.7%
Net result 7.5% 9.6% 9.0% 11.6% 13.0% 10.2% 6.9%
Long‐term financial sustainability indicators
Gearing ratio 31.7% 33.1% 34.9% 35.8% 36.6% 34.4% 46.4%
Return on assets 4.2% 5.8% 5.4% 6.6% 6.9% 5.8% 5.5%
Return on equity 3.3% 5.7% 4.8% 6.7% 7.2% 5.5% 4.1%
Capital replacement ratio
2.4 2.6 2.9 1.8 1.8 2.3 2.1
Gross debt to revenue
1.5 1.2 1.4 1.3 1.4 1.4 2.6
Net debt to revenue
1.5 1.2 1.4 1.3 1.4 1.4 2.6
Summary
Shorter-term indicators of cash interest cover and current ratio have recorded positive results relative to the five-year average for the cohort. Despite the internal financing ratio being less than the cohort average, results still indicate that the entity is generating sufficient operating cash to fund required capital spend.
The entity has experienced mixed profitability results for ROA, ROE, EBITDA margin and net result relative to the cohort average, however all results remain positive. Surpluses are being consistently generated.
Other longer-term indicators present positive results against the cohort. This is highlighted by relatively stronger gearing and debt to revenue ratios, showing the entity requires on average, less than 1.5 years’ worth of its total revenue generated to pay off debt. Despite weaker results in the latest two years, the average capital replacement ratio is comparatively stronger, indicating that spending on asset renewal is keeping ahead of the pace of asset consumption.
VAGO.
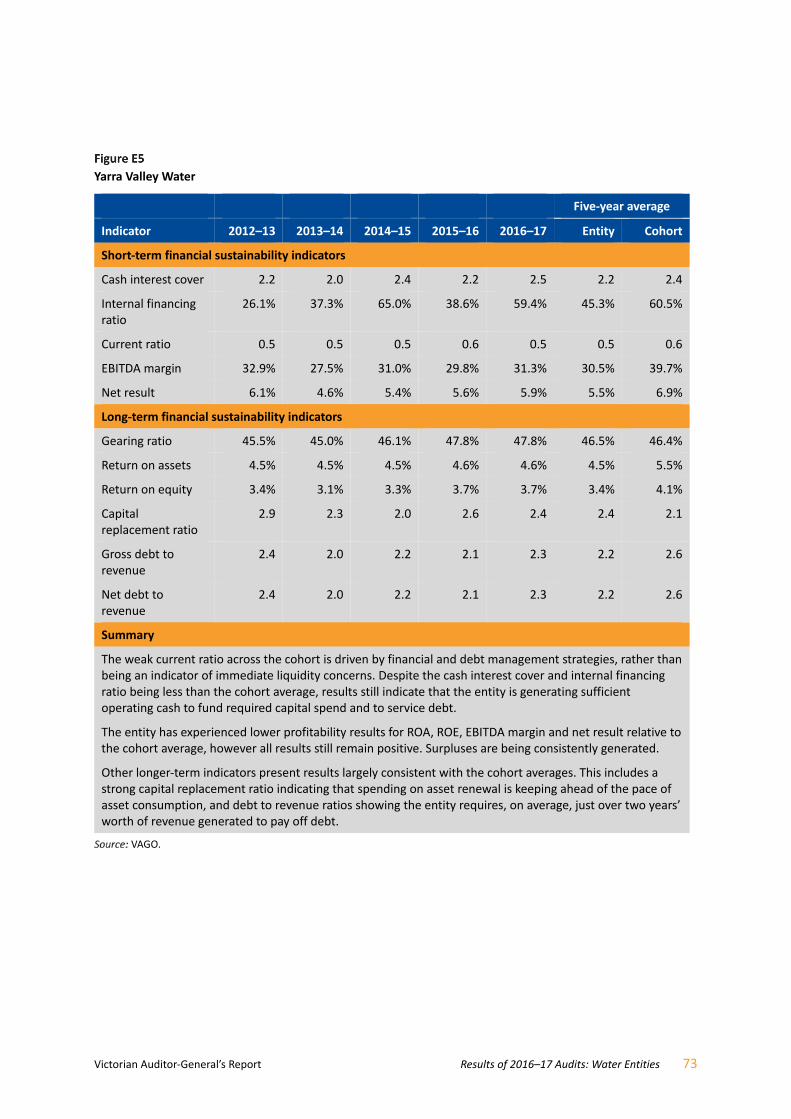
Victorian Auditor-General’s Report Results of 2016–17 Audits: Water Entities 73
Yarra Valley Water
Five‐year average
Indicator 2012–13 2013–14 2014–15 2015–16 2016–17 Entity Cohort
Short‐term financial sustainability indicators
Cash interest cover 2.2 2.0 2.4 2.2 2.5 2.2 2.4
Internal financing ratio
26.1% 37.3% 65.0% 38.6% 59.4% 45.3% 60.5%
Current ratio 0.5 0.5 0.5 0.6 0.5 0.5 0.6
EBITDA margin 32.9% 27.5% 31.0% 29.8% 31.3% 30.5% 39.7%
Net result 6.1% 4.6% 5.4% 5.6% 5.9% 5.5% 6.9%
Long‐term financial sustainability indicators
Gearing ratio 45.5% 45.0% 46.1% 47.8% 47.8% 46.5% 46.4%
Return on assets 4.5% 4.5% 4.5% 4.6% 4.6% 4.5% 5.5%
Return on equity 3.4% 3.1% 3.3% 3.7% 3.7% 3.4% 4.1%
Capital replacement ratio
2.9 2.3 2.0 2.6 2.4 2.4 2.1
Gross debt to revenue
2.4 2.0 2.2 2.1 2.3 2.2 2.6
Net debt to revenue
2.4 2.0 2.2 2.1 2.3 2.2 2.6
Summary
The weak current ratio across the cohort is driven by financial and debt management strategies, rather than being an indicator of immediate liquidity concerns. Despite the cash interest cover and internal financing ratio being less than the cohort average, results still indicate that the entity is generating sufficient operating cash to fund required capital spend and to service debt.
The entity has experienced lower profitability results for ROA, ROE, EBITDA margin and net result relative to the cohort average, however all results still remain positive. Surpluses are being consistently generated.
Other longer-term indicators present results largely consistent with the cohort averages. This includes a strong capital replacement ratio indicating that spending on asset renewal is keeping ahead of the pace of asset consumption, and debt to revenue ratios showing the entity requires, on average, just over two years’ worth of revenue generated to pay off debt.
VAGO.
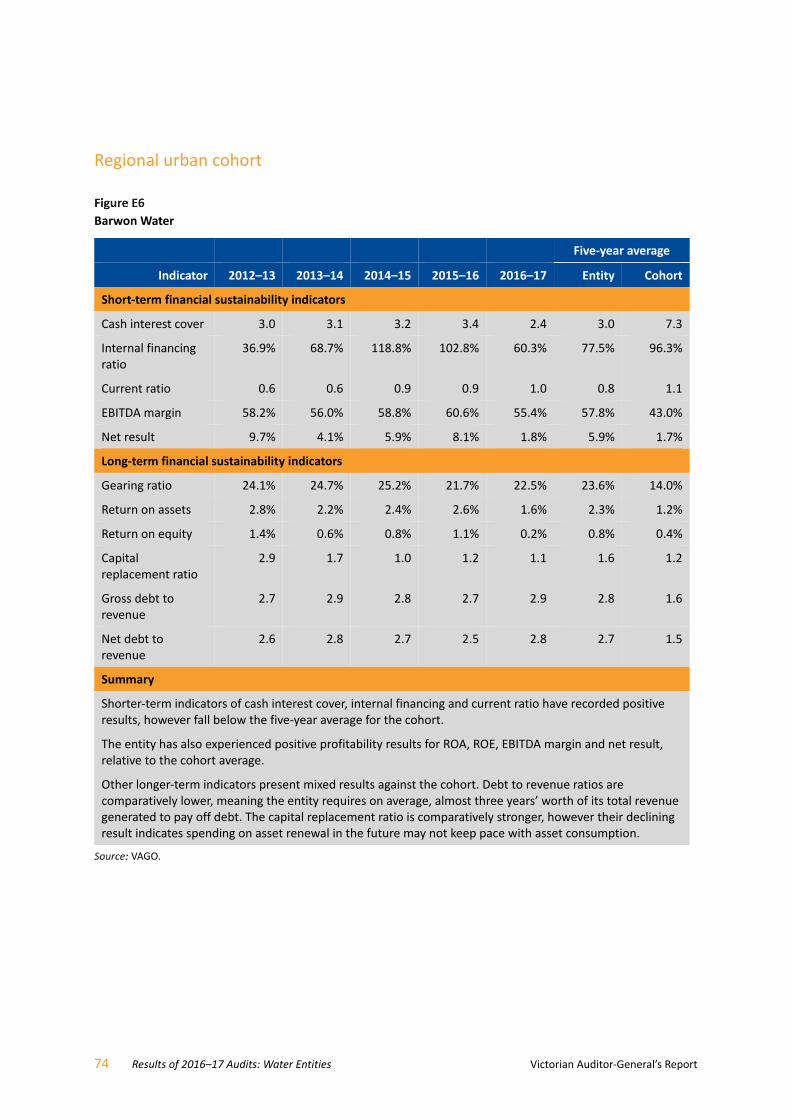
74 Results of 2016–17 Audits: Water Entities Victorian Auditor-General’s Report
Regional urban cohort
Barwon Water
Five‐year average
Indicator 2012–13 2013–14 2014–15 2015–16 2016–17 Entity Cohort
Short‐term financial sustainability indicators
Cash interest cover 3.0 3.1 3.2 3.4 2.4 3.0 7.3
Internal financing ratio
36.9% 68.7% 118.8% 102.8% 60.3% 77.5% 96.3%
Current ratio 0.6 0.6 0.9 0.9 1.0 0.8 1.1
EBITDA margin 58.2% 56.0% 58.8% 60.6% 55.4% 57.8% 43.0%
Net result 9.7% 4.1% 5.9% 8.1% 1.8% 5.9% 1.7%
Long‐term financial sustainability indicators
Gearing ratio 24.1% 24.7% 25.2% 21.7% 22.5% 23.6% 14.0%
Return on assets 2.8% 2.2% 2.4% 2.6% 1.6% 2.3% 1.2%
Return on equity 1.4% 0.6% 0.8% 1.1% 0.2% 0.8% 0.4%
Capital replacement ratio
2.9 1.7 1.0 1.2 1.1 1.6 1.2
Gross debt to revenue
2.7 2.9 2.8 2.7 2.9 2.8 1.6
Net debt to revenue
2.6 2.8 2.7 2.5 2.8 2.7 1.5
Summary
Shorter-term indicators of cash interest cover, internal financing and current ratio have recorded positive results, however fall below the five-year average for the cohort.
The entity has also experienced positive profitability results for ROA, ROE, EBITDA margin and net result, relative to the cohort average.
Other longer-term indicators present mixed results against the cohort. Debt to revenue ratios are comparatively lower, meaning the entity requires on average, almost three years’ worth of its total revenue generated to pay off debt. The capital replacement ratio is comparatively stronger, however their declining result indicates spending on asset renewal in the future may not keep pace with asset consumption.
VAGO.
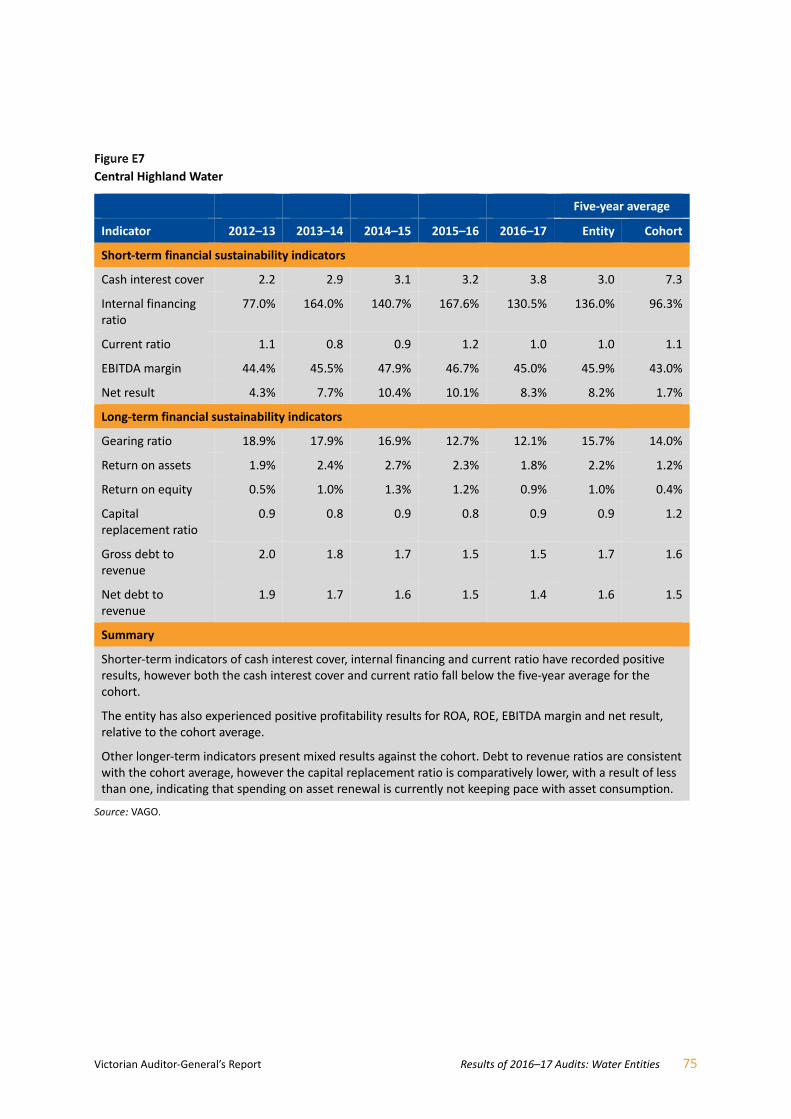
Victorian Auditor-General’s Report Results of 2016–17 Audits: Water Entities 75
Central Highland Water
Five‐year average
Indicator 2012–13 2013–14 2014–15 2015–16 2016–17 Entity Cohort
Short‐term financial sustainability indicators
Cash interest cover 2.2 2.9 3.1 3.2 3.8 3.0 7.3
Internal financing ratio
77.0% 164.0% 140.7% 167.6% 130.5% 136.0% 96.3%
Current ratio 1.1 0.8 0.9 1.2 1.0 1.0 1.1
EBITDA margin 44.4% 45.5% 47.9% 46.7% 45.0% 45.9% 43.0%
Net result 4.3% 7.7% 10.4% 10.1% 8.3% 8.2% 1.7%
Long‐term financial sustainability indicators
Gearing ratio 18.9% 17.9% 16.9% 12.7% 12.1% 15.7% 14.0%
Return on assets 1.9% 2.4% 2.7% 2.3% 1.8% 2.2% 1.2%
Return on equity 0.5% 1.0% 1.3% 1.2% 0.9% 1.0% 0.4%
Capital replacement ratio
0.9 0.8 0.9 0.8 0.9 0.9 1.2
Gross debt to revenue
2.0 1.8 1.7 1.5 1.5 1.7 1.6
Net debt to revenue
1.9 1.7 1.6 1.5 1.4 1.6 1.5
Summary
Shorter-term indicators of cash interest cover, internal financing and current ratio have recorded positive results, however both the cash interest cover and current ratio fall below the five-year average for the cohort.
The entity has also experienced positive profitability results for ROA, ROE, EBITDA margin and net result, relative to the cohort average.
Other longer-term indicators present mixed results against the cohort. Debt to revenue ratios are consistent with the cohort average, however the capital replacement ratio is comparatively lower, with a result of less than one, indicating that spending on asset renewal is currently not keeping pace with asset consumption.
VAGO.
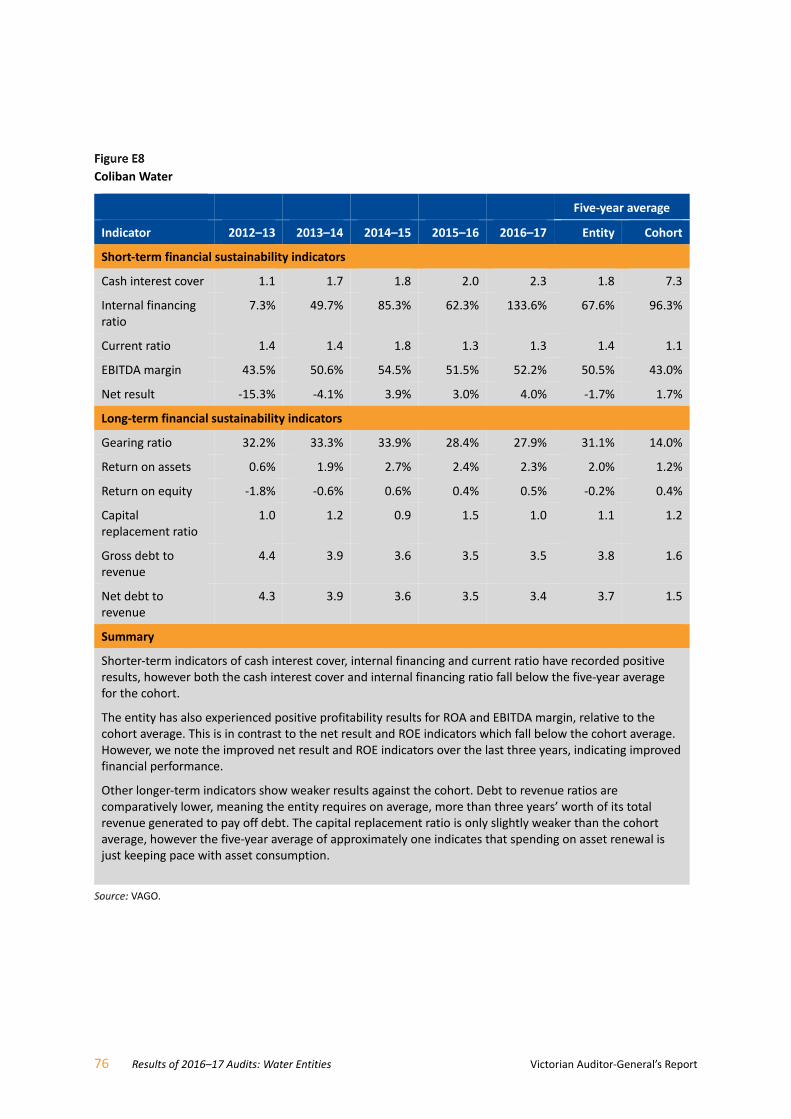
76 Results of 2016–17 Audits: Water Entities Victorian Auditor-General’s Report
Coliban Water
Five‐year average
Indicator 2012–13 2013–14 2014–15 2015–16 2016–17 Entity Cohort
Short‐term financial sustainability indicators
Cash interest cover 1.1 1.7 1.8 2.0 2.3 1.8 7.3
Internal financing ratio
7.3% 49.7% 85.3% 62.3% 133.6% 67.6% 96.3%
Current ratio 1.4 1.4 1.8 1.3 1.3 1.4 1.1
EBITDA margin 43.5% 50.6% 54.5% 51.5% 52.2% 50.5% 43.0%
Net result -15.3% -4.1% 3.9% 3.0% 4.0% -1.7% 1.7%
Long‐term financial sustainability indicators
Gearing ratio 32.2% 33.3% 33.9% 28.4% 27.9% 31.1% 14.0%
Return on assets 0.6% 1.9% 2.7% 2.4% 2.3% 2.0% 1.2%
Return on equity -1.8% -0.6% 0.6% 0.4% 0.5% -0.2% 0.4%
Capital replacement ratio
1.0 1.2 0.9 1.5 1.0 1.1 1.2
Gross debt to revenue
4.4 3.9 3.6 3.5 3.5 3.8 1.6
Net debt to revenue
4.3 3.9 3.6 3.5 3.4 3.7 1.5
Summary
Shorter-term indicators of cash interest cover, internal financing and current ratio have recorded positive results, however both the cash interest cover and internal financing ratio fall below the five-year average for the cohort.
The entity has also experienced positive profitability results for ROA and EBITDA margin, relative to the cohort average. This is in contrast to the net result and ROE indicators which fall below the cohort average. However, we note the improved net result and ROE indicators over the last three years, indicating improved financial performance.
Other longer-term indicators show weaker results against the cohort. Debt to revenue ratios are comparatively lower, meaning the entity requires on average, more than three years’ worth of its total revenue generated to pay off debt. The capital replacement ratio is only slightly weaker than the cohort average, however the five-year average of approximately one indicates that spending on asset renewal is just keeping pace with asset consumption.
VAGO.

Victorian Auditor-General’s Report Results of 2016–17 Audits: Water Entities 77
East Gippsland Water
Five‐year average
Indicator 2012–13 2013–14 2014–15 2015–16 2016–17 Entity Cohort
Short‐term financial sustainability indicators
Cash interest cover 7.3 7.8 11.1 11.8 16.2 10.8 7.3
Internal financing ratio
176.0% 121.4% 150.5% 154.3% 126.5% 145.7% 96.3%
Current ratio 0.7 1.0 1.3 1.7 0.9 1.1 1.1
EBITDA margin 48.2% 47.0% 47.4% 39.7% 41.9% 44.8% 43.0%
Net result 8.6% 8.5% 9.0% 4.3% 3.5% 6.8% 1.7%
Long‐term financial sustainability indicators
Gearing ratio 8.7% 7.6% 5.9% 3.9% 3.2% 5.9% 14.0%
Return on assets 1.7% 1.7% 1.7% 0.8% 0.6% 1.3% 1.2%
Return on equity 1.1% 1.1% 1.2% 0.4% 0.3% 0.8% 0.4%
Capital replacement ratio
0.7 1.0 1.0 0.7 1.0 0.9 1.2
Gross debt to revenue
0.9 0.8 0.6 0.6 0.4 0.7 1.6
Net debt to revenue
0.8 0.7 0.5 0.4 0.3 0.5 1.5
Summary
Shorter-term indicators of cash interest cover, internal financing and current ratio have recorded positive results. However, the current ratio is relatively lower in 2016–17 compared to the entity’s historical performance.
The entity has also experienced positive profitability results for EBITDA margin and net result, relative to the cohort average.
Longer-term indicators present mixed results against the cohort. Debt to revenue ratios across the five-year period are relatively stronger against the average cohort results, where the entity on average will only require less than one year worth of its total revenue generated to pay down its debt. In contrast, the capital replacement ratio is comparatively lower, with the entity’s average results falling below 1.0 and further behind the average cohort, indicating that spending on asset renewal is not keeping pace with asset consumption.
VAGO.
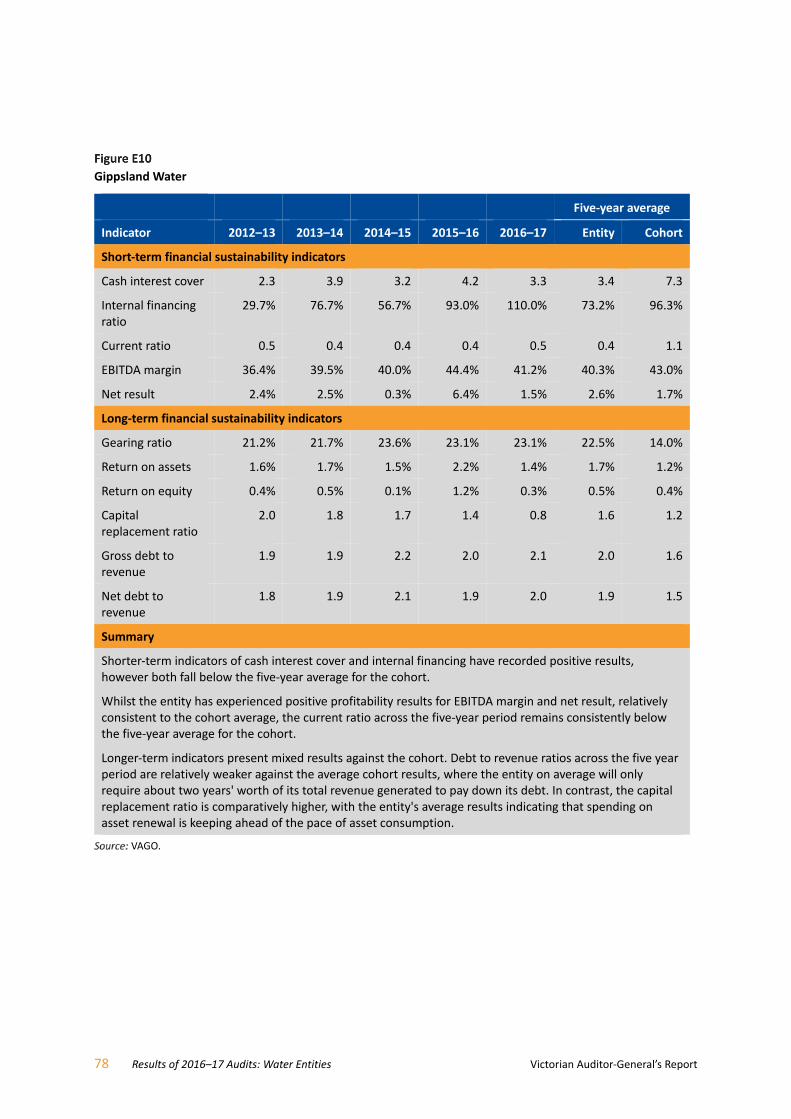
78 Results of 2016–17 Audits: Water Entities Victorian Auditor-General’s Report
Gippsland Water
Five‐year average
Indicator 2012–13 2013–14 2014–15 2015–16 2016–17 Entity Cohort
Short‐term financial sustainability indicators
Cash interest cover 2.3 3.9 3.2 4.2 3.3 3.4 7.3
Internal financing ratio
29.7% 76.7% 56.7% 93.0% 110.0% 73.2% 96.3%
Current ratio 0.5 0.4 0.4 0.4 0.5 0.4 1.1
EBITDA margin 36.4% 39.5% 40.0% 44.4% 41.2% 40.3% 43.0%
Net result 2.4% 2.5% 0.3% 6.4% 1.5% 2.6% 1.7%
Long‐term financial sustainability indicators
Gearing ratio 21.2% 21.7% 23.6% 23.1% 23.1% 22.5% 14.0%
Return on assets 1.6% 1.7% 1.5% 2.2% 1.4% 1.7% 1.2%
Return on equity 0.4% 0.5% 0.1% 1.2% 0.3% 0.5% 0.4%
Capital replacement ratio
2.0 1.8 1.7 1.4 0.8 1.6 1.2
Gross debt to revenue
1.9 1.9 2.2 2.0 2.1 2.0 1.6
Net debt to revenue
1.8 1.9 2.1 1.9 2.0 1.9 1.5
Summary
Shorter-term indicators of cash interest cover and internal financing have recorded positive results, however both fall below the five-year average for the cohort.
Whilst the entity has experienced positive profitability results for EBITDA margin and net result, relatively consistent to the cohort average, the current ratio across the five-year period remains consistently below the five-year average for the cohort.
Longer-term indicators present mixed results against the cohort. Debt to revenue ratios across the five year period are relatively weaker against the average cohort results, where the entity on average will only require about two years' worth of its total revenue generated to pay down its debt. In contrast, the capital replacement ratio is comparatively higher, with the entity's average results indicating that spending on asset renewal is keeping ahead of the pace of asset consumption.
VAGO.
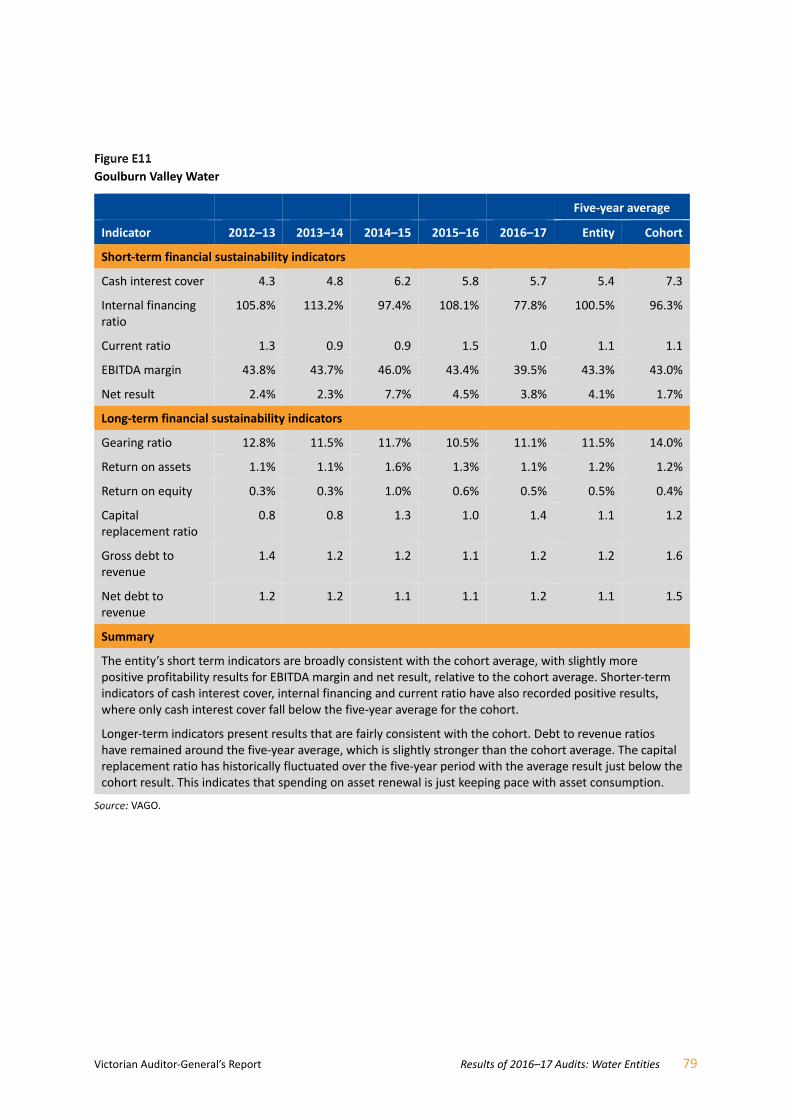
Victorian Auditor-General’s Report Results of 2016–17 Audits: Water Entities 79
Goulburn Valley Water
Five‐year average
Indicator 2012–13 2013–14 2014–15 2015–16 2016–17 Entity Cohort
Short‐term financial sustainability indicators
Cash interest cover 4.3 4.8 6.2 5.8 5.7 5.4 7.3
Internal financing ratio
105.8% 113.2% 97.4% 108.1% 77.8% 100.5% 96.3%
Current ratio 1.3 0.9 0.9 1.5 1.0 1.1 1.1
EBITDA margin 43.8% 43.7% 46.0% 43.4% 39.5% 43.3% 43.0%
Net result 2.4% 2.3% 7.7% 4.5% 3.8% 4.1% 1.7%
Long‐term financial sustainability indicators
Gearing ratio 12.8% 11.5% 11.7% 10.5% 11.1% 11.5% 14.0%
Return on assets 1.1% 1.1% 1.6% 1.3% 1.1% 1.2% 1.2%
Return on equity 0.3% 0.3% 1.0% 0.6% 0.5% 0.5% 0.4%
Capital replacement ratio
0.8 0.8 1.3 1.0 1.4 1.1 1.2
Gross debt to revenue
1.4 1.2 1.2 1.1 1.2 1.2 1.6
Net debt to revenue
1.2 1.2 1.1 1.1 1.2 1.1 1.5
Summary
The entity’s short term indicators are broadly consistent with the cohort average, with slightly more positive profitability results for EBITDA margin and net result, relative to the cohort average. Shorter-term indicators of cash interest cover, internal financing and current ratio have also recorded positive results, where only cash interest cover fall below the five-year average for the cohort.
Longer-term indicators present results that are fairly consistent with the cohort. Debt to revenue ratios have remained around the five-year average, which is slightly stronger than the cohort average. The capital replacement ratio has historically fluctuated over the five-year period with the average result just below the cohort result. This indicates that spending on asset renewal is just keeping pace with asset consumption.
VAGO.
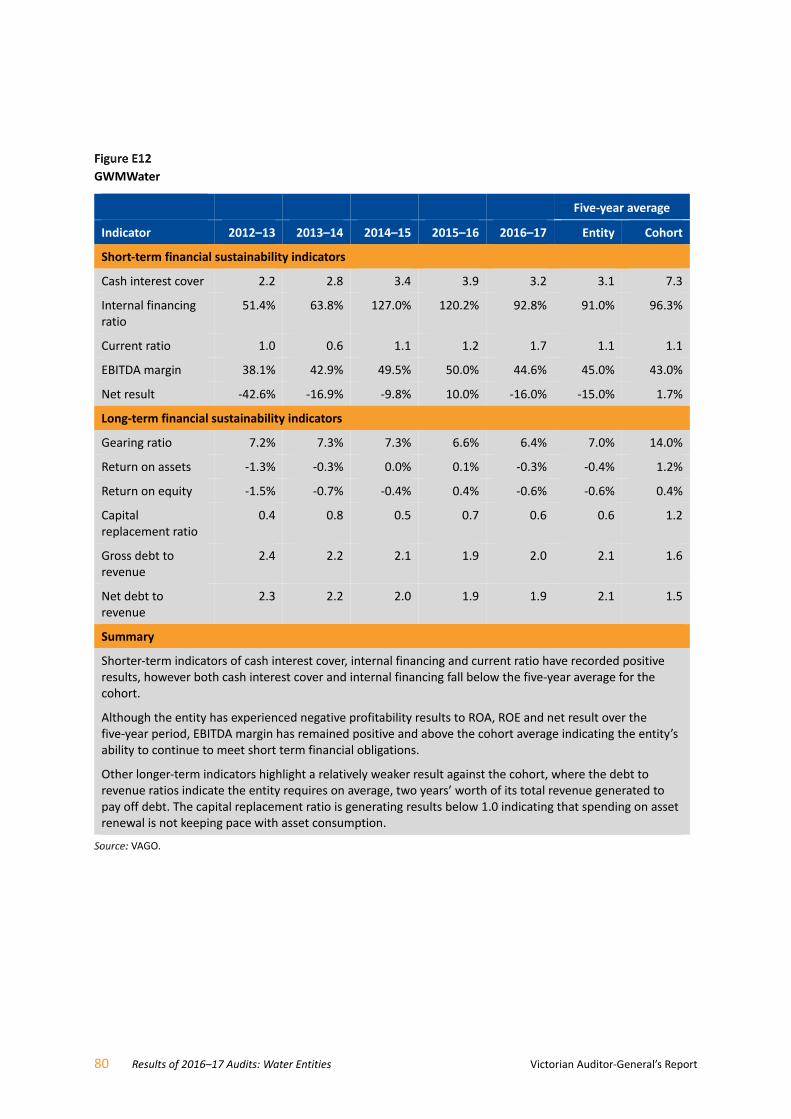
80 Results of 2016–17 Audits: Water Entities Victorian Auditor-General’s Report
GWMWater
Five‐year average
Indicator 2012–13 2013–14 2014–15 2015–16 2016–17 Entity Cohort
Short‐term financial sustainability indicators
Cash interest cover 2.2 2.8 3.4 3.9 3.2 3.1 7.3
Internal financing ratio
51.4% 63.8% 127.0% 120.2% 92.8% 91.0% 96.3%
Current ratio 1.0 0.6 1.1 1.2 1.7 1.1 1.1
EBITDA margin 38.1% 42.9% 49.5% 50.0% 44.6% 45.0% 43.0%
Net result -42.6% -16.9% -9.8% 10.0% -16.0% -15.0% 1.7%
Long‐term financial sustainability indicators
Gearing ratio 7.2% 7.3% 7.3% 6.6% 6.4% 7.0% 14.0%
Return on assets -1.3% -0.3% 0.0% 0.1% -0.3% -0.4% 1.2%
Return on equity -1.5% -0.7% -0.4% 0.4% -0.6% -0.6% 0.4%
Capital replacement ratio
0.4 0.8 0.5 0.7 0.6 0.6 1.2
Gross debt to revenue
2.4 2.2 2.1 1.9 2.0 2.1 1.6
Net debt to revenue
2.3 2.2 2.0 1.9 1.9 2.1 1.5
Summary
Shorter-term indicators of cash interest cover, internal financing and current ratio have recorded positive results, however both cash interest cover and internal financing fall below the five-year average for the cohort.
Although the entity has experienced negative profitability results to ROA, ROE and net result over the five-year period, EBITDA margin has remained positive and above the cohort average indicating the entity’s ability to continue to meet short term financial obligations.
Other longer-term indicators highlight a relatively weaker result against the cohort, where the debt to revenue ratios indicate the entity requires on average, two years’ worth of its total revenue generated to pay off debt. The capital replacement ratio is generating results below 1.0 indicating that spending on asset renewal is not keeping pace with asset consumption.
VAGO.
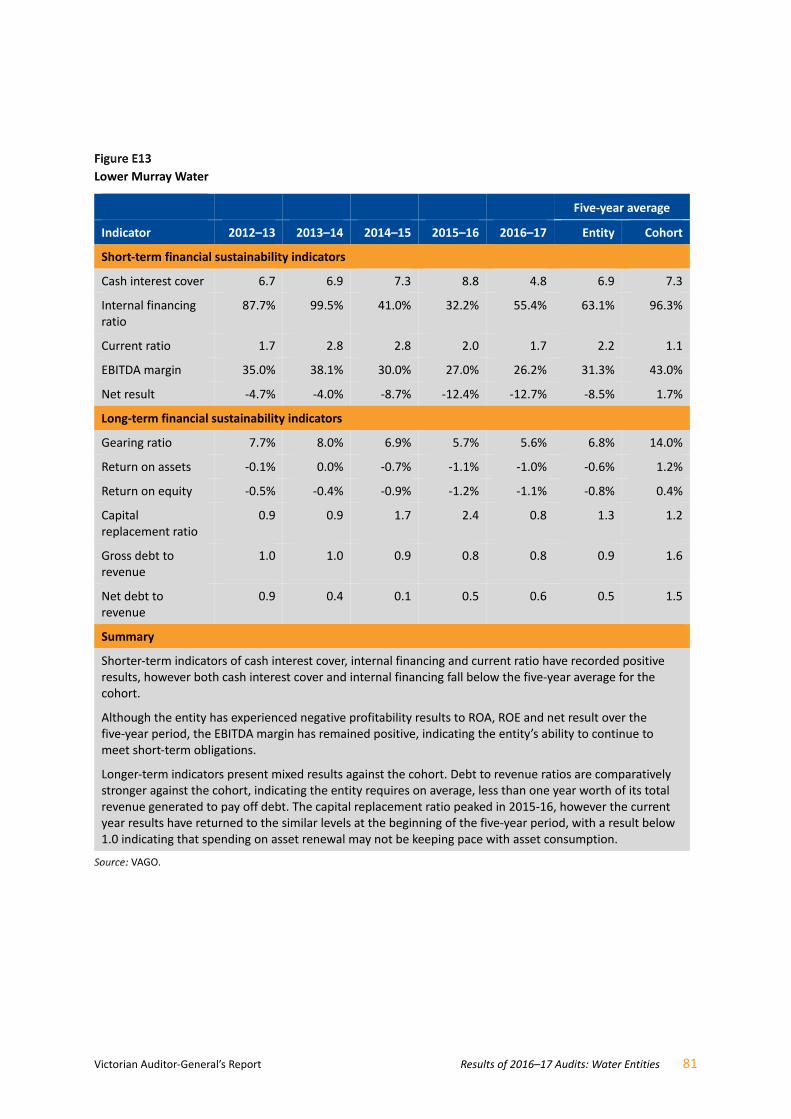
Victorian Auditor-General’s Report Results of 2016–17 Audits: Water Entities 81
Lower Murray Water
Five‐year average
Indicator 2012–13 2013–14 2014–15 2015–16 2016–17 Entity Cohort
Short‐term financial sustainability indicators
Cash interest cover 6.7 6.9 7.3 8.8 4.8 6.9 7.3
Internal financing ratio
87.7% 99.5% 41.0% 32.2% 55.4% 63.1% 96.3%
Current ratio 1.7 2.8 2.8 2.0 1.7 2.2 1.1
EBITDA margin 35.0% 38.1% 30.0% 27.0% 26.2% 31.3% 43.0%
Net result -4.7% -4.0% -8.7% -12.4% -12.7% -8.5% 1.7%
Long‐term financial sustainability indicators
Gearing ratio 7.7% 8.0% 6.9% 5.7% 5.6% 6.8% 14.0%
Return on assets -0.1% 0.0% -0.7% -1.1% -1.0% -0.6% 1.2%
Return on equity -0.5% -0.4% -0.9% -1.2% -1.1% -0.8% 0.4%
Capital replacement ratio
0.9 0.9 1.7 2.4 0.8 1.3 1.2
Gross debt to revenue
1.0 1.0 0.9 0.8 0.8 0.9 1.6
Net debt to revenue
0.9 0.4 0.1 0.5 0.6 0.5 1.5
Summary
Shorter-term indicators of cash interest cover, internal financing and current ratio have recorded positive results, however both cash interest cover and internal financing fall below the five-year average for the cohort.
Although the entity has experienced negative profitability results to ROA, ROE and net result over the five-year period, the EBITDA margin has remained positive, indicating the entity’s ability to continue to meet short-term obligations.
Longer-term indicators present mixed results against the cohort. Debt to revenue ratios are comparatively stronger against the cohort, indicating the entity requires on average, less than one year worth of its total revenue generated to pay off debt. The capital replacement ratio peaked in 2015-16, however the current year results have returned to the similar levels at the beginning of the five-year period, with a result below 1.0 indicating that spending on asset renewal may not be keeping pace with asset consumption.
VAGO.
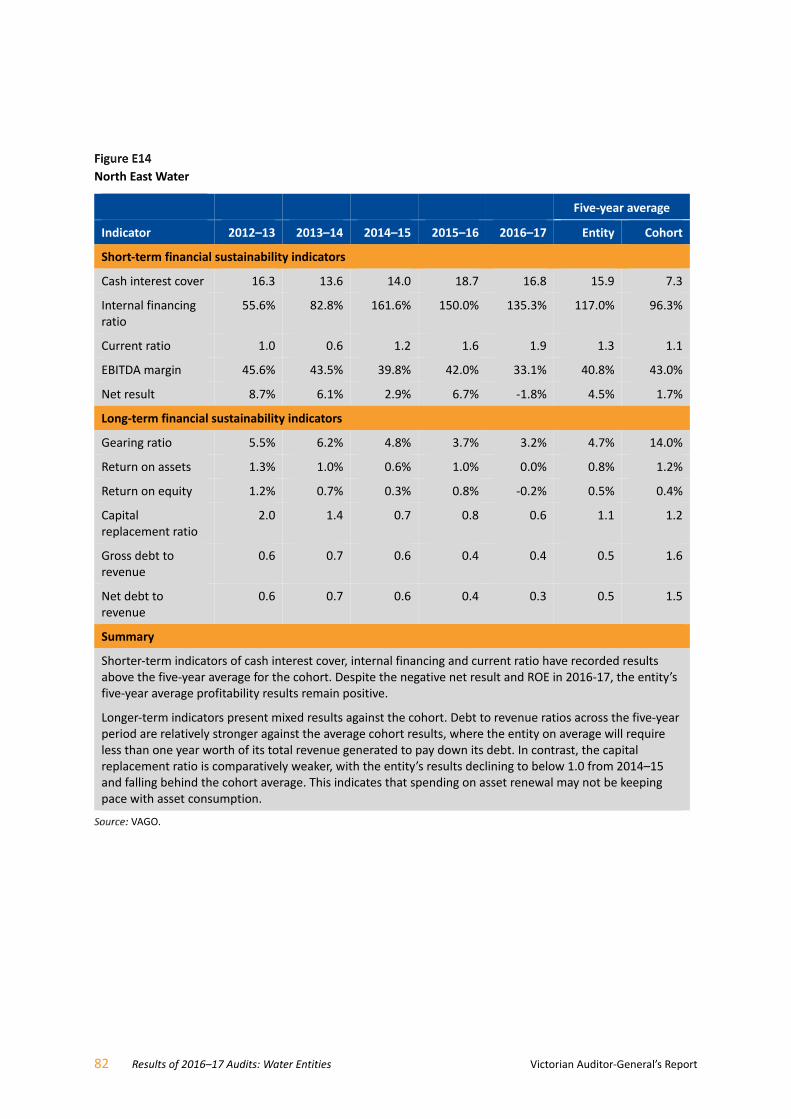
82 Results of 2016–17 Audits: Water Entities Victorian Auditor-General’s Report
North East Water
Five‐year average
Indicator 2012–13 2013–14 2014–15 2015–16 2016–17 Entity Cohort
Short‐term financial sustainability indicators
Cash interest cover 16.3 13.6 14.0 18.7 16.8 15.9 7.3
Internal financing ratio
55.6% 82.8% 161.6% 150.0% 135.3% 117.0% 96.3%
Current ratio 1.0 0.6 1.2 1.6 1.9 1.3 1.1
EBITDA margin 45.6% 43.5% 39.8% 42.0% 33.1% 40.8% 43.0%
Net result 8.7% 6.1% 2.9% 6.7% -1.8% 4.5% 1.7%
Long‐term financial sustainability indicators
Gearing ratio 5.5% 6.2% 4.8% 3.7% 3.2% 4.7% 14.0%
Return on assets 1.3% 1.0% 0.6% 1.0% 0.0% 0.8% 1.2%
Return on equity 1.2% 0.7% 0.3% 0.8% -0.2% 0.5% 0.4%
Capital replacement ratio
2.0 1.4 0.7 0.8 0.6 1.1 1.2
Gross debt to revenue
0.6 0.7 0.6 0.4 0.4 0.5 1.6
Net debt to revenue
0.6 0.7 0.6 0.4 0.3 0.5 1.5
Summary
Shorter-term indicators of cash interest cover, internal financing and current ratio have recorded results above the five-year average for the cohort. Despite the negative net result and ROE in 2016-17, the entity’s five-year average profitability results remain positive.
Longer-term indicators present mixed results against the cohort. Debt to revenue ratios across the five-year period are relatively stronger against the average cohort results, where the entity on average will require less than one year worth of its total revenue generated to pay down its debt. In contrast, the capital replacement ratio is comparatively weaker, with the entity’s results declining to below 1.0 from 2014–15 and falling behind the cohort average. This indicates that spending on asset renewal may not be keeping pace with asset consumption.
VAGO.

Victorian Auditor-General’s Report Results of 2016–17 Audits: Water Entities 83
South Gippsland Water
Five‐year average
Indicator 2012–13 2013–14 2014–15 2015–16 2016–17 Entity Cohort
Short‐term financial sustainability indicators
Cash interest cover 3.6 4.6 3.9 2.8 3.9 3.8 7.3
Internal financing ratio
74.6% 68.6% 38.4% 71.9% 81.5% 67.0% 96.3%
Current ratio 1.0 0.6 1.1 1.3 1.2 1.1 1.1
EBITDA margin 40.5% 41.1% 42.5% 35.4% 31.0% 38.1% 43.0%
Net result -1.0% -0.9% 1.5% -3.1% -14.3% -3.6% 1.7%
Long‐term financial sustainability indicators
Gearing ratio 12.8% 12.5% 15.8% 13.3% 12.7% 13.4% 14.0%
Return on assets 0.6% 0.6% 0.9% 0.3% -0.6% 0.4% 1.2%
Return on equity -0.1% -0.1% 0.2% -0.4% -1.4% -0.4% 0.4%
Capital replacement ratio
1.0 1.3 2.0 0.9 0.9 1.2 1.2
Gross debt to revenue
1.4 1.5 1.9 1.9 1.9 1.7 1.6
Net debt to revenue
1.2 1.4 1.7 1.8 1.7 1.6 1.5
Summary
Shorter-term indicators of cash interest cover, internal financing and current ratio have recorded positive results, however both cash interest cover and internal financing fall below the five-year average for the cohort.
The entity’s five-year average profitability results for EBITDA and ROA remain positive, showing the entity has the ability to continue to meet short-term needs, despite generating a negative five-year average net result.
Longer-term indicator results are relatively consistent with the cohort. Debt to revenue ratios across the five-year period are slightly weaker than the average cohort, where the entity, on average, will require just over 1.5 years’ worth of its total revenue generated to pay down its debt. Whilst the capital replacement ratio is equal to the cohort, results falling below 1.0 over the last two years indicate that spending on asset renewal may not be keeping pace with asset consumption.
VAGO.

84 Results of 2016–17 Audits: Water Entities Victorian Auditor-General’s Report
Wannon Water
Five‐year average
Indicator 2012–13 2013–14 2014–15 2015–16 2016–17 Entity Cohort
Short‐term financial sustainability indicators
Cash interest cover 6.5 6.7 8.2 10.6 10.4 8.5 7.3
Internal financing ratio
113.0% 130.5% 177.0% 202.7% 113.4% 147.3% 96.3%
Current ratio 1.1 1.0 1.2 1.3 1.0 1.1 1.1
EBITDA margin 48.1% 42.3% 41.5% 43.6% 36.9% 42.5% 43.0%
Net result 8.6% 2.0% 6.9% 7.1% 2.9% 5.5% 1.7%
Long‐term financial sustainability indicators
Gearing ratio 14.8% 13.3% 11.5% 7.0% 5.8% 10.5% 14.0%
Return on assets 2.3% 1.2% 1.5% 1.7% 0.7% 1.5% 1.2%
Return on equity 1.4% 0.3% 1.1% 1.0% 0.4% 0.8% 0.4%
Capital replacement ratio
1.0 0.8 0.7 0.8 1.0 0.9 1.2
Gross debt to revenue
1.2 1.1 0.9 0.7 0.6 0.9 1.6
Net debt to revenue
1.1 1.1 0.9 0.6 0.6 0.8 1.5
Summary
Shorter-term indicators of cash interest cover, internal financing and current ratio have recorded better or equal results relative to the five-year average for the cohort.
Positive average profitability results for ROA, ROE, EBITDA margin and net result, relative to the cohort average are also evident.
Other longer-term indicators present mixed results against the cohort. Debt to revenue ratios across the five-year period are relatively stronger against the average cohort results, where the entity on average, requires less than one year worth of its total revenue generated to pay down debt. In contrast, the capital replacement ratio is comparatively lower, with the entity’s average results falling below 1.0 indicating that spending on asset renewal may not be keeping pace with asset consumption.
VAGO.

Victorian Auditor-General’s Report Results of 2016–17 Audits: Water Entities 85
Western Water
Five‐year average
Indicator 2012–13 2013–14 2014–15 2015–16 2016–17 Entity Cohort
Short‐term financial sustainability indicators
Cash interest cover 1.5 2.2 2.9 2.8 2.8 2.4 7.3
Internal financing ratio
20.5% 61.2% 118.0% 59.1% 27.5% 57.3% 96.3%
Current ratio 0.7 0.5 1.1 1.1 0.5 0.8 1.1
EBITDA margin 36.5% 38.4% 49.6% 47.3% 48.1% 44.0% 43.0%
Net result 3.5% 1.4% 10.0% 12.7% 10.4% 7.6% 1.7%
Long‐term financial sustainability indicators
Gearing ratio 24.3% 24.6% 25.1% 22.3% 24.6% 24.2% 14.0%
Return on assets 2.1% 1.8% 3.1% 3.8% 3.2% 2.8% 1.2%
Return on equity 0.7% 0.3% 1.9% 2.7% 2.1% 1.5% 0.4%
Capital replacement ratio
1.7 1.1 0.9 1.7 2.6 1.6 1.2
Gross debt to revenue
2.1 2.3 2.2 1.8 2.1 2.1 1.6
Net debt to revenue
1.9 2.1 2.0 1.7 2.1 2.0 1.5
Summary
Shorter-term indicators of cash interest cover and internal financing have recorded positive results, however fall below the five-year average for the cohort. The current ratio is relatively lower in 2016–17 compared to the entity’s historical performance.
The entity has experienced positive profitability results for ROA, ROE, EBITDA margin and net result, relative to the cohort average.
Other longer-term indicators present mixed results against the cohort. Debt to revenue ratios are comparatively weaker, meaning the entity requires on average, at least two years’ worth of its total revenue generated to pay off debt. The capital replacement ratio has improved in recent years after a drop in 2014−15 to return results comparatively higher than the cohort average.
VAGO.
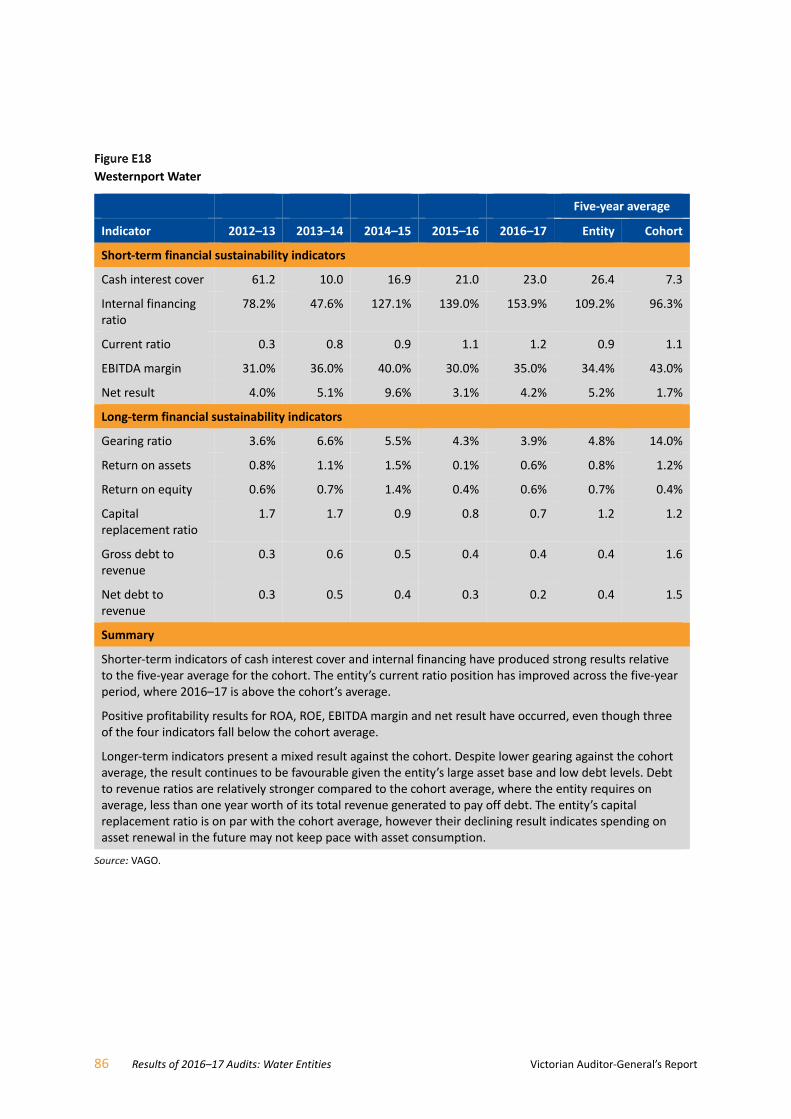
86 Results of 2016–17 Audits: Water Entities Victorian Auditor-General’s Report
Westernport Water
Five‐year average
Indicator 2012–13 2013–14 2014–15 2015–16 2016–17 Entity Cohort
Short‐term financial sustainability indicators
Cash interest cover 61.2 10.0 16.9 21.0 23.0 26.4 7.3
Internal financing ratio
78.2% 47.6% 127.1% 139.0% 153.9% 109.2% 96.3%
Current ratio 0.3 0.8 0.9 1.1 1.2 0.9 1.1
EBITDA margin 31.0% 36.0% 40.0% 30.0% 35.0% 34.4% 43.0%
Net result 4.0% 5.1% 9.6% 3.1% 4.2% 5.2% 1.7%
Long‐term financial sustainability indicators
Gearing ratio 3.6% 6.6% 5.5% 4.3% 3.9% 4.8% 14.0%
Return on assets 0.8% 1.1% 1.5% 0.1% 0.6% 0.8% 1.2%
Return on equity 0.6% 0.7% 1.4% 0.4% 0.6% 0.7% 0.4%
Capital replacement ratio
1.7 1.7 0.9 0.8 0.7 1.2 1.2
Gross debt to revenue
0.3 0.6 0.5 0.4 0.4 0.4 1.6
Net debt to revenue
0.3 0.5 0.4 0.3 0.2 0.4 1.5
Summary
Shorter-term indicators of cash interest cover and internal financing have produced strong results relative to the five-year average for the cohort. The entity’s current ratio position has improved across the five-year period, where 2016–17 is above the cohort’s average.
Positive profitability results for ROA, ROE, EBITDA margin and net result have occurred, even though three of the four indicators fall below the cohort average.
Longer-term indicators present a mixed result against the cohort. Despite lower gearing against the cohort average, the result continues to be favourable given the entity’s large asset base and low debt levels. Debt to revenue ratios are relatively stronger compared to the cohort average, where the entity requires on average, less than one year worth of its total revenue generated to pay off debt. The entity’s capital replacement ratio is on par with the cohort average, however their declining result indicates spending on asset renewal in the future may not keep pace with asset consumption.
VAGO.

Victorian Auditor-General’s Report Results of 2016–17 Audits: Water Entities 87
Rural cohort
Goulburn Murray Water
Five‐year average
Indicator 2012–13 2013–14 2014–15 2015–16 2016–17 Entity Cohort
Short‐term financial sustainability indicators
Cash interest cover 0.0 22.4 12.9 2.4 23.9 12.3 17.1
Internal financing ratio
-6.0% 157.0% 89.2% 5.3% 115.2% 72.1% 61.2%
Current ratio 2.9 5.1 3.8 2.3 5.5 3.9 2.6
EBITDA margin 13.0% 10.0% 23.7% 23.4% 9.0% 15.8% 18.4%
Net result -13.8% -16.7% -5.1% -4.1% -27.6% -13.4% -13.0%
Long‐term financial sustainability indicators
Gearing ratio 3.0% 3.0% 2.7% 2.2% 2.1% 2.6% 2.1%
Return on assets -1.0% -1.0% -0.3% -0.2% -1.7% -0.8% -0.6%
Return on equity -1.0% -1.0% -0.3% -0.3% -1.4% -0.8% -0.6%
Capital replacement ratio
1.3 1.1 1.2 1.9 1.1 1.3 1.3
Gross debt to revenue
0.5 0.6 0.5 0.4 0.5 0.5 0.6
Net debt to revenue
0.3 -0.2 -0.2 0.0 -0.8 -0.2 0.1
Summary
Whilst the cash interest cover and current ratio present mixed results against the cohort average, both show positive results indicating no risks. The entity’s internal financing ratio has experienced significant fluctuations over the last five years, however the average result indicates that cash generated from operations is sufficient to meet asset funding requirements. These results are impacted by the timing and receipt of government funding for the Connections Project.
Profitability results for ROA, ROE, EBITDA margin and net result are largely consistent with the cohort averages. Whilst results fluctuate year to year, the net result indicator has remained negative, driven by depreciation levels. This is evident from the significant disparity between EBITDA margin and net result. This is explained further in Part 4 of our report.
Other longer-term indicators present results in line with the cohort average. Gearing and debt to revenue ratios indicate no risks with the entity’s long-term ability to repay debt. However, capital replacement results close to one represent that spending on asset renewal in the future may not keep pace with asset consumption.
VAGO.
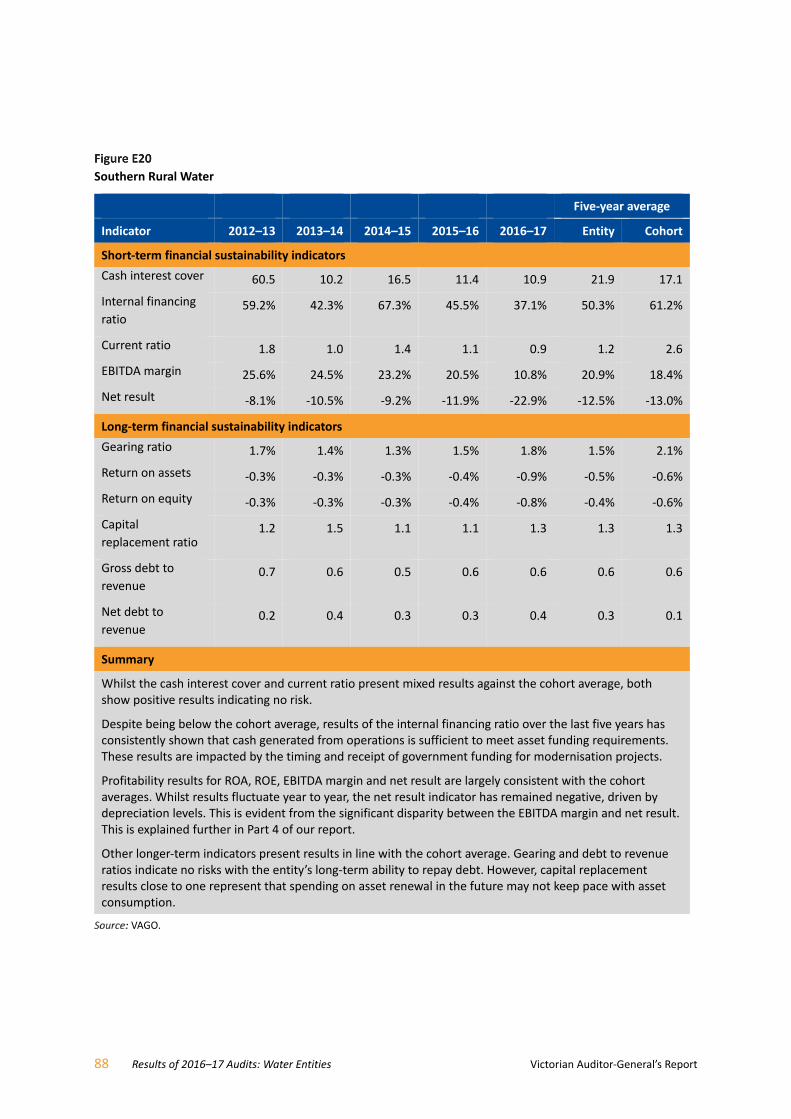
88 Results of 2016–17 Audits: Water Entities Victorian Auditor-General’s Report
Southern Rural Water
Five‐year average
Indicator 2012–13 2013–14 2014–15 2015–16 2016–17 Entity Cohort
Short‐term financial sustainability indicators
Cash interest cover 60.5 10.2 16.5 11.4 10.9 21.9 17.1
Internal financing
ratio 59.2% 42.3% 67.3% 45.5% 37.1% 50.3% 61.2%
Current ratio 1.8 1.0 1.4 1.1 0.9 1.2 2.6
EBITDA margin 25.6% 24.5% 23.2% 20.5% 10.8% 20.9% 18.4%
Net result -8.1% -10.5% -9.2% -11.9% -22.9% -12.5% -13.0%
Long‐term financial sustainability indicators
Gearing ratio 1.7% 1.4% 1.3% 1.5% 1.8% 1.5% 2.1%
Return on assets -0.3% -0.3% -0.3% -0.4% -0.9% -0.5% -0.6%
Return on equity -0.3% -0.3% -0.3% -0.4% -0.8% -0.4% -0.6%
Capital
replacement ratio 1.2 1.5 1.1 1.1 1.3 1.3 1.3
Gross debt to
revenue 0.7 0.6 0.5 0.6 0.6 0.6 0.6
Net debt to
revenue 0.2 0.4 0.3 0.3 0.4 0.3 0.1
Summary
Whilst the cash interest cover and current ratio present mixed results against the cohort average, both show positive results indicating no risk.
Despite being below the cohort average, results of the internal financing ratio over the last five years has consistently shown that cash generated from operations is sufficient to meet asset funding requirements. These results are impacted by the timing and receipt of government funding for modernisation projects.
Profitability results for ROA, ROE, EBITDA margin and net result are largely consistent with the cohort averages. Whilst results fluctuate year to year, the net result indicator has remained negative, driven by depreciation levels. This is evident from the significant disparity between the EBITDA margin and net result. This is explained further in Part 4 of our report.
Other longer-term indicators present results in line with the cohort average. Gearing and debt to revenue ratios indicate no risks with the entity’s long-term ability to repay debt. However, capital replacement results close to one represent that spending on asset renewal in the future may not keep pace with asset consumption.
VAGO.
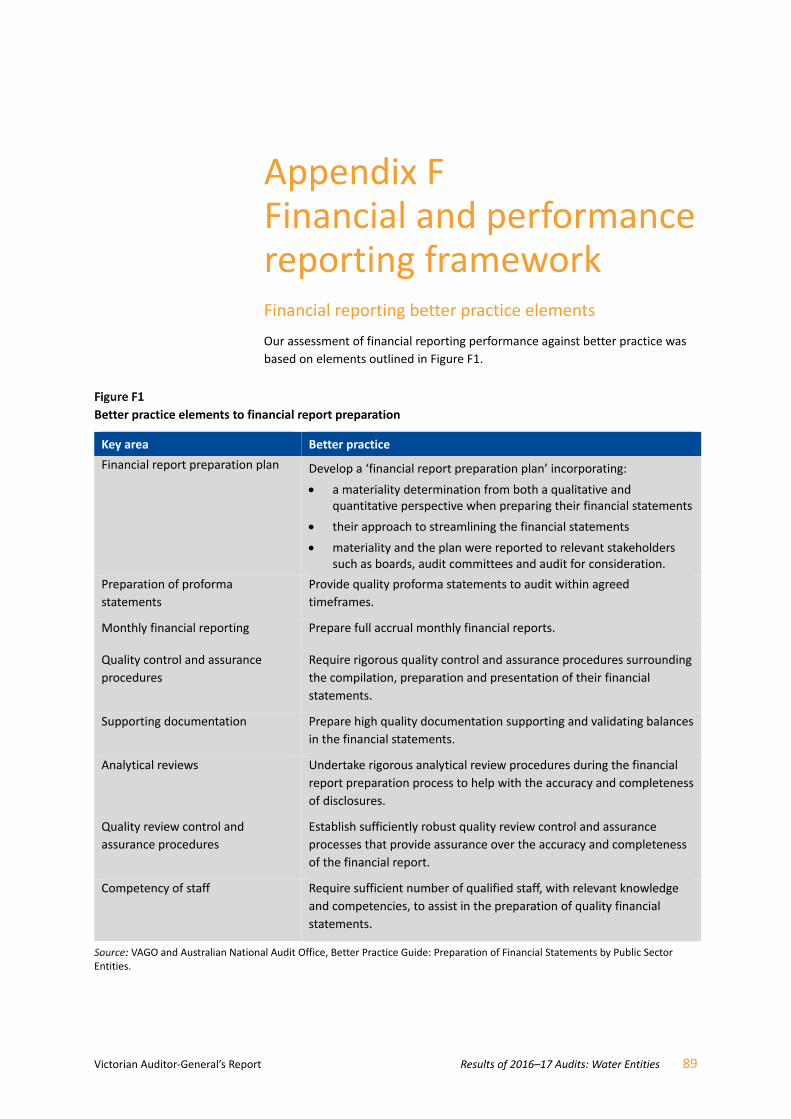
Victorian Auditor-General’s Report Results of 2016–17 Audits: Water Entities 89
Appendix F Financial and performance reporting framework Financial reporting better practice elements
Our assessment of financial reporting performance against better practice was
based on elements outlined in Figure F1.
Better practice elements to financial report preparation
Key area Better practice
Financial report preparation plan Develop a ‘financial report preparation plan’ incorporating:
a materiality determination from both a qualitative and quantitative perspective when preparing their financial statements
their approach to streamlining the financial statements
materiality and the plan were reported to relevant stakeholders such as boards, audit committees and audit for consideration.
Preparation of proforma
statements
Provide quality proforma statements to audit within agreed
timeframes.
Monthly financial reporting Prepare full accrual monthly financial reports.
Quality control and assurance
procedures
Require rigorous quality control and assurance procedures surrounding
the compilation, preparation and presentation of their financial
statements.
Supporting documentation Prepare high quality documentation supporting and validating balances
in the financial statements.
Analytical reviews Undertake rigorous analytical review procedures during the financial
report preparation process to help with the accuracy and completeness
of disclosures.
Quality review control and
assurance procedures
Establish sufficiently robust quality review control and assurance
processes that provide assurance over the accuracy and completeness
of the financial report.
Competency of staff Require sufficient number of qualified staff, with relevant knowledge
and competencies, to assist in the preparation of quality financial
statements.
VAGO and Australian National Audit Office, Better Practice Guide: Preparation of Financial Statements by Public Sector Entities.
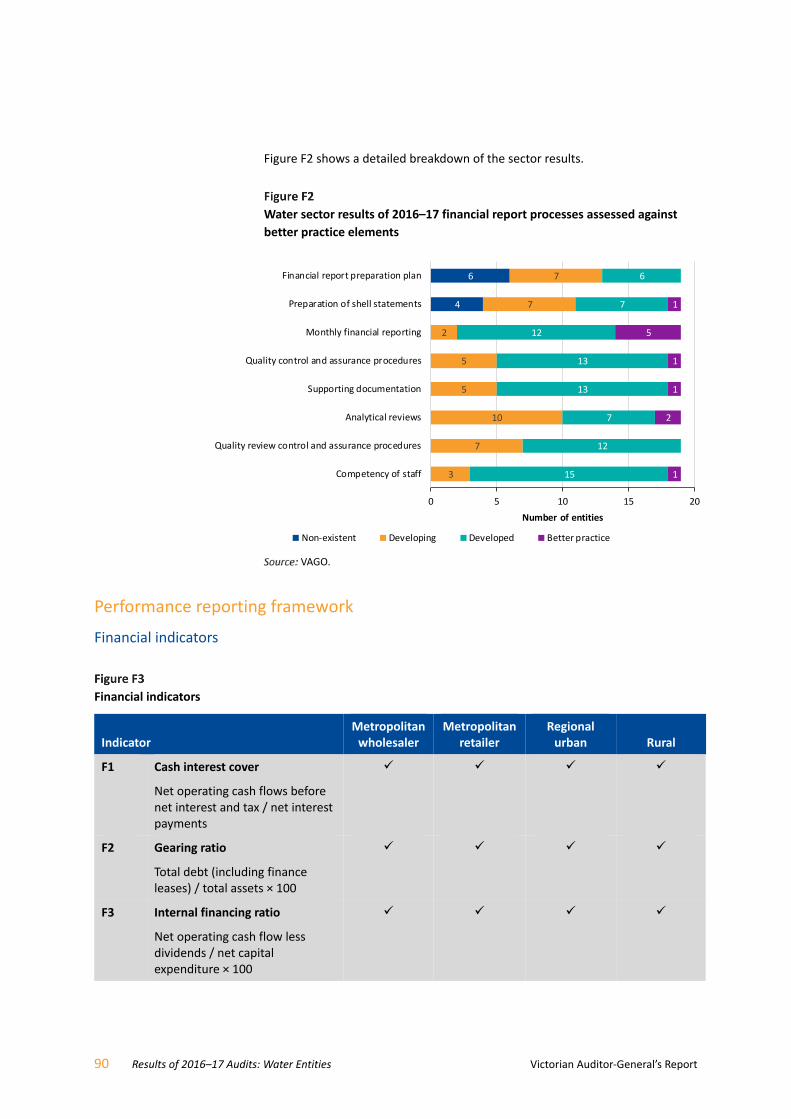
90 Results of 2016–17 Audits: Water Entities Victorian Auditor-General’s Report
Figure F2 shows a detailed breakdown of the sector results.
Water sector results of 2016–17 financial report processes assessed against
better practice elements
VAGO.
Performance reporting framework
Financial indicators
Financial indicators
Indicator Metropolitan wholesaler
Metropolitan retailer
Regional urban Rural
F1 Cash interest cover
Net operating cash flows before net interest and tax / net interest payments
F2 Gearing ratio
Total debt (including finance leases) / total assets × 100
F3 Internal financing ratio
Net operating cash flow less dividends / net capital expenditure × 100
4
6
3
7
10
5
5
2
7
7
15
12
7
13
13
12
7
6
1
2
1
1
5
1
0 5 10 15 20
Competency of staff
Quality review control and assurance procedures
Analytical reviews
Supporting documentation
Quality control and assurance procedures
Monthly financial reporting
Preparation of shell statements
Financial report preparation plan
Number of entities
Non-existent Developing Developed Better practice
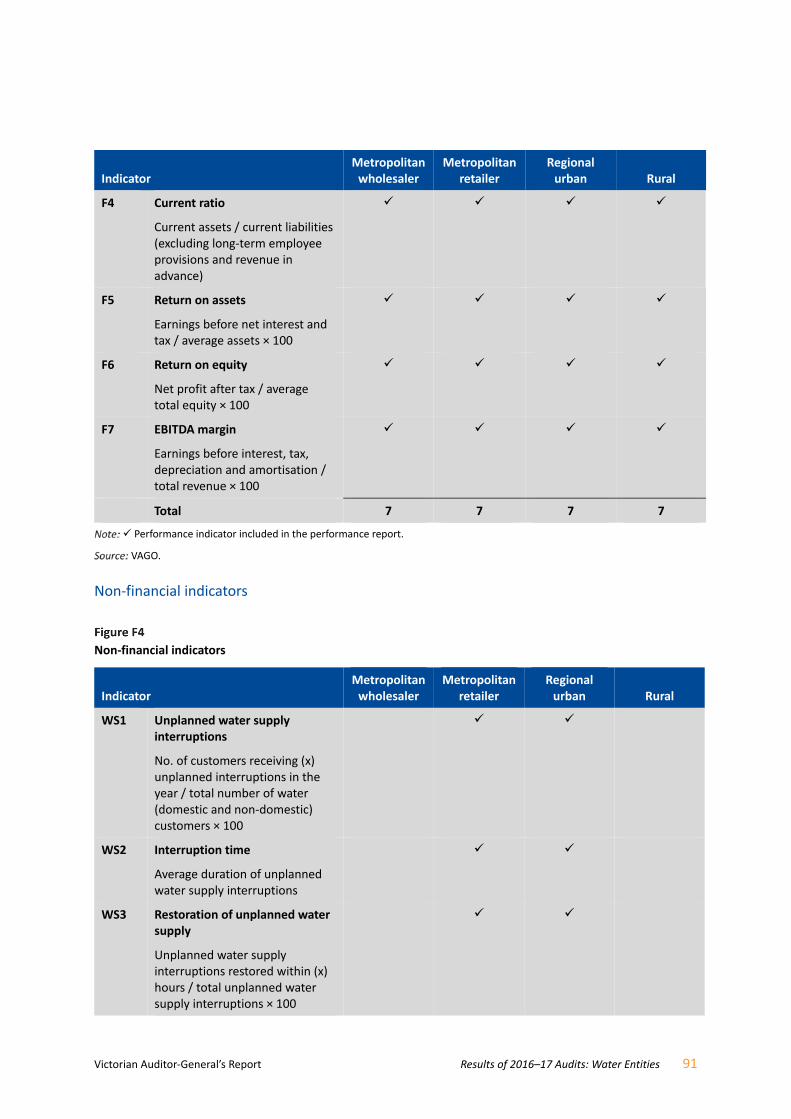
Victorian Auditor-General’s Report Results of 2016–17 Audits: Water Entities 91
Indicator Metropolitan wholesaler
Metropolitan retailer
Regional urban Rural
F4 Current ratio
Current assets / current liabilities (excluding long-term employee provisions and revenue in advance)
F5 Return on assets
Earnings before net interest and tax / average assets × 100
F6 Return on equity
Net profit after tax / average total equity × 100
F7 EBITDA margin
Earnings before interest, tax, depreciation and amortisation / total revenue × 100
Total 7 7 7 7
Performance indicator included in the performance report.
VAGO.
Non-financial indicators
Non‐financial indicators
Indicator Metropolitan wholesaler
Metropolitan retailer
Regional urban Rural
WS1 Unplanned water supply interruptions
No. of customers receiving (x) unplanned interruptions in the year / total number of water (domestic and non-domestic) customers × 100
WS2 Interruption time
Average duration of unplanned water supply interruptions
WS3 Restoration of unplanned water supply
Unplanned water supply interruptions restored within (x) hours / total unplanned water supply interruptions × 100

92 Results of 2016–17 Audits: Water Entities Victorian Auditor-General’s Report
Indicator Metropolitan wholesaler
Metropolitan retailer
Regional urban Rural
WSR1 Rural water supply deliveries
Number of orders delivered / total number of orders × 100
WSR2 Unavailability of Domestic and Stock supply
Duration that domestic and stock service is unavailable in excess of on-property storage requirement / length of water season × 100
WSR3 Groundwater supply
Number of transfers processed within target period / total number of transfers processed × 100
SS1 Containment of sewer spills
Sewer spills from reticulation and branch sewers contained within (x) hours / total sewer spills from reticulation and branch sewers × 100
SS2 Sewer spills interruptions
No. of residential sewerage customers affected by sewerage interruptions restored within (x) hours
WQ1 Water quality
Compliance with BWSA: Microbiological Standards —E. coli
WQ2 Water quality
Compliance with BWSA:
Aesthetics—Turbidity
CRM1 Customer responsiveness
Complaints referred to EWOV
responded to within EWOV
established time
EM1 Non‐compliance with EPA Victoria Corporate License and SEPP parameters—Sewerage system failure
Zero spills due to sewerage
system failure

Victorian Auditor-General’s Report Results of 2016–17 Audits: Water Entities 93
Indicator Metropolitan wholesaler
Metropolitan retailer
Regional urban Rural
EM2.1 Compliance with EPA Victoria discharge licence requirements—Western Treatment Plant
EM2.2 Compliance with EPA Victoria discharge licence requirements—Eastern Treatment Plant
WW1 Waterways—drainage and flood protection
15% reduction in flood effects
achieved by projects in delivery
by Melbourne Water
WW2 Waterways condition
Achievement of Water Plan
implementation targets set out in
the Healthy Waterways Strategy
RW1.1 Recycled water—WTP recycled water schemes—volume demands
WTP recycled water schemes fully compliant with regulatory obligations and their contractual requirements, as outlined in the relevant BRWSAs
RW1.2 Recycled water—WTP recycled water schemes—reliability
Refer RW1.1
RW1.3 Recycled water—WTP recycled water schemes—quality
Refer RW1.1
RW2.1 Recycled water—ETP recycled water schemes—volume demands
ETP recycled water schemes fully
compliant with regulatory
obligations and their contractual
requirements, as outlined in the
relevant BRWSAs
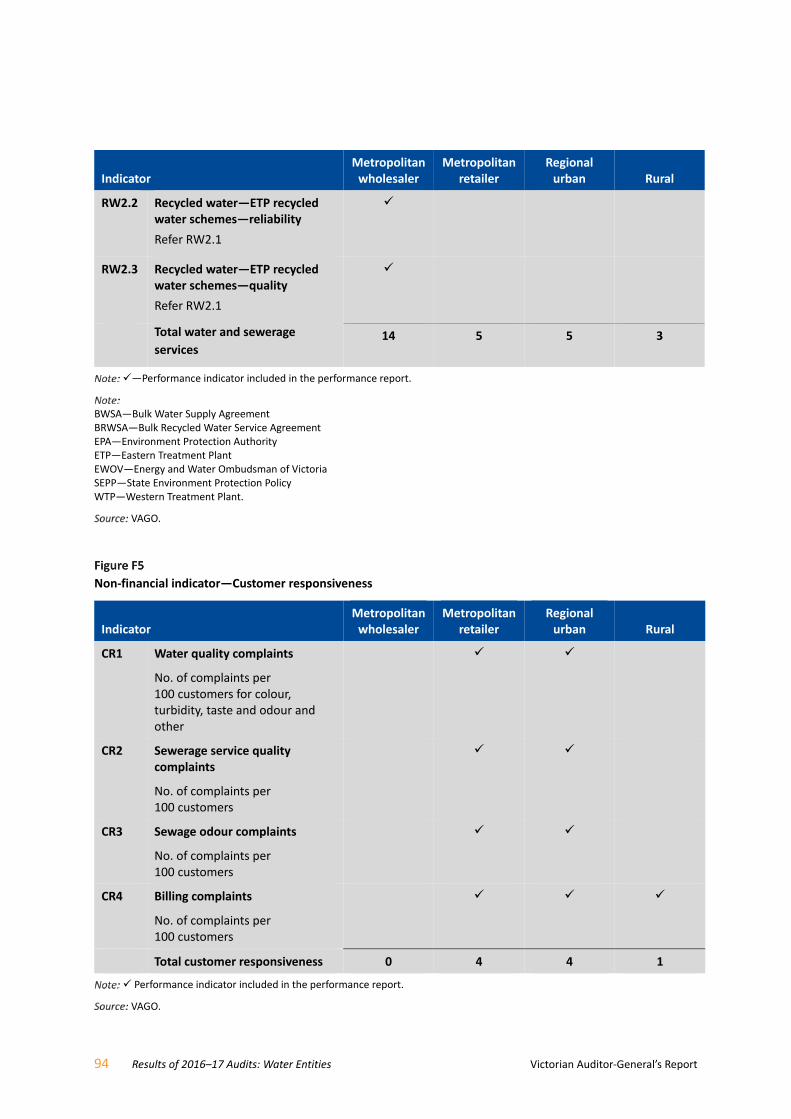
94 Results of 2016–17 Audits: Water Entities Victorian Auditor-General’s Report
Indicator Metropolitan wholesaler
Metropolitan retailer
Regional urban Rural
RW2.2 Recycled water—ETP recycled water schemes—reliability
Refer RW2.1
RW2.3 Recycled water—ETP recycled water schemes—quality
Refer RW2.1
Total water and sewerage
services 14 5 5 3
—Performance indicator included in the performance report.
BWSA—Bulk Water Supply Agreement BRWSA—Bulk Recycled Water Service Agreement EPA—Environment Protection Authority ETP—Eastern Treatment Plant EWOV—Energy and Water Ombudsman of Victoria SEPP—State Environment Protection Policy WTP—Western Treatment Plant.
VAGO.
Non‐financial indicator—Customer responsiveness
Indicator Metropolitan wholesaler
Metropolitan retailer
Regional urban Rural
CR1 Water quality complaints
No. of complaints per 100 customers for colour, turbidity, taste and odour and other
CR2 Sewerage service quality complaints
No. of complaints per 100 customers
CR3 Sewage odour complaints
No. of complaints per 100 customers
CR4 Billing complaints
No. of complaints per 100 customers
Total customer responsiveness 0 4 4 1
Performance indicator included in the performance report.
VAGO.

Victorian Auditor-General’s Report Results of 2016–17 Audits: Water Entities 95
Non‐financial indicator—Environmental
Indicator Metropolitan wholesaler
Metropolitan retailer
Regional urban Rural
E1 Effluent re‐use volume (end use)
Percentage recycled for each category urban and industrial, agricultural, environmental flows and other uses.
E2 Total net CO2 emissions
Net tonnes CO2 equivalent
Total environmental 0 2 2 1
Performance indicator included in the performance report.
VAGO.


Victorian Auditor-General’s Report Results of 2016–17 Audits: Water Entities 97
Appendix G Glossary Accountability
Responsibility of public entities to achieve their objectives in reliability of
financial reporting, effectiveness and efficiency of operations, compliance with
applicable laws, and reporting to interested parties.
Amortisation
The systematic allocation of the depreciable amount of an intangible asset over
its expected useful life.
Asset
An item or resource controlled by an entity that will be used to generate future
economic benefits.
Asset valuation
The fair value of a non-current asset on a specified date.
Audit Act 1994
Victorian legislation establishing the Auditor-General’s operating powers
and responsibilities and detailing the nature and scope of audits that the
Auditor-General may carry out.
Audit committee
Helps a governing board to fulfil its governance and oversight responsibilities
and strengthen accountability of senior management.
Audit opinion
A written expression, within a specified framework, indicating the auditor’s
overall conclusion about a financial (or performance) report based on audit
evidence.
Capital expenditure
Money an entity spends on:
new physical assets, including property, infrastructure, plant and equipment
renewing existing physical assets to extend their service potential or life.
Carrying value
The original cost of an asset, less the accumulated amount of any depreciation
or amortisation, less the accumulated amount of any asset impairment.
Catchment management authority
A body established under the Catchment and Land Protection Act 1994 that has
management powers over regional waterways, floodplains, drainage and other
water to maintain the health of rivers and wetlands.

98 Results of 2016–17 Audits: Water Entities Victorian Auditor-General’s Report
Change management
IT change management involves the policies and processes to ensure that
changes to an IT environment are appropriate and preserve the integrity of
underlying programs and data.
Clear audit opinion—financial report
A positive written expression provided when the financial report has been
prepared and presents fairly the transactions and balances for the reporting
period in keeping with the requirements of the relevant legislation and
Australian Accounting Standards—also referred to as an unqualified audit
opinion.
Clear audit opinion—performance report
A positive written expression provided when the performance report has
been prepared and presents fairly the performance indicators and results of
performance for the reporting period in accordance with the requirements of
the relevant legislation.
Control environment
Processes within an entity’s governance and management structure that
provide reasonable assurance about the achievement of an entity’s objectives in
reliability of financial reporting, effectiveness and efficiency of operations, and
compliance with applicable laws and regulations.
Corporations Act 2001
Commonwealth legislation governing corporations, including their financial
reporting framework.
Corporate Plan
A form of strategic document communicated to all stakeholders that specifies
the entity’s purpose, activities, strategies and performance goals over the next
five years.
Current asset
An asset that will be sold or realised within 12 months of the end of the
financial year being reported on, such as term deposits maturing in three
months or stock items available for sale.
Current liability
A liability that will be settled within 12 months of the end of the financial year
being reported on, such as payment of a creditor for services provided to the
entity.
Debt
Money owed by one party to another party.
Deficit
When total expenditure is more than total revenue.
Depreciated replacement cost
Current replacement cost less accumulated depreciation to reflect the economic
benefits of the assets that have been consumed.
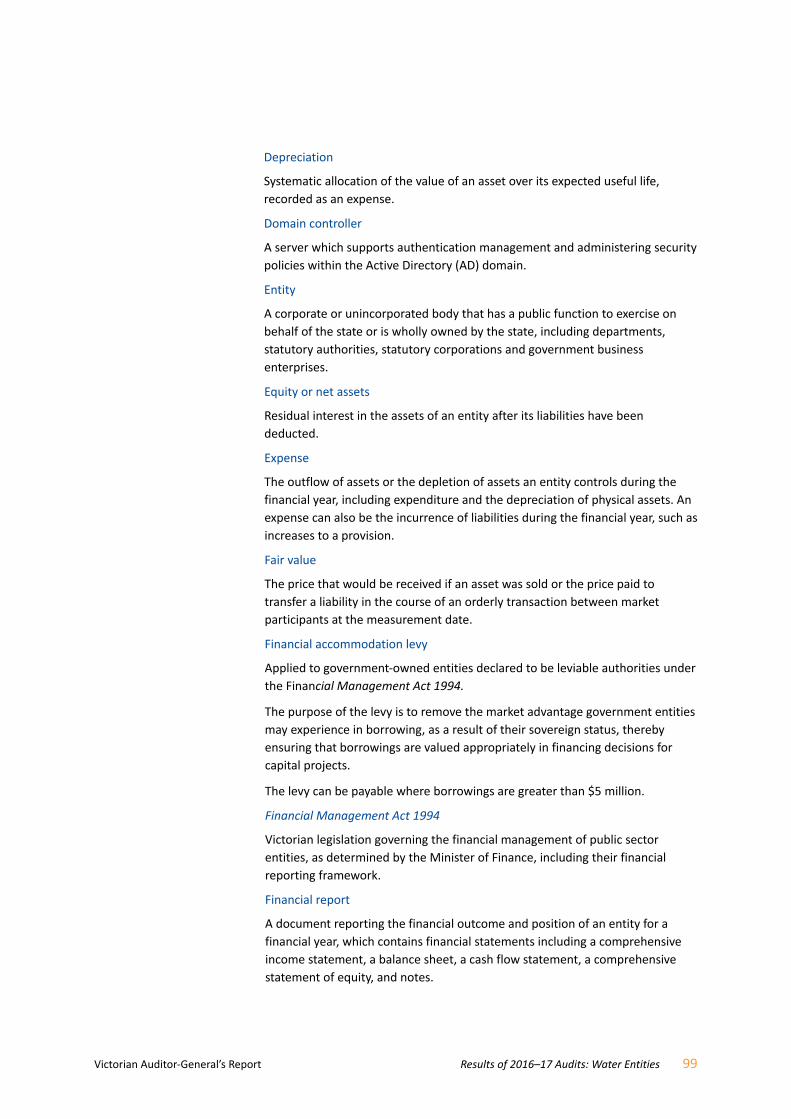
Victorian Auditor-General’s Report Results of 2016–17 Audits: Water Entities 99
Depreciation
Systematic allocation of the value of an asset over its expected useful life,
recorded as an expense.
Domain controller
A server which supports authentication management and administering security
policies within the Active Directory (AD) domain.
Entity
A corporate or unincorporated body that has a public function to exercise on
behalf of the state or is wholly owned by the state, including departments,
statutory authorities, statutory corporations and government business
enterprises.
Equity or net assets
Residual interest in the assets of an entity after its liabilities have been
deducted.
Expense
The outflow of assets or the depletion of assets an entity controls during the
financial year, including expenditure and the depreciation of physical assets. An
expense can also be the incurrence of liabilities during the financial year, such as
increases to a provision.
Fair value
The price that would be received if an asset was sold or the price paid to
transfer a liability in the course of an orderly transaction between market
participants at the measurement date.
Financial accommodation levy
Applied to government-owned entities declared to be leviable authorities under
the Financial Management Act 1994.
The purpose of the levy is to remove the market advantage government entities
may experience in borrowing, as a result of their sovereign status, thereby
ensuring that borrowings are valued appropriately in financing decisions for
capital projects.
The levy can be payable where borrowings are greater than $5 million.
Financial Management Act 1994
Victorian legislation governing the financial management of public sector
entities, as determined by the Minister of Finance, including their financial
reporting framework.
Financial report
A document reporting the financial outcome and position of an entity for a
financial year, which contains financial statements including a comprehensive
income statement, a balance sheet, a cash flow statement, a comprehensive
statement of equity, and notes.

100 Results of 2016–17 Audits: Water Entities Victorian Auditor-General’s Report
Financial Reporting Directions
Issued by the Minister of Finance for entities reporting under the Financial
Management Act 1994, with the aim of:
achieving consistency and improved disclosure in financial reporting for
Victorian public entities by eliminating or reducing divergence in accounting
practices
prescribing the accounting treatment and disclosure of financial transactions
in circumstances where there are choices in accounting treatment, or where
existing accounting procurements have no guidance or requirements.
Financial sustainability
An entity’s ability to manage financial resources so it can meet its current and
future spending commitments, while maintaining assets in the condition
required to provide services.
Financial year
A period of 12 months for which a financial report is prepared, which may be a
different period to the calendar year.
Governance
The control arrangements used to govern and monitor an entity’s activities to
achieve its strategic and operational goals.
Headworks
An engineering term for any structure at the head or diversion point of a
waterway. It is used to divert water from a river into a canal or from a large
canal into a smaller canal.
Impairment (loss)
The amount by which the value of an entity’s asset exceeds its recoverable
value.
Income
The inflow of assets or decrease of liabilities during the financial year, including
receipt of cash and the reduction of a provision.
Income approach
A valuation technique that converts future amounts, such as cash flows or
income and expenses, to a single current (discounted) amount. The fair value of
those future amounts is measured as an indication of current market
expectations.
Intangible asset
An identifiable non-financial asset, controlled by an entity, that cannot be
physically seen, such as software licences or a patent.
Internal control
A method of directing, monitoring and measuring an entity’s resources and
processes to prevent and detect error and fraud.

Victorian Auditor-General’s Report Results of 2016–17 Audits: Water Entities 101
Investment
Public or private sector expenditure for the development and/or use of
infrastructure assets, intended to result in medium- to long-term service and/or
financial benefits.
Issues
Weaknesses or other concerns in the governance structure of an entity
identified during a financial audit, which are reported to them in a management
letter.
Liability
A present obligation of the entity arising from past events, the settlement of
which is expected to result in an outflow of assets from the entity.
Management letter
A letter the auditor writes to the governing body, the audit committee and the
management of an entity outlining issues identified during the financial audit.
Material error or adjustment
An error that may result in the omission or misstatement of information, which
could influence the economic decision of users taken on the basis of the
financial statements.
Materiality
Information is material if its omission, misstatement or non-disclosure has the
potential to affect the economic decisions of users of the financial report, or the
discharge of accountability by management or those charged with governance.
The size, value and nature of the information and the circumstances of its
omission or misstatement help in deciding how material it is.
Net result
The value that an entity has earned or lost over the stated period—usually a
financial year—calculated by subtracting an entity’s total expenses from its total
revenue for that period.
Non-current asset
An asset that will be sold or realised later than 12 months after the end of the
financial year being reported on, such as investments with a maturity date of
two years or physical assets the entity holds for long-term use.
Non-current liability
A liability that will be settled later than 12 months after the end of the financial
year being reported on, such as repayments on a five-year loan that are not due
in the next 12 months.
Performance report
A statement detailing an entity’s predetermined performance indicators and
targets for the financial year, and the actual results achieved, along with
explanations for any significant variations between the actual result and the
target.

102 Results of 2016–17 Audits: Water Entities Victorian Auditor-General’s Report
Physical asset
A non-financial asset that is a tangible item an entity controls, and that will be
used by the entity for more than 12 months to generate profit or provide
services, such as building, equipment or land.
Regulatory period
A statutory defined period that reflects all of the financial/operational activities
that took place during that time.
Revaluation
The restatement of a value of non-current assets at a particular point in time.
Revenue
Inflows of funds or other assets or savings in outflows of service potential, or
future economic benefits in the form of increases in assets or reductions in
liabilities of an entity, other than those relating to contributions by owners, that
result in an increase in equity during the reporting period.
Risk
The chance of a negative or positive impact on the objectives, outputs or
outcomes of an entity.
Rollover
Prior to or at maturity of a loan, the parties of the loan agreement continue to
carry over the loan for another successive period of time.
Super-user
An account assigned with full access to a system and is generally used for
system administration.
Auditor-General’s reports tabled during 2017–18
Report title Date tabled
V/Line Passenger Services (2017–18:1) August 2017
Internal Audit Performance (2017–18:2) August 2017
Effectively Planning for Population Growth (2017–18:3) August 2017
Victorian Public Hospital Operating Theatre Efficiency (2017–18:4) October 2017
Auditor-General’s Report on the Annual Financial Report
of the State of Victoria, 2016–17 (2017–18:5)
November 2017
All reports are available for download in PDF and HTML format on our website www.audit.vic.gov.au
Victorian Auditor-General’s Office
Level 31, 35 Collins Street
Melbourne Vic 3000
AUSTRALIA
Phone +61 3 8601 7000
Email [email protected]