Embed Size (px)
Citation preview

Background Note
Results from the latest wave of the World Value Survey
Ronald Inglehart University of Michigan

1
Input to the World Development Report 2014 on Managing Risk
Results from the Latest Wave of the World Values Survey
Table 1through Table 21 present results arranged by average response so that those populaces
who feel most secure are listed towards the top and those populaces who feel least secure are
listed towards the bottom. The tables give the percentage of those polled who answered a certain
way for the 36 countries from which data are available so far, from the 2011-2013 wave of the
World Values Survey. There are some patterns present in these results. Sweden, Australia,
Qatar, and Uzbekistan consistently fall towards the more secure end of questions related to
physical security, while Peru, Mexico, and Pakistan all show lower levels of perception of
physical security. Respondents in Qatar, Sweden, and Malaysia show greater feelings of
economic security, while Rwanda, Zimbabwe and Nigeria consistently score towards the lower
end in terms of economic security in these questions. Responses from Pakistan and the United
States show the greatest propensity to use force in order to achieve security (V178 and V187).
The results from the survey questions suggest that respondents in Western Europe and the United
States feel quite secure, while those in South and Central America and Africa feel less secure
both physically and economically. Eastern European and Asian responses are not as consistent,
although some may be surprised that the results South Korea and Japan often place them in the
middle of the response group in terms of perceptions of security.
In addition to the survey responses, Table 22 presents the results of a factor analysis with
varimax rotation on the questions. As show, the responses break down into a number of
components. In addition to questions that seem to gauge a respondent’s perceptions of physical
and economic security, the survey seems to tap feelings about possible future events, crime,
personal safety, and the use of force. Some of this separation in components may be a result of

2
respondents’ tendency to answer similar questions in a similar manner but it is worth
investigating how different countries score in terms of each component by looking at their
individual scores. Tables 23 – 28 present the average score for each country from the factor
analysis for each component. Note that not all countries display each factor.
The individual country scores show that respondents in Qatar, Sweden, and the United States
show the least concern about possible future problems, while survey respondents in Rwanda,
Armenia and Malaysia show the most concern. Respondents in countries with recent histories of
violence seem to show lower perceptions of physical security while countries with high levels of
GDP and state involvement have high perceptions of economic security. The results from the
component analysis of concerns about crime levels and personal safety suggest that these two
components and the physical security component are related as the results are somewhat similar.
However, it is worth noting that Japanese respondents indicate that they take much more
precautions to ensure personal safety than would be expected given their perceptions of physical
security. Of the countries that present a separate factor related to the use of force to protect
security, it is notable that three countries that score fairly high in terms of economic and physical
security—Sweden, Qatar, and the United States—have the highest scores in terms of interest in
the use of force.
Finally, Tables 29 and 30 compare the physical and economic security component scores to other
national level indicators of security. In Table 29, the physical security score is compared to the
most recent available statistics on homicide, rape, and theft per capita. In Table 30, the
economic security score is compared to the most recent available data on GDP, inflation and
unemployment. The component scores match well with these traditional indicators, suggesting
that respondents are accurately reflecting national security levels.

3
Table 1: V170 Could you tell me how secure do you feel these days in your neighborhood? Number of
Respondents Very Secure Quite secure Not very secure Not at all secure
Qatar 85 10 2 3 (1060)
Uzbekistan 67 25 3 5 (1462)
Sweden 52 42 5 1 (1203)
Ghana 53 33 11 2 (1551)
Rwanda 45 46 9 0 (1522)
Poland 38 58 4 1 (961)
Philippines 45 43 9 2 (1198)
Azerbaijan 37 54 8 1 (998)
Australia 31 60 9 0 (1462)
Armenia 36 51 11 3 (1097)
Romania 36 48 13 3 (1500)
Malaysia 30 56 13 1 (1294)
New Zealand 28 61 11 1 (823
Spain 29 57 13 1 (1186)
Cyprus (G) 32 52 14 3 (989)
United States 29 56 13 2 (2207)
Belarus 21 69 8 2 (1388)
Estonia 19 70 9 1 (1517)
Turkey 25 60 13 2 (1594)
Zimbabwe 32 46 18 4 (1492)
Pakistan 32 49 12 7 (1164)
Trinidad and Tobago 38 35 22 5 (987)
Kazakhstan 26 56 15 4 (1452)
Morocco 28 48 20 5 (1197)
Colombia 38 27 30 5 (1510)
Japan 11 75 12 1 (2354)
Nigeria 32 40 21 7 (1749)
Ukraine 19 60 16 5 (1392)
Mexico 30 36 24 9 (2000)
Uruguay 22 45 26 7 (973)
Russia 8 67 20 5 (2316)
South Korea 7 66 23 5 (1125)
Kyrgyzstan 17 47 24 12 (1376)
Chile 11 48 36 5 (980)
Peru 17 27 49 7 (1205)
Ecuador 4 36 44 16 (1186)
Total 30 50 16 4 (49470)

4
Table 2: V171 How frequently do robberies occur in your neighborhood? Number of
Respondents
Very Frequently Quite frequently Not frequently Not at all
frequently
Uzbekistan 0 4 18 78 (1378)
Qatar 2 5 15 78 (1059)
Azerbaijan 1 5 20 75 (983)
Poland 1 6 29 65 (933)
Cyprus (G) 2 7 28 62 (803)
Estonia 1 8 30 60 (1437)
Japan 0 4 45 50 (2202)
Romania 4 9 28 60 (1417)
South Korea 1 12 31 57 (1038)
Sweden 2 10 32 56 (1185)
Armenia 4 13 22 61 (1072)
Turkey 5 10 31 54 (1599)
Belarus 1 10 42 46 (1282)
United States 2 9 45 44 (2195)
Nigeria 6 9 37 48 (1705)
Spain 1 13 45 41 (1148)
Ukraine 3 16 34 47 (1295)
Malaysia 3 13 42 42 (1273)
Ghana 6 18 30 46 (1521)
Australia 2 14 52 32 (1456)
Kyrgyzstan 9 14 32 45 (1268)
Kazakhstan 6 20 31 43 (1261)
Russia 5 20 38 38 (2135)
Rwanda 3 15 55 27 (1395)
Trinidad and Tobago 8 16 43 33 (959)
Morocco 12 19 31 38 (1196)
New Zealand 3 16 64 17 (758)
Pakistan 6 28 36 30 (1196)
Colombia 16 13 45 26 (1500)
Zimbabwe 8 24 46 21 (1491)
Chile 7 27 45 21 (977)
Uruguay 14 25 40 21 (975)
Peru 14 23 47 16 (1185)
Philippines 13 31 35 21 (1196)
Mexico 22 26 32 19 (1992)
Total 6 14 37 43 (46465)

5
Table 3: V172 How frequently is alcohol consumed in the streets in your neighborhood? Number of
Respondents
Very Frequently Quite frequently Not frequently Not at all
frequently
Azerbaijan 3 3 20 74 (993)
Uzbekistan 1 8 22 69 (1425)
Turkey 3 9 27 60 (1601)
Japan 1 6 48 46 (2169)
United States 4 11 32 54 (2194)
Malaysia 3 11 35 51 (1265)
Cyprus (G) 7 11 24 58 (870)
Spain 3 12 35 50 (1177)
Armenia 4 16 24 55 (1075)
Rwanda 1 11 51 37 (1258)
Pakistan 5 16 32 47 (1183)
Australia 3 13 45 39 (1451)
New Zealand 5 19 45 31 (772)
Poland 8 24 29 39 (943)
Morocco 13 19 29 39 (1191)
Romania 11 26 24 40 (1395)
South Korea 6 30 33 31 (1115)
Nigeria 12 25 28 34 (1685)
Sweden 14 23 31 32 (1194)
Trinidad and Tobago 17 26 26 31 (952)
Uruguay 15 27 31 26 (970)
Chile 12 34 31 24 (976)
Kazakhstan 13 35 27 24 (1369)
Estonia 13 34 31 22 (1488)
Kyrgyzstan 19 29 26 26 (1383)
Ghana 26 22 22 29 (1534)
Peru 16 32 34 17 (1186)
Ukraine 23 32 23 22 (1375)
Colombia 27 28 25 20 (1502)
Zimbabwe 21 35 28 16 (1480)
Belarus 24 34 24 18 (1431)
Philippines 24 35 24 16 (1191)
Russia 33 38 18 11 (2376)
Mexico 45 22 21 12 (1998)
Total 14 22 29 35 (46167)

6
Table 4: V173 How frequently do police or military interfere with people’s private in your
neighborhood?
Number of
Respondents
Very Frequently Quite frequently Not frequently Not at all
frequently
Azerbaijan 1 4 8 88 (988)
Armenia 1 3 10 86 (1025)
Cyprus (G) 1 2 13 83 (764)
Uzbekistan 0 3 18 78 (1356)
Japan 0 1 25 74 (2085)
Malaysia 1 3 23 73 (1262)
Australia 1 2 29 68 (1446)
Turkey 3 4 20 74 (1599)
Qatar 2 7 15 76 (1060)
Sweden 1 5 24 70 (1180)
Poland 1 6 23 70 (934)
Estonia 1 4 28 68 (1369)
Rwanda 1 4 30 65 (1142)
Spain 1 5 29 66 (1166)
Ghana 3 7 19 71 (1489)
United States 2 6 27 66 (2189)
Peru 2 5 27 66 (1137)
Ukraine 2 6 28 64 (1100)
Morocco 2 9 22 67 (1138)
Uruguay 2 8 25 65 (908)
Romania 1 9 27 63 (1326)
New Zealand 1 5 37 56 (760)
Kazakhstan 2 9 30 60 (1127)
South Korea 1 8 34 57 (1036)
Colombia 4 5 32 60 (1488)
Trinidad and Tobago 3 10 26 61 (940)
Chile 2 8 33 57 (912)
Russia 3 10 34 53 (1753)
Kyrgyzstan 4 10 34 52 (1114)
Zimbabwe 5 10 32 53 (1367)
Mexico 7 13 27 53 (1997)
Philippines 4 13 34 48 (1180)
Belarus 3 15 39 43 (1170)
Nigeria 5 14 34 46 (1658)
Pakistan 10 19 33 38 (1177)
Total 2 7 27 64 (44342)

7
Table 5: V174 How frequently does racist behavior occur in your neighborhood? Number of
Respondents
Very Frequently Quite frequently Not frequently Not at all
frequently
Azerbaijan 1 1 3 96 (979)
Armenia 0 2 4 95 (1001)
Uzbekistan 1 1 6 92 (1255)
Poland 0 2 9 89 (915)
Belarus 0 0 12 87 (814)
Ukraine 0 3 11 85 (858)
Estonia 1 3 13 83 (1247)
Turkey 2 3 14 81 (1601)
Qatar 2 6 11 82 (1059)
Colombia 2 3 18 77 (1477)
Uruguay 2 4 16 78 (906)
Japan 0 1 28 70 (2009)
Zimbabwe 2 4 20 75 (1395)
Romania 2 5 16 77 (1277)
Rwanda 0 4 25 71 (1091)
Kazakhstan 1 5 22 72 (856)
Ghana 3 6 15 76 (1469)
Cyprus (G) 1 7 18 74 (739)
Spain 1 5 29 66 (1172)
Malaysia 2 5 27 66 (1263)
Trinidad and Tobago 3 7 22 68 (952)
Chile 3 5 26 66 (878)
South Korea 1 7 29 63 (1002)
Peru 3 8 23 67 (1141)
Russia 1 9 28 62 (1499)
Australia 1 5 36 57 (1449)
United States 2 6 32 60 (2194)
Kyrgyzstan 5 7 24 64 (782)
New Zealand 2 6 36 55 (729)
Mexico 7 9 18 66 (1982)
Sweden 2 11 31 55 (1172)
Morocco 5 15 15 64 (1157)
Nigeria 5 10 28 57 (1642)
Philippines 4 14 31 51 (1156)
Pakistan 3 19 27 51 (1174)
Total 2 6 21 71 (42292)

8
Table 6: V175 How frequently do drug sales in the street occur in your neighborhood? Number of
Respondents
Very Frequently Quite frequently Not frequently Not at all
frequently
Armenia 0 1 2 97 (989)
Japan 0 0 9 91 (1888)
South Korea 0 1 11 88 (942)
Azerbaijan 1 2 10 87 (984)
Poland 1 3 10 86 (860)
Cyprus (G) 2 2 8 88 (696)
Uzbekistan 3 2 6 89 (1146)
Romania 2 4 10 84 (1008)
Turkey 2 3 14 81 (1597)
Belarus 2 4 14 80 (711)
Kazakhstan 3 7 20 70 (747)
Malaysia 2 5 29 64 (1234)
Estonia 4 10 17 69 (1143)
New Zealand 3 8 24 65 (636)
Sweden 3 10 22 65 (1132)
Rwanda 2 9 27 61 (1132)
Australia 2 7 31 59 (1448)
Kyrgyzstan 7 9 18 67 (633)
United States 4 9 26 61 (2193)
Spain 3 11 26 60 (1157)
Ukraine 6 13 17 65 (778)
Peru 8 13 17 62 (1107)
Ghana 10 13 19 57 (1499)
Nigeria 7 15 29 50 (1621)
Colombia 12 11 21 56 (1442)
Morocco 14 15 23 48 (1165)
Pakistan 8 22 28 42 (1180)
Russia 9 23 25 43 (1355)
Philippines 15 17 24 44 (1140)
Trinidad and Tobago 15 19 23 43 (850)
Chile 11 22 29 38 (894)
Uruguay 16 20 20 44 (877)
Zimbabwe 13 21 29 38 (1322)
Mexico 26 16 17 42 (1953)
Total 7 10 20 63 (39459)

9
Table 7: V176 Have you not carried much money for
reasons of security?
Number of
Respondents
Yes No
Qatar 11 89 (1001)
Rwanda 25 75 (2000)
Ghana 33 67 (1193)
Armenia 37 63 (1552)
Spain 37 63 (943)
Romania 38 62 (1500)
Turkey 40 61 (1158)
Australia 43 57 (1527)
Sweden 48 52 (1527)
Cyprus (G) 49 52 (1595)
United States 53 47 (1503)
New Zealand 55 45 (1199)
Uruguay 55 45 (1300)
Trinidad and Tobago 57 43 (1500)
Uzbekistan 58 42 (2425)
Morocco 58 42 (1149)
Philippines 59 41 (2373)
South Korea 63 37 (797)
Zimbabwe 64 36 (991)
Kyrgyzstan 67 33 (982)
Russia 68 32 (1509)
Nigeria 70 30 (1195)
Azerbaijan 70 30 (1059)
Kazakhstan 72 28 (2196)
Colombia 72 28 (1487)
Mexico 73 27 (1500)
Chile 73 27 (1171)
Poland 75 25 (1759)
Belarus 76 24 (1073)
Ukraine 79 21 (1200)
Peru 80 20 (1489)
Pakistan 81 19 (1500)
Estonia 83 18 (1477)
Malaysia 88 12 (999)
Japan 89 11 (1000)
Total 61 39 (48829)

10
Table 8: V177 Have you preferred not to go out at night for
reasons of security?
Number of
Respondents
Yes No
Spain 11 89 (1170)
Qatar 12 88 (1060)
Cyprus (G) 22 78 (1000)
Rwanda 29 71 (1527)
Australia 31 69 (1477)
Ghana 32 68 (1552)
Sweden 33 67 (1200)
Turkey 35 65 (1596)
United States 36 64 (2191)
Romania 38 62 (1494)
Uruguay 40 60 (974)
New Zealand 42 58 (801)
Armenia 43 57 (1093)
Morocco 43 57 (1168)
South Korea 47 53 (1198)
Chile 49 51 (990)
Estonia 52 48 (1496)
Poland 53 47 (952)
Peru 53 47 (1165)
Belarus 54 46 (1531)
Colombia 54 46 (1512)
Uzbekistan 56 44 (1500)
Philippines 61 39 (1198)
Trinidad and Tobago 61 39 (999)
Russia 62 38 (2391)
Kyrgyzstan 63 37 (1493)
Ukraine 64 36 (1500)
Azerbaijan 64 36 (1002)
Mexico 67 33 (2000)
Malaysia 69 31 (1300)
Zimbabwe 70 30 (1500)
Japan 70 30 (2423)
Kazakhstan 70 30 (1500)
Nigeria 71 29 (1759)
Pakistan 72 28 (1200)
Total 51 49 (48912)

11
Table 9: V178 Have you carried a knife, gun or other
weapon for reasons of security?
Number of
Respondents
Yes No
Uzbekistan 1 99 (1500)
Australia 1 99 (1477)
Armenia 1 99 (1082)
Spain 1 99 (1164)
Qatar 1 99 (1060)
Romania 2 98 (1498)
Ghana 2 98 (1552)
Peru 2 98 (1136)
Azerbaijan 3 97 (1002)
Belarus 3 97 (1522)
Sweden 3 97 (1205)
Rwanda 3 97 (1527)
Chile 4 96 (987)
Estonia 4 96 (1502)
Colombia 4 96 (1510)
Cyprus (G) 4 96 (1000)
New Zealand 4 96 (780)
Ukraine 4 96 (1500)
Poland 4 96 (961)
Kazakhstan 4 96 (1500)
Uruguay 4 96 (961)
South Korea 4 96 (1195)
Russia 4 96 (2327)
Trinidad and Tobago 4 96 (999)
Nigeria 6 94 (1759)
Morocco 6 94 (1155)
Turkey 7 93 (1596)
Mexico 7 93 (1999)
Pakistan 8 92 (1200)
Malaysia 9 91 (1300)
Zimbabwe 9 91 (1500)
Kyrgyzstan 11 89 (1485)
Philippines 13 87 (1200)
United States 15 85 (2198)
Total 5 95 (46339)
12
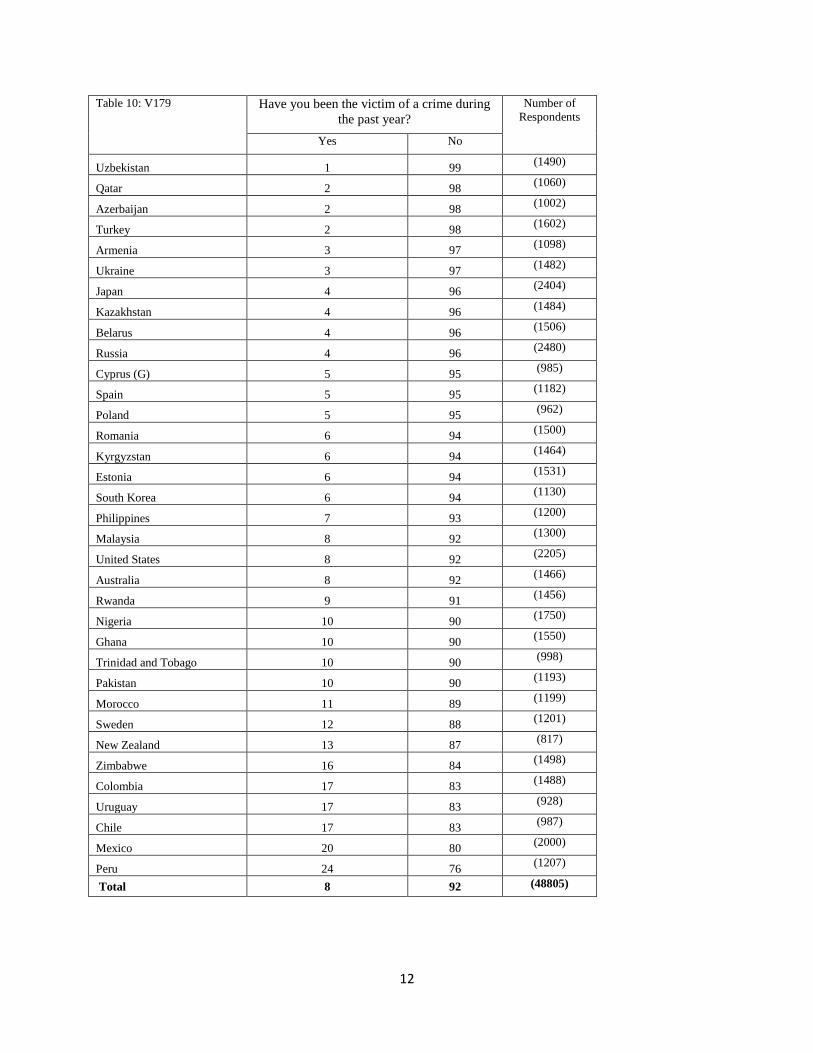
Table 10: V179 Have you been the victim of a crime during
the past year?
Number of
Respondents
Yes No
Uzbekistan 1 99 (1490)
Qatar 2 98 (1060)
Azerbaijan 2 98 (1002)
Turkey 2 98 (1602)
Armenia 3 97 (1098)
Ukraine 3 97 (1482)
Japan 4 96 (2404)
Kazakhstan 4 96 (1484)
Belarus 4 96 (1506)
Russia 4 96 (2480)
Cyprus (G) 5 95 (985)
Spain 5 95 (1182)
Poland 5 95 (962)
Romania 6 94 (1500)
Kyrgyzstan 6 94 (1464)
Estonia 6 94 (1531)
South Korea 6 94 (1130)
Philippines 7 93 (1200)
Malaysia 8 92 (1300)
United States 8 92 (2205)
Australia 8 92 (1466)
Rwanda 9 91 (1456)
Nigeria 10 90 (1750)
Ghana 10 90 (1550)
Trinidad and Tobago 10 90 (998)
Pakistan 10 90 (1193)
Morocco 11 89 (1199)
Sweden 12 88 (1201)
New Zealand 13 87 (817)
Zimbabwe 16 84 (1498)
Colombia 17 83 (1488)
Uruguay 17 83 (928)
Chile 17 83 (987)
Mexico 20 80 (2000)
Peru 24 76 (1207)
Total 8 92 (48805)

13
Table 11: V180 And what about your immediate family--has
someone in your family been the victim of a
crime during the last year?
Total
Yes No
Qatar 2 98 (1060)
Azerbaijan 2 98 (1002)
Uzbekistan 2 98 (1487)
Armenia 3 97 (1091)
Turkey 3 97 (1589)
Belarus 4 96 (1460)
Romania 4 96 (1497)
Japan 4 96 (2370)
Cyprus (G) 4 96 (978)
Ukraine 4 96 (1461)
Kazakhstan 5 95 (1477)
Russia 5 95 (2468)
Kyrgyzstan 6 94 (1421)
Poland 6 94 (959)
Pakistan 6 94 (1170)
Philippines 6 94 (1199)
South Korea 7 93 (1124)
Spain 8 92 (1173)
Estonia 9 91 (1503)
Nigeria 9 91 (1745)
Malaysia 9 91 (1290)
Ghana 11 89 (1537)
Trinidad and Tobago 11 89 (993)
United States 12 88 (2205)
Morocco 12 88 (1173)
Rwanda 12 88 (1115)
Australia 14 86 (1458)
Sweden 15 85 (1197)
Zimbabwe 17 83 (1467)
Uruguay 19 81 (927)
New Zealand 24 76 (792)
Colombia 25 75 (1490)
Chile 28 72 (964)
Mexico 33 67 (2000)
Peru 38 62 (1193)
Total 11 89 (48035)
14
Table 12: V181 To what degree are you worried about losing your job or not finding a job? Number of
Respondents Very much A great deal Not much Not at all
Sweden 10 19 28 42 (1012)
Australia 15 17 30 38 (1423)
Trinidad and Tobago 24 13 18 45 (976)
New Zealand 18 18 28 36 (781)
United States 20 19 28 34 (2192)
Uzbekistan 25 21 21 33 (1438)
Poland 20 29 21 29 (874)
Romania 34 21 16 30 (1323)
Russia 26 30 23 21 (2255)
Chile 29 30 20 20 (940)
Belarus 30 30 22 19 (1491)
Cyprus (G) 38 21 15 27 (956)
Uruguay 41 20 16 23 (974)
Spain 39 26 13 22 (1180)
Ukraine 40 25 14 21 (1459)
Turkey 34 32 20 14 (802)
Qatar 45 19 18 19 (1045)
Morocco 44 22 13 21 (1148)
Azerbaijan 48 19 16 16 (993)
Kazakhstan 44 27 16 13 (1457)
Estonia 48 24 12 15 (1492)
Pakistan 50 24 12 14 (1153)
Nigeria 58 20 9 13 (1703)
South Korea 44 38 15 3 (1165)
Japan 51 29 12 7 (2294)
Zimbabwe 63 13 12 12 (1482)
Peru 56 30 10 4 (1183)
Kyrgyzstan 63 23 12 3 (1456)
Malaysia 65 21 10 4 (1296)
Philippines 60 30 8 2 (1200)
Armenia 70 18 6 6 (1062)
Colombia 74 15 7 4 (1506)
Rwanda 66 29 4 0 (1525)
Ghana 77 13 4 5 (1539)
Mexico 80 11 4 5 (1997)
Total 46 23 15 17 (46772)
15
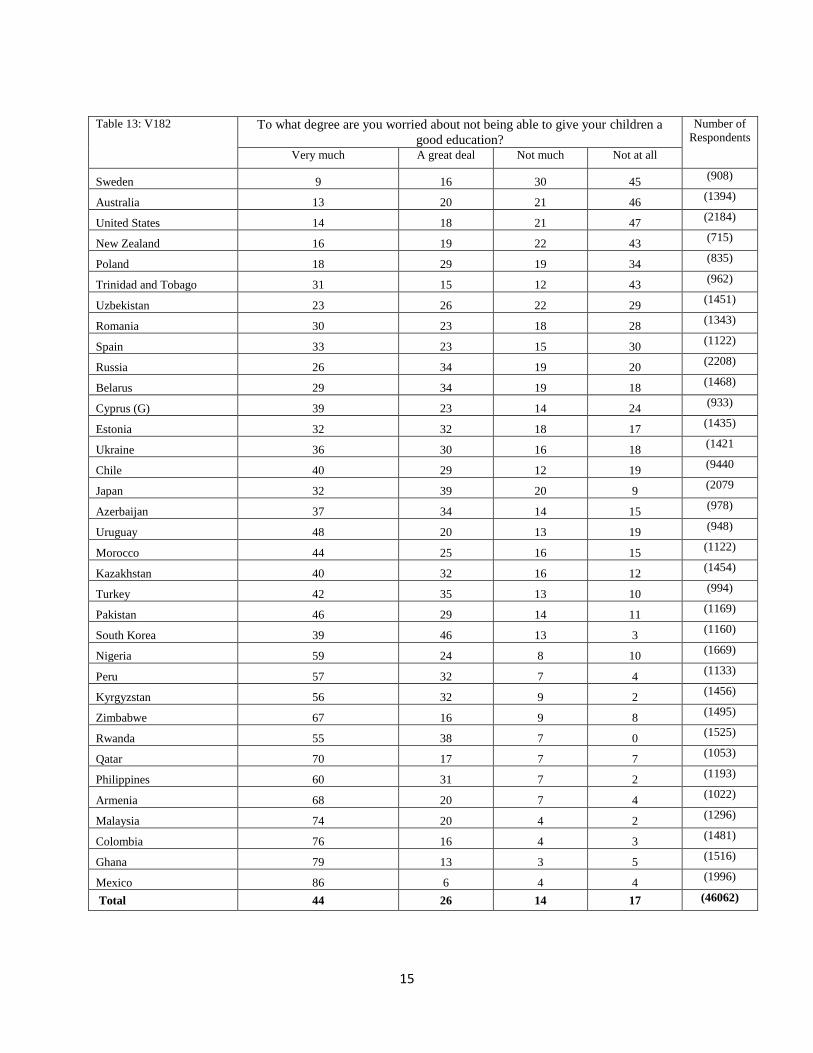
Table 13: V182 To what degree are you worried about not being able to give your children a
good education?
Number of
Respondents
Very much A great deal Not much Not at all
Sweden 9 16 30 45 (908)
Australia 13 20 21 46 (1394)
United States 14 18 21 47 (2184)
New Zealand 16 19 22 43 (715)
Poland 18 29 19 34 (835)
Trinidad and Tobago 31 15 12 43 (962)
Uzbekistan 23 26 22 29 (1451)
Romania 30 23 18 28 (1343)
Spain 33 23 15 30 (1122)
Russia 26 34 19 20 (2208)
Belarus 29 34 19 18 (1468)
Cyprus (G) 39 23 14 24 (933)
Estonia 32 32 18 17 (1435)
Ukraine 36 30 16 18 (1421
Chile 40 29 12 19 (9440
Japan 32 39 20 9 (2079
Azerbaijan 37 34 14 15 (978)
Uruguay 48 20 13 19 (948)
Morocco 44 25 16 15 (1122)
Kazakhstan 40 32 16 12 (1454)
Turkey 42 35 13 10 (994)
Pakistan 46 29 14 11 (1169)
South Korea 39 46 13 3 (1160)
Nigeria 59 24 8 10 (1669)
Peru 57 32 7 4 (1133)
Kyrgyzstan 56 32 9 2 (1456)
Zimbabwe 67 16 9 8 (1495)
Rwanda 55 38 7 0 (1525)
Qatar 70 17 7 7 (1053)
Philippines 60 31 7 2 (1193)
Armenia 68 20 7 4 (1022)
Malaysia 74 20 4 2 (1296)
Colombia 76 16 4 3 (1481)
Ghana 79 13 3 5 (1516)
Mexico 86 6 4 4 (1996)
Total 44 26 14 17 (46062)

16
Table 14: V183 To what degree are you worried about a war involving your country? Number of
Respondents Very much A great deal Not much Not at all
Sweden 3 7 31 58 (1194)
New Zealand 11 9 38 42 (793)
Australia 14 19 42 24 (1445)
Uzbekistan 23 19 22 37 (1368)
Chile 24 20 22 34 (969)
Trinidad and Tobago 27 18 21 35 (993)
Uruguay 33 17 12 38 (967)
Poland 17 31 35 18 (930)
Spain 32 18 23 27 (1172)
United States 16 38 36 11 (2197)
Estonia 23 33 31 13 (1471)
Morocco 42 16 14 28 (1023)
South Korea 20 40 34 6 (1128)
Belarus 34 27 23 17 (1469)
Cyprus (G) 36 28 19 17 (975)
Romania 37 27 19 17 (1434)
Russia 27 43 22 8 (2406)
Pakistan 34 34 19 13 (1165)
Ukraine 36 34 19 12 (1436)
Turkey 36 32 24 8 (1573)
Kazakhstan 46 25 18 12 (1447)
Zimbabwe 52 17 13 17 (1463)
Nigeria 50 28 13 9 (1714)
Peru 44 35 17 3 (1183)
Kyrgyzstan 51 30 15 4 (1452)
Philippines 51 36 11 2 (1198)
Colombia 62 25 11 3 (1508)
Japan 60 28 10 2 (2340)
Ghana 74 10 5 11 (1545)
Qatar 75 11 7 7 (1060)
Mexico 75 11 9 6 (1998)
Azerbaijan 72 23 4 2 (1000)
Malaysia 76 16 6 2 (1290)
Armenia 78 17 3 2 (1100)
Rwanda 83 14 2 1 (1523)
Total 43 25 18 14 (47929)

17
Table 15: V184 To what degree are you worried about a terrorist attack? Number of
Respondents Very much A great deal Not much Not at all
Sweden 4 18 43 34 (1197)
New Zealand 14 10 39 38 (801)
Chile 26 16 19 40 (959)
Australia 15 20 45 20 (1447)
Uzbekistan 24 23 19 34 (1375)
Trinidad and Tobago 28 17 21 35 (989)
Uruguay 33 16 10 42 (965)
Poland 19 27 39 15 (939)
Cyprus (G) 29 22 21 28 (971)
Estonia 23 25 34 19 (1470)
United States 18 35 37 9 (2199)
Spain 32 23 28 17 (1179)
South Korea 24 31 35 10 (1133)
Morocco 44 14 12 29 (1032)
Romania 36 24 20 20 (1432)
Ukraine 32 32 22 14 (1438)
Belarus 35 31 20 14 (1469)
Zimbabwe 49 13 14 23 (1439)
Turkey 36 35 23 7 (1574)
Pakistan 40 35 18 8 (1177)
Russia 37 42 16 5 (2451)
Kazakhstan 50 28 13 9 (1465)
Kyrgyzstan 48 31 15 6 (1437)
Nigeria 53 27 11 8 (1733)
Azerbaijan 56 26 12 6 (979)
Peru 52 33 13 3 (1191)
Japan 56 28 13 3 (2306)
Ghana 70 12 6 12 (1543)
Philippines 55 34 9 3 (1199)
Qatar 72 11 8 9 (1059)
Armenia 64 24 8 4 (1095)
Colombia 68 22 6 4 (1508)
Mexico 77 10 7 7 (1999)
Malaysia 76 16 5 3 (1288)
Rwanda 93 4 1 2 (1523)
Total 44 24 18 14 (47961)

18
Table 16: V185
To what degree are you worried about a civil war? Number of
Respondents Very much A great deal Not much Not at all
Sweden 3 4 15 78 (1197)
Australia 8 7 27 57 (1441)
New Zealand 10 7 29 54 (792)
United States 8 14 40 38 (2184)
Uzbekistan 23 18 20 39 (1350)
Poland 15 24 35 26 (944)
Chile 26 17 20 38 (950)
Uruguay 30 18 10 42 (958)
Trinidad and Tobago 27 17 22 34 (976)
Estonia 23 21 32 24 (1449)
Spain 33 15 20 32 (1177)
Azerbaijan 21 26 40 13 (979)
Cyprus (G) 30 23 22 25 (969)
Morocco 41 14 11 34 (1018)
South Korea 24 29 35 13 (1120)
Romania 34 25 20 21 (1435)
Belarus 33 27 22 18 (1458)
Russia 26 38 24 12 (2384)
Japan 45 17 22 16 (2279)
Turkey 35 33 24 9 (1576)
Ukraine 36 36 16 12 (1436)
Kazakhstan 44 21 21 14 (1439)
Pakistan 33 40 18 9 (1161)
Zimbabwe 53 14 15 19 (1455)
Nigeria 46 27 17 10 (1716)
Peru 44 31 19 7 (1170)
Philippines 47 37 13 3 (1188)
Kyrgyzstan 51 31 13 5 (1429)
Ghana 70 13 5 12 (1540)
Armenia 64 24 7 5 (1091)
Mexico 74 11 9 6 (1998)
Malaysia 74 18 5 3 (1286)
Rwanda 92 4 1 3 (1517)
Total 38 21 20 21 (45062)

19
Table 17: V186 To what degree are you worried about government wire-tapping or reading your
mail or email?
Number of
Respondents
Very much A great deal Not much Not at all
Sweden 5 12 29 55 (1193)
New Zealand 12 9 29 50 (797)
Azerbaijan 13 12 25 51 (993)
Australia 11 11 37 42 (1442)
Uruguay 23 8 8 61 (958)
Cyprus (G) 19 14 19 48 (945)
Morocco 24 10 15 51 (939)
United States 12 17 40 30 (2195)
Chile 23 14 19 44 (933)
Kazakhstan 17 20 32 31 (1397)
Spain 18 22 26 34 (1134)
Ukraine 17 23 27 33 (1399)
Russia 16 26 28 30 (2247)
Estonia 18 20 35 26 (1443)
Trinidad and Tobago 27 18 19 37 (969)
Nigeria 25 19 20 36 (1552)
Kyrgyzstan 20 24 30 26 (1350)
Pakistan 23 25 22 30 (1142)
Romania 26 22 21 31 (1410)
Belarus 24 25 25 26 (1442)
Poland 20 30 31 19 (942)
Turkey 25 25 29 21 (1573)
Zimbabwe 39 10 16 35 (1362)
Armenia 30 22 23 26 (993)
South Korea 21 29 37 13 (1090)
Peru 35 21 22 22 (1123)
Ghana 44 12 18 27 (1432)
Qatar 44 14 17 25 (1054)
Philippines 32 35 21 12 (1152)
Colombia 45 19 15 21 (1491)
Rwanda 47 17 15 21 (1511)
Japan 36 31 25 7 (2120)
Mexico 59 13 11 17 (1995)
Malaysia 64 20 10 6 (1281)
Total 28 20 24 29 (44999)

20
Table 18: V187 Do you agree or disagree with the following
statement: “Under some conditions, war is
necessary to obtain justice.”?
Number of
Respondents
Agree Disagree
Pakistan 82 18 (1200)
United States 74 26 (2193)
Qatar 57 43 (1046)
New Zealand 55 45 (809)
Australia 53 47 (1451)
Azerbaijan 52 48 (996)
Sweden 48 52 (1141)
Turkey 47 53 (1521)
Malaysia 41 59 (1300)
Armenia 40 60 (1002)
Zimbabwe 37 63 (1500)
Nigeria 36 64 (1759)
Trinidad and Tobago 31 69 (927)
Cyprus (G) 30 70 (921)
Philippines 28 72 (1197)
Ghana 28 72 (1552)
Mexico 27 73 (1987)
Morocco 26 74 (1111)
Peru 26 74 (1170)
Russia 26 74 (2184)
Colombia 22 78 (1485)
Chile 20 80 (908)
South Korea 18 82 (1153)
Japan 18 82 (1911)
Romania 16 84 (1426)
Estonia 15 85 (1429)
Poland 15 85 (920)
Kyrgyzstan 13 87 (1334)
Uzbekistan 12 88 (1381)
Kazakhstan 12 88 (1500)
Belarus 11 89 (1431)
Spain 10 90 (1132)
Ukraine 10 90 (1500)
Uruguay 9 91 (923)
Rwanda 8 92 (1527)
Total 30 70 (46927)

21
Table 19: V188 In the last 12 month, how often have you or your family gone without enough
food to eat?
Number of
Respondents
Often Sometimes Rarely Never
Qatar 2 1 2 95 (1060)
Sweden 1 2 5 93 (1202)
Malaysia 1 3 7 90 (1298)
Australia 1 3 7 89 (1462)
Poland 1 3 7 89 (964)
Spain 1 6 8 86 (1186)
New Zealand 2 6 10 82 (824)
Cyprus (G) 2 6 11 81 (982)
South Korea 2 6 12 80 (1156)
United States 2 7 13 77 (2200)
Japan 2 3 23 72 (2386)
Trinidad and Tobago 2 11 12 75 (998)
Estonia 2 9 17 72 (1526)
Turkey 2 11 15 72 (1598)
Kazakhstan 2 8 22 69 (1479)
Uzbekistan 3 9 25 63 (1493)
Chile 1 13 25 62 (998)
Morocco 3 12 21 64 (1194)
Belarus 3 13 21 64 (1496)
Ghana 3 15 19 63 (1545)
Russia 3 13 22 62 (2482)
Uruguay 6 14 13 67 (998)
Romania 5 13 17 64 (1495)
Kyrgyzstan 3 14 22 60 (1406)
Mexico 4 15 21 61 (2000)
Ukraine 8 16 22 54 (1461)
Azerbaijan 10 16 23 51 (1002)
Colombia 6 21 27 46 (1512)
Zimbabwe 7 22 27 44 (1500)
Philippines 8 23 26 43 (1195)
Armenia 12 18 24 46 (1098)
Peru 6 26 33 35 (1198)
Pakistan 7 23 37 33 (1199)
Nigeria 10 29 35 26 (1747)
Rwanda 15 47 28 11 (1522)
Total 4 13 19 63 (48862)

22
Table 20: V189 In the last 12 month, how often have you or your family felt unsafe from crime
in your own home?
Number of
Respondents
Often Sometimes Rarely Never
Qatar 0 2 2 96 (1060)
Poland 1 2 4 93 (960)
Armenia 1 2 3 94 (1078)
Uzbekistan 0 4 7 88 (1424)
Belarus 1 3 11 86 (1473)
Sweden 1 4 9 87 (1200)
Azerbaijan 2 3 8 87 (997)
South Korea 0 4 12 83 (1157)
Estonia 1 4 13 82 (1519)
Spain 1 4 14 81 (1185)
Kazakhstan 2 4 13 80 (1457)
Malaysia 2 6 15 77 (1295)
Australia 1 6 23 70 (1461)
Russia 2 9 16 74 (2444)
United States 1 8 20 71 (2196)
Romania 3 9 13 75 (1489)
Ukraine 3 8 17 72 (1416)
Turkey 2 10 20 69 (1601)
Cyprus (G) 2 11 16 70 (980)
Ghana 2 10 20 68 (1544)
Japan 0 6 35 59 (2364)
New Zealand 2 10 24 64 (822)
Kyrgyzstan 2 12 22 65 (1388)
Morocco 4 14 20 62 (1184)
Uruguay 9 19 12 60 (996)
Trinidad and Tobago 6 21 16 57 (998)
Philippines 7 17 25 51 (1193)
Colombia 11 20 21 48 (1511)
Pakistan 11 17 36 36 (1197)
Zimbabwe 6 25 33 35 (1493)
Chile 6 32 26 35 (1000)
Nigeria 9 21 40 29 (1736)
Mexico 14 28 19 39 (2000)
Rwanda 7 41 32 20 (1523)
Peru 13 35 28 23 (1196)
Total 4 12 19 64 (48537)

23
Table 21: V190 In the last 12 month, how often have you or your family gone without needed
medicine or treatment that you needed?
Number of
Respondents
Often Sometimes Rarely Never
Qatar 0 1 1 98 (1060)
South Korea 1 3 10 87 (1163)
Spain 0 4 10 86 (1186)
Malaysia 1 5 8 86 (1298)
Sweden 1 5 8 86 (1190)
Australia 1 6 9 83 (1459)
Belarus 1 7 16 75 (1479)
Cyprus (G) 3 8 12 77 (979)
Poland 4 7 10 78 (964)
Japan 1 3 29 66 (2386)
New Zealand 2 10 13 75 (823)
Trinidad and Tobago 3 11 10 76 (998)
Estonia 2 10 16 72 (1523)
Kazakhstan 3 9 19 69 (1472)
Uruguay 5 12 10 74 (997)
Turkey 2 12 25 62 (1601)
Russia 4 11 19 66 (2436)
United States 5 14 14 67 (2201)
Kyrgyzstan 3 15 24 58 (1350)
Uzbekistan 3 13 27 57 (1488)
Ghana 4 19 26 52 (1542)
Ukraine 7 15 22 55 (1414)
Chile 4 20 27 50 (990)
Mexico 9 22 14 55 (2000)
Colombia 9 19 18 54 (1510)
Romania 11 19 18 52 (1495)
Azerbaijan 8 19 32 41 (990)
Armenia 12 19 21 48 (1098)
Philippines 10 24 30 36 (1199)
Nigeria 6 26 43 25 (1740)
Zimbabwe 8 30 30 32 (1495)
Peru 10 28 31 32 (1192)
Pakistan 9 28 36 27 (1194)
Morocco 10 40 24 25 (1194)
Rwanda 17 49 27 7 (1519)
Total 5 16 20 59 (48625)

24
Table 22: V191 In the last 12 month, how often have you or your family gone without a cash
income?
Number of
Respondents
Often Sometimes Rarely Never
Qatar 2 2 4 93 (1060)
Sweden 1 5 7 87 (1201)
Malaysia 1 6 13 81 (1298)
Australia 2 8 13 77 (1457)
South Korea 3 8 17 71 (1158)
New Zealand 4 11 12 73 (819)
Spain 3 12 17 69 (1186)
Uruguay 5 12 12 70 (995)
Japan 3 10 28 60 (2361)
United States 6 13 14 66 (2194)
Cyprus (G) 6 12 18 63 (982)
Trinidad and Tobago 3 19 15 63 (996)
Chile 2 18 30 50 (983)
Poland 7 17 20 56 (962)
Uzbekistan 4 19 29 48 (1491)
Colombia 7 22 23 48 (1509)
Turkey 8 24 23 44 (1598)
Ghana 9 29 24 38 (1539)
Peru 8 27 33 31 (1188)
Armenia 17 22 22 39 (1097)
Mexico 11 33 20 36 (1999)
Kyrgyzstan 12 28 32 28 (1377)
Kazakhstan 13 27 31 29 (1478)
Pakistan 10 34 32 24 (1189)
Estonia 18 25 27 30 (1526)
Philippines 16 29 31 24 (1196)
Morocco 14 39 18 28 (1190)
Russia 17 34 26 24 (2474)
Nigeria 14 39 30 17 (1743)
Romania 25 26 22 27 (1500)
Belarus 20 35 23 22 (1517)
Zimbabwe 20 38 24 17 (1494)
Azerbaijan 28 34 23 14 (998)
Ukraine 30 33 22 15 (1470)
Rwanda 47 37 12 4 (1513)
Total 12 23 22 43 (48738)

25
Table 22: Factor Analysis Component
Worry About the
Future
Physical Security Economic
Security
Crime Personal Safety Use of Force
Secure in neighborhood -.402
Robberies .686
Alcohol consumption .689
Police or military
interference
.714
Racist behavior .713
Drug sales .757
Didn’t carry much money .838
Preferred not to go out at
night
.828
Carried a knife, gun or other
weapon
.623
Respondent was victim of a
crime in the past year
.777
Respondent’s family was
victim of a crime in the past
year
.787
Worried about losing job/
not finding a job
.662
Worried about not giving
children a good education
.712
Worried about war
involving one’s country
.866
Worried about a terrorist
attack
.862
Worried about a civil war .877
Worried about government
wiretapping or reading
mail/e-mail
.669
Under some conditions, war
is necessary to obtain
justice
.762
In last 12 months, has gone
without enough food to eat
.833
In last 12 months, felt
unsafe in one’s own home
.336 .536 .321
In last 12 months, has gone
without medicine or
treatment
.828
In last 12 months, has gone
without cash income
.808
Loadings under +/-.300 dropped

26
Table 23: Those least worried about the future have lower scores Country Worry About the Future
Sweden -1.19
New Zealand -0.80
United States -0.63
Uzbekistan -0.58
Chile -0.57
Trinidad and
Tobago
-0.42
Australia -0.33
Poland -0.33
Estonia -0.31
Morocco -0.24
Cyprus (G) -0.22
Spain -0.18
Uruguay -0.17
Romania -0.16
Russia -0.15
Belarus -0.03
Ukraine 0.04
Kazakhstan 0.10
Pakistan 0.13
South Korea 0.16
Turkey 0.27
Zimbabwe 0.30
Nigeria 0.37
Japan 0.38
Peru 0.44
Mexico 0.49
Azerbaijan 0.51
Kyrgyzstan 0.52
Philippines 0.63
Qatar 0.67
Ghana 0.71
Colombia 0.80
Armenia 1.06
Malaysia 1.19
Rwanda 1.28

27
Table 24: Those who perceive the least threat to their physical security have lower scores
Country Physical Security
Azerbaijan -1.12
Armenia -1.08
Japan -0.97
Poland -0.76
Cyprus (G) -0.60
South Korea -0.44
Turkey -0.41
Romania -0.32
Estonia -0.29
Malaysia -0.22
Qatar -0.21
Rwanda -0.20
Kazakhstan -0.16
Uzbekistan -0.14
Kyrgyzstan -0.13
United States -0.10
Ukraine -0.09
Spain -0.05
Australia 0.01
Ghana 0.01
Nigeria 0.04
Sweden 0.04
Colombia 0.04
New Zealand 0.13
Morocco 0.16
Pakistan 0.19
Uruguay 0.20
Chile 0.24
Trinidad and
Tobago
0.31
Russia 0.39
Peru 0.43
Philippines 0.46
Belarus 0.49
Mexico 0.55
Zimbabwe 0.60

28
Table 25: Those who perceive the least threat to their economic security have lower scores Country Economic Security
Qatar -2.30
Sweden -1.27
South Korea -1.24
Malaysia -1.17
Australia -0.88
Poland -0.88
Spain -0.85
Uzbekistan -0.73
Japan -0.59
New Zealand -0.53
Cyprus (G) -0.47
Trinidad and
Tobago
-0.42
United States -0.28
Uruguay -0.24
Belarus -0.22
Estonia -0.20
Kazakhstan -0.16
Turkey -0.11
Chile -0.06
Russia -0.04
Ghana 0.01
Mexico 0.02
Colombia 0.04
Kyrgyzstan 0.07
Armenia 0.12
Romania 0.21
Morocco 0.31
Ukraine 0.31
Philippines 0.37
Peru 0.41
Azerbaijan 0.58
Pakistan 0.65
Zimbabwe 0.68
Nigeria 0.76
Rwanda 1.47

29
Table 26: Those who perceive the least amount of crime have lower scores Country Crime
Armenia -0.77
Uzbekistan -0.75
Qatar -0.73
Belarus -0.44
Turkey -0.42
Kyrgyzstan -0.41
Kazakhstan -0.40
Poland -0.36
Azerbaijan -0.33
Philippines -0.31
Russia -0.28
Cyprus (G) -0.22
Estonia -0.22
Romania -0.22
Japan -0.18
Spain -0.17
Ghana -0.09
Nigeria -0.04
South Korea -0.04
Malaysia -0.03
Morocco -0.03
United States 0.00
Trinidad and
Tobago
0.02
Chile 0.11
Pakistan 0.11
Zimbabwe 0.13
Australia 0.19
Sweden 0.29
Colombia 0.30
New Zealand 0.31
Rwanda 0.36
Mexico 0.38
Peru 0.46
Uruguay 0.48

30
Table 27: Those who take the least precautions in regards to personal safety have lower scores Country Personal Safety
Qatar -1.22
Spain -1.09
Rwanda -0.82
Ghana -0.56
Romania -0.47
Australia -0.37
Turkey -0.34
Cyprus (G) -0.30
Sweden -0.29
New Zealand -0.10
United States -0.09
Belarus -0.08
Uzbekistan -0.06
Armenia -0.01
Uruguay 0.06
Philippines 0.10
Colombia 0.12
Poland 0.13
Trinidad and
Tobago
0.17
Zimbabwe 0.24
South Korea 0.26
Nigeria 0.27
Chile 0.28
Ukraine 0.30
Azerbaijan 0.37
Estonia 0.37
Kazakhstan 0.41
Russia 0.42
Pakistan 0.61
Malaysia 0.80
Japan 0.80

31
Table 28: Those who least agree with using force to increase security have lower scores Country Use of Force
Spain -0.87
Uruguay -0.67
Romania -0.63
Rwanda -0.62
Ghana -0.35
Peru -0.34
Colombia -0.31
Poland -0.29
Australia -0.26
Cyprus (G) -0.19
Trinidad and
Tobago
-0.09
Nigeria -0.02
Malaysia 0.02
Russia 0.04
Philippines 0.11
Zimbabwe 0.14
Sweden 0.17
Qatar 0.80
United States 0.83

32
Table 29: Physical Security Component Score and Crime Statistics
Country Physical
Security
Country Homicide
per
100,000
Country Rape per
100,1000
Country Theft
per
100,000
Azerbaijan -1.12 Japan 0.4 Azerbaijan 0.2 Azerbaijan 40.4
Armenia -1.08 Spain 0.8 Armenia 0.4 Qatar 106.6
Japan -0.97 Qatar 0.9 Japan 1.0 Philippines 110.7
Poland -0.76 New Zealand 0.9 Ukraine 1.4 Mexico 116.4
Cyprus (G) -0.60 Australia 1.0 Turkey 1.5 Cyprus 117.8
South Korea -0.44 Sweden 1.0 Qatar 1.8 Armenia 118.5
Turkey -0.41 Poland 1.1 Belarus 2.3 Malaysia 139.7
Romania -0.32 Armenia 1.4 Cyprus 2.5 Turkey 170.2
Estonia -0.29 Morocco 1.4 Spain 3.4 Peru 172.0
Malaysia -0.22 Cyprus 1.7 Russia 3.4 Kyrgyzstan 185.3
Qatar -0.21 Romania 2.0 Poland 4.1 Colombia 196.8
Rwanda -0.20 Azerbaijan 2.2 Romania 4.7 Romania 215.6
Kazakhstan -0.16 Malaysia 2.3 Morocco 4.8 Morocco 247.8
Uzbekistan -0.14 South Korea 2.6 Kyrgyzstan 5.9 Trinidad and
Tobago
282.3
Kyrgyzstan -0.13 Uzbekistan 3.1 Estonia 6.0 Spain 313.9
United States -0.10 Turkey 3.3 Philippines 6.3 Kazakhstan 336.4
Ukraine -0.09 Chile 3.7 Colombia 6.8 Japan 483.7
Spain -0.05 United States 4.8 Kazakhstan 8.3 Poland 532.7
Australia 0.01 Belarus 4.9 Uruguay 9.8 South Korea 535.2
Ghana 0.01 Estonia 5.2 Mexico 13.2 Ukraine 560.5
Nigeria 0.04 Ukraine 5.2 Chile 13.3 Zimbabwe 734.5
Sweden 0.04 Philippines 5.4 South Korea 13.5 Russia 775.3
Colombia 0.04 Uruguay 5.9 Trinidad and
Tobago
18.5 Belarus 854.5
New Zealand 0.13 Pakistan 7.8 Peru 23.5 Chile 1092.6
Morocco 0.16 Kazakhstan 8.8 Zimbabwe 25.6 Estonia 1883.0
Pakistan 0.19 Russia 10.2 New Zealand 25.8 United States 1993.0
Uruguay 0.20 Peru 10.3 United States 27.3 Australia 2071.0
Chile 0.24 Nigeria 12.2 Sweden 63.5 New Zealand 2677.1
Trinidad and
Tobago
0.31 Zimbabwe 14.3 Australia 91.9 Uruguay 3182.1
Russia 0.39 Ghana 15.7 Malaysia N/A Sweden 3923.0
Peru 0.43 Rwanda 17.1 Rwanda N/A Rwanda N/A
Philippines 0.46 Kyrgyzstan 20.1 Uzbekistan N/A Uzbekistan N/A
Belarus 0.49 Mexico 23.7 Ghana N/A Ghana N/A
Mexico 0.55 Colombia 31.4 Nigeria N/A Nigeria N/A
Zimbabwe 0.60 Trinidad and
Tobago
35.2 Pakistan N/A Pakistan N/A
All crime data is from the United Nations Office on Drugs and Crime: http://www.unodc.org/unodc/en/data-and-
analysis/statistics/data.html

33
Table 30: Economic Security Component Score and Economic Statistics Country Economic
Security
Country GDP per
capita
(PPP)
Country Inflation in
consumer
prices
(Annual %)
Country Unemployment
(% of Total Labor
Force)
Qatar -2.30 Qatar 77987.10 Japan -0.3 Qatar 0.5
Sweden -1.27 United States 42486.00 Morocco 0.9 Ghana 3.6
South Korea -1.24 Sweden 35170.10 Qatar 1.9 South Korea 3.7
Malaysia -1.17 Australia 34395.50 Sweden 3.0 Malaysia 3.7
Australia -0.88 Japan 30660.40 Malaysia 3.2 Zimbabwe 4.2
Poland -0.88 South Korea 27541.30 Spain 3.2 Japan 5.0
Spain -0.85 Spain 26917.10 United States 3.2 Pakistan 5.0
Uzbekistan -0.73 Cyprus 26045.60 Cyprus 3.3 Australia 5.2
Japan -0.59 New Zealand 24429.00 Chile 3.3 Trinidad and
Tobago
5.3
New Zealand -0.53 Trinidad and
Tobago
22141.70 Australia 3.4 Mexico 5.3
Cyprus (G) -0.47 Estonia 18129.00 Mexico 3.4 Azerbaijan 6.0
Trinidad and
Tobago
-0.42 Poland 18087.40 Colombia 3.4 Cyprus 6.2
United States -0.28 Chile 15250.80 Peru 3.4 Peru 6.3
Uruguay -0.24 Russia 14821.00 South Korea 4.0 New Zealand 6.5
Belarus -0.22 Malaysia 14174.00 Poland 4.2 Kazakhstan 6.6
Estonia -0.20 Turkey 13468.10 New Zealand 4.4 Uruguay 7.3
Kazakhstan -0.16 Uruguay 13314.90 Philippines 4.6 Romania 7.3
Turkey -0.11 Belarus 13191.20 Estonia 5.0 Philippines 7.4
Chile -0.06 Mexico 12813.80 Trinidad and
Tobago
5.1 Russia 7.5
Russia -0.04 Kazakhstan 11567.70 Rwanda 5.7 Chile 8.1
Ghana 0.01 Romania 10905.40 Romania 5.8 Sweden 8.4
Mexico 0.02 Peru 9037.20 Turkey 6.5 Kyrgyzstan 8.6
Colombia 0.04 Azerbaijan 8889.90 Armenia 7.7 Ukraine 8.8
Kyrgyzstan 0.07 Colombia 8859.80 Azerbaijan 7.9 Poland 9.6
Armenia 0.12 Ukraine 6365.20 Ukraine 8.0 United States 9.6
Romania 0.21 Armenia 5112.40 Uruguay 8.1 Morocco 10.0
Morocco 0.31 Morocco 4373.30 Kazakhstan 8.3 Colombia 11.6
Ukraine 0.31 Philippines 3637.60 Russia 8.4 Turkey 11.9
Philippines 0.37 Uzbekistan 2903.00 Ghana 8.7 Estonia 16.9
Peru 0.41 Pakistan 2423.90 Nigeria 10.8 Spain 20.1
Azerbaijan 0.58 Nigeria 2236.80 Pakistan 11.9 Armenia 28.6
Pakistan 0.65 Kyrgyzstan 2118.50 Kyrgyzstan 16.5 Uzbekistan N/A
Zimbabwe 0.68 Ghana 1652.30 Belarus 53.2 Belarus N/A
Nigeria 0.76 Rwanda 1132.20 Zimbabwe 1096.7 Nigeria N/A
Rwanda 1.47 Zimbabwe N/A Uzbekistan N/A Rwanda N/A
All economic data is from the World Bank: http://data.worldbank.org/