Embed Size (px)
Citation preview

1
Results from the CII-2004 campaign at the BIPM of
the BIPM.L-K11 ongoing key comparison.
L. Robertsson, M. Zucco, L.-S. MaBIPM, Pavillon de Breteuil, 92312 Sèvres, France
Quin JIN, Xiuying LIU, Zhongyou LIUNIM, 18, Bei san huan donglu, Bejing, Kina,
J.-P. WallerandLNE-INM,
CNAM, 292 rue Saint Martin, 75003 Paris
Steven Van den Berg,NMi Van Swinden Laboratorium B. V.,
Thijsseweg 11, 2629 JA Delft, The Netherlands
Reine Johansson, Håkan SkooghSP Swedish National Testing and Research Institute,
Brinellgatan 4, 504 62 BORÅS, Sweden
Abstract
Lasers from four national metrological institutes (NMIs) were brought to the BIPM inNovember 2004 as part of the BIPM.L-K11 ongoing key comparison initiated by the ComitéConsultative des Longueurs (CCL) 11th meeting in 2003. The absolute frequency of the fcomponent of the R(127) 11-5 transition was measured for these lasers following the Protocolfor BIPM.L-K11. The results of these measurements are compiled in the present paper. Thecomparison reports, as communicated by each participant, are included as Appendices.

2
Introduction
The BIPM.L-K10 (K10) key comparison was initiated in 1993 to provide a basis fordemonstrating equivalence of national realizations of wavelength-standards used for therealization of the definition of the SI metre according to method (c) in the Mise en Pratique(MeP) [1]. The K10 took only the 633 nm He-Ne standards into consideration. Such acomparison seemed of particular importance since these lasers were most often used in thewhole field of dimensional metrology to provide traceability to the metre. The measurand ofthe comparison was the difference between lasers of the average frequency of the componentsd, e, f, and g in the R(127) 11-5 line as obtained by matrix measurements [2]. The frequencyof the reference laser BIPM-4 was used as the key comparison reference value.
During the last few years, the situation for realization of the metre has changed due to theintroduction of new techniques for absolute frequency measurements. This has opened up themethod (b) in the MeP for the realization of wavelength standards traceable to the second.The practical consequence of this development is that, at least, two methods are today beingused for the realization of the metre, and several wavelengths, important for dimensionalmetrology applications, can now demonstrate traceability with relative ease. Consideringthese circumstances, the 11th CCL meeting, held in October 2003, decided to close the K10comparison and initiate a new key comparison named BIPM.L-K11 (K11) [3].
The K11 concerns those wavelengths present in the list of recommended radiations in theMeP, which are used in the field of dimensional metrology. Typical examples would be the633 nm, 612 nm, 543 nm and 532 nm iodine-stabilized standards but others may also becomeappropriate to include. The CCL also proposed to include absolute frequency measurements,matrix measurements as well as direct frequency heterodyne measurements in which only thedifference in frequency between two standards is measured. Besides being a key comparison,K11 will not only provide reduced uncertainties for the frequencies listed in the MeP but alsoextend the ways in which participants can claim traceability to the definition of the metre tocomply with the MRA and the related ISO/IEC 17025 [4].
Measurements
Four NMI’s took part in the measurement campaign at the BIPM in the spring of 2004. Theseinstitutes are listed in Table 1. The measurements carried out are compatible with both theprotocol of K11 and the BIPM quality procedures for such measurements. For these laserstandards, all working at 633 nm, the f-component of the 127(R) 11-5 transition in iodine wasmeasured being the reference component recommended in the MeP.
Country NMI Contact person StandardChina NIM Qian JIN NIM-D1France LNE-INM J.-P. Wallerand INM9Netherlands NMi VSL S. Van den Berg NMi-5Sweden SP R. Johansson SP2
Table 1. Participants

3
The femtosecond comb arrangement used is based on a Kerr-lens mode-locked ring laser witha repetition rate of ~740 MHz, pumped by 5 W of 532 nm radiation from a single frequencyNd:YVO4 laser [5]. A decimeter long photonic-crystal fiber was used to widen the combspectrum to more than one octave so as to control the carrier-envelope-offset frequency. Atypical signal-to-noise ratio (S/N) of 40 dB to 45 dB in a 300 kHz bandwidth was obtained forthe self-referencing signal. All frequency generators and frequency counters used arereferenced to a local hydrogen maser providing a 10 MHz (UTC) reference frequency knownto within 5 parts in 1014 and with a stability better then 2 parts in 1013 in 1 s. Both therepetition rate and the carrier-envelope-offset frequency are phase-locked to a local hydrogenmaser calibrated against the BIPM’s internal time service.
For lasers that are weak in power or stabilized by the third harmonic technique it isadvantageous to use a buffer laser, i.e. a laser which simultaneously beats with a combcomponent and the laser to be measured. The two beats so obtained are mixed and theresulting frequency difference, or sum, is used for counting. The resulting beat had a typicalS/N of 35 db in a 300 kHz bandwidth. It should be pointed out that by the introduction of themixing of these two beat signals, phase-coherence is kept between the comb and the lasersubject for the frequency determination. The noise contribution from the buffer laseressentially vanishes. By keeping phase-coherence from the hydrogen maser oscillation all theway up to the optical frequency, noise can be minimized giving a shorter integration time. Forthe present measurements, light from the buffer-laser was delivered by an optical fiber to thelaboratory in which the participating laser standards were kept. Perturbations due to thermalchanges, acoustic noise etc. could in this way be minimized. The RF beat signal between themeasured laser and the buffer laser was then returned to the comb laboratory for furthertreatment. Three data records of ~300 samples were taken for each laser using a counter gatetime of one second. Table 2 gives the values used for the most important working parametersfor each standard. Additional information can be found in Appendices 1-4.
Standard Power1
[µW]
I2 temp.2
[°C]
Modulation width3
[MHz]
NIM-D1 92 (2) 14.87(0.1) 6.0(0.1)INM9 80(2) 15.04(0.01) 5.94(0.10)NMi 109(2.0) 14.96(0.08) 6.22(0.1)SP2 115(3.0) 15.06(0.05) 6.0(0.1)
Table 2. Working parameter values for the standards with estimated standard uncertainty inparenthesis as given in the measurement reports included in Appendices 1-4.
1 Output power when laser stabilised to the f component.2 Cold-finger temperature.3 Peak to peak modulation width.

4
Data reduction and results
In Table 3 are listed the recorded data series. The frequencies in column 4 are offset by thevalue 473 612 353 000 kHz. The file names give date and time for the registration of therecord in the format ddmmyy hhmm.
Standard File N f [kHz] s(f) [ kHz]
NIM-D1 291104 1506 303 595.249 0.24291104 1514 313 594.977 0.23291104 1522 305 595.170 0.23
INM9 261104 1515 310 602.346 0.12261104 1523 317 602.302 0.11261104 1529 306 602.358 0.11
NMi-5 161104 1121 308 597.400 0.21161104 1127 303 598.100 0.23161104 1133 320 597.475 0.21
SP2 241104 1510 1010 601.569 0.66241104 1528 1012 604.124 0.72241104 1547 1030 603.075 0.65
Table 3. Absolute frequency measurement data records. N – number of 1 s data samples, f –frequency relative to 473 612 353 000 kHz, and s(f) – the statistical fluctuations of thefrequency of the laser standard itself given as one standard deviation of the mean.
Weighted mean values from the data in Table 3 are calculated for each laser using thestandard deviation of the mean as the weight of each data record. The uncertainties given incolumn 5 of Table 3 are the a priori uncertainties obtained from the statistical uncertainty ineach measurement. It should also be checked that the posteriori result is consistent by areduced χ2-test. This can reveal unexpected instabilities and possible problems when re-locking the standard. If the presence of such instabilities is detected the individualuncertainties should be inflated so as to obtain a reduced χ2-value of 1. In Table 4 are listedthe final results for each laser.
The uncertainty of the determined frequency is composed of two parts, one from thefrequency measurement, u1, and one from the uncertainty in the settings of the workingparameters, u2. The latter, the uncertainties related to the standard itself are to be estimated byeach operator in accordance with their quality system and are detailed in Appendices 1-4.
The uncertainty stemming from the measurements, u1, are estimated by the operator of theexperiment or together with personnel involved in the comparison, again in accordance with aquality procedure if one exists. Here u1 is taken as the root-sum-square (RSS) of thecalculated uncertainty (with a reduced χ2 equal to one) of the weighted mean for the threemeasurement series for each laser as described above and 25 Hz uncertainty from the

5
frequency reference and finally 20 Hz as a general estimated maximum uncertainty of thecomb measurement method.
Institute Standard f [kHz] u1(f) [kHz] u2(f) [kHz] uc(f) [kHz]
NIM NIM-D1 595.1 0.09 1.9 1.9LNE-INM INM9 602.3 0.04 1.6 1.6NMi NMi-5 597.6 0.22 2.3 2.3SP SP2 602.9 0.73 6.8 6.8
Table 4. Final frequency values f for the standards relative to 473 612 353 000 kHz. u1
corresponds to standard uncertainty stemming from the measurement. u2 is the estimateduncertainty propagated from the uncertainty in the values of the working parameters for thestandard. uc is the RSS of u1 and u2, given at a confidence level of 68% assuming a largenumber of degrees of freedom.
Figure 1. The final frequency values as given in column 3 in Table 4 for each laser. The solidline represents the present recommended value for the 633 nm laser standard and the dottedlines its uncertainty [1].
Conclusion
Frequency measurements have been carried out on 4 primary wavelength standards. Goodagreement between the lasers and also with the frequency value recommended in the MePwas found. The uncertainty of the laser frequencies is estimated to be of few kHz, which isconsiderably smaller than the uncertainty obtained by using the method (c) in the MeP, i.e. 10kHz.
620
615
610
605
600
595
590
Freq
uenc
y - 4
73 6
12 3
53 0
00 [k
Hz]
NIM LNE-INM NMi SP

6
References
[1] T. J. Quinn, "Practical realization of the definition of the metre, includingrecommended radiations of other optical frequency standards (2001)", Metrologia,vol. 40, pp. 103-133, 2003.
[2] Bayer-Melms F., Chartier J.-M., Helmcke J., Wallard a. J., PTB-Bericht, 1977, PTP-ME 17, 139-146.
[3] Proceedings from the 11th CCL meeting.
[4] International Organization of Standardization, ISO/IEC 17025, Geneva Switzerland.
[5] L. S. Ma, L. Robertsson, S. Picard, J.-M. Chartier, H. Karlsson, E. Prieto, J. K.Ranka, and R. S. Windeler, "The BIPM laser standards at 633 nm and 532 nmsimultaneously linked to the SI second using a femtosecond laser in an optical clockconfiguration", IEEE. Trans. Inst. Meas., vol. 52, pp. 232-235, 2003.

7
Appendix 1, NIM.Comparison report, BIPM.L-K11.
After each series of comparison measurements a copy of this report is to be sent Lennart Robertsson atthe BIPM by e-mail for inclusion in the key comparison. Add new lines in the tables as needed andmodify names of sensitivity coefficients and operational parameters as relevant for the standard beingcompared.
D1. Host laboratory4
Lab. Name BIPM
Contact person Lennart Robertsson
Address Pavillon de Breteuil, 92312 SEVRES CEDEX , France
Tel. (33) 1 45 07 70 53
e-mail [email protected]
D2. Measurements4
Quantity
compared
The frequency of the output beam of the laser when this is stabilized to the f
component of the 11-5, R(127) transition in 127I2 contained in a glass tube.
Period 25/11/04-05/12/04
Describe
measurements
The absolute frequency of the laser was measured using the BIPM femtosecond
laser comb set-up following the technical protocol for the method BIPM.L-K11
m1. Initially the laser was compared with a second iodine system for the
determination of some sensitivity parameters
References and/or
other
documentation
4 To be filled in by the host laboratory

8
Detailed description of standard5
Give description of the standard, one page for each participating standard (here examples for 633 nm)
D3. LaboratoryLab. Name NIM
Operators Qian JIN, Xiuying LIU, Liu Zhongyou
Address NIM, 18, Bei san huan donglu, Bejing, Kina,
Tel.
e-mail [email protected]
D4. StandardDesignation of laser standard NIM-D1, Tube and laser NIM.
Standard last compared
Modification on standard since
Spectroscopy Intracavity saturation spectroscopy
Modulation technique 3rd harmonic
Modulation frequency /kHz 2.77
Modulation width or index / 6 MHz p.p Nominal
Laser cavity length /cm 33
Mirror curvature R1 (tube side) /cm 60
Mirror curvature R2 (cell side) /cm 120
Mirror transmission T1 (tube side) / % 0.8
Mirror transmission T2 (cell side) / % 0.3
Output mirror, 1 or 2.
Designation of iodine cell PTB 1987
Cell length /Brewster /flat windows/origin 10 cm / Brewster/PTB
5 To be filled in by the participating NMI.

9
D5. Description of measurements4,5
Give a brief description of the measurements made and the techniques used.
¾ Method: A femtosecond laser comb system (BIPM C1) is used to measure the absolute frequency of the633 nm standard. The standard is beating with a buffer laser, which also beats with the comb. The twobeats are then subtracted and counted. All counters and frequency generators are referenced to ahydrogen maser. This maser is frequency calibrated by the BIPM time-section which thus provide thelink between the measured frequency and the SI.
¾ Conditions: The measurements are made in accordance with the BIPM quality system. Groups of 3 datarecords of approximately 300 seconds are taken
¾ Special observation. A set of 3 records are used for the final result (files ,291104-1506, -1514, -1522).The frequency value is taken as the weighted average value with uncertainties scaled to obtain a reducedχ2 value of one (Birge ratio equal to one).
1) References to measuring system if there are: The BIPM laser standards at 633 nm and 532 nmsimultaneously linked to the SI second using a femtosecond laser in an optical clock configuration,Ma L. S., Robertsson L., Picard S., Chartier J.-M., Karlsson H., Prieto E., Ranka J. K., WindelerR. S., IEEE Trans. Instrum. Meas., 2003, 52, 232-235.
D6. Sensitivity coefficients5
ParameterSens. Coeff.
Value
Uncertainty Unit Comments.
Modulation
width
-11.1 1.1 kHz/MHz
Iodine pressure -7.86 0.37 kHz/Pa
Power (output) -0.155 0.028 kHz/µW
Cell wall
temperature
0.20 0.06 kHz/ °C This parameter is not well
known so the value 0.2 is
proposed as default value .
The uncertainty of 0.06
results from a tolerance of
± 0.1
The list of parameters that influence the frequency of the standard might vary for different wavelengthsand system. Some of the ones relevant for a typical 633 nm standard is included in the list.
D7. Measurements and parameter settings5
10
Parameter settings (different parameters can be important for different kind of standards)Parameter value Uncertainty Unit CommentsOutput power 92 2 µWModulation width 6.0 0.1 MHzIodine cell coldfinger temperature
14.87 0.1 °C
Cell walltemperature
26 2 °C
Compilation of measurement and results
Two types of uncertainty can be identified in the measurements, the one that comes from themeasurement of the standard, u1, and the one that results from the uncertainty in the parameter settingfor the standard, u2.
D8. u1.Typical sources of uncertainty in the measurements could be4,5
source Value unit commentsFrequency reference 25 HzStat. disp. of results 81 HzUncertainty inmeasurement method
20 Hz
Total 87 Hz
D9. u2.Typical contributions to the uncertainty from the parameter settings5
Source Value unit commentsLaser power 0.32 kHzModulation width 1.12 kHzIodine cold fingertemperature
1.26 kHz
Cell wall temp 0.12 kHzElectronic offset 0.5 kHzAlignment 0.58 kHz
Total 1.88 kHz
D10. Results:Name of standard Lab. Result uc Unit CommentsNIM-D1 NIM 473 612 353 595.1 1.9 kHz Given at a conf.
level of 68%assuming a largenumber of degreesof freedom.

11
Appendix 2, LNE-INM.Comparison report, BIPM.L-K11.
After each series of comparison measurements a copy of this report is to be sent Lennart Robertsson atthe BIPM by e-mail for inclusion in the key comparison. Add new lines in the tables as needed andmodify names of sensitivity coefficients and operational parameters as relevant for the standard beingcompared.
D1. Host laboratory6
Lab. Name BIPM
Contact person Lennart Robertsson
Address Pavillon de Breteuil, 92312 SEVRES CEDEX , France
Tel. (33) 1 45 07 70 53
e-mail [email protected]
D2. Measurements6
Quantity
compared
The frequency of the output beam of the laser when this is stabilized to the f
component of the 11-5, R(127) transition in 127I2 contained in a glass tube.
Period 26-26 November 2004
Describe
measurements
The absolute frequency of the laser was measured using the BIPM femtosecond
laser comb set-up following the technical protocol for the method BIPM.L-K11
m1. Initially the laser was compared with a second iodine system for the
determination of some sensitivity parameters
References and/or
other
documentation
6 To be filled in by the host laboratory
12
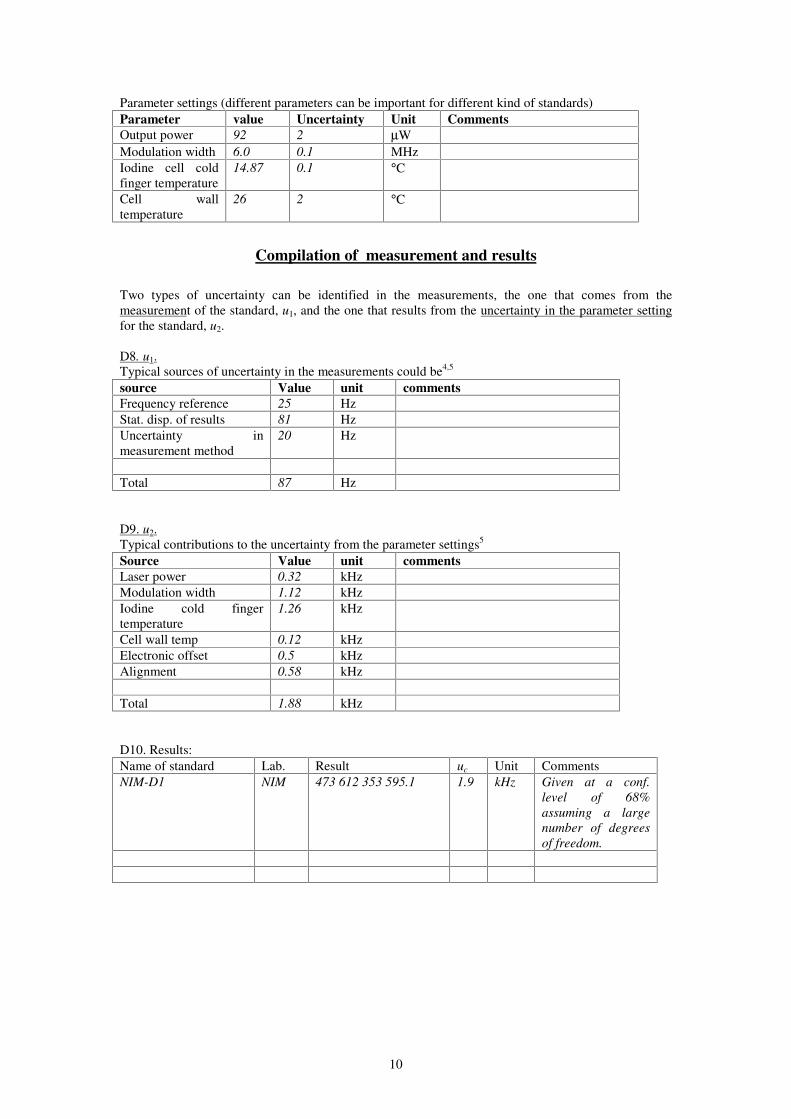
Detailed description of standard7
Give description of the standard, one page for each participating standard (here examples for 633 nm)
D3. LaboratoryLab. Name LNE-INM
Operators Jean-Pierre Wallerand
Address CNAM, 292 rue Saint Martin, 75003 Paris
Tel.
e-mail [email protected]
D4. StandardDesignation of laser standard INM9, tube NEC, GLT 20-40
Standard last compared
Modification on standard since
Spectroscopy Intracavity saturation spectroscopy
Modulation technique 3rd harmonic
Modulation frequency /kHz 5.555
Modulation width or index / 6 MHz p.p Nominal
Laser cavity length /cm 40
Mirror curvature R1 (tube side) /cm inf
Mirror curvature R2 (cell side) /cm 60
Mirror transmission T1 (tube side) / % 1
Mirror transmission T2 (cell side) / % 1
Output mirror, 1 or 2.
Designation of iodine cell BIPM-9 (1975)
Cell length /Brewster /flat windows/origin 10 cm / Brewster/BIPM
7 To be filled in by the participating NMI.

13
D5. Description of measurements6,7
Give a brief description of the measurements made and the techniques used.
¾ Method: A femtosecond laser comb system (BIPM C1) is used to measure the absolute frequency of the633 nm standard. The standard is beating with a buffer laser, which also beats with the comb. The twobeats are then subtracted and counted. All counters and frequency generators are referenced to ahydrogen maser. This maser is frequency calibrated by the BIPM time-section which thus provide thelink between the measured frequency and the SI.
¾ Conditions: The measurements are made in accordance with the BIPM quality system. Groups of 3 datarecords of approximately 300 seconds are taken
¾ Special observation. A set of 3 records are used for the final result (files ,261104-1515, -1523, -1529).The frequency value is taken as the weighted average value with uncertainties scaled to obtain a reducedχ2 value of one (Birge ratio equal to one).
2) References to measuring system if there are: The BIPM laser standards at 633 nm and 532 nmsimultaneously linked to the SI second using a femtosecond laser in an optical clock configuration,Ma L. S., Robertsson L., Picard S., Chartier J.-M., Karlsson H., Prieto E., Ranka J. K., WindelerR. S., IEEE Trans. Instrum. Meas., 2003, 52, 232-235.
D6. Sensitivity coefficients7
ParameterSens. Coeff.
Value
Uncertainty Unit Comments.
Modulation
width
-10. 0 kHz/MHz
Iodine pressure -8.4 0.33 kHz/Pa
Power (output) -0.15 0.03 kHz/µW
Cell wall
temperature
0.20 0.06 kHz/ °C This parameter is not well
known so the value 0.2 is
proposed as default value .
The uncertainty of 0.06
results from a tolerance of
± 0.1
The list of parameters that influence the frequency of the standard might vary for different wavelengthsand system. Some of the ones relevant for a typical 633 nm standard is included in the list.

14
D7. Measurements and parameter settings7
Parameter settings (different parameters can be important for different kind of standards)Parameter value Uncertainty Unit CommentsOutput power 80 2 µWModulation width 5.94 0.1 MHzIodine cell coldfinger temperature
15.04 0.01 °C
Cell walltemperature
2 °C
Compilation of measurement and results
Two types of uncertainty can be identified in the measurements, the one that comes from themeasurement of the standard, u1, and the one that results from the uncertainty in the parameter settingfor the standard, u2.
D8. u1.Typical sources of uncertainty in the measurements could be6,7
source Value unit commentsFrequency reference 25 HzStat. disp. of results 17 HzUncertainty inmeasurement method
20 Hz
Total 36 Hz
D9. u2.Typical contributions to the uncertainty from the parameter settings7
Source Value unit commentsLaser power 0.31 kHzModulation width 1.0 kHzIodine cold fingertemperature
0.13 kHz
Cell wall temp 0.42 kHzElectronic offset 0.5 kHzAlignment 1.0 kHz
Total 1.59 kHz
D10. Results:Name of standard Lab. Result uc Unit CommentsINM9 LNE-
INM473 612 353 602.3 1.6 kHz Given at a conf.
level of 68%assuming a largenumber of degreesof freedom.

15
15
Appendix 3, NMi.Comparison report, BIPM.L-K11.
After each series of comparison measurements a copy of this report is to be sent Lennart Robertsson atthe BIPM by e-mail for inclusion in the key comparison. Add new lines in the tables as needed andmodify names of sensitivity coefficients and operational parameters as relevant for the standard beingcompared.
D1. Host laboratory8
Lab. Name BIPM
Contact person Lennart Robertsson
Address Pavillon de Breteuil, 92312 SEVRES CEDEX , France
Tel. (33) 1 45 07 70 53
e-mail [email protected]
D2. Measurements8
Quantity
compared
The frequency of the output beam of the laser when this is stabilized to the f
component of the 11-5, R(127) transition in 127I2 contained in a glass tube.
Period 15-19 November 2004
Describe
measurements
The absolute frequency of the laser was measured using the BIPM femtosecond
laser comb set-up following the technical protocol for the method BIPM.L-K11
m1. Initially the laser was compared with a second iodine system for the
determination of some sensitivity parameters
References and/or
other
documentation
8 To be filled in by the host laboratory
16
16
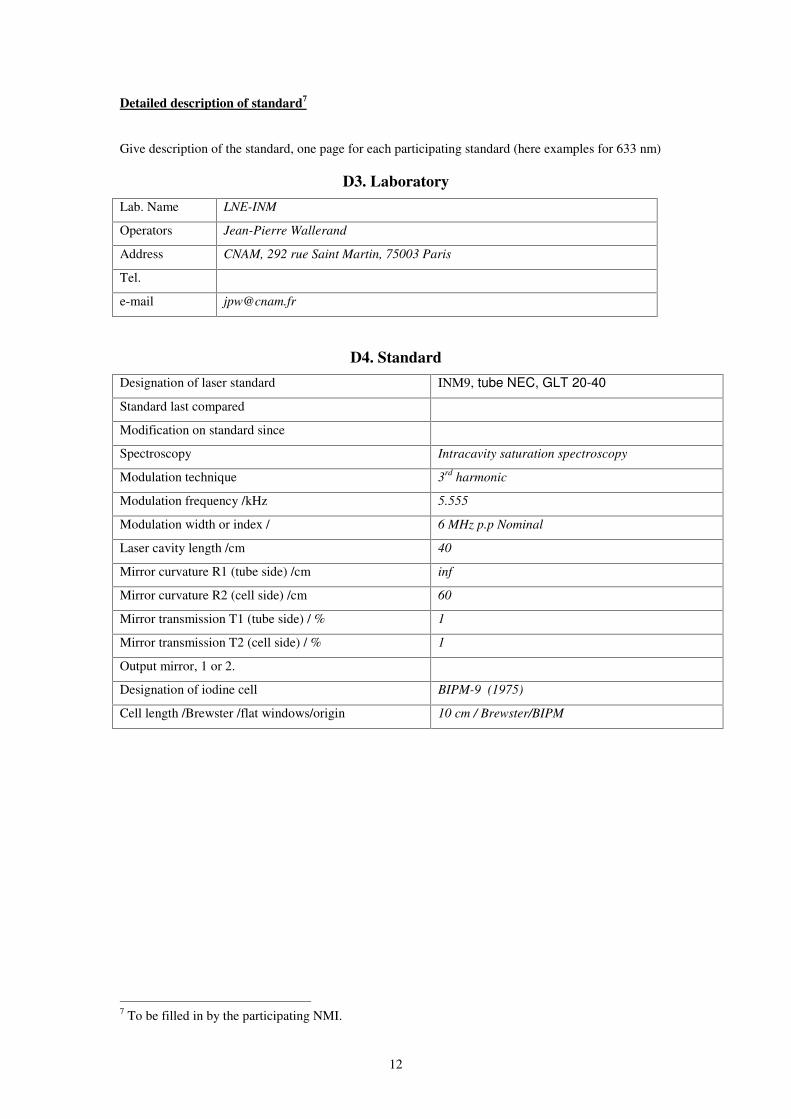
Detailed description of standard9
Give description of the standard, one page for each participating standard (here examples for 633 nm)
D3. LaboratoryLab. Name NMi Van Swinden Laboratorium B. V.
Operators Steven Van den Berg
Address Thijsseweg 11, 2629 JA Delft, The Netherlands
Tel. +31-15-2691523
e-mail [email protected]
D4. StandardDesignation of laser standard NMi-5
Standard last compared -
Modification on standard since -
Spectroscopy Intracavity saturation spectroscopy
Modulation technique 3rd harmonic
Modulation frequency /kHz 8.333
Modulation width or index / 6 MHz p.p Nominal
Laser cavity length /cm 26
Mirror curvature R1 (tube side) /cm 30
Mirror curvature R2 (cell side) /cm Infinite
Mirror transmission T1 (tube side) / % 0.7
Mirror transmission T2 (cell side) / % 0.4
Output mirror, 1 or 2. 1
Designation of iodine cell BIPM 430S
Cell length /Brewster /flat windows/origin 10 cm / Brewster/BIPM
9 To be filled in by the participating NMI.
17
17
D5. Description of measurements8,9
Give a brief description of the measurements made and the techniques used.
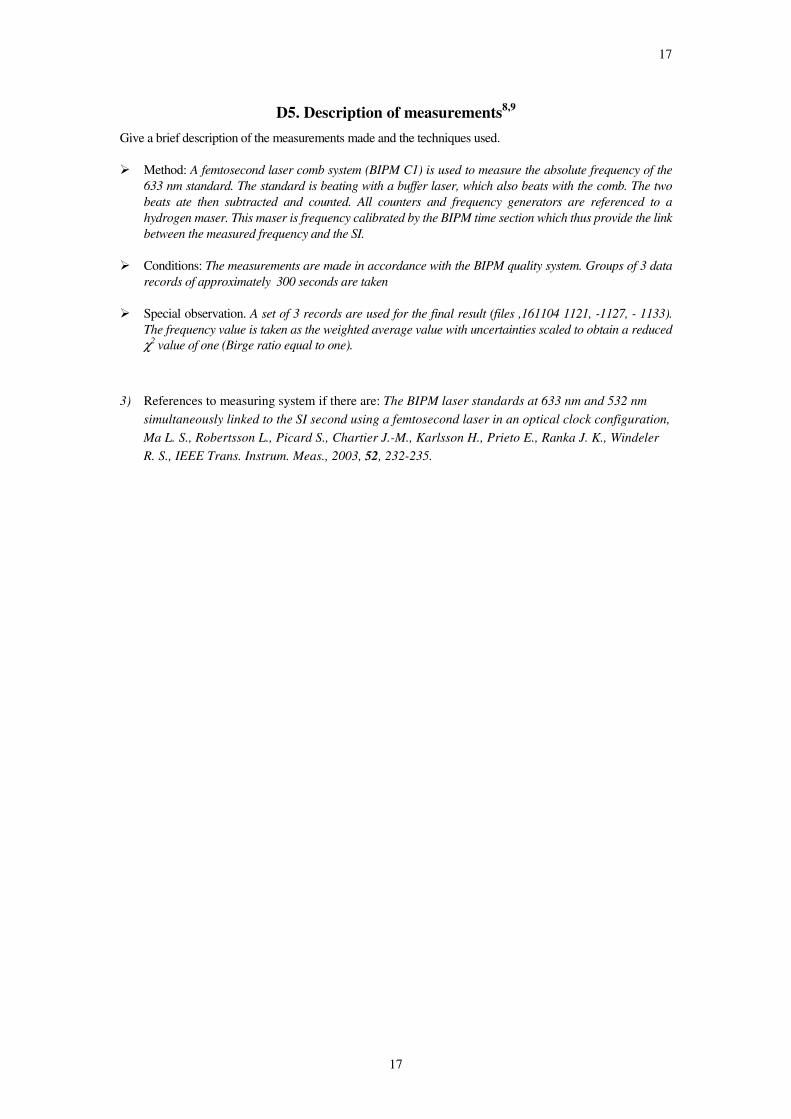
¾ Method: A femtosecond laser comb system (BIPM C1) is used to measure the absolute frequency of the633 nm standard. The standard is beating with a buffer laser, which also beats with the comb. The twobeats ate then subtracted and counted. All counters and frequency generators are referenced to ahydrogen maser. This maser is frequency calibrated by the BIPM time section which thus provide the linkbetween the measured frequency and the SI.
¾ Conditions: The measurements are made in accordance with the BIPM quality system. Groups of 3 datarecords of approximately 300 seconds are taken
¾ Special observation. A set of 3 records are used for the final result (files ,161104 1121, -1127, - 1133).The frequency value is taken as the weighted average value with uncertainties scaled to obtain a reducedχ2 value of one (Birge ratio equal to one).
3) References to measuring system if there are: The BIPM laser standards at 633 nm and 532 nmsimultaneously linked to the SI second using a femtosecond laser in an optical clock configuration,Ma L. S., Robertsson L., Picard S., Chartier J.-M., Karlsson H., Prieto E., Ranka J. K., WindelerR. S., IEEE Trans. Instrum. Meas., 2003, 52, 232-235.
18
18
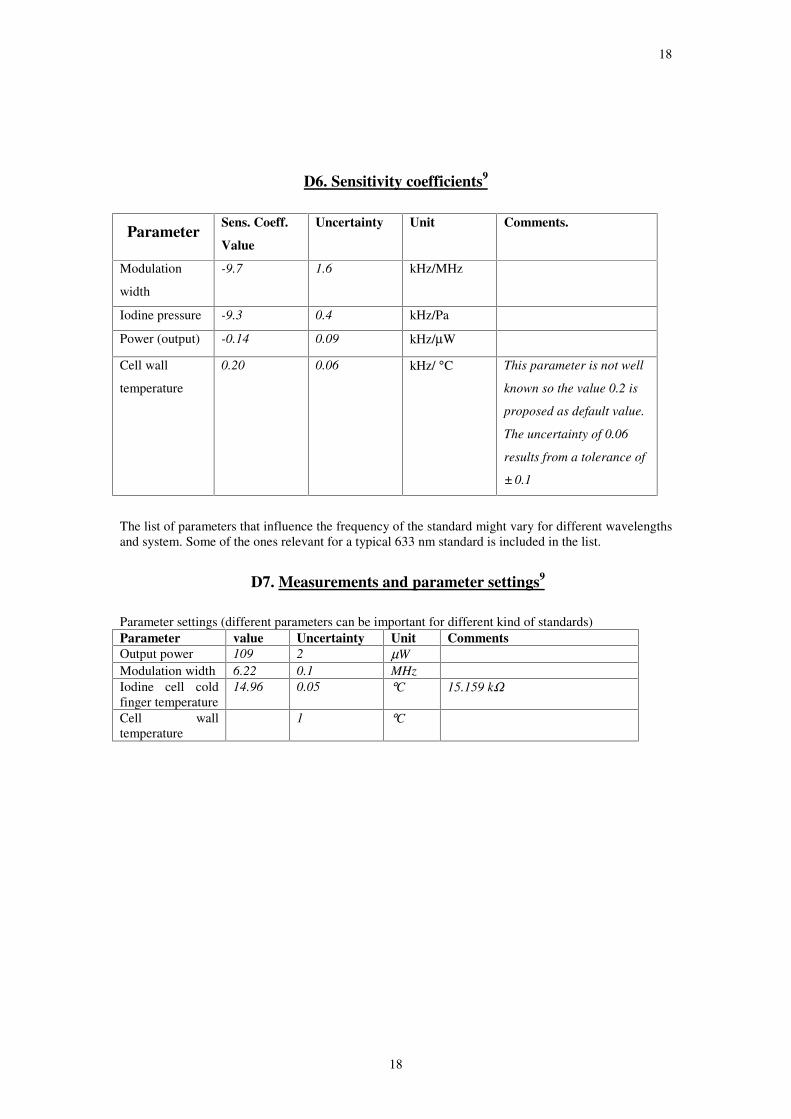
D6. Sensitivity coefficients9
Parameter Sens. Coeff.
Value
Uncertainty Unit Comments.
Modulation
width
-9.7 1.6 kHz/MHz
Iodine pressure -9.3 0.4 kHz/Pa
Power (output) -0.14 0.09 kHz/µW
Cell wall
temperature
0.20 0.06 kHz/ °C This parameter is not well
known so the value 0.2 is
proposed as default value.
The uncertainty of 0.06
results from a tolerance of
± 0.1
The list of parameters that influence the frequency of the standard might vary for different wavelengthsand system. Some of the ones relevant for a typical 633 nm standard is included in the list.
D7. Measurements and parameter settings9
Parameter settings (different parameters can be important for different kind of standards)Parameter value Uncertainty Unit CommentsOutput power 109 2 µWModulation width 6.22 0.1 MHzIodine cell coldfinger temperature
14.96 0.05 °C 15.159 kΩ
Cell walltemperature
1 °C

19
19
Compilation of measurement and results
Two types of uncertainty can be identified in the measurements, the one that comes from themeasurement of the standard, u1, and the one that results from the uncertainty in the parameter settingfor the standard, u2.
D8. u1.Typical sources of uncertainty in the measurements could be8,9
source Value unit commentsFrequency reference 25 HzStat. disp. of results 215 HzUncertainty inmeasurement method
20 Hz
Total 217 Hz
D9. u2.Typical contributions to the uncertainty from the parameter settings9
Source Value unit commentsLaser power 0.33 kHzModulation width 0.98 kHzIodine cold fingertemperature
1.12 kHz
Cell wall temp 0.21 kHzElectronic offset 1.41 kHzAlignment 1.00 kHz
Total 2.32 kHz
D10. Results:Name of standard Lab. Result uc Unit CommentsNMi-5 NMi 473 612 353 597.6 2.3 kHz Given at a conf.
level of 68%assuming a largenumber of degreesof freedom.

20
20
Appendix 4, SP.Comparison report, BIPM.L-K11.
After each series of comparison measurements a copy of this report is to be sent Lennart Robertsson atthe BIPM by e-mail for inclusion in the key comparison. Add new lines in the tables as needed andmodify names of sensitivity coefficients and operational parameters as relevant for the standard beingcompared.
D1. Host laboratory10
Lab. Name BIPM
Contact person Lennart Robertsson
Address Pavillon de Breteuil, 92312 SEVRES CEDEX , France
Tel. (33) 1 45 07 70 53
e-mail [email protected]
D2. Measurements10
Quantity
compared
The frequency of the output beam of the laser when this is stabilized to the f
component of the 11-5, R(127) transition in 127I2 contained in a glass tube.
Period 22-26 November 2004
Describe
measurements
The absolute frequency of the laser was measured using the BIPM femtosecond
laser comb set-up following the technical protocol for the method BIPM.L-K11
m1. Initially the laser was compared with a second iodine system for the
determination of some sensitivity parameters
References and/or
other
documentation
10 To be filled in by the host laboratory

21
21
Detailed description of standard11
Give description of the standard, one page for each participating standard (here examples for 633 nm)
D3. LaboratoryLab. Name SP Swedish National Testing and Research Institute
Operators Reine Johansson, Håkan Skoogh
Address Brinellgatan 4, 504 62 BORÅS, Sweden
Tel.
e-mail [email protected]
D4. StandardDesignation of laser standard SP2 / Melles Griot/ SP inv. no. SP 600983
Standard last compared June -89 (Metrologia 91, 28, 95 - 98)
Modification on standard since
Spectroscopy Intracavity saturation spectroscopy
Modulation technique 3rd harmonic
Modulation frequency /kHz 2.5
Modulation width or index / 6 MHz p.p Nominal
Laser cavity length /cm ~39
Mirror curvature R1 (tube side) /cm 60
Mirror curvature R2 (cell side) /cm Flat mirror
Mirror transmission T1 (tube side) / % 0.90
Mirror transmission T2 (cell side) / % < 1
Output mirror, 1 or 2.
Designation of iodine cell BIPM 133
Cell length /Brewster /flat windows/origin 10 cm / Brewster/
11 To be filled in by the participating NMI.

22
22
D5. Description of measurements10,11
Give a brief description of the measurements made and the techniques used.
¾ Method: A femtosecond laser comb system (BIPM C1) is used to measure the absolute frequency of the633 nm standard. The standard is beating with a buffer laser, which also beats with the comb. The twobeats are then subtracted and counted. All counters and frequency generators are referenced to ahydrogen maser. This maser is frequency calibrated by the BIPM time-section which thus provide thelink between the measured frequency and the SI.
¾ Conditions: The measurements are made in accordance with the BIPM quality system. Groups of 3 datarecords of approximately 300 seconds are taken
¾ Special observation. A set of 3 records are used for the final result (files ,241104-1010, -1012, -1030).The frequency value is taken as the weighted average value with uncertainties scaled to obtain a reducedχ2 value of one (Birge ratio equal to one).
4) References to measuring system if there are: The BIPM laser standards at 633 nm and 532 nmsimultaneously linked to the SI second using a femtosecond laser in an optical clock configuration,Ma L. S., Robertsson L., Picard S., Chartier J.-M., Karlsson H., Prieto E., Ranka J. K., WindelerR. S., IEEE Trans. Instrum. Meas., 2003, 52, 232-235.
D6. Sensitivity coefficients11
ParameterSens. Coeff.
Value
Uncertainty Unit Comments.
Modulation
width
0.6 0.5 kHz/MHz
Iodine pressure -4.8 0.5 kHz/Pa
Power (output) 0.8 0.09 kHz/µW
Cell wall
temperature
0.2 0.06 kHz/ °C This parameter is not well
known so the value 0.2 is
proposed as default value .
The uncertainty of 0.06
results from a tolerance of
± 0.1
The list of parameters that influence the frequency of the standard might vary for different wavelengthsand system. Some of the ones relevant for a typical 633 nm standard is included in the list.
D7. Measurements and parameter settings11

23
23
Parameter settings (different parameters can be important for different kind of standards)Parameter value Uncertainty Unit CommentsOutput power 115 3 µWModulation width 6.0 0.1 MHzIodine cell coldfinger temperature
15.06 0.05 °C
Cell walltemperature
23.5 0.9 °C
Compilation of measurement and results
Two types of uncertainty can be identified in the measurements, the one that comes from themeasurement of the standard, u1, and the one that results from the uncertainty in the parameter settingfor the standard, u2.
D8. u1.Typical sources of uncertainty in the measurements could be10,11
source Value unit commentsFrequency reference 25 HzStat. disp. of results 731 HzUncertainty inmeasurement method
20 Hz
Total 731 Hz
D9. u2.Typical contributions to the uncertainty from the parameter settings11
Source Value unit commentsLaser power 2.42 kHzModulation width 0.08 kHzIodine cold fingertemperature
0.48 kHz
Cell wall temp 0.18 kHzElectronic offset 2.0 kHzAlignment 6.0 kHz
Total 6.79 kHz
D10. Results:Name of standard Lab. Result uc Unit CommentsSP2 SP 473 612 353 602.9 6.8 kHz Given at a conf.
level of 68%assuming a largenumber of degreesof freedom.


![40th meeting of the JCRB - BIPM - BIPM · [The corresponding BIPM presentation is available on the restricted-access JCRB working documents webpage as JCRB-40/03.1.] 3.2. BIPM QMS](https://img.pdfslide.us/doc/110x75/6047869895787e1e9f1920f7/40th-meeting-of-the-jcrb-bipm-bipm-the-corresponding-bipm-presentation-is-available.jpg)