Embed Size (px)
Citation preview

1
Results from the 1999 Cobra Dane Debris Campaign
G. T. DeVere, J.C. Randolph, T. P. Payne
Abstract
As the population of satellites in earth orbit increases, it is important to maintain adequate surveillance of these objects. In the United States, the two principal government organizations operating in space are the Department of Defense (DoD) and the National Aeronautics and Space Administration (NASA). NASA and the DoD (especially the US Air Force) have been working together on a number of joint programs to monitor the space environment and understand the nature of the satellite population. As the powerful Cobra Dane radar resumed a space surveillance role in 1999, NASA offered to fund the collection of debris data for an extended period in August and September. Cobra Dane is an L-Band phased-array radar located in Alaska that is capable of observing small objects on a routine basis. Operating at full power, the radar was able to erect a wide debris-detection fence to optimize collection of data on small satellites. The debris fence was employed for a total of 21 days, with 12 hours of debris fence use each day. The observations on debris objects were transmitted to Air Force Space Command’s Space Analysis Division (HQ AFSPC/XPY). Over 56,000 observations on Uncorrelated Targets (UCTs) were sent to HQ AFSPC/XPY, where the data were correlated and processed into element sets. Using in-house programs and AFSPC-approved Astrodynamic Standards software, it was possible to form good quality element sets on over 10,000 new objects. The orbital characteristics of these objects were then compared to the satellite catalog and the characteristics of the new debris objects were assessed. The size characteristics of these UCT objects were also examined. Although radar cross section (RCS) data were not available on all objects, it was possible to draw some conclusions from the available data. This paper summarizes the analyses conducted of the orbital characteristics of the debris population and provides size, inclination, and altitude distributions of the objects. This analysis has facilitated a better understanding of the space debris population and has paved the way for future debris data collections. 1.0 OVERVIEW Over a total period of 34 days in August and September of 1999, the L-band Cobra Dane radar in Shemya, Alaska was operated intermittently in full-power mode to facilitate collection of debris data. Analysis of these data allowed for an assessment of the 1999 space debris environment. In addition, the data were

2
used to evaluate the Space Surveillance Catalog and to examine the effectiveness of the Cobra Dane radar. Funding to operate the Cobra Dane radar in continuous full-power mode, which is necessary for effective debris data collection, was provided by NASA for the sole purpose of debris data collection. In 1999, the radar normally operated at quarter power (or limited duty) with daily periods of full-power operation for calibration and occasionally for other data collection (both quarter power and full power refer to the average transmitted power levels rather than peak). The NASA funding allowed operation of the radar in full-power mode for a total of 252 hours. A preliminary analysis was conducted suggesting that spreading the data collection over a longer time period would yield better results than a short time period; therefore, a collection period of 21 twelve-hour periods was chosen rather than an “always-on” collection interval of 10.5 days. Data collection commenced on 14 August 1999 and ended on 17 September 1999. Data were collected in the full-power mode from 0000Z to 1200Z during each of the 21 collection periods. The reason that 34 days were needed to collect the 21 twelve-hour periods is related to scheduling constraints. During the collection period, over 56,000 observations were recorded on objects in the near-earth orbit region. The Cobra Dane site employed a special debris detection fence, which spanned 60 degrees in azimuth at an elevation of 50 degrees. The azimuthal coverage was centered at radar boresight at an azimuth of 319 degrees. 2.0 DATA COLLECTION Cobra Dane accomplished the first full-power collection period on 14 August 1999. The data collected by the Cobra Dane radar consisted primarily of metric observations (composed of time, azimuth, elevation, range, and range rate), but a considerable amount of size data (commonly called radar cross-section or RCS data) were also recorded.
2.1 Observation Data The total number of observations collected by the Cobra Dane radar between 14 August and 17 September 1999 was 56,290. These observations were received as raw metric data that was subsequently processed by various programs. As indicated in Section 3, the majority of the data were collected in full-power mode from 0000Z to 1200Z for 21 nonconsecutive days. Figure 2-1 shows the number of observations collected each day, divided into 12-hour blocks for each day. The full-power collection periods can be clearly seen, and it should be noted that these periods were uninterrupted from 3 September (Day 246) through the end of the effort on 17 September.

3
Debris Observations Count by Day
Figure 2-1
2.2 Size Data Cobra Dane collected radar cross-section (RCS) data on only 3,082 unknown objects during the data collection period. It was found that the site did not collect RCS data on all of the objects observed during the test. Collection and subsequent correlation of these data with metric observations was a considerably difficult and error-prone task, and as a result, only 1,912 of these RCS measurements were usable in the analysis. 3.0 DATA ANALYSIS All of the data in this section represent the subset of 10,864 debris objects remaining after the data were correlated with known objects. Although the number of detected UnCorrelated Targets (UCTs) is significant, it should be noted that only 1,148 of these were verified with multiple tracks (three or more). Accordingly, all data in this section will be separated into one of two categories: “Detected” represents the total of 10,864 objects, while “verified” represents the subset of 1,148 objects. Figure 3-1 depicts the UCT totals along with a scaled catalog representation. The scaled catalog is simply a representation of the number of objects that are expected to be within the physical viewing window of
0
500
1000
1500
2000
2500
3000
3500
225 230 235 240 245 250 255 260
Julian Day, 1999
Num
ber o
f Obs
erva
tions
1200-2400Z
0000-1200Z
Note: Debris data collection 0000 – 12000 each day
0
500
1000
1500
2000
2500
3000
3500
225 230 235 240 245 250 255 260
Julian Day, 1999
Num
ber o
f Obs
erva
tions
1200-2400Z
0000-1200Z
0
500
1000
1500
2000
2500
3000
3500
225 230 235 240 245 250 255 260
Julian Day, 1999
Num
ber o
f Obs
erva
tions
1200-2400Z
0000-1200Z
Note: Debris data collection 0000 – 12000 each day

4
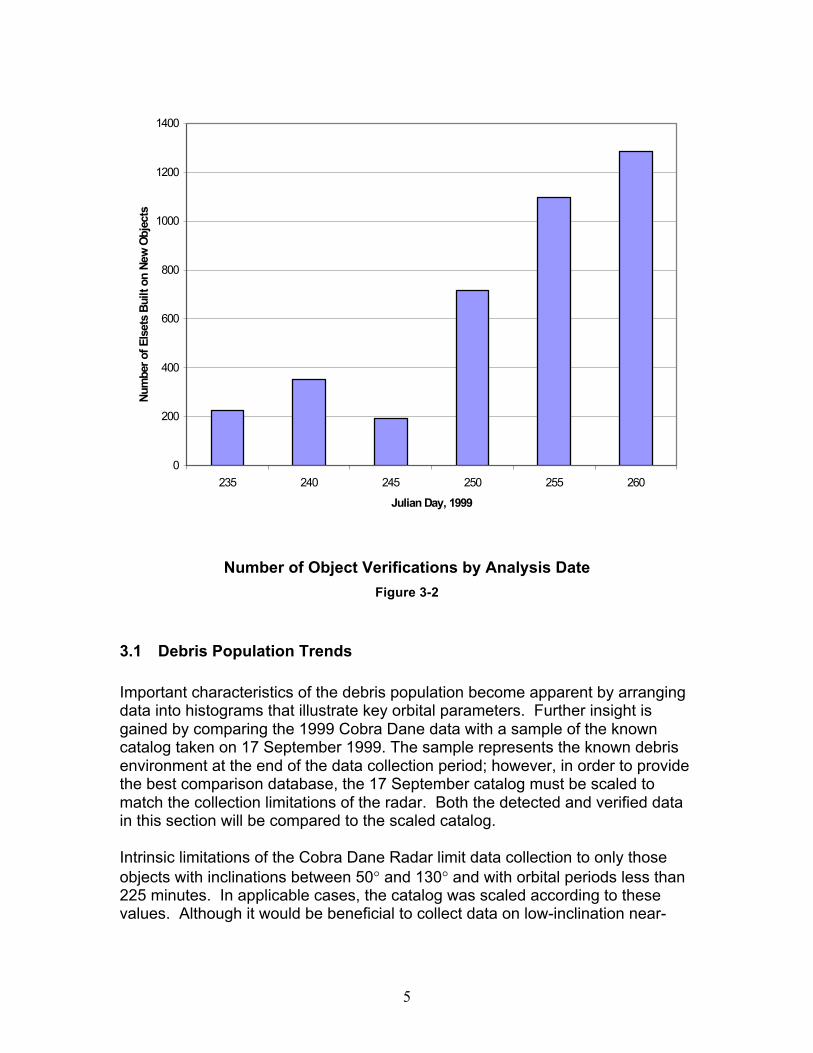
the Cobra Dane radar during the data collection period. See Section 3.1 for further details about the scaled catalog. Due to the wide variation between the verified and detected values, it is important to note that the difference in the two numbers could possibly be reduced significantly if the data collection period was extended. Hypothetically, if the collection period were of sufficient length, the number of new objects verified over any given period would approach zero. Conversely, inspection of the data collected for this analysis reveals that the number of newly verified objects was reaching a high point at the end of the collection period. It is evident from the chart in Figure 3-2 that extension of the data collection period may have allowed for the detection and verification of a considerable number of additional new objects.
10864
5917
1148
0
2000
4000
6000
8000
10000
12000
Num
ber o
f Obj
ects
DETECTED UCTs
VERIFIED UCTs
SCALED CATALOG
DETECTED: 183.6% of scaled catalogVERIFIED: 19.4% of scaled catalog
Near-Earth Object Totals Figure 3-1
5
Number of Object Verifications by Analysis Date
Figure 3-2
3.1 Debris Population Trends Important characteristics of the debris population become apparent by arranging data into histograms that illustrate key orbital parameters. Further insight is gained by comparing the 1999 Cobra Dane data with a sample of the known catalog taken on 17 September 1999. The sample represents the known debris environment at the end of the data collection period; however, in order to provide the best comparison database, the 17 September catalog must be scaled to match the collection limitations of the radar. Both the detected and verified data in this section will be compared to the scaled catalog. Intrinsic limitations of the Cobra Dane Radar limit data collection to only those objects with inclinations between 50° and 130° and with orbital periods less than 225 minutes. In applicable cases, the catalog was scaled according to these values. Although it would be beneficial to collect data on low-inclination near-
0
200
400
600
800
1000
1200
1400
235 240 245 250 255 260
Julian Day, 1999
Num
ber o
f Els
ets
Built
on
New
Obj
ects

6
earth orbits, Cobra Dane is able to track most near-earth objects because the vast majority of them have high-inclination orbits.
3.1.1 Inclination Trends Determination of the inclination distribution of space debris is important because it reveals a distinctive pattern that allows for easy comparison with the satellite catalog. Figure 3-3 and Figure 3-4 clearly illustrate the similarities and differences between the UCT findings and the scaled catalog. Note: Although the viewable range of the Cobra Dane Radar is approximately 50° to 130°, the charts have been truncated because the number of objects residing in inclination bins above 110° is very small.
0
500
1000
1500
2000
2500
3000
50 - 5
5
55 - 6
0
60 - 6
5
65 - 7
0
70 - 7
5
75 - 8
0
80 - 8
5
85 - 9
0
90 - 9
5
95 - 1
00
100 -
105
105 -
110
Inclination Bin (degrees)
Num
ber o
f Obj
ects
DETECTED UCTs
SCALED CATALOG
Inclination Distribution – Detected Objects
Figure 3-3

7
0
200
400
600
800
1000
1200
1400
1600
50 - 5
5
55 - 6
0
60 - 6
5
65 - 7
0
70 - 7
5
75 - 8
0
80 - 8
5
85 - 9
0
90 - 9
5
95 - 1
00
100 -
105
105 -
110
Inclination Bin (degrees)
Num
ber o
f Obj
ects
VERIFIED UCTs
SCALED CATALOG
Inclination Distribution – Verified Objects
Figure 3-4
Upon inspection of the inclination histogram charts, it becomes apparent that the UCT findings generally correlate with the satellite catalog. Notably, the number of objects in each bin varies significantly between the detected, verified, and cataloged divisions; however, the general trend of the data maintains consistency with the cataloged sample. Comparison using Figure 3-5 is most illustrative of this point because it compares each data set using the object percentages rather than count totals. Both the detected and verified data sets indicate that a potentially high number of uncataloged UCTs exist in near-earth orbits. The unverified detection chart in Figure 3-3 shows that up to 300% of the known number of objects may exist in some inclination regions, while the verified data in Figure 3-4, which is a more reliable measure, indicates a 50% increase in the same regions.

8
0.0%
5.0%
10.0%
15.0%
20.0%
25.0%
30.0%
50 - 5
5
55 - 6
0
60 - 6
5
65 - 7
0
70 - 7
5
75 - 8
0
80 - 8
5
85 - 9
0
90 - 9
5
95 - 1
00
100 -
105
105 -
110
Inclination Bin (degrees)
Perc
enta
ge o
f Tot
al O
bjec
ts (b
y ca
tego
ry) VERIFIED UCTs
DETECTED UCTs
SCALED CATALOG
Inclination Distribution – Percentage Comparison
Figure 3-5
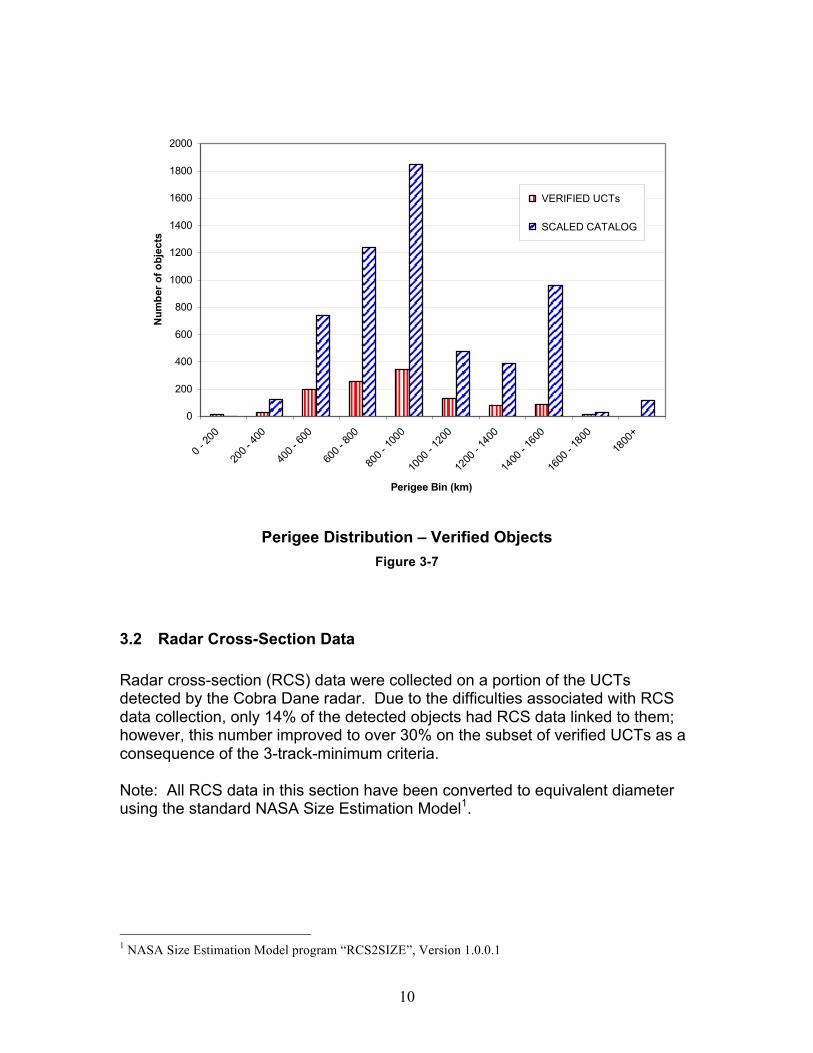
3.1.2 Perigee Altitude Trends Perigee altitude of debris is of particular interest because it allows for a direct account of the number of potential debris threats at any given altitude. Objects with perigee altitudes less than 600 km are considered to be within the manned spaceflight region and are, therefore, of particular concern. Figure 3-6 and Figure 3-7 depict the number of detected and verified UCTs in relation to perigee altitude and compares them with the scaled catalog.

9
Perigee Distribution – Detected Objects
Figure 3-6
The UCT perigee distribution trend in both the detected and verified charts is characteristic of the catalog numbers with the exception of the relatively small numbers found in the 1,400 to 1,600 km range. Both charts indicate that there are potentially a large number of UCTs in the sub-1,000 km range. Over twice the number of cataloged objects were detected in some bins. A reasonable percentage of the detections were verified and, if added to the satellite catalog, would present a considerable increase to the number of objects in low-perigee regions.
0
500
1000
1500
2000
2500
3000
3500
0 - 20
0
200 -
400
400 -
600
600 -
800
800 -
1000
1000
- 120
0
1200
- 140
0
1400
- 160
0
1600
- 180
018
00+
Perigee Bin (km)
Num
ber o
f obj
ects
DETECTED UCTs
SCALED CATALOG
10
Perigee Distribution – Verified Objects
Figure 3-7
3.2 Radar Cross-Section Data Radar cross-section (RCS) data were collected on a portion of the UCTs detected by the Cobra Dane radar. Due to the difficulties associated with RCS data collection, only 14% of the detected objects had RCS data linked to them; however, this number improved to over 30% on the subset of verified UCTs as a consequence of the 3-track-minimum criteria. Note: All RCS data in this section have been converted to equivalent diameter using the standard NASA Size Estimation Model1.
1 NASA Size Estimation Model program “RCS2SIZE”, Version 1.0.0.1
0
200
400
600
800
1000
1200
1400
1600
1800
2000
0 - 20
0
200 -
400
400 -
600
600 -
800
800 -
1000
1000
- 120
0
1200
- 140
0
1400
- 160
0
1600
- 180
018
00+
Perigee Bin (km)
Num
ber o
f obj
ects
VERIFIED UCTs
SCALED CATALOG
11
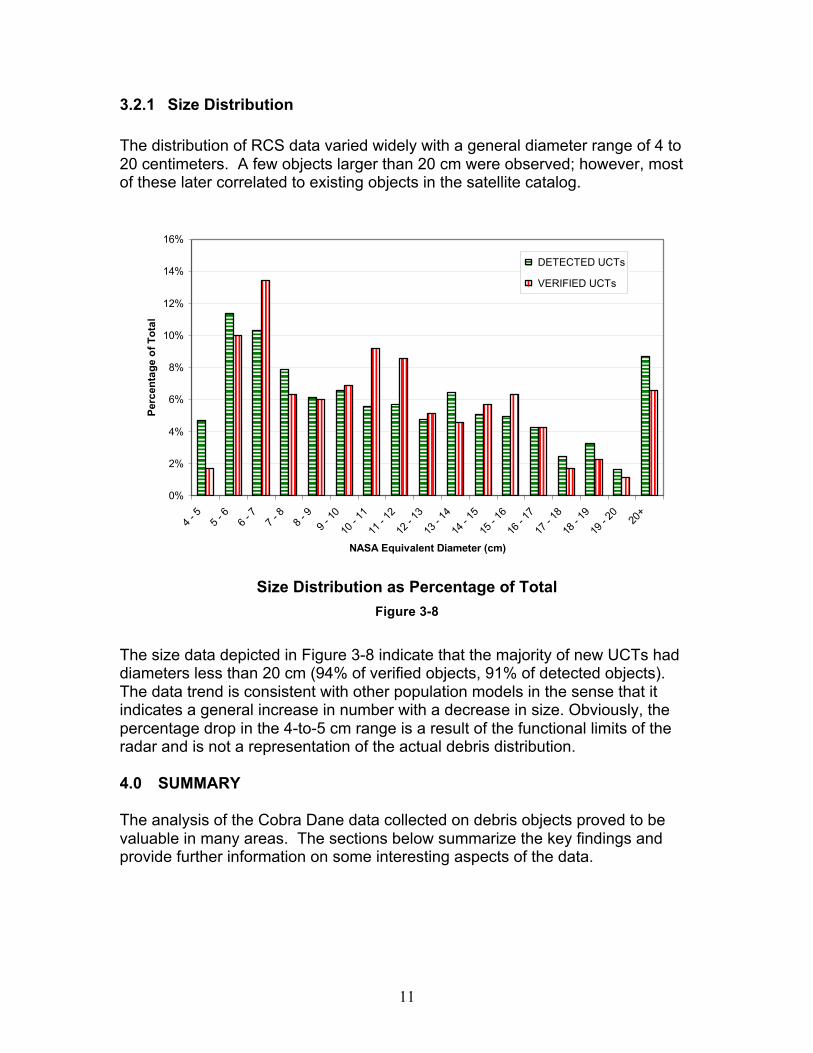
3.2.1 Size Distribution The distribution of RCS data varied widely with a general diameter range of 4 to 20 centimeters. A few objects larger than 20 cm were observed; however, most of these later correlated to existing objects in the satellite catalog.
0%
2%
4%
6%
8%
10%
12%
14%
16%
4 - 5
5 - 6
6 - 7
7 - 8
8 - 9
9 - 10
10 - 1
1
11 - 1
2
12 - 1
3
13 - 1
4
14 - 1
5
15 - 1
6
16 - 1
7
17 - 1
8
18 - 1
9
19 - 2
020
+
NASA Equivalent Diameter (cm)
Perc
enta
ge o
f Tot
al
DETECTED UCTs
VERIFIED UCTs
Size Distribution as Percentage of Total
Figure 3-8
The size data depicted in Figure 3-8 indicate that the majority of new UCTs had diameters less than 20 cm (94% of verified objects, 91% of detected objects). The data trend is consistent with other population models in the sense that it indicates a general increase in number with a decrease in size. Obviously, the percentage drop in the 4-to-5 cm range is a result of the functional limits of the radar and is not a representation of the actual debris distribution. 4.0 SUMMARY The analysis of the Cobra Dane data collected on debris objects proved to be valuable in many areas. The sections below summarize the key findings and provide further information on some interesting aspects of the data.

12
4.1 Quantity Analysis of data collected by the Cobra Dane radar in August and September of 1999 indicates that a significant number of previously unknown debris objects exist in near-earth orbits. 10,864 unique objects were detected and more that 1,148 of these were verified with three or more separate tracks. This smaller subset of 1,148 objects would be acceptable for entry and subsequent maintenance in the Space Surveillance Catalog. Further analysis of the Cobra Dane data found that the highest frequency of unknown object detections occurred towards the end of the data collection period as a result of increased radar activity. Given that the number of new object detections was increasing rather than decreasing when data collection was terminated, it may be inferred that a considerable number of additional objects could be detected if additional collection time had been available. A quantifiable number for these undetected objects is not included in this study because analysis of the available data would provide purely speculative results.
4.2 Orbital Characteristics Determining the orbital characteristics of the debris objects is valuable because it provides a good means of comparing the objects with expected values and for identifying other relevant information. Specific orbital characteristics including inclination, perigee altitude, and argument of perigee, were used to help distinguish each of the 10,864 debris objects. In general, the inclination and argument of perigee trends of the debris data are consistent with expected trends when compared to the satellite catalog. It is also interesting to note that the newly identified debris objects represent a considerable increase in some inclination regions. These numbers were as high as 300%, when comparing the full 10,864 objects, and as high as 50% when comparing the 1,148 object subset. Perigee altitude of debris is of particular interest because it allows for direct accounting of the number of potential debris threats at any given altitude. Objects with perigee altitudes less than 600 km are considered to be within the manned spaceflight region and are, therefore, of particular concern. The vast majority of the 10,864 detected objects have perigee altitudes less than 1,000 km. Of these, approximately 3,000 have perigee altitudes less than 600 km. The majority of the 1,148 objects in verified subset also have perigee altitudes below 1,000 km but only about 250 of them have perigee altitudes below 600 km.
13
4.3 Size Distribution The distribution of RCS data varied widely with a general diameter range of 4 to 20 centimeters. Roughly 75% of the measured objects have diameters less than 15 cm and approximately 45% of the objects have diameters less than 10 cm. Only a small fraction of the objects had diameters less than 5 cm. 5.0 CONCLUSIONS AND RECOMMENDATIONS The two methods that were used to analyze the Cobra Dane were both successful and a large amount of data was collected, processed, and analyzed. The first method, near real-time data processing, was performed each day that data were collected. Observations were formed into element sets and transmitted back to Cobra Dane for follow-up tracking. In addition, some of these element sets were supplied to the operational Space Control Center (SCC) for entry into the SCC database. The objects entered into the SCC database resulted in the recovery of a number of lost satellites and facilitated the cataloging of new objects, such as small coolant globules from the Russian nuclear powered Radar Ocean Reconnaissance Satellites (RORSATs). The second processing method involved examination of the data in greater detail well after the collection period. This allowed more time to perform detailed analyses than during the more hectic real-time data processing. It was possible to build 10,864 element sets and 1,148 of these had at least three separate tracks. The orbital characteristics of these objects were compared to the satellite catalog and the characteristics of the new debris objects closely followed the satellite catalog distribution. This suggests that the small debris population exists in the same inclination and altitude regimes as the known satellite population. The size characteristics of these objects were also examined. Although radar cross-section (RCS) data were not available on all objects, it was possible to draw some conclusions from the available data. The RCS data were converted to physical size using the NASA Size Estimation Model. Over 75 percent of the satellites had diameters less than 15 cm and 45 percent of the total were smaller than 10 cm in diameter. Overall, the NASA-funded debris data collection using the Cobra Dane radar was considered a success. A much clearer understanding of the orbital characteristics of the debris population has been obtained and size, inclination, and altitude distributions have been quantified. More importantly, it demonstrates that more small objects can be added to the satellite catalog using data from Cobra Dane operating at full power. If NASA or the DoD plans to expand the satellite catalog to include smaller objects, Cobra Dane (at full power) has demonstrated its ability to play an important and essential role in the detection and tracking of small objects.