Embed Size (px)
Citation preview

Summary testing of MOPS washing on sand from Groyne 42
Research and Development
Fortum Waste Solutions AB Postal Address SE-692 85 Kumla SWEDEN
Visiting Address Norrtorp 112 SE-692 85 Kumla SWEDEN
Phone/Fax Tel: +46 19 304100
Business ID 556129-9537 www.fortum.com/wastesolutions
2020
Results from MOPS washing tests on sand from Groyne 42
PILOT DEMONSTRATION OF MULTI-PURPOSE ON- SITE PHASE SEPARATOR (MOPS) AS POSSIBLE TECHNOLOGY IN TREATMENT OF CONTAMINATED SAND
THOMAS VON KRONHELM, ULRIKA HELLMAN, RD FWS

1
TABLE OF CONTENTS
1 BACKGROUND TO THE PROJECT ..................................................................................... 2
2 PROCESS DESIGN MOPS ................................................................................................... 3
3 TREATMENT OF CONTAMINATED SOIL, TEST MATERIAL CONTAMINATED SAND FROM GROYNE 42(HØFDE 42) ........................................................................................... 8
3.1 Description of contamination ................................................................................ 8
3.2 Tests made at the industrial pilot scale MOPS plant at FMC Cheminova autumn 2019- winter 2020 .................................................................................... 13
3.2.1 Technical concept ......................................................................... 13
3.2.2 Test material .................................................................................. 16
3.3 Results from the tests made in the industrial MOPS pilot ................................ 16
3.3.1 Settings .......................................................................................... 16
3.3.2 Results ........................................................................................... 17
4 WATER TREATMENT......................................................................................................... 31
5 THE MERCURY MASS BALANCE ..................................................................................... 32
6 CONCLUDING REMARKS BASED ON THE RESULTS OF THE STUDIES PERFORMED IN THE INDUSTRIAL MOPS PILOT .................................................................................... 33
7 COMMERCIAL IMPORTANCE ........................................................................................... 34
7.1 Full-scale MOPS plant designed and constructed to treat sand from the Groyne 42 depot ................................................................................................... 34
7.2 Indicative treatment prices of MOPS washing on sand from Groyne 42 .......... 37

2
1 BACKGROUND TO THE PROJECT
The aim of the project is to investigate recovery of valuable raw materials and decontamination of highly complex waste products by utilizing a multi-purpose on-site phase separator (MOPS)
The challenge:
Contaminated soils and other hazardous waste materials contain large amounts of valuable resources that can replace virgin minerals and salts. Recirculation of such materials will offer a significant contribution to the aspiration towards a society with reduced resource consumption. The challenge is to find technologies that offers an efficient decontamination, but is resource reasonable and safe, and allows recirculation of any valuable materials.
Purpose and Potential Solution to the Challenge:
The purpose of the project is to demonstrate:
- use of an innovative high pressure, phase extraction recovery technology called MOPS (Multi-purpose On-site Phase Separator) to remediate waste products of high complexity.
- feasibility of selectively harvesting valuable materials from the resulting phases
- and possibility to establish this as an on-site solution
The high pressure, phase extraction recovery technology has already been tested in Fortum Recycling and Waste Solutions for washing of ash, and reuse of the resulting brine for deicing purposes. Therefore, a potential solution to concurrent remediation and circulation of more complex waste materials, such as contaminated soils and hazardous waste, would be an adjustment of the technology to fit these matrixes. Strong complexation of desired substances to solid phases will demand a solution harsh enough to release the component from the waste material, and flexible and easy adjustable for separation of resulting treated fractions. This need can be met by the high-pressure phase extraction technology. Furthermore, the concept of an on-site solution will minimize the use of long distance transportations, which is often a major hurdle in larger remediation projects.

3
2 PROCESS DESIGN MOPS
Novelty of the technology and general uses
This type of accelerated solvent extraction is a new concept within waste treatment and soil remediation. Several scrubbing systems using pressurized liquid, for instance the venture scrubber, is well tested and used within the waste business, but the combination of straight counter current flow in combination with the possibility to control reaction time, makes this phase extraction recovery technology unique.
In the three sketched provided below the general idea is described where different waste materials are used as feeds and the outcomes are several types of raw material that can be used within recovery and recirculation areas.

4

5
The MOPS process can be dived into 3 parts:
Step 1-Initial phase-wet classification
• The purpose with MOPS technology is to be able to handle a big variety of materials. Therefore the process starts with pre-screening and classification of material. In this step big stones, gravel etc. are separated from sand and downwards. This oversized material is gentle washed and thereafter ready for disposal.
• The sand and downwards constitute material rich in valuables or/and contaminants and this material need a harsh treatment in order to liberate metals etc. from the bulk matrix and it is at this stage the real MOPS process starts.
Step 2-Mixing and attrition phase
• Phase 1 in the MOPS treatment is blending in extraction liquid with the sand/ash/sludge. Characteristic of extraction liquid is adopted to fit the purpose of each bulk material. For example, in the Groyne case, an extraction liquid of pH 12 will be used , high pH enhance the mobilization of both Hg and pesticides. The liquid is blended with the bulk material in closed cells equipped with heavy duty stirrers. In these cells a very intensive attrition take place and this results in liberation and softening of coatings, crack up of agglomerates etc. A lot of the metals/ contaminants weakly attached to the bulk material will during this attrition phase be transferred into the liquid phase. At the same time extraction liquid gives the possibility to penetrate deep into the bulk material. When the slurry leaves the attrition cell the liquid phase is collected by usage of hydrocyclones. The liquid phase is usually heavily enriched with metals/contaminants released during the attrition.

6
Step 3- High pressure reactor
• The thick slurry of bulk material going out from the bottom of the hydrocyclone is now prepared for the final treatment step- the high pressure wash. Metals/contaminants still attached to the bulk material constitute the fraction strongly attached/ strongly bound and this can only be liberated in an extraction step utilizing high energy. The attrition step has prepared the material so these solid attached metals/contaminants are exposed and thereby they are possible to “attack”.
• The technical concept consists of a free flow reactor where solid materials meet counter current high pressure liquid flow. High pressure liquid will secure an intensive scrubbing and reaction with solid phases. In which the reaction zone between liquid and solids is comparable to blasting processes, but in this case the scrubbing media is liquid instead of sand.
• The main advantage of this system, compared to other commercial scrubbing systems, is that high blast can be used in the liquid when it is operated in a straight counter current towards the flow of solids – creating a high energy scrubbing. The positive effect is the possibility to use very low liquid/solid ratio (2:1) and accelerated reaction,
• Flexibility in use of temperature and chemical composition of liquid are other important parameters. The design is robust and simple, which enables treatment of sludges and solids by directly introduction to the reactor.
In figure 1 below shows an illustration of the reactor phase. The idea is to recirculate the wash liquid as much as possible and depending on type of material treated, water treatment set up can differ significantly from case to case. Composition of wash liquids are usually individual designed to fit demanded specific need. The reactor is designed to handle both acidic and alkaline solutions and the
temperature of liquid can be raised to 80C at the most.
7
Figure 1: Principle illustration of material and media flows in the high pressure reactor step

8
3 TREATMENT OF CONTAMINATED SOIL, TEST MATERIAL CONTAMINATED SAND FROM GROYNE 42(HØFDE 42)
3.1 Description of contamination
The dump site of Groyne 42 (Høfde 42) is primarily contaminated with mercury and organophosphorus pesticides (OP:s). Out of the pesticides, Methyl parathion, Ethyl parathion, Malathion and E-Sulfotep are the predominating ones and as will be seen further down in the report, these are the ones pinpointed in order determine success in treatment.
However, in order to secure treatment success the sand used in the industrial scale MOPS pilot was characterized by broad range analytical screening and results were very clear in that hardly no other contaminants are present except the ones described above, see appendix 1 for details (not provided together in this short summary). Based on the analytical screening performed, a decision was made that treatment success can securely been judged by following mercury together with Methyl parathion, Ethyl parathion, Malathion and E-Sulfotep (= target OP:s).
When it comes to the target substances, really high concentrations are seen in the test material received from the test excavation made in the Groyne 42 depot 2018 under the surveillance of Region Midt. Rather big variations in contaminant levels of target OP:s are observed in different start samples, but this is not reflected in the same range when it comes to Hg, see figure 2 and table 1.
Figure 2: Shows examples of the big variation seen in start values of target OP:s in different test batches treated in the industrial MOPS pilot autumn 2019 and winter 2020.
Ethyl parathionMg/kg TS
Methyl parathionMg/kg TS
Malathion Mg/kg TS E-Sulfotep Mg/kg TS
Serie1 930 97 68 5,8
Serie2 3,4 212 27 67
Serie3 11 236 34 146
0
100
200
300
400
500
600
700
800
900
1000
Untreated sand

9
Figure 3: Illustrates variation of Hg seen in start samples of different batches treated in the industrial MOPS pilot autumn 2019 and winter 2020. It can be clearly seen that Hg does not reflect the same magnitude in fluctuation range as observed for target OP:s.
Except the target substances some macro elements constitute important indicators of treatment success in washing of the sand. In figure 4 below, amounts of selected macro elements in untreated sand are reported. Sulfur and phosphorus are important to follow due to high integration in the pesticides as part of functional sites. High removal degree of these two elements in the washing process indicate high pesticide removal. Cations like Fe, Mn, Ca are elements incorporated in the mineral structure of the sand, but they also constitute important building parts in secondary precipitates that to some parts surround the sand grains. It is expected that these secondary precipitates also to some or large extent trapped both mercury and pesticides. Mercury can be actively bound to sulfur and oxygen groups that in its turn can be connected to Fe and Mn. Both mercury and pesticides can also be simply encapsulated in secondary coatings comprised of Fe and Mn. In the intensive attrition of the sand that take place in the washing process these coatings will be removed from sand grains and thereby are mercury and pesticides associated liberated and transferred into washing liquids as well. So in theory a properly washed sand should show a slight decrease in concentration of mentioned cations in parallel with a slight increase of Si and Al (major building elements in combination with oxygen, in pure sand
0
100
200
300
400
500
600
700
800
1 2 3 4 5 6 7
MG
/KG
TS
Mercury in untreated sand

10
Figure 4: Typical concentration of key macro elements present in batches of untreated sand explored in the industrial MOPS pilot. Only small fluctuations are noticed between different test batches. This also applies to S and P which was rather unexpected considering the large variation seen in start values of target OP:s of the same sand.
The physical structure of sand in Groyne 42 is well suited for washing out contaminants. There is hardly any type of silt and clay particles present, see particle distribution curve in figure 5 and this has the advantage of formation of a very limited sludge fraction which is highly enriched in contaminants during washing. In other words, the fraction needed to be further handled by incineration for destruction of pesticides as well as assembly of mercury will not become very costly. Additional a lot of long distance transports can be avoided, a proper working washing process will generate more than 90% of material that can be disposed locally.
1
10
100
1000
10000
100000
1000000
Al Si P Mn Fe S
Key macro elements in untreated sand

11
Figure 5: Typical grain size distribution curve of sand from Groyne 42 tested in the industrial MOPS pilot.
In the washings made on the test material received to the industrial MOPS pilot, approximately 5-10% of the material consist of oversized materials like:
• Stones up to 250 mm diameter
• Gravel 2-16mm
• Some pieces of old asphalt, wood and plastic
It is important that oversized materials are removed from the sand before the actual attrition, grinding and high pressure washing of the sand begins. This to avoid damages on equipment as well as avoid fragmentation of asphalt, wood and plastics, which otherwise end up as impurities in clean sand. Process description of pre-classification is more thoroughly described in section 3.3.3.1

12
Example of visual appearance of untreated sand and oversized material respectively.

13
3.2 Tests made at the industrial pilot scale MOPS plant at FMC Cheminova autumn 2019- winter 2020
3.2.1 Technical concept
Based on the experience and findings obtained from the tests done in the small MOPS pilot 2018, design of the industrial MOPS pilot started in the summer of 2018. It became clear in the preliminary tests that we had to build a pilot plant divided into three phases (sections), all with different preparatory purposes before further processing of the sand in the next phase. These three phases /sections can be briefly described as follows and they are more thoroughly described in section 2 :
• Phase 1 wet separation step- release of oversized material: In this step big stones,
gravel etc. are separated from sand and downwards. This takes place in a rotating
washing drum equipped with spray heads followed by a screen deck. All together, these
two initial apparatus isolate stones, wood, asphalt and gravel from the contaminated
sand
• Phase 2 mixing and attrition (part 1 MOPS): This phase starts with adding the extraction
liquid into the sand. Thereafter sand and liquid is transferred into closed cells equipped
with heavy duty stirrers creating an intensive attrition of sand. The liquids produced at
this stage embody the most heavily contaminated flow revealed in the process.
• Phase 3 high pressure washing (part 2 MOPS): The thick slurry coming out of from the
attrition cells is now prepared for the final treatment step- the high pressure wash. The
technical concept consists of a free flow reactor where sand meet a counter current high
pressure fluid flow with high blast energy – creating high energy scrubbing.
In reality, the three wash phases described above result in process flow seen in figure 6 and once
established, the design engineering took off with start in October 2018. Important work safety as
well as working environmental aspects were included in the design already from the beginning. As an
outcome, all critical apparatus where enclosed and equipped with separate forced ventilation
systems. Process liquids and waste liquids where stored in closed tanks, all chemicals in operation
were added by use of automatic dosage systems. In March 2019 all construction drawings had been
completed and the construction phase could be initiated. The plant was installed and ready for
operation in august 2019. An overview of the final plant design can be seen in figure 7.

14
Figure 6: Principal flow scheme of the industrial MOPS pilot.

15
Figure 7: The visual design of the MOPS pilot plant showing the ventilation system and outlets of pure material fractions.
16
Installation and commissioning of the plant became ready in beginning August 2019. Instructions and risk analysis regarding operation were finalized in end of August and the industrial MOPS pilot was put in operation during September 2019.
Water processing is separately described in section xxx.
3.2.2 Test material
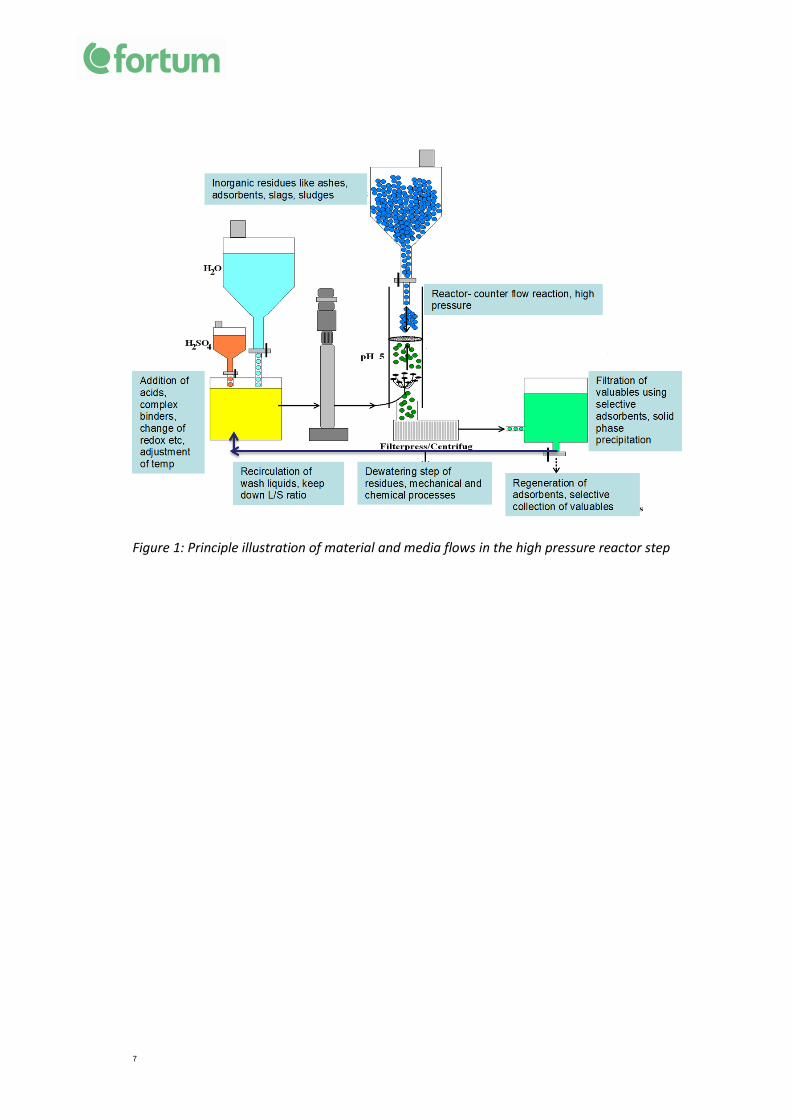
Both Fortum Waste Solution A/S and Krüger A/S have by Ministry of Environment and Food in Denmark been selected to demonstrate, in pilot scale, possible treatment concepts of hot spot material from the Groyne 42 depot. These testing’s are partly financed by MUDP (Development and Demonstration Program). Test material was delivered to Fortum and Krüger under the supervision of Region Midtjylland. In total, about 130 tons of highly polluted soil were excavated from the hot spot area in the Groyne 42 depot. These masses comes from a depth about 3.5 to 6.1 m below the sealing layer.
The Pictures show location and visible appearance of masses to be used in pilot runs. Excavation took place in June 2018 (pictures taken from report ClearMiljø Aps, 2018)
3.3 Results from the tests made in the industrial MOPS pilot
3.3.1 Settings
The industrial scale MOPS pilot was run with following settings:
• Approximately 5000-7000kg of contaminated sand was used in each batch run.
• Liquid/solid ratio was approximately 5:1 when start up and run down cycles are excluded from the mass flow measurements.
• Fluids used in the washing had a pH of 12-12.5. In many tests were the fluids also doped with Na2S in the concentration range of 0,01-0,05M. The reason behind this addition was to enhance the extraction efficiency of Hg.
• Grinding time in attrition cells, 10 minutes.
• Pressure used in the MOPS reactor, 15 to 20 bars.
17
3.3.2 Results
3.3.2.1 Phase 1-wet separation, release of oversized material
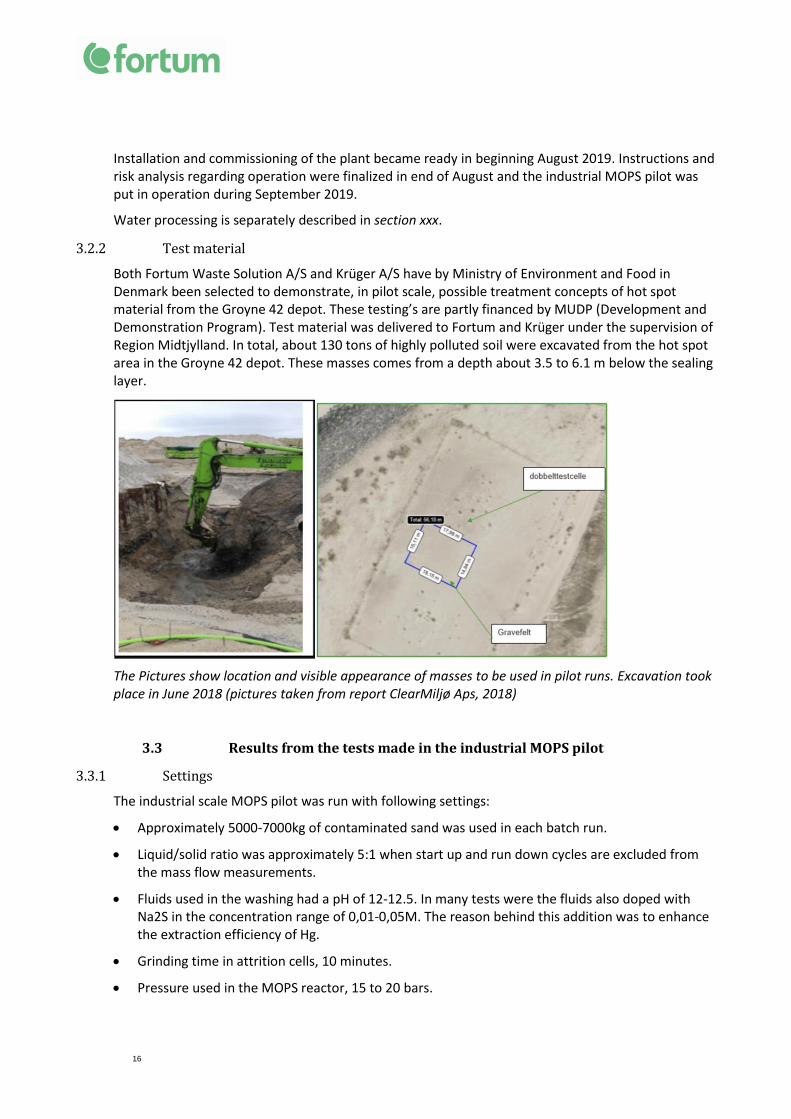
The installed initial function to remove stones and gravel from the contaminated sand worked properly (phase 1- wet separation). Washing drum in combination with a wet sieving deck of gravel took out all material with a size >2mm. It is however, important to rinse oversized material properly, otherwise small amounts of fines attached on surfaces will be present. In figure 8, images are shown that illustrates the function seen in washing drum and sieving deck of gravel. Visual appearance of stones and gravel can be seen figure 9. The amount of oversized material is approximately 5% in relation to fed amount, analytical readings of Hg and target OP:s come out extremely low, measured Hg is between 5-10µg/kg and target OP:s are all below detection limit.
Figure 8: Shows images of washing drum and gravel sieving deck in operation.

18
Figure 9: Visual appearance of stones and gravel after being separated from the contaminated sand. This wet separation step occur as phase 1 in the MOPS washing.
3.3.2.2 Results on treated sand after complete performance of the basic MOPS wash process (phase 2 and 3 in flow procedure).
When the oversized materials have been isolated the contaminated sand is ready for further processing, which in reality entails activation of MOPS washing including heavy attrition, grinding and in the end high pressure washing (phase 2 and 3 in process flow). All tests conducted during the time period September 2019 to January 2020 utilized sand from the excavation made in the Groyne 42 depot in June 2018. Background characterization of this hot spot sand can be found in section 3.1.
Several test sequences were arranged in the industrial MOPS pilot. The overarching goal was to increase the aggressiveness of the MOPS process as new test batches were started. This was mainly accomplished by steadily increasing the concentration of active chemicals present in wash liquids. In some of the tests made, final sand from a complete wash cycle was added once more into the MOPS plant (wash cycle 2). The purpose of wash cycle 2 was simulate two MOPS washing concepts connected in series. As a start it became very clear that the washing efficiency achieved in the proper designed and constructed industrial MOPS was far better compared to the washing efficiency seen in the small pilot. When the big MOPS pilot was run in its mildest form results come out better than two wash cycles made in small pilot. It became also clear that approximately 80% of the mercury contamination can be liberated quite easy from the sand, but the remaining 20% require really the

19
harsh treatment taking place in the attrition cell and the high pressure reactor (MOPS reactor), see figure 10 below for illustration.
Figure 10: Shows an example in which step in the MOPS washing process most of the Hg get mobilized. Only approx. 20% of the Hg contamination require really harsh treatment (attrition + High pressure washing), but these last 20% are extremely hard tied to the sand and harsh physical and mechanical treatment alone cannot push Hg down to really low levels.
In table 1 below and the graphs to follow (figure 11 to figure 16) the outcome of the 6 last tests performed in the industrial MOPS pilot plant can be seen. As a summary following can be said from the outcome of these tests:
1. Feed concentrations of target contaminants: The Hg concentrations does not differs too
much from test to test according to ICP analysis performed, start values were all in the range
600-800 mg/kg TS. Nevertheless, the values are considerable higher compared to reported
concentrations in our pre-study as well as in the report about excavation test material
coordinated by region Midt (Notat-Høfde 42 Udtagning af jordprøver til
afværgeforsøg,2018). In accordance with pattern seen in performed pre-study, a much wider
spreading is observed when it comes to OP:s; E-Parathion 3-930 (2200 top value in a
complementary bench scale study) mg/kg TS, M-Parathion 97-236mg/kg TS, Malathion 27-68
mg/kg TS, E-sulfotep 6-146 mg/kg TS.
2. Removal efficiency of Hg in MOPS wash cycle 1 : When the plant is operated with washing
liquid in its “mildest” form, in fact only adjustment of pH to 12, up to 90% of the Hg was
removed from the sand in the first wash sequence. This is far better compared to
corresponding results seen in the pre-studies performed. All together this is believed to be
connected to improvements regarding attrition, high pressure spraying and final rinsing.
Different degree of Hg contaminant will most likely be firmly tied to strong and insoluble
complexes with reduced sulfur groups (thiols) as the main scavenger. Are these insoluble Hg
complexes also deeply embedded in cavities present at the sand grains, mechanical “tools”
0
100
200
300
400
500
600
700
800
900
Refill container Dewateringscreen
After attrioncell Final sand Final sand Extrarinsed
Hg 812 145 60 38 38
HG
MG
/KG
TS
Mercury reduction

20
as attrition, grinding and high pressure spraying will be insufficient in complete removal of
this part of the Hg contamination. Based on the characteristics of the Hg contamination, the
effect of MOPS process utilizing wash liquids doped with various degrees of active
complexing agents were investigated. As can be seen in table 1 as well as in figure 11, a
concentration of 0,04M Na2S in wash liquid together with the harsh mechanical impact taken
place in MOPS, create a very powerful treatment. The primary target to reduce Hg down to
<3mg/kg TS has in these tests been confirmed to be possible, and it has at the same time
also been demonstrated that the goal is within reach in one single MOPS washing cycle
only. Another way to explain the effect is that it >99,5 % of the Hg contamination can be
liberated within one MOPS washing cycle. As conclusion, which also has been described in
the pre-tests, removal of Hg in the hot spot sand will require mechanical and physical “tools”
to transfer the major part of the Hg into liquid phase in shape of suspended solids. An active
chemical leaching will enhance removal efficiency of Hg by “attacking” the inaccessible part,
the part deeply embedded into cavities present in the sand grains or/and Hg present as
insoluble Hg sulfide compounds.
3. Removal efficiency of remaining Hg at repeated MOPS washing (wash cycle 2): As can be
seen in table 1 some effect of additional Hg removal is observed when sand is exposed to a
second MOPS washing sequence. This as long as the MOPS washing take place with liquid
without any presence of active complexing agents. No effect is noticed when repeated MOPS
washing is utilized on sands treated with 0,04M Na2S in the first cycle. In these sands only a
minor fraction of Hg is left and it is most likely so firmly bound that release into liquid phase
is far more depending on the “aggressivity” of liquid compared to physical impact. Even
though the industrial scale MOPS pilot is far better in construction compared to the small
pilot used in the pre-tests, cross contamination cannot be totally avoided during repeated
wash cycles. The problem is, even the magnitude is less, still the same as before. Even if the
plant is emptied as far as possible before sand already treated once is put back into the
process, a lot of fractions of old highly contaminated sand is found in pipes, screws, attrition
cells etc and of course this lead to memory effects and the sand treated a second time will
consist of a blend that is somewhere in between an unprocessed sand and treated sand. The
effect of additional MOPS wash cycles are in this study underestimated, in a full scale plant
cross contamination effects are prevented by construction of two MOPS washing concepts
connected in series.
4. Removal efficiency of target OP:s in MOPS wash cycle 1: As in the pre-studies made,
alkaline hydrolysis seems to work really well in mobilization/alteration of OP:s into none
toxic forms. It is clearly shown in table 1 and fig 12 to 15 that the first MOPS wash procedure
decrease target OP:s with at least 95%, in several cases target OP:s are decreased down to
sub ppm level or down to detection limit. The data set is not as complete as for Hg and this is
due to very long answering times seen in labs due to a rather complex analytical procedure.
More data would probably not change the fact that it is not confirmed that the primary
target to reduce OP:s down to sub ppm levels can steadily be reached within utilization of
one MOPS washing cycle only. The big variation seen from test to test regarding start
measurements of target OP:s, will most likely, even in a proper full scale plant, result in
occasional batches of treated sand with residual concentrations of OP:s in single ppm´s. The

21
most straight forward way to improve this situation, is to repeat the MOPS washing once
more, see below. Other complementary alternatives are described in section 3.3.2.3.
5. Removal efficiency of remaining target OP:s at repeated MOPS washing (wash cycle 2): The
results from repeated MOPS washing, wash cycle 2, performed at three different occasions
(see table 1 and figure 12 to 15), clearly demonstrate that target OP:s are further reduced.
Nothing else than a high pH (12) is required to maintain in the washing fluid to currently
observe this effect. High pH in the fluid will in similarity to Na2S for Hg create an active
chemical leachant that will enhance removal efficiency of OP:s by strengthening alkaline
hydrolysis of OP:s and this degradation convert pesticides to non-toxic (inactive) forms.
Despite of existing memory effects, it seems that alkaline hydrolysis is effective even at the
part of OP contamination hard bound to the sand grains or rather inaccessible for
mechanical liberation. The fact that further reduction of OPs was observed in all three cases
where the MOPS washing were repeated, even although notable cross contamination occur,
gives support and confidence to conclude: Two MOPS washing cycles performed in series
will result in a final sand with target OP:s reduced down to detection limits. Now and then
it is expected that batches with reduction of target OP:s down to only sub ppm levels will
occur and thereby might this sand be considered for re-washing. Contradictory to mercury it
appears to be useful to rewash batches of sand that do not fulfil demanded treatment
target of target OP:s.
6. Sulfur and Phosphorus as indicator elements of success in the MOPS washing: As can be
seen in table 1 high removal efficiency of target contaminants simultaneously also reduce
the amount of S and P present in the sand. It is especially Hg and S that shows a strong
connection and this support the fact that at least part of the Hg contamination is connected
to sulfur. S and P are important online parameters to follow in the sand at different stages in
full scale operation. They are easy to measure and give indirectly a stable picture about how
clean the sand actually is when it comes target contaminants as well.

22
Table 1: The table shows start values of target contaminants in different test sand batches as well as end values of same contaminants after one or two MOPS treatment sequences. In the table is also sulfur and phosphorus reported, this is due to that these two elements constitute important key parameters in measurements of the MOPS washing effect.
MOPS
treatment
batches
code names
in graphspH Na2S TS 105C Hg (Fortum) Total S Total P
Ethyl
parathion
Methyl
parathionMalathion E-sulfotep
Batch 1 M % [mg/kg TS] [mg/kg TS] [mg/kg TS] [mg/kg TS] [mg/kg TS] [mg/kg TS] [mg/kg TS]
Start Batch1 12 93,23 687 4174 313,7 3,4 212 27 67
Wash 1 Batch1 W1 12 90,64 65,99 1039 29,34 0,13 1,3 0,05 0,1
Wash 2 Batch1 W2 12 73,69 26,78 1569 25,6 0,02 0,05 0,05 0,1
Batch 2
Start Batch2 12 0,01 95,39 616,6 5589 315 11 236 34 146
Wash 1 Batch2 W1 89,36 8,14 799,8 28 0,02 0,85 0,05 0,1
Batch 3
Start 12,5 0,02 597,4 5125 887,7
Wash 1 Batch3 W1 22,77 595,1 33,52 0,46 0,74 0,06 0,1
Batch 4
Start 12,5 0,03 95,47 785,4 7628 409
Wash 1 Batch4 W1 77,68 4,26 407,6 24,75 0,41 14 0,05 2,4
Batch 5
Start 12,7 0,04 95,91 604,5 6630 383,2
Wash 1 Batch5 W1 12,7 0,04 76,47 0,2 256,9 25,4 33 0,02 0,02 0,02
Wash 2 Batch5 W2 12,7 0,04 78,37 2,4 755 23,22 10 0,02 0,02 0,02
Batch 6
Start Batch6 12,8 0,04 94,16 757,9 5139 345,9 930 97 68 5,8
Wash 1 Batch6 W1 12,8 0,04 76,77 1,9 138,8 16,24 17 0,79 0,06 0,14
Wash 2 Batch6 W2 12,8 0,04 1,8 5,4 0,09 0,03 0,09

23
Figure 11: A graph illustration about Hg concentrations observed in test sands before and after exposure to one or two MOPS washing sequences. Data from 6 independent test runs. The graphs clearly shows the effect of doping the washing liquid with Na2S. A wash liquid with concentration of 0,04M Na2S create enough “strength” to transfer more or less the whole mercury contamination, in shape of highly soluble and stable poly sulfides, into the liquid phase.
0
100
200
300
400
500
600
700
800
Untreated NaOH 0,01M Na2S 0,02M Na2S 0,03M Na2S 0,04M Na2S 0,05M Na2S
695 39
616 8
600 11
785 4
604 0,2
760 1,9
640 2,4
Mercury in final sand in relation to strength of Na2S in wash solution

24
Figure 12: A graph illustration about Ethyl parathion concentrations observed in test sands before and after exposure to one or two MOPS wash sequences. Data from 6 independent test runs.
0
100
200
300
400
500
600
700
800
900
1000
Untreated NaOH pH12 NaOH + 0,01MNa2S
NaOH + 0,02MNa2S
NaOH + 0,03MNa2S
NaOH + 0,04MNa2S
Batch1 3,4
Batch1 W1 0,13
Batch1 W2 0,02
Batch2 11
Batch2 W1 0,02
Batch3 W1 0,46
Batch4 W1 0,41
Batch5 W1 33
Batch5 W2 10
Batch6 960
Batch6 W1 17
Batch6 W2 5,4
Ethyl parathion sample description + composition of wash liquid

25
Figure 13: A graph illustration about Methyl parathion concentrations observed in test sands before and after the exposure to one or two MOPS wash sequences. Data from 6 independent test runs.
0
50
100
150
200
250
Untreated NaOH pH12 NaOH + 0,01MNa2S
NaOH + 0,02MNa2S
NaOH + 0,03MNa2S
NaOH + 0,04MNa2S
Batch1 212
Batch1 W1 1,3
Batch1 W2 0,02
Batch2 236
Batch2 W1 0,85
Batch3 W1 0,74
Batch4 W1 14
Batch5 W1 0,02
Batch5 W2 0,02
Batch6 97
Batch6 W1 0,79
Batch6 W2 0,09
Methyl parathion sample description + composition of wash liquid

26
Figure 14: A graph illustration about E-sulfotep concentrations observed in test sands before and after exposure to one or two MOPS wash sequences. Data from 6 independent test runs.
0
20
40
60
80
100
120
140
160
Untreated NaOH NaOH +0,01M Na2S
NaOH +0,02M Na2S
NaOH +0,03M Na2S
NaOH +0,04M Na2S
Batch1 67
Batch1 W1 0,1
Batch1 W2 0,1
Batch2 146
Batch2 W1 0,1
Batch3 W1 0,1
Batch4 W1 2,4
Batch5 W1 0,2
Batch5 W2 0,2
Batch6 5,8
Batch6 W1 0,14
Batch6 W2 0,09
E-sulfotep sample description + composition of wash liquid

27
Figure 15: A graph illustration about Malathion concentrations observed in test sands before and after exposure to one or two MOPS wash sequences. Data from 6 independent test runs.
0
10
20
30
40
50
60
70
Untreated NaOH pH12 NaOH + 0,01MNa2S
NaOH + 0,02MNa2S
NaOH + 0,03MNa2S
NaOH + 0,04MNa2S
Batch1 27
Batch1 W1 0,05
Batch1 W2 0,05
Batch2 34
Batch2 W1 0,05
Batch3 W1 0,06
Batch4 W1 0,05
Batch5 W1 0,02
Batch5 W2 0,02
Batch6 68
Batch6 W1 0,06
Batch6 W2 0,03
Malathion sample description + composition of wash liquid

28
Figure 16: Relation between mercury, sulfur and phosphorus in the sand from Groyne 42 at different stages of the washing.
Figure 17: A typical visual appearance of test sand before and after the sand has been exposed to a MOPS washing sequence. Untreated sand to the left and far to the right sand that come out from the MOPS reactor, in between the look of sand after treatment in attrition cell.
0
1000
2000
3000
4000
5000
6000
Untreated sand Dewatering screen Sand tank Final sand
S 5589 2367 1940 799,8
5139 913,7 2583 138,8
P 315 79,63 63 28
345,9 41,96 46,97 16,24
Hg 616,6 159,8 133,7 8,14
757,9 71,37 58,79 1,9
Relation between mercury, sulfur and phosphorus in
S P Hg

29
3.3.2.3 Simulation of additional treatment steps that can be added in full scale plant in order to improve cost efficiency and purity of treated sand.
The effect of wet separation on final sand after completed MOPS washing
There are two major mechanisms taken place in MOPS washing; 1) attrition and grinding crack up coatings etc and transferred them in shape of suspended solids into the liquid 2) chemical complexation and hydrolysis increase solubility of the inaccessible part, the part deeply embedded into cavities or/and Hg present as insoluble Hg sulfide compounds. When it comes to mechanism nr. 1 nearly all suspended solids are kept in solution throughout the washing, but a minor amount end up as dust on the sand and results in small contamination. An additional treatment step, where the washed sand is fractionated and at the same time rinsed will improve the situation. Simulation of an up-stream classifier where the sand is separated into two fractions, 0,25-2mm and >0,063-0,25mm has in bench scale studies led to very promising results. The coarse grained fraction, 0,25-2mm will based on smaller surface area in relation to weight keep less dust compared to the fine fraction , >0,063-0,25mm, with bigger surface area in relation to weight. The fraction between 0,25-2mm constitute 70-80% of the sand body (see figure 18) and in the simulations made this fraction steadily holds a mercury contamination that is <1mg/kg TS. As conclusion- An upstream classification performed on MOPS washed sand, will result in improved purity up to 70-80% of the sand body and this to such extent that residual Hg left in sand meets criteria of free use, Hg <1mg/kg TS and this is equal to fulfilment of the secondary goal. Probably use of upstream classification is more efficient and cost effective technique to reduce Hg down to <1mg/kg in a major part of the sand body compared to repeated washing of the whole batch.
When it comes to target OP:s, same pattern as for Hg is observed, see figure 19. The data set is, however, not as complete as for Hg and this is due to very long answering times seen in labs due to a rather complex analytical procedure. More data would probably not change the fact that it is not confirmed that the primary target to reduce OP:s down to sub ppm levels or detection levels are steadily in reach by performance of an upstream classification. The big variation seen from test to test regarding feed concentrations of target OP:s will most likely, even in a proper full scale plant, result in occasional batches of treated sand with residual concentrations of OP:s in single ppm´s. and these batches might have to be washed once more.

30
Figure 18: An example of outcome from simulation tests of an up-stream classification of final sand from MOPS washing, the figure illustrate how distribution of residual Hg is divided between different grain sizes. The figure also shows that nearly 80% of the sand hold a grain size of 0,25 to 0,5mm.
0,0
10,0
20,0
30,0
40,0
50,0
60,0
70,0
80,0
90,0
0
0,5
1
1,5
2
2,5
3
final Soil 0,5 0,25 0,125 0,063 <0.063
% G
rain
siz
e
Hg
mg/
kg t
s
Hg mg/kg
Ratio grain size/mercury in final soil
Final Soil Fraction mm
<1 <1 3,8 8,5 84,5

31
Figure 19: Separation of different sand sizes in a simulation test of up-stream classification procedure and the figure illustrate how this effects the distribution of residual target OP:s.
4 WATER TREATMENT
The wash water is treated in a proprietary electrochemical treatment with a polishing step based on Fenton chemistry. In the water treatment process the pollutants end up in a waste stream in the form of a floc. The dry content of the floc is initially a few percent but can be dewatered further before subsequent destruction by e.g. high temperature incineration. The volume and mass of floc is estimated to be just a small fraction of the treated sand as well as the used water. A preliminary mass balance based on analysis results show on a good consistency between the theoretical treatment results for the process and actual performance when running the water treatment, i.e. what is not in the treated water or in the treated sand is in the floc (see section 5).
When running the pilot scale water treatment at 1.5 m3/h, the level of Mercury goes from on average 13,290 mg/l (σ ±12,188, High 49,920 mg/l / Low 1,772 mg/l) to 15-150 µg/l after the electrochemical treatment and to levels of 16-140 ng/l after the polishing step. The visual appearance goes from a strongly yellow and somewhat turbid solution to a clear and transparent water, see figure xxx below. The smell of the untreated water is very pungent and unpleasant. After full treatment the water is completely odorless. Both the appearance and smell can be connected to the more or less fully hydrolyzed pesticides resulting in residuals that are less dangerous than the original pesticides but still very important to capture. The organic pollutants that have not ended-up in the floc from the electrochemical treatment get oxidized in the polishing step. The treatment
Feed Final soilFraction 500
µmFraction 250
µmFraction 125
µmFraction 63
µm
Malathion 110 0 0 0 0 0
Parathion 2400 23 12 7,1 7,6 17
Parathion-methyl 140 0,23 0 0 0 0,15
Sulfotep 5,3 0 0 0 0 0
Fraction % 5 77 14 3
0
10
20
30
40
50
60
70
80
90
0
500
1000
1500
2000
2500
3000
% G
rain
siz
e
mg/
kg T
S
Ratio grain size/OP:s in final soil

32
efficiency for the organics is more complex than the inorganic part as there is a multitude of pollutants to analyze. As in the case of Hg, most of the OP:s are transferred into the water phase in shape of suspended solids. Analysis of liquids will only reflect the part of organics that are dissolved. If followed on a high level, soluble TOC is significant decreased in the water treatment process (e.g. 98 mg/l to 22 mg/l). When the specific pesticides are analyzed the results are harder to interpret as the levels of pesticides already in the untreated water are close to or below the level of detection. It can be reasoned that a more or less complete oxidation is reached as the fully treated water has the smell and appearance of pure water.
Figure 20: Images of water before and after Fenton process. The beaker far to the left reflects the look of water leaving the electrochemical treatment and far to the right final water after completion using Fenton.
5 THE MERCURY MASS BALANCE
Based on analytical data collected both from cleaned sand and the amount of mercury trapped in the sludge phase produced in the water treatment pilot, a rather good mass balance regarding Hg is observed, see schematic sketch below. This strongly support the fact that no volatile mercury is formed in the MOPS washing. Data simulation of predominating mercury species created at the conditions formed during MOPS washing, has also confirmed the hypothesis that elemental Hg cannot be formed in these circumstances.

33
6 CONCLUDING REMARKS BASED ON THE RESULTS OF THE STUDIES PERFORMED IN THE INDUSTRIAL MOPS PILOT
Base process (MOPS washing cycle 1)
These pilot tests have demonstrated that most of the time reduction of Hg to <3mg/kg TS and target OP:s to sub ppm levels are within reach by treatment in one single MOPS washing sequence. Another way to explain the effect of the MOPS treatment, is that it >99,5 % of the Hg contamination and > 95% of target OP:s are removed from the sand.
Wet fractionation as an additional treatment step after MOPS washing cycle 1 (release of sand >0,25mm in size).
An up-stream classifier installed in the flow directly after the MOPS, will simultaneously fractionate and rinse the sand. This stabilize the quality and to such extent that 70-80% of the sand will meet criteria of free use when it comes to Hg (Hg <1mg/kg TS) and at the same time target OP:s are expected to reach detection limit most of the time.
MOPS washing cycle 2
The remaining fine sand (approx. 20% of massload), will after exposure to a second MOPS washing sequence connected in series stabilise quality of these last 20% of sand so it fulfil criteria of restricted use regarding Hg and target OP:s will be reduced to sub ppm levels.
Batches of coarse grained sand (>0,25mm) that does not reconcile with criteria of free use after exposure to MOPS washing cycle 1 followed by upstream classification, is planned to be processed once more and thereby should quality of free use be guaranteed, especially if the problem originates from too high levels of target OP:s in the sand.
It is expected that 20% of the sand have to be run twice throughout the whole process chain in order to meet above stated goals, this has been taken in consideration when it comes to cost calculations.
25000 kg/h
6000 kg/h 5754 kg TS/h
5754 kg TS/h
Hg 0,024034 kg/h
Hg 4,0278 kg/h
Hg 3,67128 kg/h
Hg BALANCE
Hg In 4,03 kg/h
Hg Out 3,70 kg/h
Hg 0,00000040 kg/h
untreated sand
clean sand
water IN
water Out
sludge

34
7 COMMERCIAL IMPORTANCE
7.1 Full-scale MOPS plant designed and constructed to treat sand from the Groyne 42 depot
Following main aspects will be taken in account when it comes to design, construction and operation of full scale MOPS washing plant:
1. Before the actual attrition, grinding and intensive washing of the sand starts, a wet pre-screening has to be made. The purpose is to separate stones, gravel and other types of bigger objects that can destroy or decrease efficiency of certain apparatus essential in washing of sand.
2. An efficient treatment of target OP:s in hot spot sand from the Groyne 42 depot will demands a pH around 12 in the washing fluid. Far reaching mobilisation of Hg, will in additional to high pH also require addition of a complexing agent. Disodium sulfide in the concentration range 0,03-0,05M will be added into the fluid with start in the attrition step.
3. More than one wash cycle might be essential before quality of treated sand fulfil desired criteria of free or restricted use. The plant will comprise of two complete MOPS washing steps connected in series. By doing so cross contamination problems are kept to minimum and this will stabilize treatment results so most of the sand body can meet very stringent treatment goals.
4. An up-stream classifier will be installed in the flow directly after the MOPS washing nr 1.
sequence the purpose is to simultaneously fractionate and rinse the sand. This stabilize
the quality and to such extent that a large part of the coarse grained sand can be
released for discharge already after MOPS washing sequence nr 1. It is expected that
classified sand will fulfil criteria of free use.
5. Heavy and unhealthy smell is serious fact when it comes to untreated hot spot sand from the Groyne 42 depot. The plant has to be constructed so fumes and aerosols are kept isolated as far as possible from free exposure to operators and nearby surroundings. Precautions of fumes in water treatment have to be taken in account in equal relevance.
6. Intermediate storage of test batches of hot spot sand have to protected from exposure of rain to prevent undesired leaching and possible fumes have to be taken care of.
A basic flow scheme of the full scale plant can be seen in figure 21 and the main differences compared to the industrial pilot are installation of an up stream classifier in order to take out coarse grained sand fractions in between MOPS washing sequence 1 and 2. Fine grained will already from start be treated by utilization of two MOPS washing sequences in series. If needed, coarse grained sand fractions can also be treated in MOPS washing sequence nr. 2.

35
Figure 21: Principal flow scheme of the full scale MOPS.
In the table 2 below a simple summary of expected outcomes from the full scale washing are shown when applied on highly contaminated sand from Groyne 42. We expect that approximately 20% of the batches released for analytical control have be rewashed in accordance to reach remedial goals addressed in the table.

36
Table 2: Shows a simple illustration of expected outcome of full scale MOPS washing when exposed on highly contaminated sand from the Groyne 42 depot.
FractionsType of sampling and analytical
parameters controlled
Expected residual
contents of Hg and OP:s
Expected exist of
material
Not reached
expected exist of
materialSand 2-200mm
Collection in
batches of approx
200ton
Probaility sampling according to
sampling routine in fractions stored in
piles. Hg, P, S, TOC, selected OP:s*
Hg <1mg/kg
OP:s < 0,02 mg/kg
Cassification
free use
Local exist approx
5-10% of feed
Sand 0,25-2mm
Collection in
batches of approx
500 tons
Probaility sampling according to
sampling routine in fractions stored in
piles. Hg, P, S, TOC, selected OP:s*
Fenton treatment
Hg <1mg/kg
OP:s <0,02 mg/kg
Classification
free use, local exit
60-80% of feed
Approximately 20%
of the material is
expected to be
treated once more in
MOPS (cycle 2)
Sand 0,125-0,25mm
Probaility sampling according to
sampling routine in fractions stored in
piles. Hg, P, S, TOC, selected OP:s*
+ leachability tests L/S 2?
Hg <3 mg/kg
OP:s < 1 mg/kg
L/S 2 = ? Depend on exist
Classification
None hazardus landfill
10-15% of material
Approximately 20%
of the material is
expected to be
treated once more in
MOPS (cycle 2)
Sludge from water
treatment
Probaility sampling according to
sampling routine in dewatered
fractions stored
containers/embankments. Hg, P, S, TOC
2-4% of feed
High temperature
incineration FWS in
Nyborg
* OP:s = organophorphus insecticides,
Methyl Prathion, Ethyl Prathion,
Malathion, E-sulfotep
Analytical control and expected quality of treated fractions
37
7.2 Indicative treatment prices of MOPS washing on sand from Groyne 42
Based on studies performed in the industrial MOPS pilot some preliminary cost calculations have been made regarding treatment prices of highly contaminated Groyne 42 sand. These prices have in its turn been recalculated to indicative treatment price applicable to treatment of the whole Groyne 42 depot. In other words high contaminated sand together with low contaminated sand. All together approx. 150 000tons or 87 000m3 of sand (27 000 highly contaminated and 60 000m3 lightly contaminated). It is expected that 20% of the sand has to be retreated and this has been taken in account in the pricing. Planned capacity of the plant is estimated to 30 tons of solid material/h. Annual capacity is approx. 60-120 000 tons depending on operation in day shift or two shift.
Following categories are included cost structure behind the pricing:
1. Direct costs like electricity, water, chemicals, front loaders, consumables, analytical control
2. Transportation of sand from the Groyne depot to the plant area. Distance up to 10km. All
internal transportation of sand fractions within the plant area.
3. Basic infrastructure costs like storage tents, treatment building, surface coatings, electrical
installations necessary pipe works etc.
4. Investment cost of MOPS plant including demanded water treatment.
5. Final transport and treatment of contaminated sludge approx. 2-4% of feed. Discharge cost
of purified water.
6. Fixed costs like salaries (operators and supervisors in total 10 persons) and maintenance
costs.
7. All support functions needed, like project management, handling of health- quality-safety
and environment (HQSE) topics.
Indicative treatment prices do not contain any type of costs related to:
1. Excavation, possible reinforcement, water treatment, project management in order to
isolate and collect contaminated sand from the Groyne 42 depot.
2. Transportation and disposal costs of cleaned sand due to, at this stage, unknown exists.
A density of the sand correlative to 1,8ton/m3 has been used in the calculations and the indicative prices are:
• Treatment of highly contaminated sand from Groyne 42 to price of 5096 DKK/m3, total
volume 27 000m3.
• Treatment of all sand inside the Groyne 42 depot to price of 2816 DKK/m3, total volume
87 000m3.