Embed Size (px)
Citation preview
Results from a Survey of Global Natural Gas Flaring from Visible Infrared Imaging
Radiometer Suite Data Chris Elvidge
Earth Observation Group NOAA National Centers for Environmental Information
Boulder, Colorado [email protected]
Mikhail Zhizhin, Kimberly Baugh, Feng-Chi Hsu
CIRES
May 18, 2016
Why monitor global flaring
• MRV (monitoring, reporting and verification) of national carbon emission reductions under the recently signed Paris Agreement.
• Tracking progress towards “Zero routine flaring by 2030” initiative of WB and UN.
• Calculating fossil fuel carbon intensities for Low Carbon Fuel Standards.
• As a tool for exploration for waste natural gas for capture / utilization.
• As an input to carbon emission spatial databases.
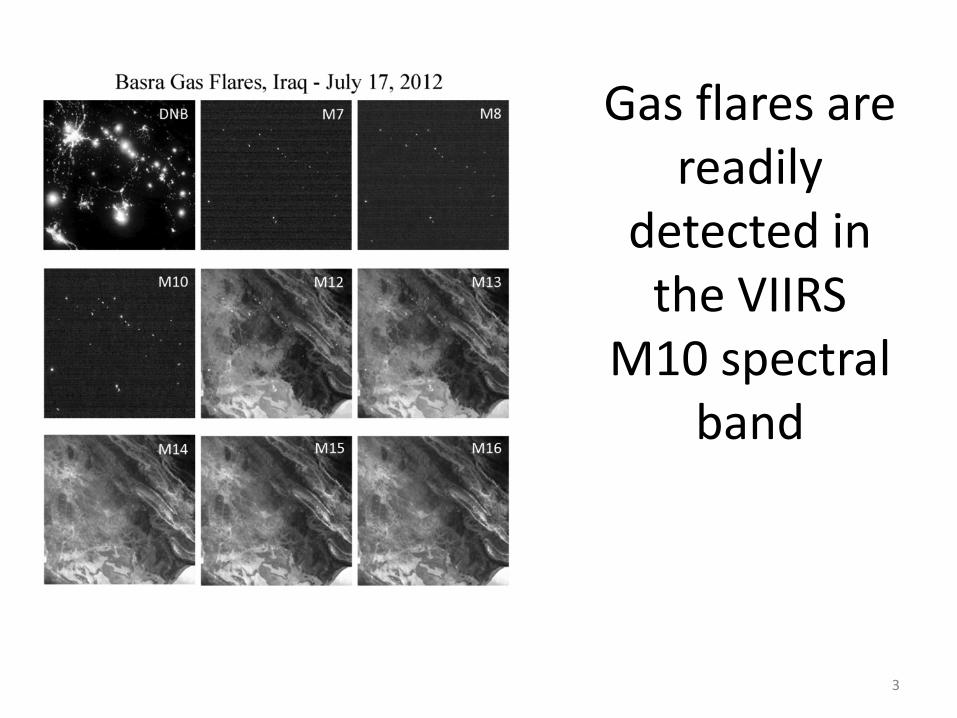
Gas flares are readily
detected in the VIIRS
M10 spectral band
3
M11 Approved
4
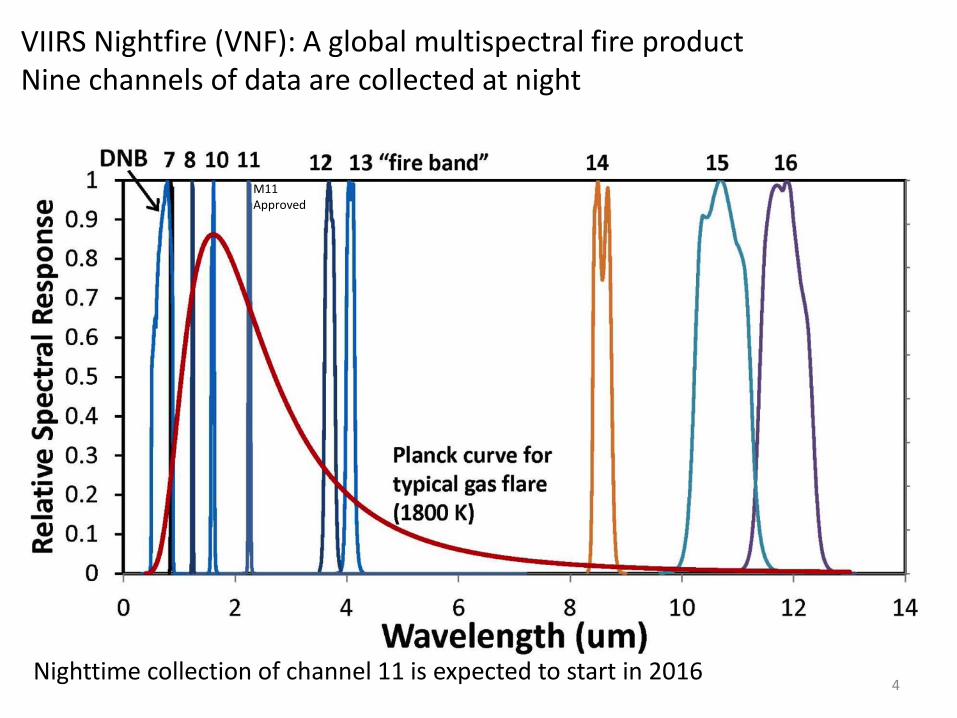
VIIRS Nightfire (VNF): A global multispectral fire product Nine channels of data are collected at night
Nighttime collection of channel 11 is expected to start in 2016
VIIRS Nightfire (VNF) • A multispectral “fire product” developed by the NOAA
Earth Observation Group. • Makes use of two near infrared (NIR), a short-wave infrared
(SWIR), and two mid-wave infrared spectral bands. • The NIR and SWIR bands were designed for daytime
imaging of reflected sunlight. IR emitters can be readily identified at night in these spectral bands.
• Daily files are in csv and kmz formats available at: http://ngdc.noaa.gov/eog/viirs/download_viirs_fire.html
• Publications: http://www.mdpi.com/2072-4292/5/9/4423 http://www.mdpi.com/1996-1073/9/1/14
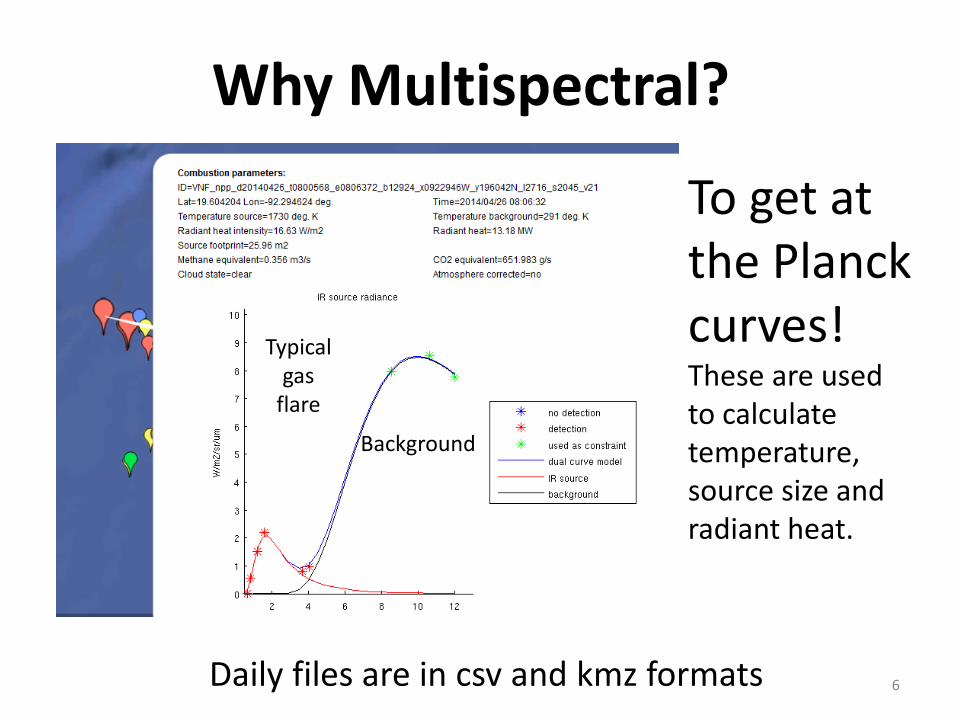
Why Multispectral?
To get at the Planck curves! These are used to calculate temperature, source size and radiant heat.
Daily files are in csv and kmz formats 6
Typical gas
flare
Background
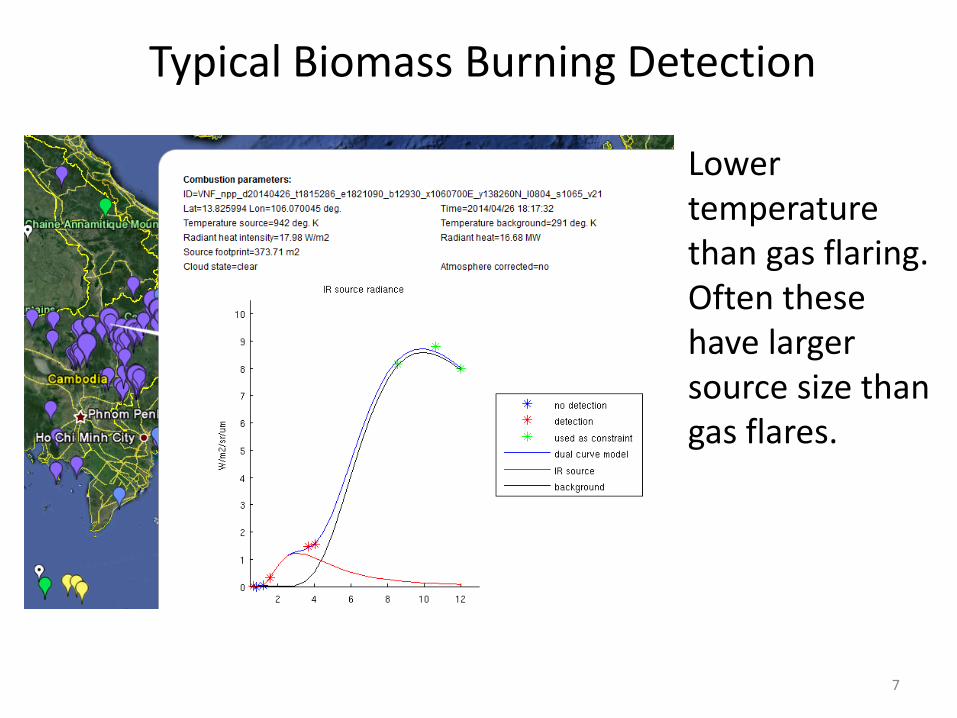
Typical Biomass Burning Detection
Lower temperature than gas flaring. Often these have larger source size than gas flares. North Dakota
7
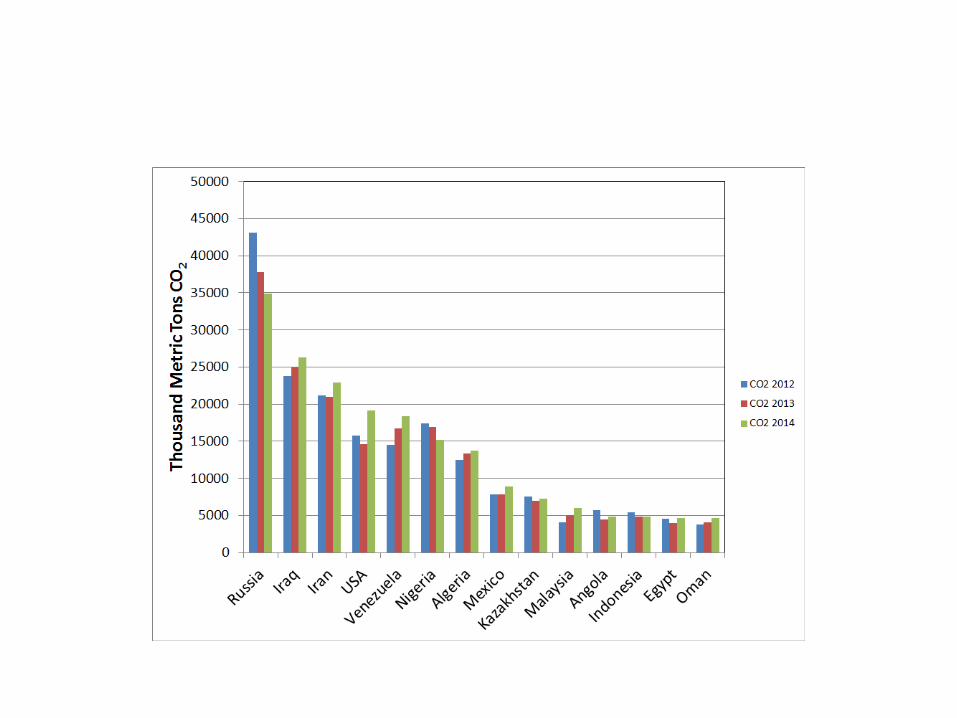
Global Atlas of Gas Flaring http://ngdc.noaa.gov/eog/viirs/download_global_flare.html
• 2012-2014 • Flaring sites identified based on temperature and
persistence. • Flared gas volume calibration developed based
Cedigaz national level data. • 17K flaring sites identified. • Russia leads in flared gas volume. • USA leads in the number of flaring sites. • The largest flare is in Venezuela.
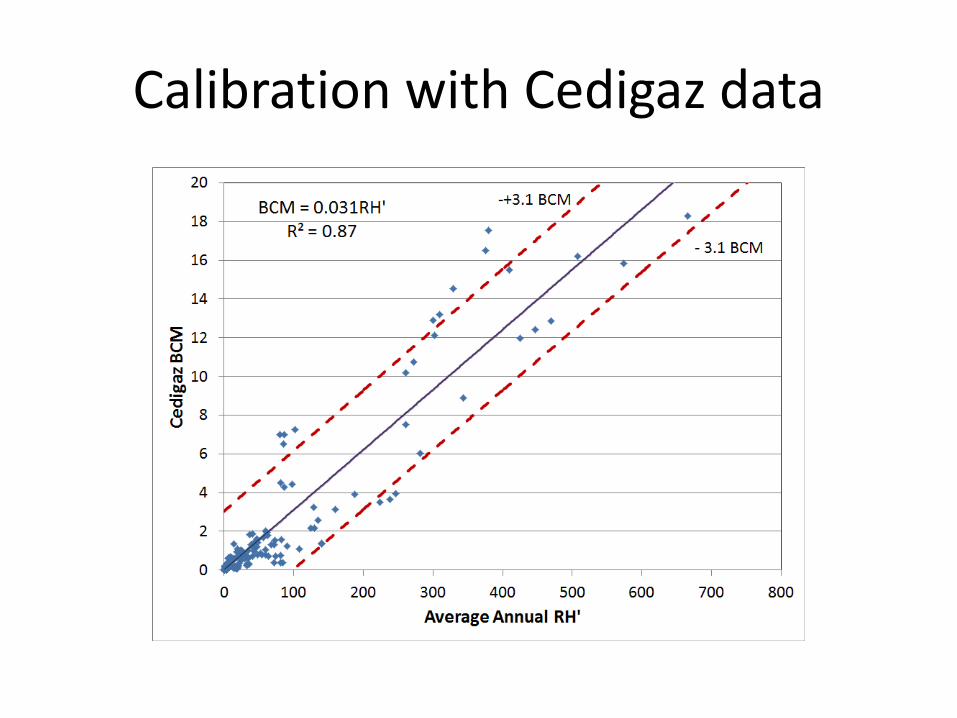
Calibration with Cedigaz data
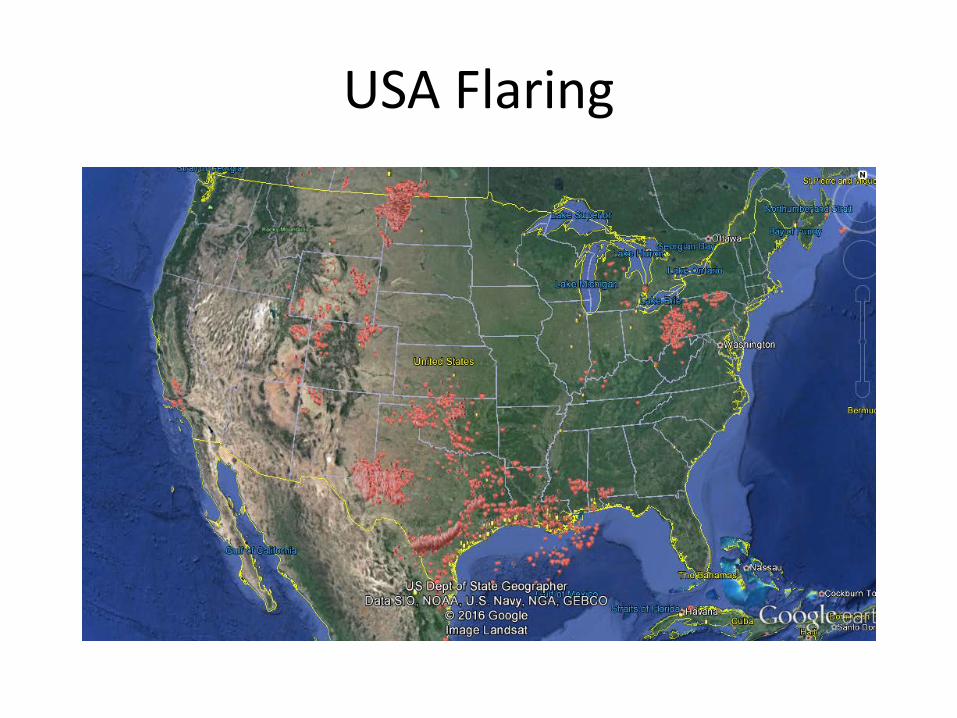
USA Flaring
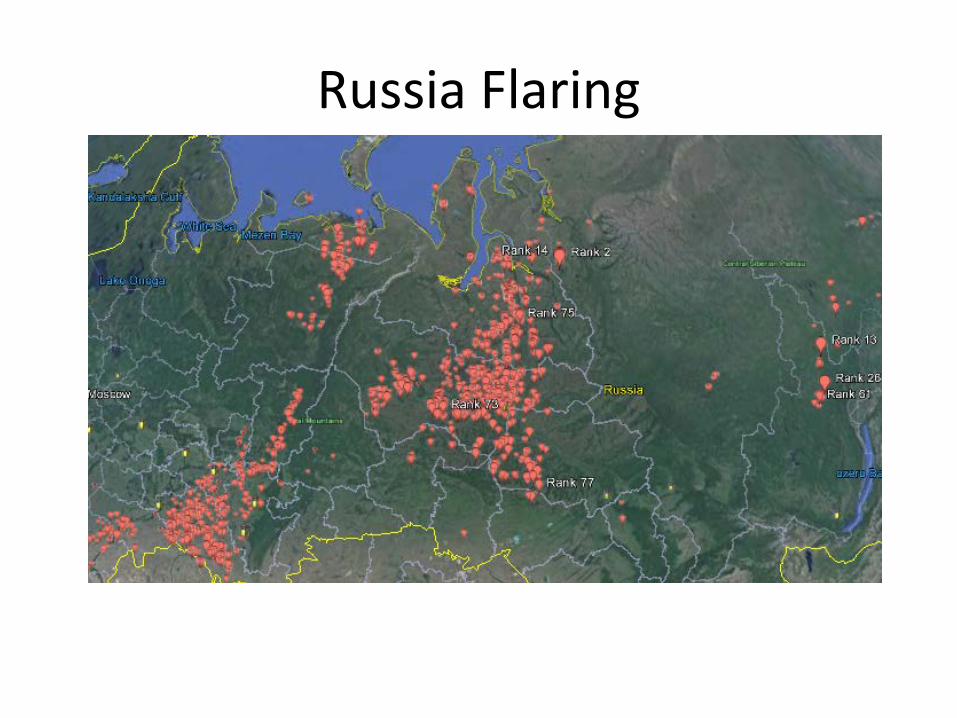
Russia Flaring
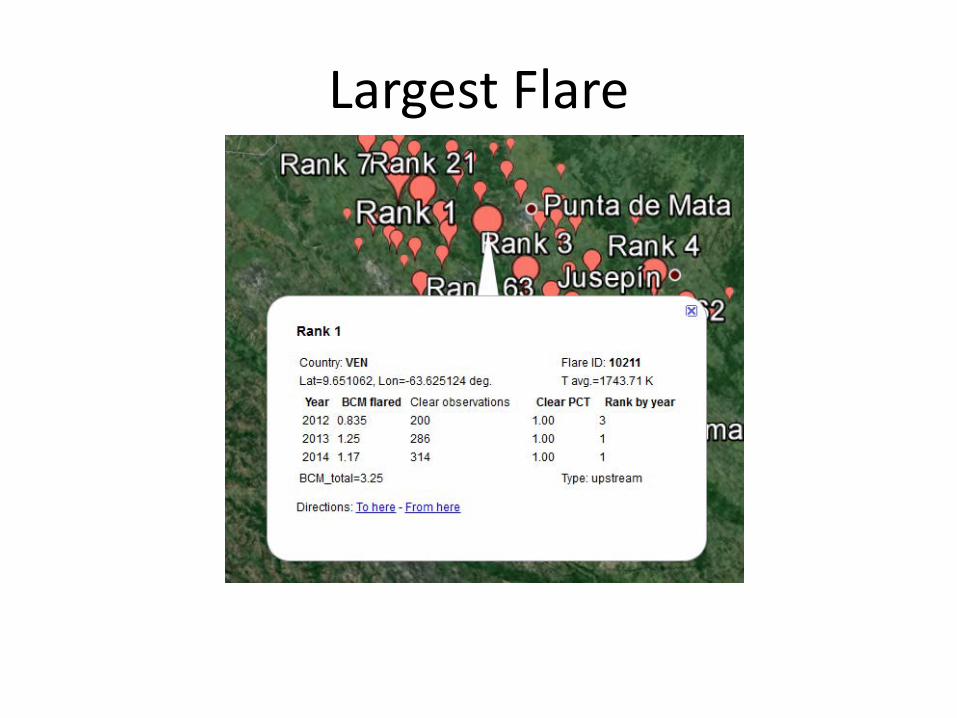
Largest Flare
Summary
• A new atlas of global gas flaring is now available. – 17K flaring sites identified. – Russia leads in flared gas volume. – USA leads in the number of flaring sites. – The largest flare is in Venezuela.
• Error bars on flared gas volume estimates are high, probably due to untraceable errors in the Cedigaz data. The calibration could be improved using a test flare facility.
• The project is currently on hold due to funding hiatus.