Embed Size (px)
Citation preview

January 27, 2010
CONSOLIDATED RESULTS (Millions of yen, thousands of U.S. dollars, except per share amounts)
Actual ProjectedYear ended
December 31, 2009Year ended
December 31, 2008 Change(%) Year endedDecember 31, 2009
Year endingDecember 31, 2010 Change(%)
Net sales 3,209,201¥ 4,094,161¥ - 21.6 34,882,620$ 3,450,000¥ + 7.5Operating profit 217,055 496,074 - 56.2 2,359,293 330,000 + 52.0Income before income taxes 219,355 481,147 - 54.4 2,384,293 320,000 + 45.9Net income attributable to Canon Inc. 131,647¥ 309,148¥ - 57.4 1,430,946$ 200,000¥ + 51.9
Net income attributable to Canon Inc. stockholders per share: - Basic 106.64¥ 246.21¥ - 56.7 1.16$ 162.01¥ + 51.9 - Diluted 106.64 246.20 - 56.7 1.16 - -
ActualAs of
December 31, 2009As of
December 31, 2008 Change(%) As ofDecember 31, 2008
Total assets 3,847,557¥ 3,969,934¥ - 3.1 41,821,272$ Canon Inc. stockholders’ equity 2,688,109¥ 2,659,792¥ + 1.1 29,218,576$
Notes: 1. Canon’s consolidated financial statements are prepared in accordance with U.S. generally accepted accounting principles. 2. Canon adopted the guidance for noncontrolling interests in consolidated financial statements in the fiscal year beginning January 1, 2009. In accordance with the adoption of the guidance, consolidated net income has been renamed to net income attributable to Canon Inc. 3. U.S. dollar amounts are translated from yen at the rate of JPY92 = U.S.$1, the approximate exchange rate on the Tokyo Foreign Exchange Market as of December 30, 2009, solely for the convenience of the reader.
NON-CONSOLIDATED RESULTS(Millions of yen, thousands of U.S. dollars, except per share amounts)
ActualYear ended
December 31, 2009Year ended
December 31, 2008 Change(%)Year ended
December 31, 2009
Net sales 2,025,546¥ 2,721,094¥ - 25.6 22,016,804$ Operating profit 97,777 358,706 - 72.7 1,062,793Ordinary profit 142,684 359,086 - 60.3 1,550,913Net income 80,778¥ 224,135¥ - 64.0 878,022$
Net income per share: - Basic 65.44¥ 178.50¥ - 63.3 0.71$ - Diluted 65.43 178.49 - 63.3 0.71Dividend per share 110.00 110.00 - 1.20
ActualAs of
December 31, 2009As of
December 31, 2008 Change(%) As ofDecember 31, 2009
Total assets 2,551,100¥ 2,618,998¥ - 2.6 27,729,348$ Net assets 1,812,718¥ 1,865,005¥ - 2.8 19,703,457$
Note: U.S. dollar amounts are translated from yen at the rate of JPY 92= U.S.$1, the approximate exchange rate on the Tokyo Foreign Exchange Market as of December 30, 2009, solely for the convenience of the reader.
Canon Inc. 30-2, Shimomaruko 3-chome, Ohta-ku, Headquarter office Tokyo 146-8501, Japan
Phone: +81-3-3758-2111
RESULTS FOR THE FOURTH QUARTER AND THE FISCAL YEAR ENDED DECEMBER 31, 2009
- 1 -
I. Operating Results and Financial Conditions 2009 in Review
Looking back at the global economy in fiscal 2009, although the year began amid an unprecedentedly harsh business climate, economic stimulus measures implemented by different countries have started to yield results, leading to moderate recoveries as the second half of the year approached. Although countries such as China and India, whose economies have rapidly grown in prominence, maintained their stable growth largely owing to increased consumer spending, developed countries such as Japan, the United States and European nations all recorded negative growth for the first time since the end of World War II, leading to negative growth overall around the globe.
As for the markets in which Canon operates amid these conditions, within the office equipment market, demand for both color and monochrome models of network digital multifunction devices (MFDs) decreased in each region. While sales for laser printers also remained weak, dropping below the year-ago level, the rate of decline gradually narrowed toward the second half of the year. As for the consumer products market, while demand for compact digital cameras remained sluggish and prices continued to decline, demand for digital single-lens reflex (SLR) cameras displayed solid growth especially in overseas markets. With regard to inkjet printers, although demand continued to be slack, which led to a reduction in market size compared with the previous year, conditions started to improve toward the end of the year. In the industry and others market, demand for steppers, utilized in the production of semiconductors, declined significantly while demand for aligners, used to produce liquid crystal display (LCD) panels, also slowed but showed signs of a recovery heading into the next fiscal year. The average value of the yen during the year was ¥93.21 to the U.S. dollar, a year-on-year appreciation of approximately ¥10, and ¥130.46 to the euro, a year-on-year appreciation of approximately ¥21.
Although the markets for such consumer products as cameras and inkjet printers are clearly bottoming out amid the significantly stronger yen, which has had an impact on all of the company’s businesses, net sales for the year totaled ¥3,209.2 billion (U.S.$34,883 million), a year-on-year decline of 21.6%, mainly due to the effects of reduced sales volumes of office products throughout the year. Despite the launch of new products and ongoing cost-cutting efforts aimed at an improved gross profit ratio, the impact of such factors as the substantial appreciation of the yen and the drop in sales value led to a 2.8 point decline in the ratio to 44.5%. Consequently, gross profit decreased by 26.3% to ¥1,427.4 billion (U.S.$15,515 million) for the full year. While operating expenses decreased by 16.1% owing to continued Group-wide efforts to thoroughly cut spending, operating profit dropped 56.2% to ¥217.1 billion (U.S.$2,359 million). Despite the decreased interest income due to the lower rate of return on cash and cash equivalents, other income (deductions) recorded a positive turnaround of ¥17.2 billion (U.S.$187 million), mainly reflecting an improvement in currency exchange losses and earnings on investments in affiliates accounted for by the equity method. As a result, income before income taxes totaled ¥219.4 billion (U.S.$2,384 million), a year-on-year decline of 54.4%, while net income attributable to Canon Inc. also decreased by 57.4% to ¥131.6 billion (U.S.$1,431 million).
Basic net income attributable to Canon Inc. stockholders per share was ¥106.64 (U.S.$1.16), a year-on-year decline of ¥139.57 (U.S.$1.52) compared with the previous year.
- 2 -

Results by Product Segment
Looking at Canon’s full-year performance by business sector, within the office business unit, demand for office equipment decreased overall amid the deterioration of economic conditions. Sales of network digital MFDs remained low in all regions while demand for laser printers decreased substantially compared with the previous year despite the optimization of inventory levels being in sight. Consequently, sales for the segment, including the impact of the strong yen, totaled ¥1,645.1 billion (U.S.$17,881 million), a drop of 26.8% year on year. Operating profit fell 49.8% to ¥229.4 billion (U.S.$2,493 million), mainly due to the decrease in gross profit stemming from the significant reduction in sales. Within the consumer business unit, sales volumes of such new products as the competitively priced EOS Digital Rebel T1i (EOS 500D) and advanced-amateur model EOS 7D digital SLR cameras recorded solid growth. As for compact digital cameras, although stagnant market conditions led to a contraction in sales volume, the Company reinforced its product lineup through the launch of six new ELPH (IXUS)-series models and nine new PowerShot-series models. As for inkjet printers, although the market overall remained sluggish, sales in the Americas and Asia displayed healthy growth, contributing to a year-on-year increase in sales volume. Sales for the segment as a whole, however, declined 10.6% year on year to ¥1,301.2 billion (U.S.$14,143 million) due to the significant impact of the yen’s appreciation. Operating profit decreased by 17.8% to ¥183.5 billion (U.S.$1,994 million), largely reflecting the decrease in gross profit arising from the reduction in sales. In the industry and others business unit, sales of steppers remained sluggish amid worsening market conditions for memory chips, while sales of aligners dropped due to restrained capital investment by LCD panel manufacturers. As a result, sales for the segment totaled ¥358.0 billion (U.S.$3,891 million), a decrease of 31.5%, while operating profit dropped to negative ¥76.0 billion (U.S.$826 million), due to the significant drop in sales along with the early disposal of assets, including excess production equipment, based on a fundamental reassessment of the business structure for steppers.
Cash Flow
Although Canon recorded a decline in profits in 2009, cash flow from operating activities totaled ¥611.2 billion (U.S.$6,644 million), a slight decrease of ¥5.4 billion (U.S.$59 million) compared with the previous year, as a result of the substantial progress achieved in inventory-reduction efforts. As capital investment was focused on items relevant to introducing new products in principal, cash flow from investing activities totaled ¥370.2 billion (U.S.$4,024 million), a year-on-year decrease of ¥102.2 billion (U.S.$1,111 million). Accordingly, free cash flow totaled ¥241.0 billion (U.S.$2,619 million), an increase of ¥96.8 billion (U.S.$1,052 million) from the previous year.
Cash flow from financing activities recorded an outlay of ¥142.4 billion (U.S.$1,548 million), mainly arising from the dividend payout of ¥135.8 billion (U.S.$1,476 million). Consequently, cash and cash equivalents increased by ¥115.8 billion (U.S.$1,259 million) to ¥795.0 billion (U.S.$8,642 million) from the end of the previous year.
Non-consolidated Results
Non-consolidated net sales totaled ¥2,025.5 billion (U.S.$22,017 million), a year-on-year decrease of 25.6%, ordinary profit declined by 60.3% to ¥142.7 billion (U.S.$1,551 million), and net income fell by 64.0% to ¥80.8 billion (U.S.$878 million).
- 3 -
Outlook As for the outlook for the global economy in fiscal 2010, although China and other emerging nations with significantly expanding economies are expected to continue enjoying steady growth, deteriorating employment conditions and other factors make it difficult to predict the economic prospects for developed countries even though they are projected to realize positive growth. While some leading indicators have pointed to a bottoming out and conditions are expected to slowly head toward a path of recovery as a result of various economic stimulus packages and financial policies launched at the national level, considerable time will likely be needed before the global economy realizes a full-fledged turnaround. In the businesses in which Canon is involved, with regard to network digital MFDs and laser printers in the office equipment market, demand is expected to gradually increase following the bottoming out of the segment. With respect to the consumer products market, demand for digital SLR cameras is forecasted to achieve solid growth, whereas demand for compact digital cameras and inkjet printers will also head toward a recovery trend. As for the industry and others market, projections call for a modest recovery in demand for steppers as device makers reassess their capital expenditure plans, and demand for aligners is also expected to increase as LCD panel manufacturers gear up to boost production. With regard to currency exchange rates for the full year, on which Canon’s performance outlook is based, despite the continued uncertainty over future interest rate policies for major countries along with the speed and level of economic recovery and other factors, Canon anticipates exchange rates for the period of ¥90 to the U.S. dollar and ¥130 to the euro, representing an appreciation of approximately ¥3 against the U.S. dollar, and relatively the same value for the euro compared with the previous year. Upon taking into consideration current business sentiment based on these foreign exchange rate assumptions, Canon projects net sales of ¥3,450.0 billion (U.S.$37,500 million), a year-on-year increase of 7.5%; operating profit of ¥330.0 billion (U.S.$3,587 million), a year-on-year increase of 52.0%; income before income taxes of ¥320.0 billion (U.S.$3,478 million), a year-on-year increase of 45.9%; and net income attributable to Canon Inc. of ¥200.0 billion (U.S.$2,174 million), a year-on-year increase of 51.9%.
Basic Policy Regarding Profit Distribution and Dividends for the Current Fiscal Year Canon is being more proactive in returning profits to shareholders, mainly in the form of a dividend, taking into consideration planned future investments, free cash flow, and reflecting the company’s consolidated business performance. Specifically, Canon’s basic policy is to continuously strive to raise its consolidated payout ratio to approximately 30% over the medium to long term. The company recorded a decrease in profits amid extremely severe economic conditions but, prioritizing stable returns to shareholders, plans to distribute a full-year dividend totaling ¥110.00 (U.S.$1.20) per share (interim dividend of ¥55.00 [U.S.$0.60] per share [already distributed], and year-end dividend of ¥55.00 [U.S.$0.60]), the same amount per share as was paid out in 2008.
This document contains forward-looking statements with respect to future results, performance and achievements that are subject to riskand uncertainties and reflect management’s views and assumptions formed by available information. All statements other than statementsof historical fact are statements that could be considered forward-looking statements. When used in this document, words such as“anticipate,” “believe,” “estimate,” “expect,” “intend,” “may,” “plan,” “project” or “should” and similar expressions, as they relate toCanon, are intended to identify forward-looking statements. Many factors could cause the actual results, performance or achievements ofCanon to be materially different from any future results, performance or achievements that may be expressed or implied by suchforward-looking statements, including, among others, changes in general economic and business conditions, changes in currency exchangerates and interest rates, introduction of competing products by other companies, lack of acceptance of new products or services by Canon’stargeted customers, inability to meet efficiency and cost reduction objectives, changes in business strategy and various other factors, bothreferenced and not referenced in this document. A detailed description of these and other risk factors is included in Canon’s annual reporton Form 20-F, which is on file with the United States Securities and Exchange Commission. Should one or more of these risks oruncertainties materialize, or should underlying assumptions prove incorrect, actual results may vary materially from those described herein.Canon does not intend or assume any obligation to update these forward-looking statements.
- 4 -

II. Management Policy (1) Basic Policy
Under the corporate philosophy of kyosei—living and working together for the common good—Canon’s basic management policy is to contribute to the prosperity and well-being of the world while endeavoring to become a truly excellent global corporate group targeting continued growth and development.
(2) Management Goals
Based on this basic management policy, Canon launched two consecutive five-year management plans—Phase I of its Excellent Global Corporation Plan in 1996, and Phase II in 2001— with the aim of becoming a truly excellent global corporation. Through these two management plans, the Company promoted a range of management reforms, thoroughly strengthening its product competitiveness and financial base. Since 2006, under a new five-year management plan—Phase III, which targets further growth and improved corporate value—Canon is pursuing “sound growth,” making use of the solid management foundation achieved through the two preceding plans, and further expanding its corporate scale while maintaining a high level of profitability. In particular, the Company is focusing on the following five important management objectives.
1) Achieving the overwhelming No. 1 position worldwide in all current core businesses
2) Expanding business operations through diversification
3) Identifying new business domains and accumulating required technologies
4) Establishing new production systems to sustain international competitiveness
5) Nurturing truly autonomous and strong individuals promoting everlasting corporate reforms
In 2009, however, due to the global recession triggered by the “Lehman Shock,” Canon was forced to temporarily shift its strategic direction, changing course from a focus on “sound growth” to “improved management quality.” Through such efforts as the promotion of thorough expense and capital-investment efficiencies and the establishment of advanced supply-chain management enabling inventory reductions, the Company made progress in establishing a “muscular” business constitution and enhancing corporate strength to agilely respond to changes in its business environment.
While the global economy currently appears to be on track for a recovery, because it appears that it will take the form of an L-shaped recovery, we expect the surrounding business environment will continue to prove difficult. Faced with these circumstances, Canon will again aim to realize sound growth, capitalizing on the future turnaround to post results that outpace the speed of the economic recovery, employing a new growth strategy in this, the final year of the Company’s Excellent Global Corporation Plan Phase III, which is being viewed as the first year in a new era of growth.
(3) Business Challenges and Countermeasures
At Canon, the creation of new businesses and maintaining a high profitability structure represent two very important management objectives to ensure continuous future growth.
As for new businesses, the Company is promoting research based on leading-edge technologies in its areas of expertise, such as biotechnology, nanotechnology and life sciences. At the same time, Canon is also looking into M&A opportunities and business tie-ups toward launching such businesses. Additionally, the Company aims to enter the display business, moving away from a focus on still images while strengthening the ability to deliver video images, which will play an increasingly important role in the broadband era.
With regard to maintaining the Company’s current high profitability structure, in order to effectively respond to the intensifying price competition centered on the consumer goods market and the investment burden that accompanies the launch of competitive new businesses, Canon believes that it is important to further improve the profit-earning ability of current businesses. To facilitate this, the Company is promoting the development of competitive new products and actively carrying out cost-reduction activities.
Canon also views its approach to the environment as an important management issue. From the product planning stage through to design, development, production, sales, use, recovery and recycling, the Company focuses its energies on such areas as creating environmentally conscious products that realize energy efficiency, resource efficiency, and eliminate the use of hazardous substances. Additionally, Canon actively promotes the development of recycling systems, the expansion of green procurement policies, the disclosure of environmental information, and participation in environmental conservation activities at the community level.
- 5 -
CANON INC. AND SUBSIDIARIESCONSOLIDATED
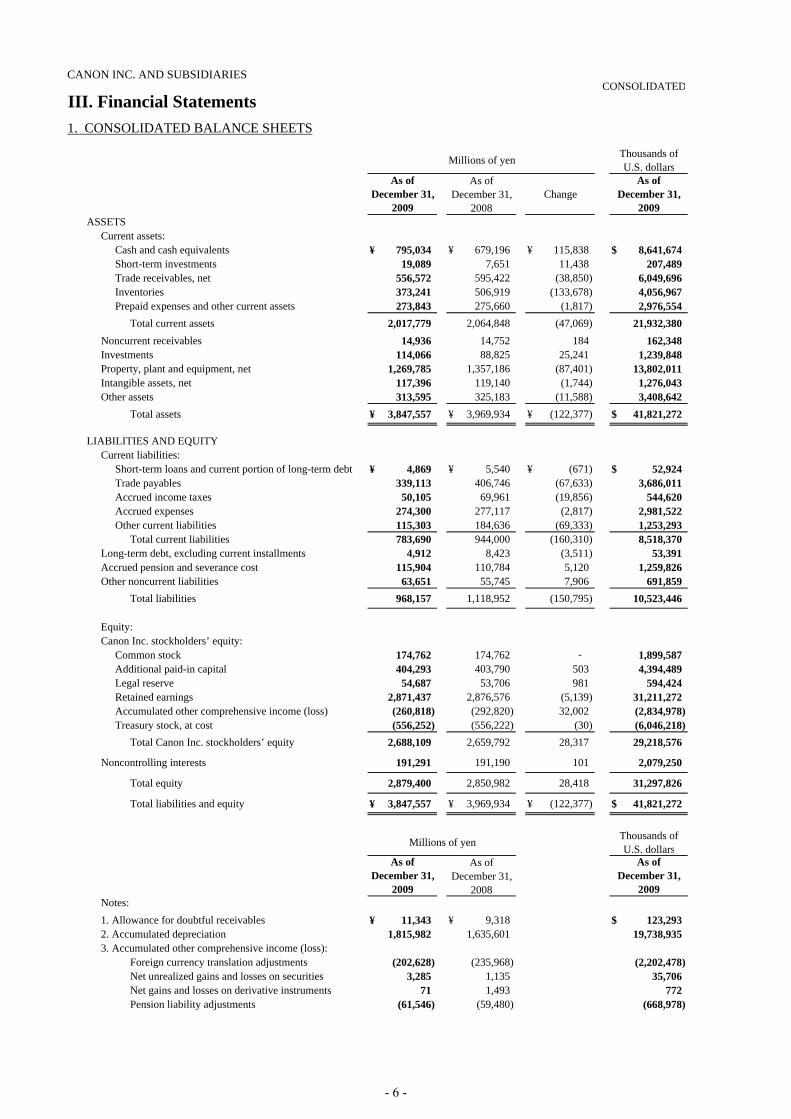
III. Financial Statements1. CONSOLIDATED BALANCE SHEETS
Millions of yen Thousands ofU.S. dollars
As ofDecember 31,
2009
As ofDecember 31,
2008Change
As ofDecember 31,
2009ASSETS
Current assets:Cash and cash equivalents 795,034¥ 679,196¥ 115,838¥ 8,641,674$ Short-term investments 19,089 7,651 11,438 207,489 Trade receivables, net 556,572 595,422 (38,850) 6,049,696 Inventories 373,241 506,919 (133,678) 4,056,967 Prepaid expenses and other current assets 273,843 275,660 (1,817) 2,976,554
Total current assets 2,017,779 2,064,848 (47,069) 21,932,380Noncurrent receivables 14,936 14,752 184 162,348Investments 114,066 88,825 25,241 1,239,848Property, plant and equipment, net 1,269,785 1,357,186 (87,401) 13,802,011Intangible assets, net 117,396 119,140 (1,744) 1,276,043Other assets 313,595 325,183 (11,588) 3,408,642
Total assets 3,847,557¥ 3,969,934¥ (122,377)¥ 41,821,272$
LIABILITIES AND EQUITYCurrent liabilities:
Short-term loans and current portion of long-term debt 4,869¥ 5,540¥ (671)¥ 52,924$ Trade payables 339,113 406,746 (67,633) 3,686,011Accrued income taxes 50,105 69,961 (19,856) 544,620Accrued expenses 274,300 277,117 (2,817) 2,981,522Other current liabilities 115,303 184,636 (69,333) 1,253,293
Total current liabilities 783,690 944,000 (160,310) 8,518,370Long-term debt, excluding current installments 4,912 8,423 (3,511) 53,391Accrued pension and severance cost 115,904 110,784 5,120 1,259,826Other noncurrent liabilities 63,651 55,745 7,906 691,859
Total liabilities 968,157 1,118,952 (150,795) 10,523,446
Equity:Canon Inc. stockholders’ equity:
Common stock 174,762 174,762 - 1,899,587Additional paid-in capital 404,293 403,790 503 4,394,489Legal reserve 54,687 53,706 981 594,424Retained earnings 2,871,437 2,876,576 (5,139) 31,211,272Accumulated other comprehensive income (loss) (260,818) (292,820) 32,002 (2,834,978)Treasury stock, at cost (556,252) (556,222) (30) (6,046,218)
Total Canon Inc. stockholders’ equity 2,688,109 2,659,792 28,317 29,218,576
Noncontrolling interests 191,291 191,190 101 2,079,250
Total equity 2,879,400 2,850,982 28,418 31,297,826
Total liabilities and equity 3,847,557¥ 3,969,934¥ (122,377)¥ 41,821,272$
Millions of yen Thousands ofU.S. dollars
As ofDecember 31,
2009
As ofDecember 31,
2008
As ofDecember 31,
2009Notes:1. Allowance for doubtful receivables 11,343¥ 9,318¥ 123,293$ 2. Accumulated depreciation 1,815,982 1,635,601 19,738,9353. Accumulated other comprehensive income (loss):
Foreign currency translation adjustments (202,628) (235,968) (2,202,478)Net unrealized gains and losses on securities 3,285 1,135 35,706Net gains and losses on derivative instruments 71 1,493 772Pension liability adjustments (61,546) (59,480) (668,978)
- 6 -

CANON INC. AND SUBSIDIARIESCONSOLIDATED
2. CONSOLIDATED STATEMENTS OF INCOME
Results for the fourth quarter Millions of yen Thousands ofU.S. dollars
Three monthsended
December 31, 2009
Three monthsended
December 31, 2008Change(%)
Three monthsended
December 31, 2009Net sales 954,058¥ 994,740¥ - 4.1 10,370,196$ Cost of sales 520,267 573,343 5,655,076
Gross profit 433,791 421,397 + 2.9 4,715,120Operating expenses:
Selling, general and administrative expenses 264,396 273,681 2,873,870Research and development expenses 77,267 111,891 839,859
341,663 385,572 3,713,729Operating profit 92,128 35,825 + 157.2 1,001,391
Other income (deductions):Interest and dividend income 1,441 3,849 15,663Interest expense (95) (164) (1,032)Other, net 4,447 (22,597) 48,337
5,793 (18,912) 62,968Income before income taxes 97,921 16,913 + 479.0 1,064,359
Income taxes 35,413 3,816 384,924Consolidated net income 62,508 13,097 679,435
Less: Net income attributable to noncontrolling interests 944 1,475 10,261Net income attributable to Canon Inc. 61,564¥ 11,622¥ + 429.7 669,174$
Note: Consolidated comprehensive income for the three months ended December 31, 2009 and 2008 was JPY 74,334 million (increase) (U.S.$ 807,978 thousand (increase)) and JPY 204,647 million (decrease), respectively.
Results for the fiscal year Millions of yen Thousands ofU.S. dollars
Year endedDecember 31, 2009
Year endedDecember 31, 2008 Change(%) Year ended
December 31, 2009Net sales 3,209,201¥ 4,094,161¥ - 21.6 34,882,620$ Cost of sales 1,781,808 2,156,153 19,367,479
Gross profit 1,427,393 1,938,008 - 26.3 15,515,141Operating expenses:
Selling, general and administrative expenses 905,738 1,067,909 9,844,978Research and development expenses 304,600 374,025 3,310,870
1,210,338 1,441,934 13,155,848Operating profit 217,055 496,074 - 56.2 2,359,293
Other income (deductions):Interest and dividend income 5,202 19,442 56,543Interest expense (336) (837) (3,652)Other, net (2,566) (33,532) (27,891)
2,300 (14,927) 25,000Income before income taxes 219,355 481,147 - 54.4 2,384,293
Income taxes 84,122 160,788 914,369Consolidated net income 135,233 320,359 1,469,924
Less: Net income attributable to noncontrolling interests 3,586 11,211 38,978Net income attributable to Canon Inc. 131,647¥ 309,148¥ - 57.4 1,430,946$
Note: Consolidated comprehensive income for the year ended December 31, 2009 and 2008 was JPY 168,452 million (increase) (U.S.$ 1,831,000 thousand (increase)) and JPY 18,681 million (decrease), respectively.
- 7 -

CANON INC. AND SUBSIDIARIESCONSOLIDATED
3. DETAILS OF SALES
Results for the fourth quarter Millions of yen Thousands ofU.S. dollars
Sales by productThree months
endedDecember 31, 2009
Three monthsended
December 31, 2008Change(%)
Three monthsended
December 31, 2009Office 465,131 507,955 - 8.4 5,055,772Consumer 412,729 376,588 + 9.6 4,486,185Industry and Others 117,070 137,681 - 15.0 1,272,500Eliminations (40,872) (27,484) - (444,261)
Total 954,058¥ 994,740¥ - 4.1 10,370,196$
Millions of yen Thousands ofU.S. dollars
Sales by regionThree months
endedDecember 31, 2009
Three monthsended
December 31, 2008Change(%)
Three monthsended
December 31, 2009Japan 197,599¥ 224,710¥ - 12.1 2,147,815$ Overseas:
Americas 274,782 283,002 - 2.9 2,986,761Europe 308,523 308,121 + 0.1 3,353,511Other areas 173,154 178,907 - 3.2 1,882,109
756,459 770,030 - 1.8 8,222,381Total 954,058¥ 994,740¥ - 4.1 10,370,196$
Results for the fiscal year Millions of yen Thousands ofU.S. dollars
Sales by product Year endedDecember 31, 2009
Year endedDecember 31, 2008 Change(%) Year ended
December 31, 2009Office 1,645,076 2,246,609 - 26.8 17,881,261Consumer 1,301,160 1,456,075 - 10.6 14,143,043Industry and Others 357,998 522,405 - 31.5 3,891,283Eliminations (95,033) (130,928) - (1,032,967)
Total 3,209,201¥ 4,094,161¥ - 21.6 34,882,620$
Thousands ofU.S. dollars
Sales by region Year endedDecember 31, 2009
Year endedDecember 31, 2008 Change(%) Year ended
December 31, 2009Japan 702,344¥ 868,280¥ - 19.1 7,634,174$ Overseas:
Americas 894,154 1,154,571 - 22.6 9,719,065Europe 995,150 1,341,400 - 25.8 10,816,848Other areas 617,553 729,910 - 15.4 6,712,533
2,506,857 3,225,881 - 22.3 27,248,446Total 3,209,201¥ 4,094,161¥ - 21.6 34,882,620$
Notes: 1. The primary products included in each of the product segments are as follows: Office : Office network digital multifunction devices (MFDs) / Color network digital MFDs /
Office copying machines / Personal-use copying machines / Full-color copying machines / Laser printers / Large format inkjet printers
Consumer : Digital SLR cameras / Compact digital cameras / Interchangeable lenses / Digital video camcorders / Inkjet multifunction peripherals / Single function inkjet printers / Image scanners / Broadcasting equipment
Industry and Others : Semiconductor production equipment / Mirror projection mask aligners for LCD panels / Medical equipment / Components /Computer information systems / Document scanners /
Personal information products
2. The principal countries and regions included in each regional category are as follows: Americas: United States of America, Canada, Latin America / Europe: England, Germany, France, Netherlands / Other Areas: Asian regions, China, Oceania
Millions of yen
- 8 -
CANON INC. AND SUBSIDIARIESCONSOLIDATED
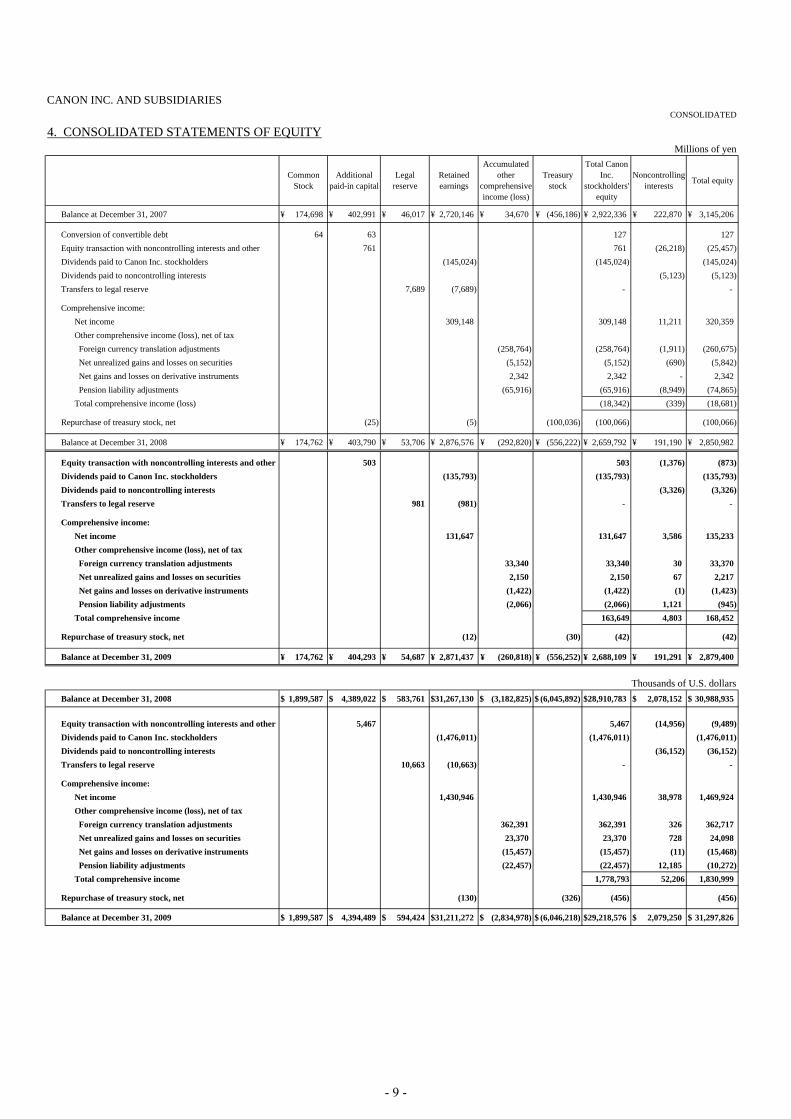
4. CONSOLIDATED STATEMENTS OF EQUITYMillions of yen
Balance at December 31, 2007 174,698¥ 402,991¥ 46,017¥ 2,720,146¥ 34,670¥ (456,186)¥ 2,922,336¥ 222,870¥ 3,145,206¥
Conversion of convertible debt 64 63 127 127Equity transaction with noncontrolling interests and other 761 761 (26,218) (25,457)Dividends paid to Canon Inc. stockholders (145,024) (145,024) (145,024)Dividends paid to noncontrolling interests (5,123) (5,123)Transfers to legal reserve 7,689 (7,689) - -
Comprehensive income:Net income 309,148 309,148 11,211 320,359Other comprehensive income (loss), net of tax Foreign currency translation adjustments (258,764) (258,764) (1,911) (260,675) Net unrealized gains and losses on securities (5,152) (5,152) (690) (5,842) Net gains and losses on derivative instruments 2,342 2,342 - 2,342 Pension liability adjustments (65,916) (65,916) (8,949) (74,865)Total comprehensive income (loss) (18,342) (339) (18,681)
Repurchase of treasury stock, net (25) (5) (100,036) (100,066) (100,066)
Balance at December 31, 2008 174,762¥ 403,790¥ 53,706¥ 2,876,576¥ (292,820)¥ (556,222)¥ 2,659,792¥ 191,190¥ 2,850,982¥
Equity transaction with noncontrolling interests and other 503 503 (1,376) (873)Dividends paid to Canon Inc. stockholders (135,793) (135,793) (135,793)Dividends paid to noncontrolling interests (3,326) (3,326)Transfers to legal reserve 981 (981) - -
Comprehensive income:Net income 131,647 131,647 3,586 135,233Other comprehensive income (loss), net of tax Foreign currency translation adjustments 33,340 33,340 30 33,370 Net unrealized gains and losses on securities 2,150 2,150 67 2,217 Net gains and losses on derivative instruments (1,422) (1,422) (1) (1,423) Pension liability adjustments (2,066) (2,066) 1,121 (945)Total comprehensive income 163,649 4,803 168,452
Repurchase of treasury stock, net (12) (30) (42) (42)
Balance at December 31, 2009 174,762¥ 404,293¥ 54,687¥ 2,871,437¥ (260,818)¥ (556,252)¥ 2,688,109¥ 191,291¥ 2,879,400¥
Thousands of U.S. dollarsBalance at December 31, 2008 1,899,587$ 4,389,022$ 583,761$ 31,267,130$ (3,182,825)$ (6,045,892)$ 28,910,783$ 2,078,152$ 30,988,935$
Equity transaction with noncontrolling interests and other 5,467 5,467 (14,956) (9,489)Dividends paid to Canon Inc. stockholders (1,476,011) (1,476,011) (1,476,011)Dividends paid to noncontrolling interests (36,152) (36,152)Transfers to legal reserve 10,663 (10,663) - -
Comprehensive income:Net income 1,430,946 1,430,946 38,978 1,469,924Other comprehensive income (loss), net of tax Foreign currency translation adjustments 362,391 362,391 326 362,717 Net unrealized gains and losses on securities 23,370 23,370 728 24,098 Net gains and losses on derivative instruments (15,457) (15,457) (11) (15,468) Pension liability adjustments (22,457) (22,457) 12,185 (10,272)Total comprehensive income 1,778,793 52,206 1,830,999
Repurchase of treasury stock, net (130) (326) (456) (456)
Balance at December 31, 2009 1,899,587$ 4,394,489$ 594,424$ 31,211,272$ (2,834,978)$ (6,046,218)$ 29,218,576$ 2,079,250$ 31,297,826$
Total equityCommonStock
Additionalpaid-in capital
Total CanonInc.
stockholders'equity
Noncontrollinginterests
Legalreserve
Retainedearnings
Accumulatedother
comprehensiveincome (loss)
Treasurystock
- 9 -
CANON INC. AND SUBSIDIARIESCONSOLIDATED
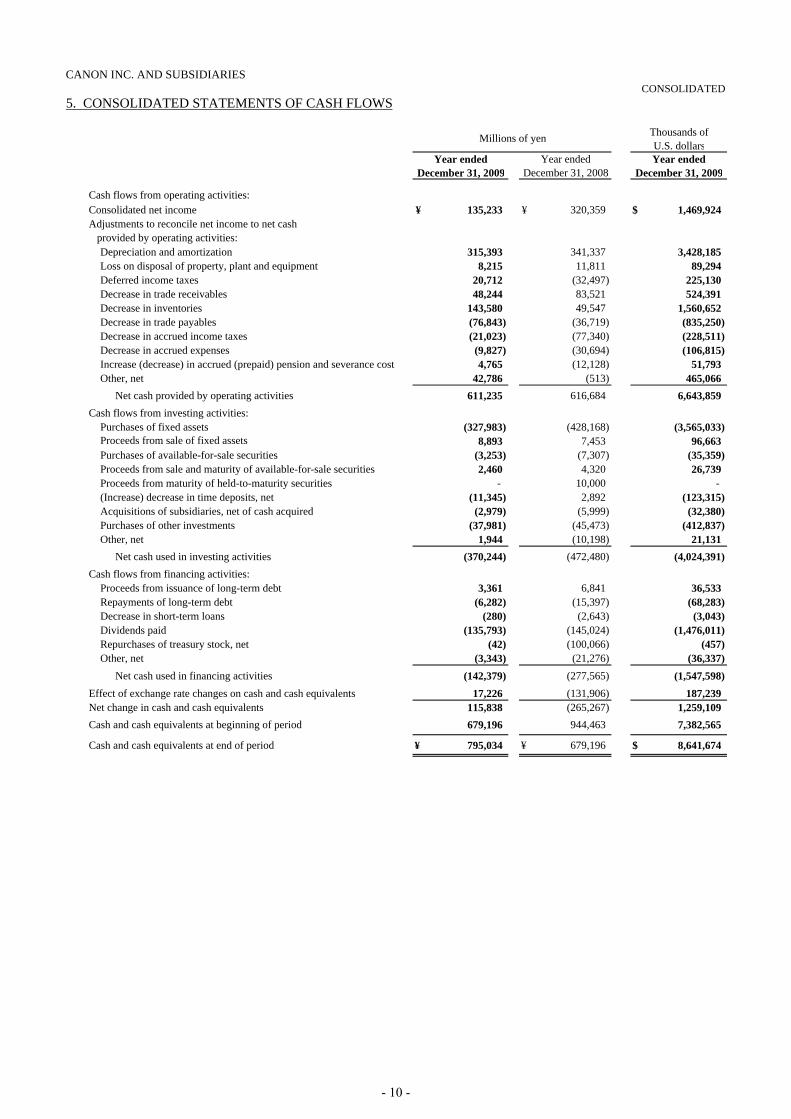
5. CONSOLIDATED STATEMENTS OF CASH FLOWS
Thousands ofU.S. dollars
Year endedDecember 31, 2009
Year endedDecember 31, 2008
Year endedDecember 31, 2009
Cash flows from operating activities:Consolidated net income 135,233¥ 320,359¥ 1,469,924$ Adjustments to reconcile net income to net cash provided by operating activities:
Depreciation and amortization 315,393 341,337 3,428,185Loss on disposal of property, plant and equipment 8,215 11,811 89,294Deferred income taxes 20,712 (32,497) 225,130Decrease in trade receivables 48,244 83,521 524,391Decrease in inventories 143,580 49,547 1,560,652Decrease in trade payables (76,843) (36,719) (835,250)Decrease in accrued income taxes (21,023) (77,340) (228,511)Decrease in accrued expenses (9,827) (30,694) (106,815)Increase (decrease) in accrued (prepaid) pension and severance cost 4,765 (12,128) 51,793Other, net 42,786 (513) 465,066
Net cash provided by operating activities 611,235 616,684 6,643,859Cash flows from investing activities:
Purchases of fixed assets (327,983) (428,168) (3,565,033)Proceeds from sale of fixed assets 8,893 7,453 96,663Purchases of available-for-sale securities (3,253) (7,307) (35,359)Proceeds from sale and maturity of available-for-sale securities 2,460 4,320 26,739Proceeds from maturity of held-to-maturity securities - 10,000 - (Increase) decrease in time deposits, net (11,345) 2,892 (123,315)Acquisitions of subsidiaries, net of cash acquired (2,979) (5,999) (32,380)Purchases of other investments (37,981) (45,473) (412,837)Other, net 1,944 (10,198) 21,131
Net cash used in investing activities (370,244) (472,480) (4,024,391)Cash flows from financing activities:
Proceeds from issuance of long-term debt 3,361 6,841 36,533Repayments of long-term debt (6,282) (15,397) (68,283)Decrease in short-term loans (280) (2,643) (3,043)Dividends paid (135,793) (145,024) (1,476,011)Repurchases of treasury stock, net (42) (100,066) (457)Other, net (3,343) (21,276) (36,337)
Net cash used in financing activities (142,379) (277,565) (1,547,598)Effect of exchange rate changes on cash and cash equivalents 17,226 (131,906) 187,239Net change in cash and cash equivalents 115,838 (265,267) 1,259,109Cash and cash equivalents at beginning of period 679,196 944,463 7,382,565
Cash and cash equivalents at end of period 795,034¥ 679,196¥ 8,641,674$
Millions of yen
- 10 -

CANON INC. AND SUBSIDIARIESCONSOLIDATED
6. NOTE FOR GOING CONCERN ASSUMPTION
Not applicable.
7. SEGMENT INFORMATION
(1) SEGMENT INFORMATION BY PRODUCT
Results for the fourth quarter Millions of yen Thousands ofU.S. dollars
Three monthsended
December 31, 2009
Three monthsended
December 31, 2008Change(%)
Three monthsended
December 31, 2009OfficeNet sales:
External customers 462,149¥ 502,389¥ - 8.0 5,023,359$ Intersegment 2,982 5,566 - 46.4 32,413
Total 465,131 507,955 - 8.4 5,055,772Operating cost and expenses 384,517 423,226 - 9.1 4,179,533Operating profit 80,614¥ 84,729¥ - 4.9 876,239$
ConsumerNet sales:
External customers 412,087¥ 375,941¥ + 9.6 4,479,207$ Intersegment 642 647 - 0.8 6,978
Total 412,729 376,588 + 9.6 4,486,185Operating cost and expenses 337,586 335,715 + 0.6 3,669,413Operating profit 75,143¥ 40,873¥ + 83.8 816,772$
Industry and OthersNet sales:
External customers 79,822¥ 116,410¥ - 31.4 867,630$ Intersegment 37,248 21,271 + 75.1 404,870
Total 117,070 137,681 - 15.0 1,272,500Operating cost and expenses 152,030 189,957 - 20.0 1,652,500Operating profit (loss) (34,960)¥ (52,276)¥ - (380,000)$
Corporate and EliminationsNet sales:
External customers - ¥ - ¥ - - $ Intersegment (40,872) (27,484) - (444,261)
Total (40,872) (27,484) - (444,261)Operating cost and expenses (12,203) 10,017 - (132,641)Operating profit (loss) (28,669)¥ (37,501)¥ - (311,620)$
ConsolidatedNet sales:
External customers 954,058¥ 994,740¥ - 4.1 10,370,196$ Intersegment - - - -
Total 954,058 994,740 - 4.1 10,370,196Operating cost and expenses 861,930 958,915 - 10.1 9,368,805Operating profit 92,128¥ 35,825¥ + 157.2 1,001,391$
- 11 -

CANON INC. AND SUBSIDIARIESCONSOLIDATED
Results for the fiscal year Millions of yen Thousands ofU.S. dollars
Year endedDecember 31, 2009
Year endedDecember 31, 2008 Change(%) Year ended
December 31, 2009
OfficeNet sales:
External customers 1,635,056¥ 2,223,253¥ - 26.5 17,772,348$ Intersegment 10,020 23,356 - 57.1 108,913
Total 1,645,076 2,246,609 - 26.8 17,881,261Operating cost and expenses 1,415,680 1,789,263 - 20.9 15,387,826Operating profit 229,396 457,346 - 49.8 2,493,435Total assets 745,646 822,660 - 9.4 8,104,848Depreciation and amortization 90,878 99,962 - 9.1 987,804Capital Expenditures 96,718¥ 139,046¥ - 30.4 1,051,283$
ConsumerNet sales:
External customers 1,299,194¥ 1,453,647¥ - 10.6 14,121,674$ Intersegment 1,966 2,428 - 19.0 21,369
Total 1,301,160 1,456,075 - 10.6 14,143,043Operating cost and expenses 1,117,668 1,232,951 - 9.4 12,148,565Operating profit 183,492 223,124 - 17.8 1,994,478Total assets 437,160 502,927 - 13.1 4,751,739Depreciation and amortization 48,701 58,082 - 16.2 529,359Capital Expenditures 27,503¥ 52,641¥ - 47.8 298,946$
Industry and OthersNet sales:
External customers 274,951¥ 417,261¥ - 34.1 2,988,598$ Intersegment 83,047 105,144 - 21.0 902,685
Total 357,998 522,405 - 31.5 3,891,283Operating cost and expenses 433,954 570,281 - 23.9 4,716,892Operating profit (loss) (75,956) (47,876) - (825,609)Total assets 359,635 453,581 - 20.7 3,909,076Depreciation and amortization 60,770 71,557 - 15.1 660,543Capital Expenditures 25,644¥ 31,445¥ - 18.4 278,739$
Corporate and EliminationsNet sales:
External customers - ¥ - ¥ - - $ Intersegment (95,033) (130,928) - (1,032,967)
Total (95,033) (130,928) - (1,032,967)Operating cost and expenses 24,844 5,592 - 270,044Operating profit (loss) (119,877) (136,520) - (1,303,011)Total assets 2,305,116 2,190,766 + 5.2 25,055,609Depreciation and amortization 115,044 111,736 + 3.0 1,250,479Capital Expenditures 108,387¥ 180,268¥ - 39.9 1,178,119$
ConsolidatedNet sales:
External customers 3,209,201¥ 4,094,161¥ - 21.6 34,882,620$ Intersegment - - - -
Total 3,209,201 4,094,161 - 21.6 34,882,620Operating cost and expenses 2,992,146 3,598,087 - 16.8 32,523,327Operating profit 217,055 496,074 - 56.2 2,359,293Total assets 3,847,557 3,969,934 - 3.1 41,821,272Depreciation and amortization 315,393 341,337 - 7.6 3,428,185Capital Expenditures 258,252¥ 403,400¥ - 36.0 2,807,087$
- 12 -

CANON INC. AND SUBSIDIARIESCONSOLIDATED
(2) SEGMENT INFORMATION BY GEOGRAPHIC AREA
Results for the fourth quarter Millions of yen Thousands ofU.S. dollars
Three monthsended
December 31, 2009
Three monthsended
December 31, 2008Change(%)
Three monthsended
December 31, 2009JapanNet sales:
External customers 227,939¥ 270,681¥ - 15.8 2,477,598$ Intersegment 539,255 492,810 + 9.4 5,861,467
Total 767,194 763,491 + 0.5 8,339,065Operating cost and expenses 667,146 759,005 - 12.1 7,251,587Operating profit 100,048¥ 4,486¥ + 2,130.2 1,087,478$
Americas Net sales:
External customers 268,797¥ 276,764¥ - 2.9 2,921,707$ Intersegment 392 895 - 56.2 4,260
Total 269,189 277,659 - 3.1 2,925,967Operating cost and expenses 263,571 279,180 - 5.6 2,864,902Operating profit (loss) 5,618¥ (1,521)¥ - 61,065$
EuropeNet sales:
External customers 306,949¥ 305,330¥ + 0.5 3,336,402$ Intersegment (1,313) 826 - (14,272)
Total 305,636 306,156 - 0.2 3,322,130Operating cost and expenses 298,750 297,897 + 0.3 3,247,282Operating profit 6,886¥ 8,259¥ - 16.6 74,848$
OthersNet sales:
External customers 150,373¥ 141,965¥ + 5.9 1,634,489$ Intersegment 165,586 137,565 + 20.4 1,799,848
Total 315,959 279,530 + 13.0 3,434,337Operating cost and expenses 309,860 279,329 + 10.9 3,368,044Operating profit 6,099¥ 201¥ + 2,934.3 66,293$
Corporate and Eliminations Net sales:
External customers - ¥ - ¥ - - $ Intersegment (703,920) (632,096) - (7,651,303)
Total (703,920) (632,096) - (7,651,303)Operating cost and expenses (677,397) (656,496) - (7,363,010)Operating profit (loss) (26,523)¥ 24,400¥ - (288,293)$
ConsolidatedNet sales:
External customers 954,058¥ 994,740¥ - 4.1 10,370,196$ Intersegment - - - -
Total 954,058 994,740 - 4.1 10,370,196Operating cost and expenses 861,930 958,915 - 10.1 9,368,805Operating profit 92,128¥ 35,825¥ + 157.2 1,001,391$
- 13 -

CANON INC. AND SUBSIDIARIESCONSOLIDATED
Results for the fiscal year Millions of yen Thousands ofU.S. dollars
Year endedDecember 31, 2009
Year endedDecember 31, 2008 Change(%) Year ended
December 31, 2009
JapanNet sales:
External customers 827,762¥ 998,676¥ - 17.1 8,997,413$ Intersegment 1,714,375 2,318,521 - 26.1 18,634,511
Total 2,542,137 3,317,197 - 23.4 27,631,924Operating cost and expenses 2,288,471 2,812,645 - 18.6 24,874,685Operating profit 253,666 504,552 - 49.7 2,757,239Total assets 1,386,511¥ 1,607,653¥ - 13.8 15,070,772$
AmericasNet sales:
External customers 871,633¥ 1,141,560¥ - 23.6 9,474,272$ Intersegment 1,263 3,758 - 66.4 13,728
Total 872,896 1,145,318 - 23.8 9,488,000Operating cost and expenses 860,863 1,136,288 - 24.2 9,357,207Operating profit 12,033 9,030 + 33.3 130,793Total assets 198,094¥ 203,255¥ - 2.5 2,153,196$
EuropeNet sales:
External customers 991,336¥ 1,337,147¥ - 25.9 10,775,391$ Intersegment 919 4,329 - 78.8 9,989
Total 992,255 1,341,476 - 26.0 10,785,380Operating cost and expenses 964,606 1,314,942 - 26.6 10,484,847Operating profit 27,649 26,534 + 4.2 300,533Total assets 378,477¥ 417,562¥ - 9.4 4,113,880$
OthersNet sales:
External customers 518,470¥ 616,778¥ - 15.9 5,635,544$ Intersegment 534,147 670,678 - 20.4 5,805,945
Total 1,052,617 1,287,456 - 18.2 11,441,489Operating cost and expenses 1,019,208 1,247,156 - 18.3 11,078,348Operating profit 33,409 40,300 - 17.1 363,141Total assets 384,795¥ 344,638¥ + 11.7 4,182,554$
Corporate and EliminationsNet sales:
External customers - ¥ - ¥ - - $ Intersegment (2,250,704) (2,997,286) - (24,464,173)
Total (2,250,704) (2,997,286) - (24,464,173)Operating cost and expenses (2,141,002) (2,912,944) - (23,271,760)Operating profit (loss) (109,702) (84,342) - (1,192,413)Total assets 1,499,680¥ 1,396,826¥ + 7.4 16,300,870$
ConsolidatedNet sales:
External customers 3,209,201¥ 4,094,161¥ - 21.6 34,882,620$ Intersegment - - - -
Total 3,209,201 4,094,161 - 21.6 34,882,620Operating cost and expenses 2,992,146 3,598,087 - 16.8 32,523,327Operating profit 217,055 496,074 - 56.2 2,359,293Total assets 3,847,557¥ 3,969,934¥ - 3.1 41,821,272$
- 14 -

CANON INC. AND SUBSIDIARIESCONSOLIDATED
8. BASIS OF PRESENTATION AND SIGNIFICANT ACCOUNTING POLICIES
(1) GROUP POSITION1. Number of Group Companies
December 31, 2009 December 31, 2008 ChangeSubsidiaries 241 245 (4)Affiliates 15 18 (3)Total 256 263 (7)
2. Change in Group Entities
Subsidiaries Addition: 12 companies Removal: 16 companies
Affiliates (Carried at Equity Basis) Addition: 2 companies Removal: 5 companies
3. Subsidiaries Listed on Domestic Stock Exchange
Tokyo Stock Exchange (1st section): Canon Marketing Japan Inc., Canon Electronics Inc., Canon Finetech Inc. Tokyo Stock Exchange (2nd section): Canon Software Inc. Osaka Securities Exchange (2nd section): Canon Machinery Inc. JASDAQ: Tokki Corporation, Asia Pacific System Research Co., Ltd. Osaka Securities Exchange (Hercules): e-System Corporation
(2) SIGNIFICANT ACCOUNTING POLICIES
Recently Issued Accounting Guidance
or adjusted to conform to this guidance.
Canon adopted new guidance for noncontrolling interests in consolidated financial statements in the first quarter
has been adjusted to conform to this guidance under U.S. GAAP.
While previous segment information has been presented in accordance with accounting guidance generally accepted
("U.S. GAAP") in the fiscal year beginning January 1, 2009. Accordingly, prior year segment informationin Japan, Canon adopted the guidance for segment reporting under U.S. generally accepted accounting principles
in the consolidated financial statements including the consolidated statements of cash flows have been reclassified
referred to as minority interests and classified between total liabilities and stockholders' equity on the consolidated
These financial statement presentation requirements have been adopted retrospectively and prior year amounts
beginning January 1, 2009. Upon the adoption of this guidance, noncontrolling interests, which were previously
balance sheets, are now included as a separate component of total equity. In addition, consolidated net incomeon the consolidated statements of income now includes the net income (loss) attributable to noncontrolling interests.
- 15 -

CANON INC. AND SUBSIDIARIESCONSOLIDATED
9. NOTES TO CONSOLIDATED FINANCIAL STATEMENTS
(1) NET INCOME ATTRIBUTABLE TO CANON INC. STOCKHOLDERS PER SHARE
Results for the fiscal year Millions of yen Thousands ofU.S. dollars
Year ended
December 31,2009
Year endedDecember 31,
2008
Year endedDecember 31,
2009
Net income attributable to Canon Inc. -Basic 131,647¥ 309,148¥ 1,430,946$
-Diluted 131,647 309,150 1,430,946
Number of sharesAverage common shares outstanding -Basic 1,234,481,836 1,255,626,490
-Diluted 1,234,481,836 1,255,706,419
Yen U.S. dollarsNet income attributable toCanon Inc. stockholders per share: -Basic 106.64¥ 246.21¥ 1.16$
-Diluted 106.64 246.20 1.16
(2) FINANCE RECEIVABLES AND OPERATING LEASES, ACQUISITIONS, MARKETABLE SECURITIES, DEFERRED TAX ACCOUNTING, EMPLOYEE RETIREMENT AND SEVERANCE BENEFITS, STOCK OPTIONS, DERIVATIVE CONTRACTS AND OTHERS
The disclosure is omitted as it is not considered significant in this report.
(3) SUBSEQUENT EVENTThere is no significant subsequent event.
- 16 -

CANON INC.NON-CONSOLIDATED
10. NON-CONSOLIDATED BALANCE SHEETS( Parent company only )
As of As ofDecember 31, December 31,
2009 2008ASSETS
Current assets:Cash 6,855¥ 10,674¥ (3,819)¥ Trade receivables 649,594 608,047 41,547Marketable securities 92,740 93,899 (1,159)Inventories 147,938 221,668 (73,730)Prepaid expenses and other current assets 215,657 204,645 11,012Allowance for doubtful receivables (1) (1) -
Total current assets 1,112,783 1,138,932 (26,149)Fixed assets:
Net property, plant and equipment 862,901 929,217 (66,316)Intangibles 32,444 40,431 (7,987)Investments and other fixed assets 543,027 510,476 32,551Allowance for doubtful receivables-noncurrent (55) (58) 3
Total fixed assets 1,438,317 1,480,066 (41,749)
Total assets 2,551,100¥ 2,618,998¥ (67,898)¥
LIABILITIES AND NET ASSETSCurrent liabilities:
Trade payables 332,219¥ 323,980¥ 8,239¥ Short-term loans 226,749 156,148 70,601Accrued income taxes 27,639 47,825 (20,186)Accrued warranty expenses 3,043 6,077 (3,034)Accrued bonuses for employees 4,129 4,972 (843)Accrued bonuses for directors 127 244 (117)Other current liabilities 105,774 176,255 (70,481)
Total current liabilities 699,680 715,501 (15,821)Noncurrent liabilities:
Accrued pension and severance cost 34,524 34,456 68Accrued directors' retirement benefits 1,786 1,576 210Reserve for environmental provision 1,170 1,300 (130)Accrued long service rewards for employees 1,176 1,160 16Other noncurrent liabilities 46 - 46
Total noncurrent liabilities 38,702 38,492 210
Total liabilities 738,382 753,993 (15,611)Net assets:
Stockholders' equity 1,810,900 1,865,955 (55,055)Valuation and translation adjustments 1,008 (1,196) 2,204Subscription right to shares 810 246 564
Total net assets 1,812,718 1,865,005 (52,287)
Total liabilities and net assets 2,551,100¥ 2,618,998¥ (67,898)¥
Notes: As of As ofDecember 31, December 31,
2009 20081.Accumulated depreciation 1,122,921¥ 988,205¥ Accumulated impairment loss 21,606¥ 10,197¥ 2.Cautionary obligation and other Cautionary obligation contract 16,256¥ 19,323¥ 3.Issuance of new stock - ¥
(Those capitalized) - ¥ 64¥ Those due to conversion of convertible debentures - ¥ 127¥
(Those capitalized) - ¥ 64¥ 4.Number of stock newly issued (Thousand shares) - 127
Those due to conversion of convertible debentures (Thousand shares) - 127
Millions of yen
Change
127¥
- 17 -
CANON INC.NON-CONSOLIDATED
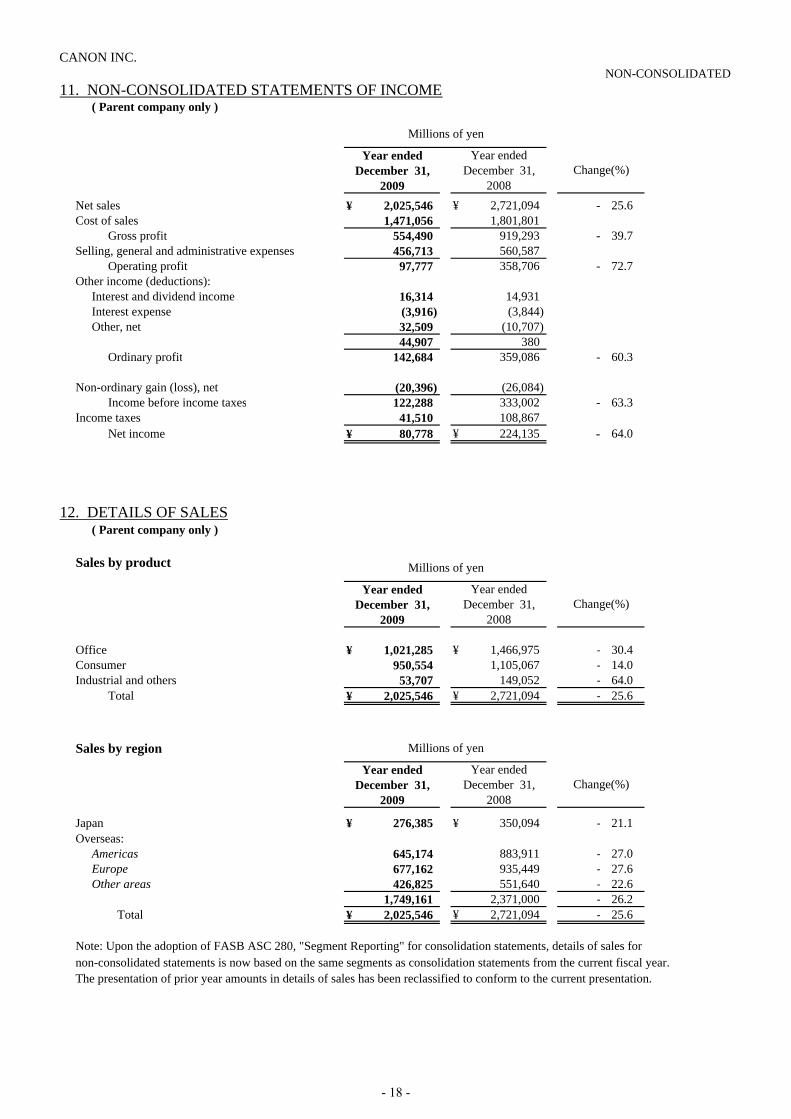
11. NON-CONSOLIDATED STATEMENTS OF INCOME( Parent company only )
Millions of yen
Year ended Year endedDecember 31, December 31,
2009 2008Net sales 2,025,546¥ 2,721,094¥ - 25.6 Cost of sales 1,471,056 1,801,801
Gross profit 554,490 919,293 - 39.7 Selling, general and administrative expenses 456,713 560,587
Operating profit 97,777 358,706 - 72.7 Other income (deductions):
Interest and dividend income 16,314 14,931Interest expense (3,916) (3,844)Other, net 32,509 (10,707)
44,907 380Ordinary profit 142,684 359,086 - 60.3
Non-ordinary gain (loss), net (20,396) (26,084)Income before income taxes 122,288 333,002 - 63.3
Income taxes 41,510 108,867Net income 80,778¥ 224,135¥ - 64.0
12. DETAILS OF SALES( Parent company only )
Sales by product Millions of yen
Year ended Year endedDecember 31, December 31,
2009 2008
Office 1,021,285¥ 1,466,975¥ - 30.4 Consumer 950,554 1,105,067 - 14.0 Industrial and others 53,707 149,052 - 64.0
Total 2,025,546¥ 2,721,094¥ - 25.6
Sales by region Millions of yen
Year ended Year endedDecember 31, December 31,
2009 2008
Japan 276,385¥ 350,094¥ - 21.1 Overseas:
Americas 645,174 883,911 - 27.0 Europe 677,162 935,449 - 27.6 Other areas 426,825 551,640 - 22.6
1,749,161 2,371,000 - 26.2 Total 2,025,546¥ 2,721,094¥ - 25.6
Note: Upon the adoption of FASB ASC 280, "Segment Reporting" for consolidation statements, details of sales for non-consolidated statements is now based on the same segments as consolidation statements from the current fiscal year. The presentation of prior year amounts in details of sales has been reclassified to conform to the current presentation.
Change(%)
Change(%)
Change(%)
- 18 -
CANON INC.NON-CONSOLIDATED
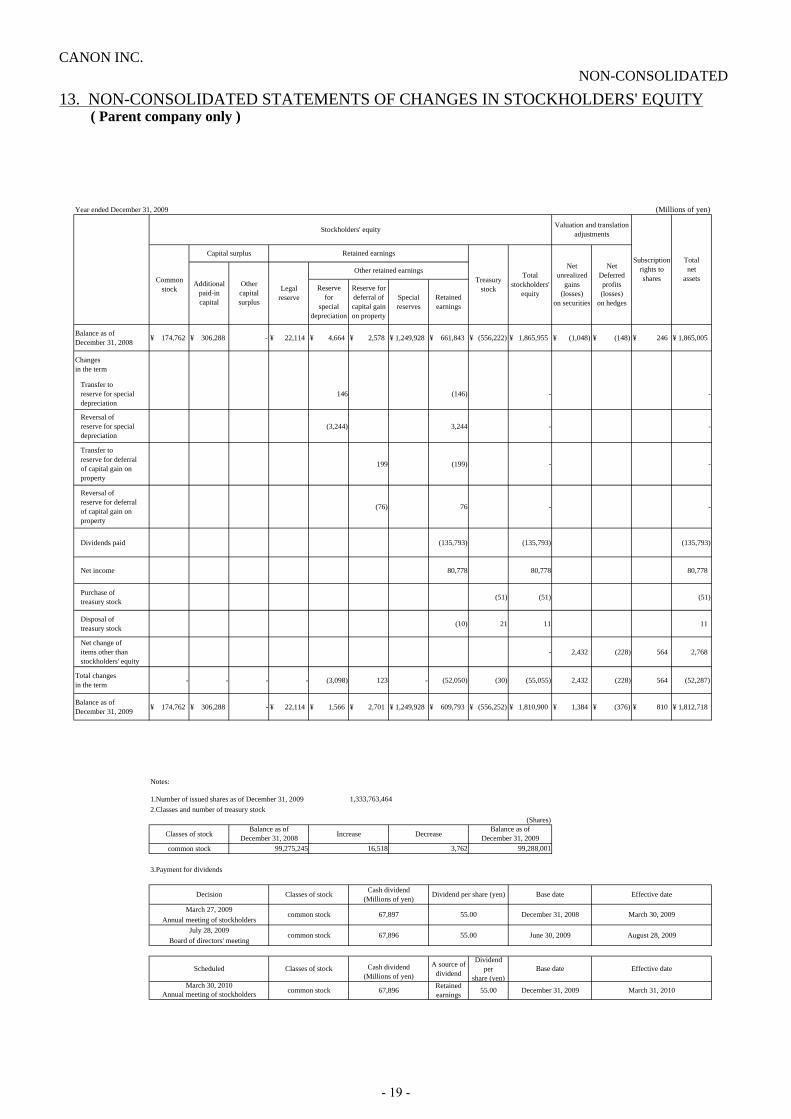
13. NON-CONSOLIDATED STATEMENTS OF CHANGES IN STOCKHOLDERS' EQUITY ( Parent company only )
Year ended December 31, 2009 (Millions of yen)
Reservefor
specialdepreciation
Reserve fordeferral ofcapital gainon property
Specialreserves
Retainedearnings
Balance as ofDecember 31, 2008 174,762¥ 306,288¥ - 22,114¥ 4,664¥ 2,578¥ 1,249,928¥ 661,843¥ (556,222)¥ 1,865,955¥ (1,048)¥ (148)¥ 246¥ 1,865,005¥
Changesin the term
Transfer to reserve for special depreciation
146 (146) - -
Reversal of reserve for special depreciation
(3,244) 3,244 - -
Transfer to reserve for deferral of capital gain on property
199 (199) - -
Reversal of reserve for deferral of capital gain on property
(76) 76 - -
Dividends paid (135,793) (135,793) (135,793)
Net income 80,778 80,778 80,778
Purchase of treasury stock (51) (51) (51)
Disposal of treasury stock (10) 21 11 11
Net change of items other than stockholders' equity
- 2,432 (228) 564 2,768
Total changesin the term - - - - (3,098) 123 - (52,050) (30) (55,055) 2,432 (228) 564 (52,287)
Balance as ofDecember 31, 2009 174,762¥ 306,288¥ - 22,114¥ 1,566¥ 2,701¥ 1,249,928¥ 609,793¥ (556,252)¥ 1,810,900¥ 1,384¥ (376)¥ 810¥ 1,812,718¥
Notes:
(Shares)
A source ofdividend
Dividendper
share (yen)Scheduled Classes of stock Cash dividend
(Millions of yen)Base date
August 28, 2009Board of directors' meeting
March 27, 2009
common stockJuly 28, 2009
67,896 55.00 June 30, 2009
common stock
1,333,763,464
March 30, 2009Annual meeting of stockholders
Dividend per share (yen) Base date
67,897 55.00 December 31, 2008
Effective dateClasses of stock
Balance as ofDecember 31, 2009
common stock 99,275,245 99,288,001
Increase
16,518
Decrease
3,762
3.Payment for dividends
Decision Cash dividend(Millions of yen)
2.Classes and number of treasury stock
Classes of stockBalance as of
December 31, 2008
1.Number of issued shares as of December 31, 2009
Totalnet
assets
Retained earningsCapital surplus
Other retained earnings
Valuation and translationadjustmentsStockholders' equity
Subscriptionrights toshares
Effective date
Netunrealized
gains(losses)
on securities
Othercapitalsurplus
Legalreserve
Treasurystock
Commonstock
Totalstockholders'
equityAdditional
paid-incapital
NetDeferredprofits(losses)
on hedges
March 31, 2010March 30, 2010
common stock 67,896 Retainedearnings 55.00 December 31, 2009Annual meeting of stockholders
- 19 -

CANON INC.NON-CONSOLIDATED
Year ended December 31, 2008
Reservefor
specialdepreciation
Reserve fordeferral ofcapital gainon property
Specialreserves
Retainedearnings
Balance as ofDecember 31, 2007 174,698¥ 306,225¥ 25¥ 22,114¥ 7,694¥ 1,255¥ 1,249,928¥ 581,031¥ (456,186)¥ 1,886,784¥ 5,028¥ (1,246)¥ - 1,890,566¥
Changesin the term
Conversion of convertible debentures 64 63 127 127
Transfer to reserve for special depreciation
632 (632) - -
Reversal of reserve for special depreciation
(3,662) 3,662 - -
Transfer to reserve for deferral of capital gain on property
1,396 (1,396) - -
Reversal of reserve for deferral of capital gain on property
(73) 73 - -
Dividends paid (145,024) (145,024) (145,024)
Net income 224,135 224,135 224,135
Purchase of treasury stock (100,122) (100,122) (100,122)
Disposal of treasury stock (25) (5) 86 56 56
Net change of items other than stockholders' equity
- (6,076) 1,098 246 (4,732)
Total changesin the term 64 63 (25) - (3,030) 1,323 - 80,812 (100,036) (20,829) (6,076) 1,098 246 (25,561)
Balance as ofDecember 31, 2008 174,762¥ 306,288¥ - 22,114¥ 4,664¥ 2,578¥ 1,249,928¥ 661,843¥ (556,222)¥ 1,865,955¥ (1,048)¥ (148)¥ 246¥ 1,865,005¥
Notes:
(Shares)
(Millions of yen)
August 26, 2008Board of directors' meeting
March 28, 2008Annual meeting of stockholders
July 24, 200869,361 55.00common stock June 30, 2008
Effective dateClasses of stock
75,663 60.00 December 31, 2007common stock March 31, 2008
Decision Cash dividend(Millions of yen) Dividend per share (yen) Base date
common stock 72,588,428 99,275,245
3.Payment for dividends
26,701,146 14,329
Classes of stockBalance as of
December 31, 2007
1.Number of issued shares as of December 31, 2008
Balance as ofDecember 31, 2008
1,333,763,4642.Classes and number of treasury stock
Increase Decrease
NetDeferredprofits(losses)
on hedges
Totalnet
assets
Retained earningsCapital surplus
Other retained earnings
Valuation and translationadjustmentsStockholders' equity
Subscriptionrights toshares
Netunrealized
gains(losses)
on securities
Other capitalsurplus
Legalreserve
Treasurystock
Commonstock
Totalstockholders'
equityAdditional
paid-incapital
- 20 -

CANON INC.NON-CONSOLIDATED
14. NOTE FOR GOING CONCERN ASSUMPTION( Parent company only )
Not applicable.
15. CHANGES OF BASIS OF PRESENTATION AND SIGNIFICANT ACCOUNTING POLICIES( Parent company only )
Note to changes in Accounting Policies
(Measurement standard and valuation method of inventories)Previously, the inventories held by the company were primarily valued at cost, determined by periodic average method.Effective from the current fiscal year, the company has applied "Accounting Standard for Measurement of Inventories" (Accounting standards Board of Japan (ASBJ) Statement No.9, issued July 5, 2006). Accordingly, from the current fiscal year, such inventoriesare mainly valued at cost, determined by periodic average method (amount shown in the balance sheet is devaluated due to declinein profitability) . The effect of this change, operating profit, ordinary profit and income before taxes decreased by JPY 2,034 million for the fiscal year ended December 31, 2009.Further, devaluation loss and disposal loss of inventories were previously recorded as "Other, net", whereas currently recorded as"Cost of sales".The effect of this change, operating profit decreased by JPY 19,382 million for the fiscal year ended December 31, 2009.
(Lease transactions)Previously, finance lease transactions that do not transfer ownership were accounted for in a manner of operating lease.Effective from the current fiscal year, the company has applied "Accounting Standard for Lease Transactions" (ASBJ StatementNo.13, issued March 30, 2007, revised from original standard issued by Corporate Accounting Council on June 17, 1993) and"Guidance on Accounting Standards for Lease Transactions" (ASBJ Guidance No.16, issued March 30, 2007, revised from original guidance issued by The Japanese Institute of Certified Public Accountants on January 18, 1994). Accordingly, from thecurrent fiscal year, such lease transactions are accounted for in a similar manner with ordinary sale and purchase transactions.The change of this accounting standard has no impact on the statements of income for the fiscal year ended December 31, 2009.
- 21 -

CANON INC.
NON-CONSOLIDATED Directors
(Current titles are shown in the parentheses)
(1) Candidates for Directors to be promoted
Managing Director Hideki Ozawa (Director, President of Canon (China) Co.Ltd.)
Managing Director Masaya Maeda (Director, Chief Executive of Image Communication Products Operations)
(2) Directors to be retired
Advisor to be appointed Nobuyoshi Tanaka (Senior Managing Director)
Chairman and President of Canon Anelva Corporation to be continued
Junji Ichikawa (Senior Managing Director)
Advisor to be appointed Akiyoshi Moroe (Senior Managing Director)
President of Canon Components, Inc. to be appointed
Toshiyuki Komatsu (Director)
Managing Director of Canon Electronics, Inc. to be appointed
Tetsuro Tahara (Director)
Seijiro Sekine (Director)
Corporate Auditor to be appointed Shunji Onda (Director)
President of SED Inc. to be continued Kazunori Fukuma (Director)
(3) Corporate Auditors to be retired
Kunihiro Nagata
Yoshinobu Shimizu
Minoru Shishikura
(4) Candidates for new Corporate Auditors to be appointed
Shunji Onda (Director)
Kazunori Watanabe (Certified Public Accountant)
Kuniyoshi Kitamura (General Manager of The Dai-ichi Mutual Life Insurance Company)
- 22 -

CANON INC. NON-CONSOLIDATED
Executive Officers
(1) Candidates for new Executive Officers
Shigeyuki Uzawa (Group Executive of Semiconductor Production Equipment Operations)
Makoto Araki (Group Executive of Information & Communication Systems Headquarters)
Kenichi Nagasawa (Senior Director of Canon U.S.A., Inc.)
(2) Executive Officer to be retired
Kazuhiro Akiyama (Director of Canon Anelva Corporation)
- 23 -

Canon Inc.January 27, 2010
CONSOLIDATED FINANCIAL RESULTS FOR THE FOURTH QUARTER AND THE FISCAL YEAR ENDED DECEMBER 31, 2009
SUPPLEMENTARY REPORT
TABLE OF CONTENTS
1. SALES BY REGION AND PRODUCT (2009)..................................................... S 12. SALES BY REGION AND PRODUCT (2010/Projection).................................... S 23. SEGMENT INFORMATION BY PRODUCT (2009)........................................... S 34. OTHER INCOME / DEDUCTIONS (2009)........................................................... S 35. SEGMENT INFORMATION BY PRODUCT (2010/Projection).......................... S 46. OTHER INCOME / DEDUCTIONS (2010/Projection)......................................... S 47. SALES COMPOSITION BY PRODUCT............................................................... S 58. SALES GROWTH IN LOCAL CURRENCY........................................................ S 59. PROFITABILITY ................................................................................................... S 6
10. IMPACT OF FOREIGN EXCHANGE RATES..................................................... S 611. STATEMENTS OF CASH FLOWS....................................................................... S 612. R&D EXPENDITURE ............................................................................................ S 713. INCREASE IN PP&E & DEPRECIATION AND AMORTIZATION.................. S 714. INVENTORIES ...................................................................................................... S 715. DEBT RATIO.......................................................................................................... S 716. OVERSEAS PRODUCTION RATIO..................................................................... S 717. NUMBER OF EMPLOYEES.................................................................................. S 7
PAGE
This document contains forward-looking statements with respect to future results, performance and achievements that aresubject to risk and uncertainties and reflect management’s views and assumptions formed by available information. Allstatements other than statements of historical fact are statements that could be considered forward-looking statements.When used in this document, words such as “anticipate,” “believe,” “estimate,” “expect,” “intend,” “may,” “plan,”“project” or “should” and similar expressions, as they relate to Canon, are intended to identify forward-looking statements.Many factors could cause the actual results, performance or achievements of Canon to be materially different from anyfuture results, performance or achievements that may be expressed or implied by such forward-looking statements,including, among others, changes in general economic and business conditions, changes in currency exchange rates andinterest rates, introduction of competing products by other companies, lack of acceptance of new products or services byCanon’s targeted customers, inability to meet efficiency and cost reduction objectives, changes in business strategy andvarious other factors, both referenced and not referenced in this document. A detailed description of these and other riskfactors is included in Canon’s annual report on Form 20-F, which is on file with the United States Securities and ExchangeCommission. Should one or more of these risks or uncertainties materialize, or should underlying assumptions proveincorrect, actual results may vary materially from those described herein. Canon does not intend or assume any obligationto update these forward-looking statements.
Canon Inc.
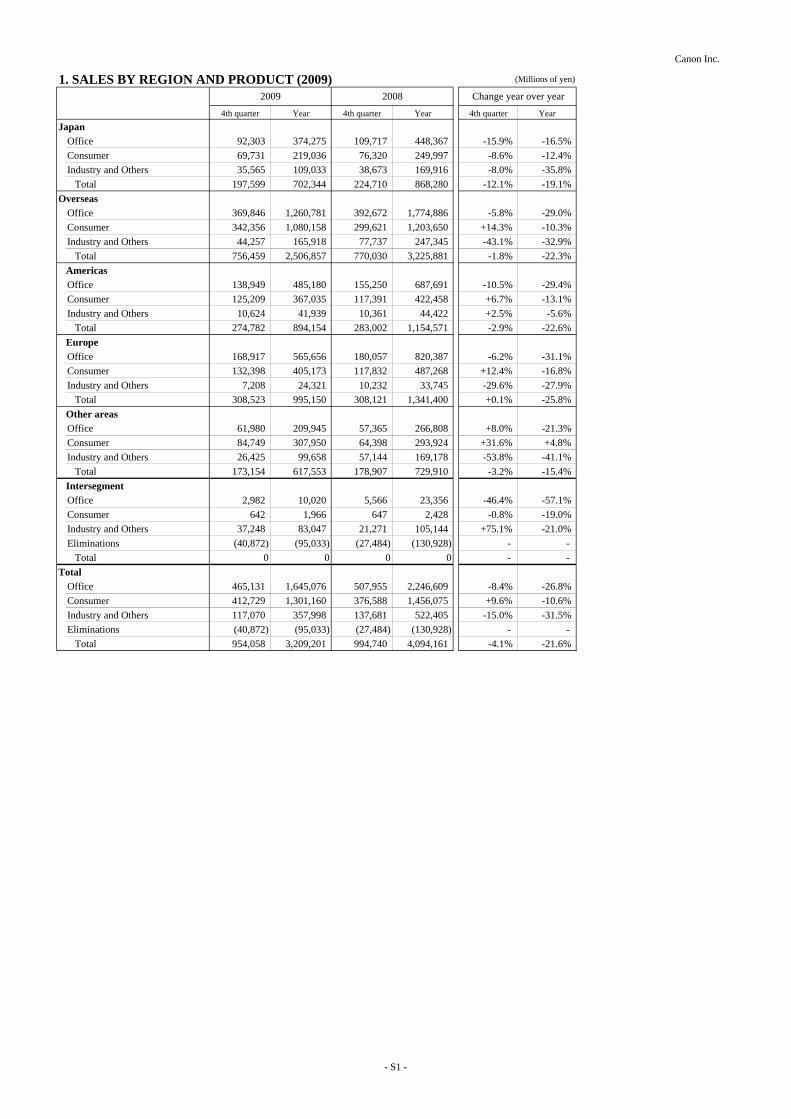
1. SALES BY REGION AND PRODUCT (2009) (Millions of yen)
4th quarter Year 4th quarter Year 4th quarter YearJapan
Office 92,303 374,275 109,717 448,367 -15.9% -16.5%Consumer 69,731 219,036 76,320 249,997 -8.6% -12.4%Industry and Others 35,565 109,033 38,673 169,916 -8.0% -35.8% Total 197,599 702,344 224,710 868,280 -12.1% -19.1%
OverseasOffice 369,846 1,260,781 392,672 1,774,886 -5.8% -29.0%Consumer 342,356 1,080,158 299,621 1,203,650 +14.3% -10.3%Industry and Others 44,257 165,918 77,737 247,345 -43.1% -32.9% Total 756,459 2,506,857 770,030 3,225,881 -1.8% -22.3%
AmericasOffice 138,949 485,180 155,250 687,691 -10.5% -29.4%Consumer 125,209 367,035 117,391 422,458 +6.7% -13.1%Industry and Others 10,624 41,939 10,361 44,422 +2.5% -5.6% Total 274,782 894,154 283,002 1,154,571 -2.9% -22.6%
EuropeOffice 168,917 565,656 180,057 820,387 -6.2% -31.1%Consumer 132,398 405,173 117,832 487,268 +12.4% -16.8%Industry and Others 7,208 24,321 10,232 33,745 -29.6% -27.9% Total 308,523 995,150 308,121 1,341,400 +0.1% -25.8%
Other areasOffice 61,980 209,945 57,365 266,808 +8.0% -21.3%Consumer 84,749 307,950 64,398 293,924 +31.6% +4.8%Industry and Others 26,425 99,658 57,144 169,178 -53.8% -41.1% Total 173,154 617,553 178,907 729,910 -3.2% -15.4%
IntersegmentOffice 2,982 10,020 5,566 23,356 -46.4% -57.1%Consumer 642 1,966 647 2,428 -0.8% -19.0%Industry and Others 37,248 83,047 21,271 105,144 +75.1% -21.0%Eliminations (40,872) (95,033) (27,484) (130,928) - - Total 0 0 0 0 - -
TotalOffice 465,131 1,645,076 507,955 2,246,609 -8.4% -26.8%Consumer 412,729 1,301,160 376,588 1,456,075 +9.6% -10.6%Industry and Others 117,070 357,998 137,681 522,405 -15.0% -31.5%Eliminations (40,872) (95,033) (27,484) (130,928) - - Total 954,058 3,209,201 994,740 4,094,161 -4.1% -21.6%
Change year over year2009 2008
- S1 -

Canon Inc.
2. SALES BY REGION AND PRODUCT (2010/Projection)
(1) Sales by product (Millions of yen)
Year Year Year
Office 1,760,900 1,645,076 +7.0%
Consumer 1,369,500 1,301,160 +5.3%
Industry and Others 401,300 357,998 +12.1%
Eliminations (81,700) (95,033) -
Total 3,450,000 3,209,201 +7.5%
(P)=Projection
(2) Sales by region (Millions of yen)
Year Year Year
Japan 731,050 702,344 +4.1%
Overseas 2,718,950 2,506,857 +8.5%
Americas 924,750 894,154 +3.4%
Europe 1,086,550 995,150 +9.2%
Other areas 707,650 617,553 +14.6%
Total 3,450,000 3,209,201 +7.5%
(P)=Projection
2010 (P) 2009 Change year over year
2010 (P) 2009 Change year over year
- S2 -
Canon Inc.
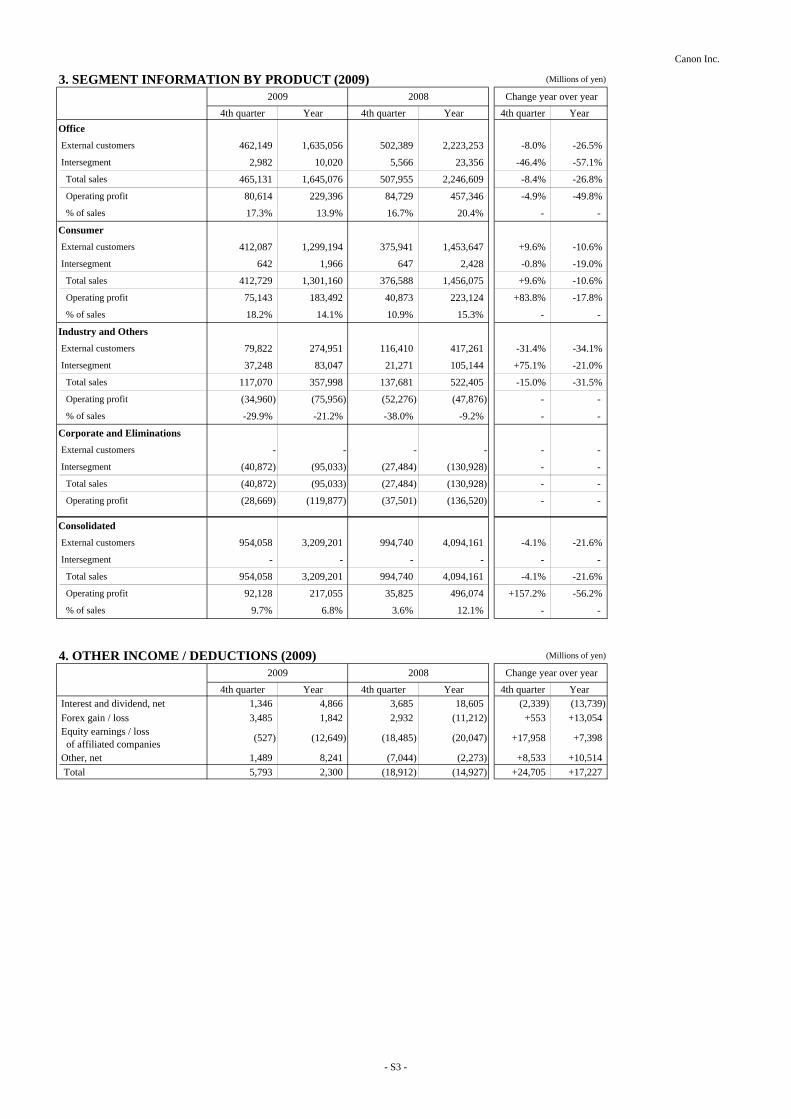
3. SEGMENT INFORMATION BY PRODUCT (2009) (Millions of yen)
4th quarter Year 4th quarter Year 4th quarter YearOfficeExternal customers 462,149 1,635,056 502,389 2,223,253 -8.0% -26.5%Intersegment 2,982 10,020 5,566 23,356 -46.4% -57.1% Total sales 465,131 1,645,076 507,955 2,246,609 -8.4% -26.8% Operating profit 80,614 229,396 84,729 457,346 -4.9% -49.8% % of sales 17.3% 13.9% 16.7% 20.4% - -
ConsumerExternal customers 412,087 1,299,194 375,941 1,453,647 +9.6% -10.6%Intersegment 642 1,966 647 2,428 -0.8% -19.0% Total sales 412,729 1,301,160 376,588 1,456,075 +9.6% -10.6% Operating profit 75,143 183,492 40,873 223,124 +83.8% -17.8% % of sales 18.2% 14.1% 10.9% 15.3% - -
Industry and OthersExternal customers 79,822 274,951 116,410 417,261 -31.4% -34.1%Intersegment 37,248 83,047 21,271 105,144 +75.1% -21.0% Total sales 117,070 357,998 137,681 522,405 -15.0% -31.5% Operating profit (34,960) (75,956) (52,276) (47,876) - - % of sales -29.9% -21.2% -38.0% -9.2% - -
Corporate and EliminationsExternal customers - - - - - - Intersegment (40,872) (95,033) (27,484) (130,928) - - Total sales (40,872) (95,033) (27,484) (130,928) - - Operating profit (28,669) (119,877) (37,501) (136,520) - -
ConsolidatedExternal customers 954,058 3,209,201 994,740 4,094,161 -4.1% -21.6%Intersegment - - - - - - Total sales 954,058 3,209,201 994,740 4,094,161 -4.1% -21.6% Operating profit 92,128 217,055 35,825 496,074 +157.2% -56.2% % of sales 9.7% 6.8% 3.6% 12.1% - -
4. OTHER INCOME / DEDUCTIONS (2009) (Millions of yen)
4th quarter Year 4th quarter Year 4th quarter YearInterest and dividend, net 1,346 4,866 3,685 18,605 (2,339) (13,739)Forex gain / loss 3,485 1,842 2,932 (11,212) +553 +13,054Equity earnings / loss of affiliated companies (527) (12,649) (18,485) (20,047) +17,958 +7,398
Other, net 1,489 8,241 (7,044) (2,273) +8,533 +10,514 Total 5,793 2,300 (18,912) (14,927) +24,705 +17,227
Change year over year2009 2008
Change year over year2009 2008
- S3 -
Canon Inc.
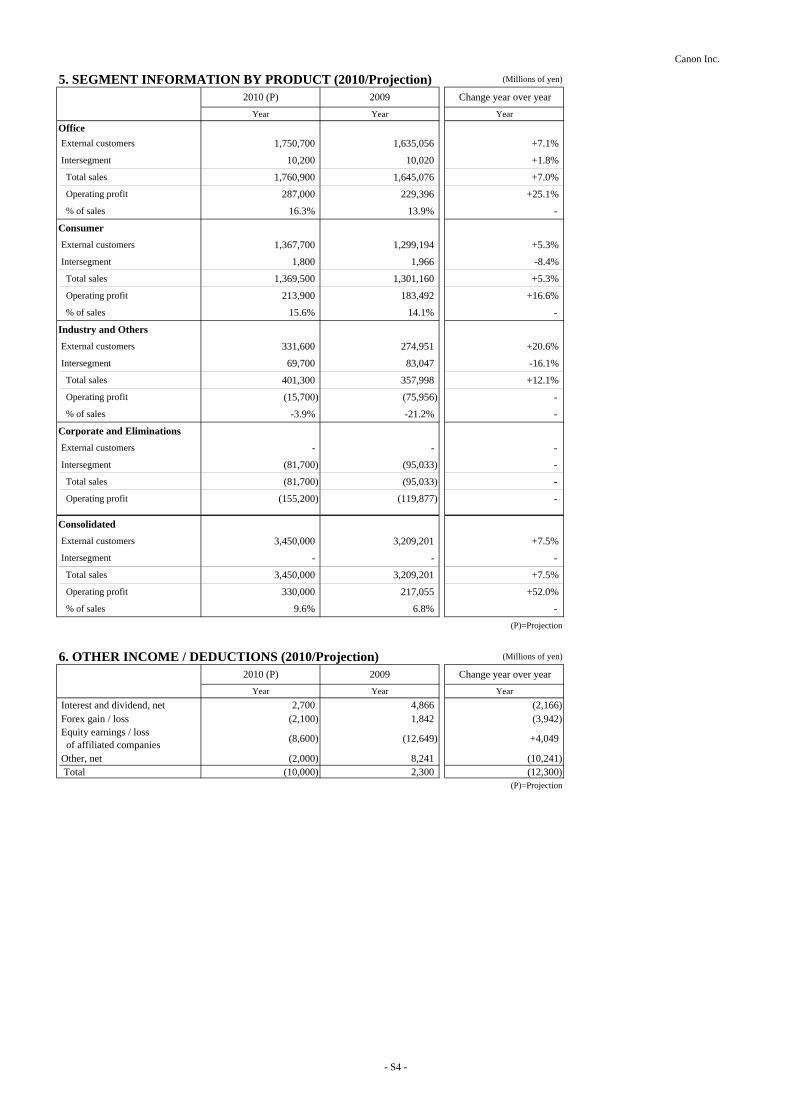
5. SEGMENT INFORMATION BY PRODUCT (2010/Projection) (Millions of yen)
Year Year Year
OfficeExternal customers 1,750,700 1,635,056 +7.1%Intersegment 10,200 10,020 +1.8% Total sales 1,760,900 1,645,076 +7.0% Operating profit 287,000 229,396 +25.1% % of sales 16.3% 13.9% -
ConsumerExternal customers 1,367,700 1,299,194 +5.3%Intersegment 1,800 1,966 -8.4% Total sales 1,369,500 1,301,160 +5.3% Operating profit 213,900 183,492 +16.6% % of sales 15.6% 14.1% -
Industry and OthersExternal customers 331,600 274,951 +20.6%Intersegment 69,700 83,047 -16.1% Total sales 401,300 357,998 +12.1% Operating profit (15,700) (75,956) - % of sales -3.9% -21.2% -
Corporate and EliminationsExternal customers - - - Intersegment (81,700) (95,033) - Total sales (81,700) (95,033) - Operating profit (155,200) (119,877) -
ConsolidatedExternal customers 3,450,000 3,209,201 +7.5%Intersegment - - - Total sales 3,450,000 3,209,201 +7.5% Operating profit 330,000 217,055 +52.0% % of sales 9.6% 6.8% -
(P)=Projection
6. OTHER INCOME / DEDUCTIONS (2010/Projection) (Millions of yen)
Year Year YearInterest and dividend, net 2,700 4,866 (2,166)Forex gain / loss (2,100) 1,842 (3,942)Equity earnings / loss of affiliated companies (8,600) (12,649) +4,049
Other, net (2,000) 8,241 (10,241) Total (10,000) 2,300 (12,300)
(P)=Projection
Change year over year2010 (P) 2009
Change year over year2010 (P) 2009
- S4 -
Canon Inc.
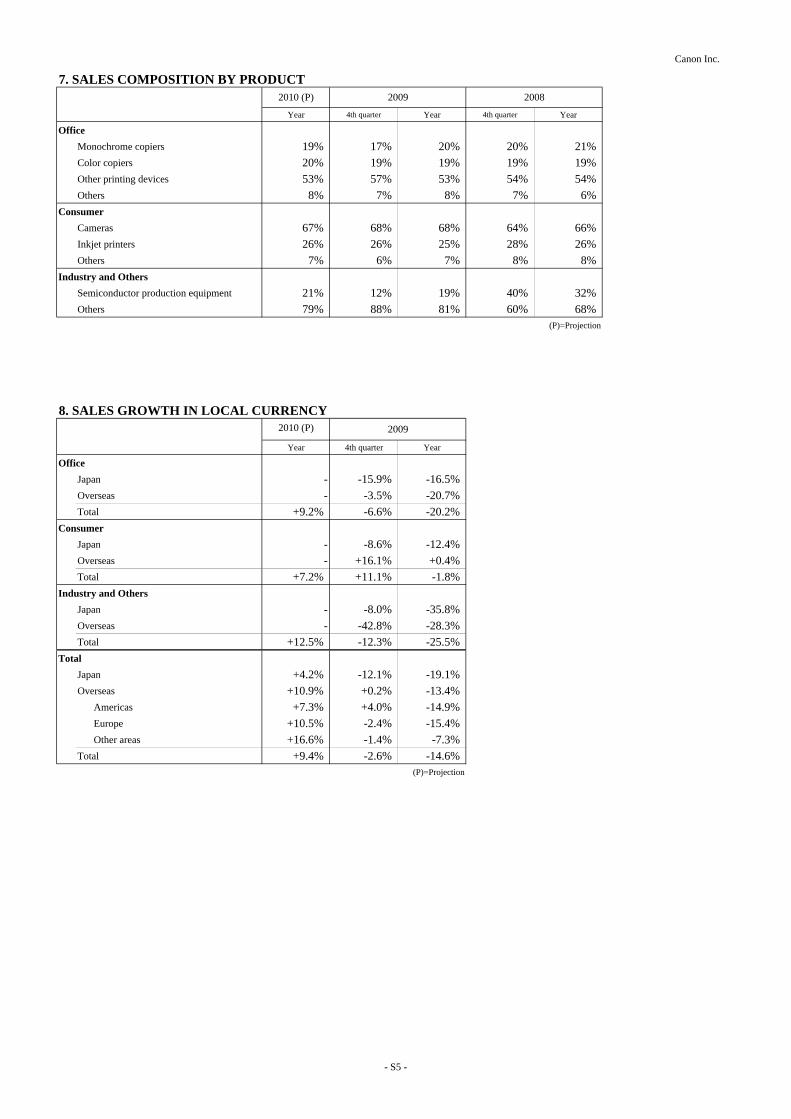
7. SALES COMPOSITION BY PRODUCT
Year 4th quarter Year 4th quarter Year
OfficeMonochrome copiers 19% 17% 20% 20% 21%Color copiers 20% 19% 19% 19% 19%Other printing devices 53% 57% 53% 54% 54%Others 8% 7% 8% 7% 6%
ConsumerCameras 67% 68% 68% 64% 66%Inkjet printers 26% 26% 25% 28% 26%Others 7% 6% 7% 8% 8%
Industry and OthersSemiconductor production equipment 21% 12% 19% 40% 32%Others 79% 88% 81% 60% 68%
(P)=Projection
8. SALES GROWTH IN LOCAL CURRENCY2010 (P)
Year 4th quarter Year
OfficeJapan - -15.9% -16.5%Overseas - -3.5% -20.7%Total +9.2% -6.6% -20.2%
ConsumerJapan - -8.6% -12.4%Overseas - +16.1% +0.4%Total +7.2% +11.1% -1.8%
Industry and OthersJapan - -8.0% -35.8%Overseas - -42.8% -28.3%Total +12.5% -12.3% -25.5%
TotalJapan +4.2% -12.1% -19.1%Overseas +10.9% +0.2% -13.4%
Americas +7.3% +4.0% -14.9% Europe +10.5% -2.4% -15.4% Other areas +16.6% -1.4% -7.3%
Total +9.4% -2.6% -14.6%(P)=Projection
2010 (P)
2009
2009 2008
- S5 -

Canon Inc.
9. PROFITABILITY
Year Year Year
ROE *1 7.4% 4.9% 11.1%ROA *2 5.1% 3.4% 7.3%
*1 Based on Net Income attributable to Canon Inc. and Total Canon Inc. stockholders' equity (P)=Projection*2 Based on Net Income attributable to Canon Inc.
10. IMPACT OF FOREIGN EXCHANGE RATES(1) Exchange rates (Yen)
Year 4th quarter Year 4th quarter Year
Yen/US$ 90.00 89.68 93.21 96.22 103.23Yen/Euro 130.00 132.54 130.46 126.46 151.46
(P)=Projection
(2) Impact of foreign exchange rates on sales (Year over year) (Billions of yen)
Year 4th quarter Year
US$ (49.8) (20.5) (116.8)Euro (2.9) +12.0 (114.8)Other currencies (2.5) +6.1 (17.9) Total (55.2) (2.4) (249.5)
(P)=Projection
(3) Impact of foreign exchange rates per yen (Billions of yen)
Year
On salesUS$ 15.5Euro 6.4
On operating profitUS$ 8.2Euro 4.6
(P)=Projection
11. STATEMENTS OF CASH FLOWS (Millions of yen)
Year 4th quarter Year 4th quarter Year Net cash provided by operating activities 520,000 236,708 611,235 181,249 616,684 Net cash used in investing activities (360,000) (84,010) (370,244) (86,857) (472,480) Free cash flow 160,000 152,698 240,991 94,392 144,204 Net cash used in financing activities (240,000) (998) (142,379) (85,592) (277,565) Effect of exchange rate changes on cash and cash equivalents (15,000) 9,678 17,226 (66,923) (131,906) Net change in cash and cash equivalents (95,000) 161,378 115,838 (58,123) (265,267) Cash and cash equivalents at end of period 700,000 795,034 795,034 679,196 679,196
(P)=Projection
* In connection with the adoption of the guidance for noncotrolling interests in consolidated financial statements, only the total of "net cash provided by operating activities"
will be provided from first-quarter 2009.
2010 (P) 2009 2008
2010 (P)
2008
2009 2008
2010 (P)
2010 (P)
2010 (P)
2009
2009
- S6 -

Canon Inc.
12. R&D EXPENDITURE (Millions of yen)
Year Year Year
Office - 78,872 106,247Consumer - 74,131 76,645Industry and Others - 151,597 191,133 Total 320,000 304,600 374,025
% of sales 9.3% 9.5% 9.1%(P)=Projection
13. INCREASE IN PP&E & DEPRECIATION AND AMORTIZATION(Millions of yen)
Year Year Year
Increase in PP&EOffice - 91,525 131,165Consumer - 26,483 51,985Industry and Others - 22,743 25,555Corporate and eliminations - 75,377 153,283
Total 220,000 216,128 361,988 Depreciation and amortization
Office - 90,878 99,962Consumer - 48,701 58,082Industry and Others - 60,770 71,557Corporate and eliminations - 115,044 111,736 Total 300,000 315,393 341,337
(P)=Projection
14. INVENTORIES (1) Inventories (Millions of yen)
Dec.31 Dec.31
Office 144,941 185,859 (40,918)Consumer 113,975 160,861 (46,886)Industry and Others 114,325 160,199 (45,874) Total 373,241 506,919 (133,678)
(2) Inventories/Sales* (Days)
Dec.31 Dec.31
Office 30 32 (2)Consumer 29 41 (12)Industry and Others 158 151 +7 Total 39 47 (8)*Index based on the previous six months sales.
15. DEBT RATIO
Dec.31 Dec.31
Total debt / Total assets 0.3% 0.4% -0.1%
16. OVERSEAS PRODUCTION RATIO
Year Year
Overseas production ratio 40% 39%
17. NUMBER OF EMPLOYEES
Dec.31 Dec.31
Japan 73,635 72,445 +1,190Overseas 95,244 94,535 +709 Total 168,879 166,980 +1,899
Difference
Difference
Difference
Difference
2009 2008
2009 2008
2009 2008
2009 2008
2009 2008
2010 (P) 2009 2008
2010 (P) 2009 2008
- S7 -