Embed Size (px)
Citation preview

0
(Appendix)
Results for the First Quarterof the Fiscal Year Ending May 31, 2019
FY2018 (June 1, 2018 - May 31, 2019)
Three months ended August 31, 2018
Pasona Group Inc.
First Section TSE (2168)
October 5, 2018www.pasonagroup.co.jp/english
※Units in billions of yen have been rounded to the nearest first decimal place. Units in millions of yen have been rounded down.

11
1.03
1.4572.5
83.0
Consolidated Results
●Net sales
・ Human resource demand continues to be strong. In addition to providing various solution services
tailored to the environment and needs, M&A and others contributed to expanding revenues.
●Operating income
・ Increasing due to improving efficiency of operation.
YoY +14.5% +40.5%
3M FY17 3M FY18
Net Sales Operating Income
3M FY17 3M FY18
(Billions of yen)
(Millions of yen) 3M FY17 (%) 3M FY18 (%)Increase
/Decrease
+10,538
+14.5%
+7,743
+13.5%
+2,795
+18.3%
+2,376
+16.7%
+418
+40.5%Operating income
15,256 21.1 18,051 21.7
SG&A
expenses
1,033 1.4 1,451 1.7
14,222 19.6 16,599 20.0
57,202 78.9 64,946 78.3
Gross profit
72,458 100.0 82,997 100.0
Cost of sales
Net sales
Major Items of Increase/Decrease

22
OperationgIncome
Increase in net sales+2.22
Reduced rent+0.02
Increace ingross profit
margin+0.58
1.03
Increase in expenses
(2.40)
YoY+40.5%
+2.80 +2.38
1.45
3M FY17 3M FY18
Operating Income
Gross profit SG&A Expenses
(Billions of yen)
Major Item of Increase/Decrease
●Gross profit improved due to increasing sales and promoting efficiency of operations, etc.
●SG&A expenses increased due to higher sales , but operating income ratio improved.
FY10 FY11 FY12 FY13 FY14 FY15 FY16 FY17* 3M FY17 3M FY18
Gross Profit margin 18.8% 18.6% 19.3% 19.3% 20.3% 20.0% 20.2% 21.5% 21.1% 21.7%
SG&A ratio 17.4% 17.5% 17.8% 17.7% 18.7% 18.6% 18.6% 19.4% 19.6% 20.0%
O peration Income ratio 1.4% 1.1% 1.5% 1.5% 1.5% 1.5% 1.6% 2.1% 1.4% 1.7%
*Change in method of recording costs (from cost of sales to SG&A) at Pasona · Panasonic Business Services. No impact on operating income.

33
0.53
(0.01)
3M FY18 3M FY17
Consolidated Results(Non-operating/Extraordinary income (loss), Others)
Profit (loss) attributable to owners of parent
Major Item of Increase/Decrease
(Billions of yen)
3M FY17 3M FY18Increase/
DecreaseYoY
1,033 1,451 +418 +40.5%
Non-operating
income 149 269 +120 +80.9%
Non-operating
expenses 175 499 +323 +184.4%
1,006 1,222 +215 +21.4%
Extraordinary
income 601 8 (593) (98.6)%
Extraordinary
loss 14 17 +2 +18.1%
1,593 1,212 (380) (23.9)%
Income taxes
- current 677 (145) (823) -
Income taxes
- deferred 10 821 +811 +7782.1%
687 675 (11) (1.7)%
Profit attributable to
non-controlling interests 372 544 +171 +46.1%
533 (7) (540) -Profit (Loss) attributable
to owners of parent
(Millions of yen)
Operating income
Ordinary income
Income before
income taxes
Income taxes
●Non-operating income
・Real estate rents ¥174million (+¥ 76million)
●Non-operating expenses
・Real estate leasing costs ¥144million (+¥ 66million)
・Commission fee of share sales for Benefit One
¥236million (+236million)
●Extraordinary income
・Previous term (the First Quarter) gain on bargain purchase
(¥(601)million)

44
(Millions of yen)
3M FY17 3M FY18Increase/
DecreaseYoY 3M FY17 3M FY18
Increase/
DecreaseYoY 3M FY17 3M FY18
Increase/
Decrease
① Expert Services (Temporary Staffing)
37,172 43,626 +6,454 +17.4%
② Insourcing (Contracting)
19,449 22,094 +2,645 +13.6%
③ HR Consulting, Education, Training, etc.
1,580 1,857 +277 +17.6%
④ Global Sourcing (Overseas)
1,724 1,961 +236 +13.7%
59,926 69,540 +9,614 +16.0%
Career Solutions (Placement/ Recruiting, Outplacement)
4,004 4,568 +563 +14.1% 670 863 +193 +28.9% 16.7% 18.9% +2.2pt
Outsourcing 7,775 7,933 +157 +2.0% 1,184 1,684 +499 +42.1% 15.2% 21.2% +6.0pt
Life Solutions 1,250 1,355 +104 +8.4% 49 18 (30) (62.6)% 3.9% 1.4% (2.5)pt
Public Solutions 462 756 +294 +63.6% (124) (389) (264) - - - -
Eliminations and Corporate (961) (1,157) (196) - (1,597) (1,887) (289) - - - -
72,458 82,997 +10,538 +14.5% 1,033 1,451 +418 +40.5% 1.4% 1.7% +0.3pt
Operating income marginNet sales Operating income (loss)
Segment
⑤
851 1.4% 1.7% +0.3pt
Subtotal
1,162 +311 +36.6%
⑥
⑦
⑨
⑧
Total
Consolidated Results by Segment

55
(Billions of yen)
May 31,2018 Aug 31,2018Increase/
Decrease
Assets 112.5 110.6 (1.9)
Current assets 74.0 71.8 (2.2)
Cash and deposits 25.4 26.6 +1.3
Notes and accounts receivable-trade 40.1 36.6 (3.5)
Other 8.5 8.6 +0.1
Non-current assets 38.5 38.8 +0.3
Property, plant and equipment 15.4 16.5 +1.1
Intangible assets 9.6 9.3 (0.3)
Investments and other assets 13.5 13.0 (0.5)
78.6 74.3 (4.3)
Current liabilities 57.6 52.4 (5.2)
Accounts payable 6.5 3.4 (3.1)
Short-term loans payable 6.2 6.3 +0.1
Accrued expenses 16.6 16.4 (0.2)
Other 28.3 26.2 (2.1)
Non-current liabilities 21.0 21.9 +0.9
Long-term loans payable 14.1 14.7 +0.6
33.9 36.3 +2.4
Shareholders' equity 23.2 26.0 +2.8
Valuation and translation adjustments 0.4 0.4 (0.0)
Non-controlling interests 10.3 10.0 (0.3)
Capital adequacy ratio 21.0% 23.8% +2.8pt※The figures for the previous fiscal year were processed by the method
of rivised the Accounting Standard for Tax Effect Accounting.
Major Item of Increase/Decrease
Liabilities
Net assets
Balance sheet
【 Curret Assets 】Cash and depositsAccounts receivable
【 Capital surplus】Sold the share of Benefit One【 Retained earnings 】Cash dividends payment
【 Non-controlling interests 】Benefit One earnings distributionCash dividends paid of Benefit OneSale the shares of Benefit One
¥(0.5)billion
+¥0.5billion¥(1.0)billion+¥0.3billion
【 Current liabilities 】Accounts payable Income taxes payable
¥(3.1)billion¥(1.1)billion
【 Fixed Assets 】New businesses +¥1.1billion
Major Item of Increase/Decrease
+¥1.3billion¥(3.5)billion
+¥3.3billion

6
Segment information
※ Units in billions of yen have been rounded to the nearest first decimal place. Units in millions of yen have been rounded down.6

77
36.435.1 34.3
36.937.2
41.340.2 41.1
43.6
37.2
43.6
YoY+17.4%
YoY
+17.4%
1Q 2Q 3Q 4Q
FY16 FY17 FY18 FY16 FY17 17/5 FY16 FY17 17/5
Expert Services (Temporary staffing)
Net Sales Sales Trends
FY16 FY173M FY17 3M FY18
●3M FY18 result
・ Direct employment advances at dispatched companies due to the influence of law revisions such as Labor Contract Law.
・ Changing the accounting period of the two NTT Group companies that acquired in the previous term (posting results for five months), and the results of the Nagasaki Diamond Staff contributed.
・ Continuing to develop the business for professional jobs such as IT, foreign languages , accounting, etc. with high needs.
(Billions of yen) (Billions of yen)
vs FY17+17.8% +17.3% +11.5%
Business Conditions

88
39.544.0
73.477.1
84.491.8
59.9 65.6
99.6 107.0
117.1
129.4
Insourcing Outsourcing
19.4
22.1
YoY
+9.6%+9.6%
+51.8%
+7.4%YoY+13.6%
BPO Sales
Insourcing (Contracting)
(Benefit One Inc.)
(Billions of yen)
9.3 11.416.9 18.2 19.4 22.1
13.9 16.2
22.9 25.727.2
30.0
FY14 FY15 FY16 FY17 FY18FY13
Q1 Full-year
(Forecast)
Net Sales
●3M FY18 result
・ Increasing in projects that have strengths in the Company’s advantage field , such as promotion of female success in addition to administrative affairs agency in public.
・ Contribution by Bewith,Inc. strengthening its structure following the previous term.
・ Pasona Knowledge Partners (a joint venture company with the
Panasonic Group) began full-scale operations in the patent /
intellectual property field from the end of the previous fiscal year
and contributed to the business results for the current fiscal year.
(Billions of yen)
+9.4%
+10.5%
3M FY17 3M FY18
Business Conditions

99
Asia62.2%
North America 37.8%
1,059
668
1,210
737
Asia
NorthAmerica
1.721.96
YoY+13.7%
+14.3%
3M FY17
3M FY18
※Including overseas outsourcing
Global Sourcing (Overseas)
Sales by Business Segment
Sales by Region (Millions of yen)
(Exclude Japan)
Sales composition
(Millions of yen)
3M 'FY17 3M 'FY18 YoY
Temporary Staffing 784 998 +27.3%
Placement / Recruiting 481 508 +5.5%
Contracting
(Payroll, others)289 324 +12.2%
Others 168 129 (23.2)%
Total 1,724 1,961 +13.7%
Net Sales
Business Conditions
●3M FY18 result・ Temporary staffing expanded significantly especially in Indonesia and North America.
・ Expansion of engineering training and dispatch business with Vietnamese industry collaboration.
+10.2%
(Billions of yen)
3M FY17 3M FY18

1010
0.85
1.16
1.4% 1.7%
-0.8%
0.2%
1.2%
2.2%
3.2%
4.2%
5.2%
0
0.2
0.4
0.6
0.8
1
1.2
1.4
1.6
1.8
1.58
1.86
HR Consulting, etc. / Operating Income by Segments
YoY+17.6%
YoY+36.6%
ES~GS Operating
Income
Net Sales (HR Consulting, education, training, etc.)
(Billions of yen)(Billions of yen)
※ES~GS: Expert Service, Insourcing, HR Consulting, Global Sourcing
3M FY17 3M FY18
Business Conditions Business Conditions
●3M FY18 result・ Large orders for newcomers of training and promotion of contract for public works.
・ Increase in placement fees due to direct hiring by client companies.
●3M FY18 result
・ Improving profitability due to improved the efficiency of insourcing business in addition to increased sales.
3M FY17 3M FY18

1111
0.67
0.86
16.7%18.9%
4.0%
9.0%
14.0%
19.0%
24.0%
29.0%
0.00
0.10
0.20
0.30
0.40
0.50
0.60
0.70
0.80
0.904.00
4.57
YoY+14.1%
YoY+28.9%
Career Solutions (Placement/Recruiting, Outplacement )
Net SalesOperating Income,
Operating Income MarginActive opening ratio by occupation
(Full-time employees including part- time workers)
(Billions of yen)(Billions of yen)
4.04.2
3.94.1
3.4
3.83.6
4.24.0 4.1
4.0
4.5 4.6
19.7%
19.7%
12.4%
19.3%
3.2%
15.8%
10.8%
21.3%
16.7%
19.7%
15.7%
20.1%18.9%
0.0%
5.0%
10.0%
15.0%
20.0%
25.0%
Q1 Q2 Q3 Q4 Q1 Q2 Q3 Q4 Q1 Q2 Q3 Q4 Q1
FY15 FY16 FY17 FY18
Net sales Operating income margin
●3M FY18 result・ In the recruitment business, strengthening the in-house structure contributed to the vigorous demand. The “KOMON NETWORK" where experienced professionals are activeas advisors also grows.
・ In outplacement business, it grew due to the contribution of large-scaleprojects from the previous end of term. Promoting comprehensive sales with recruitment business while aiming for efficient management.
3M FY17 3M FY18 3M FY17 3M FY18
Business Conditions

1212
2,790 2,840 3,260 3,470 3,790 4,060 4,280 4,7505,600
2,320 2,3902,430 1,530
1,600 1,410 1,4101,160
1,210
280 520680
910
1,4702,270 1,910 1,520
2,190
5,390 5,750 6,380 5,910
6,860
7,740 7,600 7,430
9,000
FY10 FY11 FY12 FY13 FY14 FY15 FY16 FY17 As of Apr.302019
(Forecast)
Personal
CRM
Employee fringe benefit
1.18
1.68
15.2%
21.2%
4.0%
9.0%
14.0%
19.0%
24.0%
29.0%
0.00
0.20
0.40
0.60
0.80
1.00
1.20
1.40
1.60
1.80
7.78 7.93
YoY+2.0%
YoY+42.1%
(Billions of yen)
Benefit One Membership
(Thousands people)
Sales Composition
Outsourcing (Benefit One Inc.)
*BtoB: Employee fringe benefit, Incentive, Health care, BTM, Cost reductionBtoC: Personal, CRM, Inbound
Business Conditions
●3M FY18 result
・ The B to B business of the welfare / healthcare division was positively influenced by the reform of working way and work of the same labor same wage due to the lack of personnel, leading the business results.
・ Promoting digitization of operations to reduce costs.
Net SalesOperating Income,
Operating Income Margin
83.9% 85.2%
13.5% 10.7%
2.6% 4.1%
FY17 FY18(Forecast)
BtoB BtoC Overseas etc.3M FY17 3M FY18 3M FY17 3M FY18

1313
1.251.36
0.05
0.023.9%
1.4%0.0%
1.0%
2.0%
3.0%
4.0%
5.0%
6.0%
7.0%
8.0%
9.0%
10.0%
0.00
0.01
0.02
0.03
0.04
0.05
0.06
0.07
0.08
0.09
0.10
Net SalesOperating Income,
Operating Income Margin
YoY+8.4%
YoY(62.6)%
Life Solutions (Childcare, Nursing care)
(Billions of Yen)
・Holding “Miracle Kids Otemachi” school children program for elementary school 3rd and 6th graders for summer vacation.
・Started trial campaign of housekeeping agency service using Kyotango’s ingredients as group synergy.
Education program to cultivate logical thinking
Otemachi ranchDairy experience
【 The number of facilities 】・Daycare facilities 39・After-school children’s clubs 42
※As of Aug.31, 2018
※As of Aug.31, 2018【 The number of facilities 】・Nursing care facilities 25
Pasona Life Care
Pasona Foster
●3M FY18 result
・ Based on the management of nursing homecare facilities, although "housekeeping service" and "service on support for balancing work and nursing care" are growing, cost increases due to improvement in treatment of nursery teachers,etc. Increasing in revenue and earnings.
3M FY17 3M FY18 3M FY17 3M FY18
Business Conditions

1414
(0.12)
(0.39)
0.46
0.76
YoY+63.6%
Public Solutions (Regional Revitalization, etc.)
Operating Income
(Billions of Yen)
3M FY17 3M FY18
3M FY17 3M FY18
Net Sales Tango Kingdom Inc.
Others
・Holding “YOWAMUSHI PEDAL
GLORY LINE Awajishima Stage"
with popular animation at
Awajishima.
Selling stamp rallies that
go round "Nijigennomori" and
“Nojima-Scuola", AR games,
limited goods.
・Pasona Heartful received the "Heisei 30-year Employment Excellent Companies Award" sponsored by the Tokyo Industry and Labor Bureau.
●3M FY18 result
・ Tango Kingdom Inc.: Improving profitability by raising
customer unit price, expanding sales by regional trading
company business and improving operational cost efficiency.
・ Since the initial expenses of new facilities such as Nijigennomori’s glamping was also posted, the deficit widened.
・ The number of visitors has reached 1.5 million since the opening in April 2015. In "Memorial Thanksgiving", in addition to a ceremonial ceremony, we also held stage performance and drone experience.
・ Two original craft beers( "smoke" and "Weitzen")received "Silver Award" at "International Beer Cup 2018".
Business Conditions

1515
(1.60)
(1.89)
(0.96)(1.16)
FY13 FY14 FY15 FY16 FY17 FY18
(Forecast)
Incubation costs
Group costs
Holding costs
Elimination/Corporate Segment Costs
(Billions of yen)
Main Reasons for Cost Increase
Costs Trends
● 3M FY18 result
Holding costs : Management costs as holding company ・ YoY +0.26billions.
Group costs : Costs to maximize group synergies・ (0.10) billions YoY due to the sponsorship of the Olympics and Paralympic Games increased,
but the relocation-related costs of the Tokyo headquarters building decreased.
Incubation costs : Costs for development and launch of new businesses・ +0.13 billions YoY due to new businesses.
Operating IncomeNet Sales
3M FY17 3M FY173M FY18 3M FY18

1616
4.49
6.54
8.30
(0.13) 1.29 1.60
280.4
311.4343.0
Profit attributable to owners of parent
(Billions of yen)
FY16 FY18(Forecast)
FY17
FY2018 Consolidated Forecasts
FY16 FY18(Forecast)
FY17FY16 FY18(Forecast)
FY17
Net Sales
YoY +10.1% +26.9%
(Millions of yen) FY16to net sales
%FY17
to net sales
%
FY18
Forecast
to net sales
%vs FY17
Increase/DecreaseYoY
Net sales 280,395 100.0 311,410 100.0 343,000 100.0 +31,589 +10.1%
Cost of sales 223,778 79.8 244,382 78.5 267,000 77.8 +22,617 +9.3%
Gross profit 56,617 20.2 67,028 21.5 76,000 22.2 +8,971 +13.4%
SG&A expenses 52,128 18.6 60,489 19.4 67,700 19.7 +7,210 +11.9%
Operating income 4,488 1.6 6,539 2.1 8,300 2.4 +1,760 +26.9%
Ordinary income 4,319 1.5 6,631 2.1 8,400 2.4 +1,768 +26.7%
Profit(Loss) attributable to owners of parent (129) - 1,288 0.4 1,600 0.5 +311 +24.2%
+24.2%
Operating Income

1717
FY2018 Consolidated Forecasts by Segment
(Millions of yen)
FY17FY18
Forecast
VS FY17
Increase/
Decrease
VS FY17
%FY17
FY18
Forecast
VS FY17
Increase/
Decrease
VS FY17
%FY17
FY18
Forecast
VS FY17
Increase/
Decrease
Expert Services(Temporary Staffing)
159,851 172,800 +12,948 +8.1%
Insourcing(Contracting)
84,429 91,800 +7,370 +8.7%
HR Consulting, Education, Training, etc.
7,283 8,900 +1,616 +22.2% 2.0% 2.1% +0.1pt
Global Sourcing(Overseas)
7,216 8,100 +883 +12.2%
Subtotal 258,781 281,600 +22,818 +8.8%
Career Solutions(Placement/Recruiting,
Outplacement)
16,638 18,800 +2,161 +13.0% 3,020 2,880 (140) (4.7)% 18.2% 15.3% (2.8)pt
Outsourcing 32,656 37,600 +4,943 +15.1% 6,211 7,540 +1,328 +21.4% 19.0% 20.1% +1.0pt
Life Solutions 5,129 5,900 +770 +15.0% 268 170 (98) (36.7)% 5.2% 2.9% (2.4)pt
Public Solutions 2,277 3,200 +922 +40.5% 0. 0% (1,536) (1,300) +236 - 0. 0% - - -
Elimination/Corporate (4,071) (4,100) (28) - (6,500) (6,890) (389) - - - -
Consolidated 311,410 343,000 +31,589 +10.1% 6,539 8,300 +1,760 +26.9% 2.1% 2.4% +0.3pt
Sales Operating income (loss) Operating income margin
Segment
5,075 5,900 +824 +16.3%

18
Reference
※ Units in billions of yen have been rounded to the nearest first decimal place. Units in millions of yen have been rounded down.

19
69.2 67.6 68.6 74.9 72.5
78.2 78.1 82.7
83.0
0.0 0.0
0.3%0.9% 1.6%
3.5%
1.4%
2.0% 1.6%3.2%
1.7%
0.0
10.0
20.0
30.0
40.0
50.0
60.0
70.0
80.0
90.0
100.0
1Q 2Q 3Q 4Q
1Q 2Q 3Q 4Q
Quarterly Sales and Income Trends
Net SalesOperating
Income Margin
FY18FY16 FY17 FY16 FY17 FY16 FY17 FY16 FY17
(Billions of yen)
Operating Income Margin FY16
Operating Income Margin FY17
Operating Income Margin FY18
(Millions of yen)
FY16 FY17 YoY FY18 YoY FY16 FY17 YoY FY16 FY17 YoY FY16 FY17 YoY
Net sales 69,231 72,458 +4.7% 82,997 +14.5% 67,636 78,160 +15.6% 68,613 78,070 +13.8% 74,915 82,720 +10.4%
Gross profit 13,372 15,256 +14.1% 18,051 +18.3% 13,628 16,675 +22.4% 13,529 16,083 +18.9% 16,086 19,013 +18.2%
SG&A expenses 13,156 14,222 +8.1% 16,599 +16.7% 13,048 15,090 +15.6% 12,446 14,844 +19.3% 13,476 16,331 +21.2%
Operating income 215 1,033 +378.9% 1,451 +40.5% 579 1,585 +173.8% 1,083 1,238 +14.4% 2,610 2,681 +2.7%
Ordinary income 174 1,006 +476.5% 1,222 +21.4% 585 1,628 +178.3% 1,039 1,313 +26.4% 2,520 2,683 +6.5%
Profit (Loss) attributable to owners of parent (539) 533 - △ 7 - (276) (62) - (98) (275) - 785 1,093 +39.3%
Gross profit margin 19.3% 21.1% +1.8pt 21.7% +0.6pt 20.1% 21.3% +1.2pt 19.7% 20.6% +0.9pt 21.5% 23.0% +1.5pt
SG&A expense ratio 19.0% 19.6% +0.6pt 20.0% +0.4pt 19.3% 19.3% +0.0pt 18.1% 19.0% +0.9pt 18.0% 19.7% +1.7pt
Operating income margin 0.3% 1.4% +1.1pt 1.7% +0.3pt 0.9% 2.0% +1.1pt 1.6% 1.6% +0.0pt 3.5% 3.2% (0.3)pt
Ordinary income margin 0.3% 1.4% +1.1pt 1.5% +0.1pt 0.9% 2.1% +1.2pt 1.5% 1.7% +0.2pt 3.4% 3.2% (0.2)pt
Profit attributable to owners of parent margin - 0.7% - - - - - - - - - 1.0% 1.3% +0.3pt
Q1 (June to August) Q2 (September to November) Q3 (December to February) Q4 (March to May)
Co
nso
lidate
d

20
Quarterly Sales and Income Trends by Segment
(Millions of yen)
Segment Q1 FY17 Q2 FY17 Q3 FY17 Q4 FY17 Q1 FY18 YoY Q1 FY17 Q2 FY17 Q3 FY17 Q4 FY17 Q1 FY18 YoY
Expert Services (Temporary Staffing)
37,172 41,319 40,224 41,135 43,626 +17.4%
Insourcing (Contracting)
19,449 19,747 21,248 23,984 22,094 +13.6%
HR Consulting, Education, Training, etc.
1,580 1,656 1,876 2,169 1,857 +17.6%
Global Sourcing (Overseas)
1,724 1,781 1,839 1,870 1,961 +13.7%
Subtotal 59,926 64,505 65,188 69,160 69,540 +16.0%
Career Solutions (Placement/Recruiting, Outplacement)
4,004 4,147 3,978 4,508 4,568 +14.1% 670 819 626 905 863 +28.9%
Outsourcing 7,775 8,473 8,118 8,288 7,933 +2.0% 1,184 1,330 1,757 1,939 1,684 +42.1%
Life Solutions 1,250 1,260 1,270 1,347 1,355 +8.4% 49 61 76 81 18 (62.6)%
Public Solutions 462 735 563 515 756 +63.6% (124) (607) (340) (463) (389) -
Eliminations and Corporate (961) (962) (1,047) (1,100) (1,157) - (1,597) (1,496) (1,610) (1,795) (1,887) -
Total 72,458 78,160 78,070 82,720 82,997 +14.5% 1,033 1,585 1,238 2,681 1,451 +40.5%
Operating income (loss)
851 1,479 729 2,015 1,162 +36.6%
Sales
21
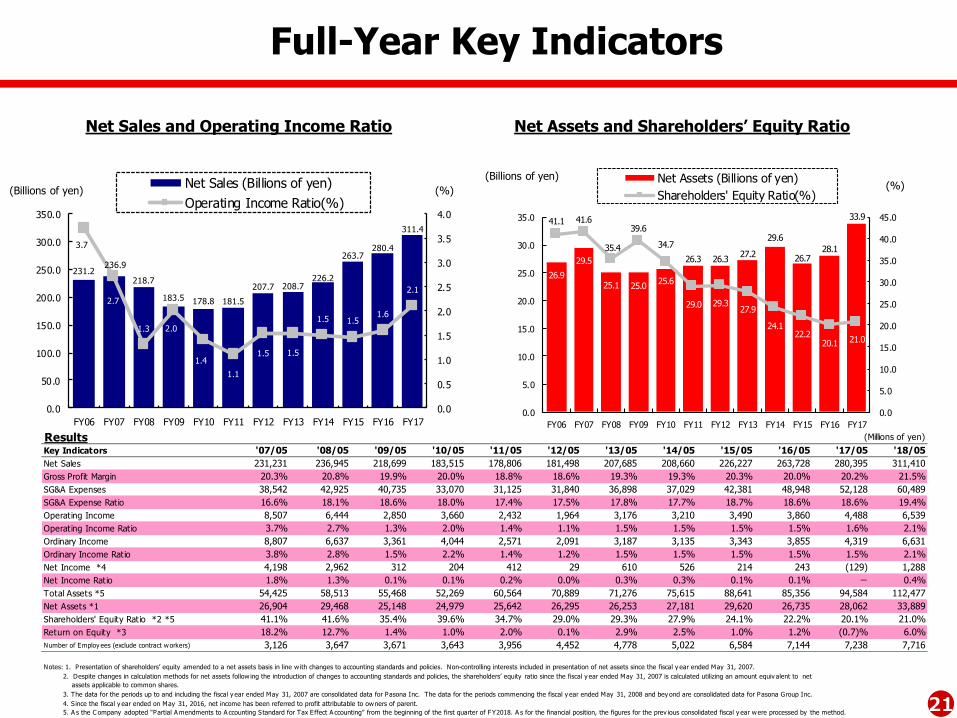
Full-Year Key Indicators
Net Assets and Shareholders’ Equity RatioNet Sales and Operating Income Ratio
(%) (%)(Billions of yen)
(Billions of yen)
231.2236.9
218.7
183.5 178.8 181.5
207.7 208.7226.2
263.7280.4
311.4
3.7
2.7
1.3 2.0
1.4
1.1
1.5 1.5
1.5 1.51.6
2.1
0.0
0.5
1.0
1.5
2.0
2.5
3.0
3.5
4.0
0.0
50.0
100.0
150.0
200.0
250.0
300.0
350.0
FY06 FY07 FY08 FY09 FY10 FY11 FY12 FY13 FY14 FY15 FY16 FY17
Net Sales (Billions of yen)
Operating Income Ratio(%)
26.9
29.5
25.1 25.025.6
26.3 26.327.2
29.6
26.728.1
33.941.1 41.6
35.4
39.6
34.7
29.0 29.327.9
24.122.2
20.1 21.0
0.0
5.0
10.0
15.0
20.0
25.0
30.0
35.0
40.0
45.0
0.0
5.0
10.0
15.0
20.0
25.0
30.0
35.0
FY06 FY07 FY08 FY09 FY10 FY11 FY12 FY13 FY14 FY15 FY16 FY17
Net Assets (Billions of yen)
Shareholders' Equity Ratio(%)
Results (Millions of yen)
Key Indicators '07/05 '08/05 '09/05 '10/05 '11/05 '12/05 '13/05 '14/05 '15/05 '16/05 '17/05 '18/05
Net Sales 231,231 236,945 218,699 183,515 178,806 181,498 207,685 208,660 226,227 263,728 280,395 311,410
Gross Profit Margin 20.3% 20.8% 19.9% 20.0% 18.8% 18.6% 19.3% 19.3% 20.3% 20.0% 20.2% 21.5%
SG&A Expenses 38,542 42,925 40,735 33,070 31,125 31,840 36,898 37,029 42,381 48,948 52,128 60,489
SG&A Expense Ratio 16.6% 18.1% 18.6% 18.0% 17.4% 17.5% 17.8% 17.7% 18.7% 18.6% 18.6% 19.4%
Operating Income 8,507 6,444 2,850 3,660 2,432 1,964 3,176 3,210 3,490 3,860 4,488 6,539
Operating Income Ratio 3.7% 2.7% 1.3% 2.0% 1.4% 1.1% 1.5% 1.5% 1.5% 1.5% 1.6% 2.1%
Ordinary Income 8,807 6,637 3,361 4,044 2,571 2,091 3,187 3,135 3,343 3,855 4,319 6,631
Ordinary Income Ratio 3.8% 2.8% 1.5% 2.2% 1.4% 1.2% 1.5% 1.5% 1.5% 1.5% 1.5% 2.1%
Net Income *4 4,198 2,962 312 204 412 29 610 526 214 243 (129) 1,288
Net Income Ratio 1.8% 1.3% 0.1% 0.1% 0.2% 0.0% 0.3% 0.3% 0.1% 0.1% ー 0.4%
Total Assets *5 54,425 58,513 55,468 52,269 60,564 70,889 71,276 75,615 88,641 85,356 94,584 112,477
Net Assets *1 26,904 29,468 25,148 24,979 25,642 26,295 26,253 27,181 29,620 26,735 28,062 33,889
Shareholders' Equity Ratio *2 *5 41.1% 41.6% 35.4% 39.6% 34.7% 29.0% 29.3% 27.9% 24.1% 22.2% 20.1% 21.0%
Return on Equity *3 18.2% 12.7% 1.4% 1.0% 2.0% 0.1% 2.9% 2.5% 1.0% 1.2% (0.7)% 6.0%
Number of Employ ees (exclude contract workers) 3,126 3,647 3,671 3,643 3,956 4,452 4,778 5,022 6,584 7,144 7,238 7,716
Notes: 1. Presentation of shareholders’ equity amended to a net assets basis in line w ith changes to accounting standards and policies. Non-controlling interests included in presentation of net assets since the fiscal y ear ended May 31, 2007.
2. Despite changes in calculation methods for net assets follow ing the introduction of changes to accounting standards and policies, the shareholders’ equity ratio since the fiscal y ear ended May 31, 2007 is calculated utilizing an amount equiv alent to net
assets applicable to common shares.
3. The data for the periods up to and including the fiscal y ear ended May 31, 2007 are consolidated data for Pasona Inc. The data for the periods commencing the fiscal y ear ended May 31, 2008 and bey ond are consolidated data for Pasona Group Inc.
4. S ince the fiscal y ear ended on May 31, 2016, net income has been referred to profit attributable to owners of parent.
5. A s the C ompany adopted "Partial A mendments to A ccounting Standard for Tax Effect A ccounting” from the beginning of the first quarter of FY2018. A s for the financial position, the figures for the prev ious consolidated fiscal y ear were processed by the method.

22
Financial
companies
2,905,400
(6.97%)
Securities
companies
639,423
(1.53%)
Other
corporations
5,086,997
(12.20%)
Foreign
corporations and
other foreign
investors
10,007,458
(24.01%)
Individuals
and others
20,952,242
(50.26%)
Treasury
stock
2,098,780
(5.03%)
Financial companies 29 (0.28%)
Securities companies35 (0.33%)
Other corporations 117 (1.11%)
Foreign corporations and other foreign
investors 174 (1.65%)
Individuals and others 10,173
(96.62%)
Treasury stock 1 (0.01%)
Stock Information (As of May. 31, 2018)
Breakdown of Shareholders by Type Breakdown of Shareholders by Number of Share Held
1. The Company's treasury stock (2,098,780 shares, 5.03% of total issued shares) ranked third. In accordance with Article 308.2 of the Corporations Law, there are no voting rights attached to treasury stock.
2. Pasona Group received a notification from Tempered Investment Management LTD. , that it held 2,550,800 shares as of June 12, 2018 outlined the delivery of a Substantial
Shareholding Report submitted to the Kanto Local Finance Bureau on June 14, 2018. As the Company is unable to confirm the number of shares held as of 31 May, 2018, Tempered Investment Management
LTD. has been omitted from the list of major shareholders identified.
Total
10,529people
Total
41,690,300shares
Principal Shareholders No. of Shares Held %
Yasuyuki Nambu 14,763,200 35.41%
Nambu Enterprise Inc. 3,737,800 8.97%
Pasona Group Inc. 2,098,780 5.03%
BNYM NON-TREATY DTT 1,986,600 4.77%
OASIS INVESTMENTS Ⅱ MASTER FUND LTD. 1,251,000 3.00%
JP MORGAN CHASE BANK 380621 817,500 1.96%
Credit Suisse AG Hong Kong Trust A/C Client 690,800 1.66%
Pasona Group Employees' Shareholding Association 642,800 1.54%
Gratitude Inc. 596,600 1.43%
State Street Bank and Trust Company 505004 585,100 1.40%

23
Expert Services, Insourcing HR Consulting, Education and Training, Others
Pasona Inc.
Pasona Tech, Inc.
Pasona Okayama Inc.
PASONA LOGICOM Inc.
Pasona Masters Inc.
Pasona Marketing, Inc.
Pasona Agri-Partners Inc.
Pasona Tech Systems Inc.
Shin nihon kogyo Co.,Ltd.
Pasona Tquila Inc.
Nagasaki diamond staff
Global Sourcing
Pasona N A, Inc. PASONA CANADA, INC.
Pasona Taiwan Co., Ltd. Pasona Singapore Pte. Ltd.
Pasona Asia Co., Limited PT Pasona HR Indonesia
Pasona Korea Co., Ltd Pasona India Private Limited
MGR Consulting Co., Ltd Pasona Tech Vietnam Co., Ltd.
Pasona Human Resources (Shanghai) Co., Ltd.
Pasona HR Consulting Recruitment (Thailand) Co., Ltd.
Pasona Education Co. Limited
Pasona HR Malaysia Sdn. Bhd.
PT. Dutagriya Sarana
CAPLAN (Thailand) Co., Ltd. Others
Pasona Fortune Inc.
CAPLAN Corporation
YASKAWA BUSINESS STAFF CORPORATION
Bewith, Inc.
Asahi Beer Communications Co, Ltd.
ECOLOVE Inc.
Pasona Panasonic Business Service Co.,Ltd
Pasona Knowledge Partner Inc.
Pasona Job Support Inc.
Pasona Human Solutions Inc.
Smart Style Co.,Ltd.
Job-Hub Inc.
Outsourcing
Pasona Inc.
Career Solutions
Benefit One Inc.
Benefit One Health care Inc.
Benefit One Solutions Inc.
Benefit One Payroll Inc.
Benefit One Asia Pte. Ltd.
贝那商务咨询(上海)有限公司
Benefit One USA,INC.
Benefit One(THAILAND)Co., Ltd.
PT. BENEFIT ONE INDONESIA
Benefit One Deutschland GmbH
REWARDZ PRIVATE LIMITED
DG1 Inc.
National Examination Center Inc.*
Life Solutions
Pasona Foster Inc.
Pasona Life Care Inc.
Public Solutions
Pasona Heartful Inc.
Pasona Furusato Incubation Inc.
Tango Kingdom Inc.
Pasona Tohoku Sousei Inc.
Nijigennomori Inc. Others *
Group Companies (by segment)
● Consolidated subsidiaries 69Equity-method affiliates 11* (As of Aug. 31, 2018)
Others *
Others
Others *

24
Corporate Information
Tokyo Stock Exchange, 1st Section 2168
9,050 (Consolidated, including contract workers)Number of Employees
Subsidiaries 69 , Affiliates 11
5,000 million yenPaid-in Capital
Yasuyuki NambuRepresentative
Expert Services (Temporary staffing), Insourcing (Contracting), HR Consulting, education and training, othersGlobal Sourcing (Overseas)Career Solutions (Placement/Recruiting, Outplacement )Outsourcing Life Solutions, Public Solutions
Business Activities
December 3, 2007
(Founding February 1976)Established
www.pasonagroup.co.jp/english/
Shin Marunouchi Bldg.1-5-1, Marunouchi, Chiyoda-ku,Tokyo 100-6514
Headquarters
Pasona Group Inc.Corporate Name
ConsolidatedGroup Companies
URL
(As of Aug. 31, 2018)
Comprehensive Group officeOtemachi 2-6-2 Chiyoda-ku,Tokyo 100-8228
Phone 03-6734-0200