Embed Size (px)
Citation preview
Pag e 0 / 14
Results as of 30 September 2017
Free t rans la t i on f rom the or ig ina l in Span ish . In the event o f d i screpancy, the Span ish - language ve rs ion preva i ls
Pag e 1 / 14
DISCLAIMER
This document has been drawn up in good fa i th upon the bas is o f the data and fac ts
ava i l ab le on the day o f i t s pub l i ca t ion and shou ld be read together w i th a l l the pub l ic
in fo rma t ion p rov ided and /or pub l ished by ACERINOX, S .A.
Th is documen t may con ta in s ta tements wi th r egard to the fu ture i n ten t ions, fo recas ts
and es t imates o f ACERINOX, S .A. and i t s bus iness . These types o f s ta temen ts and/or
con ten ts may inc lude dec lara t ions or expecta t i ons wi th regard to the cur rent p lans,
ob jec t ives and fo recasts o f the company and i ts g roup, i nc lud ing dec lara t ions
concern ing t rends or c i r cumstances wh ich migh t a f fec t i t s cur ren t f i nanc ia l s i tua t i on
and i t s ra t ios , resu l ts , s t ra teg ies , p roduct ion leve ls , expend i tu re , cos ts , exchange
ra tes , i nv estmen ts and/o r d iv idend po l icy . I t may a l so con ta in re ferences to t he
s i t ua t ion and t rends o f the market o f raw mater ia ls , espec ia l ly n icke l and chrome.
These s ta tements and conten ts have been issued in good fa i th , upon the bas is o f the
knowledge and in f ormat ion ava i lab le on the da te o f th is announcement and, desp i te
be ing reasonab le , do not const i tu te a guarantee o f fu tu re compl iance. These
s ta tements and con ten ts are sub jec t t o r i sks , uncer ta in t ies , changes and s i tua t i ons
beyond the cont ro l o f ACERINOX, S.A. , mean ing tha t they may no t comply , in fu l l o r in
par t , w i t h wha t i s expec ted and/or dec lared.
Except t o the ex tent r equ i red by the app l i cab le law, ACERINOX, S.A. does no t assume
any ob l i ga t ion to pub l i c l y upda te i t s fu tu re dec la ra t i ons and s ta tement s , even when new
data are pub l ished or fu r ther un foreseen events wh ich might a f fec t them ar ise .
ACERINOX, S.A. p rov ides in fo rmat ion on the above and o ther f ac tors wh ich may a f fec t
i t s fu tu re s ta tements concern ing i ts bus iness, expecta t i ons and/or f inanc ia l resu l t s in
the documents i t subm i t s to the Span ish Na t iona l Secur i t ies Market Commiss ion . A l l
in te res ted par t i es are i nv i t ed to v iew these documents .
Ne i ther t h i s document nor the i n fo rmat ion conta ined here in const i tu te an o f fe r to se l l ,
purchase or exc hange or an inv i ta t ion to make an o f fe r to buy , purchase or exchange,
o r a r ecommenda t ion or adv i ce regard ing any asse t o r f inanc ia l i ns t r ument issued by
the Acer inox Group. Any person who acqu i res asse ts shou ld do so upon the bas is o f
h is o r her own judge men t a f te r r ece iv ing the pro fess iona l adv ice deemed appropr ia te .
No k ind o f i nvestmen t ac t i v i t y shou ld be per fo rmed upon the bas is o f the in fo rmat ion or
fo recas ts conta ined in th is documenta t i on .
Ne i ther ACERINOX, S .A . nor i t s subs id ia r ies assume l iab i l i t y o f any k ind fo r the
damages wh ich may ar ise f rom any use o f th is document or i t s con ten ts .
Pag e 2 / 14
Presentation of the results for the third quarter of 2017 via
webcast and conference call
Acer inox wi l l ho ld a presen ta t ion fo r the resu l t s o f the th i rd quar te r o f 2017, in
Eng l ish , on 31 Oc tober , a t 10 .00 am CET, conducted by the CFO, Mr Migue l Fe r ra nd is ,
and accompan ied by the Investor Re la t ions team.
To Access the presen ta t i on v ia conference ca l l you can use one o f the fo l l ow ing
numbers 5 -10 m inu tes before the event beg ins :
Ca l l s f r om the Un i ted K ingdom: +44 2030432440
Ca l l s f r om Spa in and the res t o f the wor ld : +34 914142021
These numbers must be fo l lowed by the p incode be low: 90652016#
The presenta t i on can be fo l l owed f rom the webs i te o f Acer ino x (www.acer inox .com) , i n
the sect ion o f Shareho lders and Inves tor s .
The presenta t i on and a l l the aud io -v isua l ma ter ia l w i l l be ava i lab le on the Acer inox
webs i te .
Pag e 3 / 14
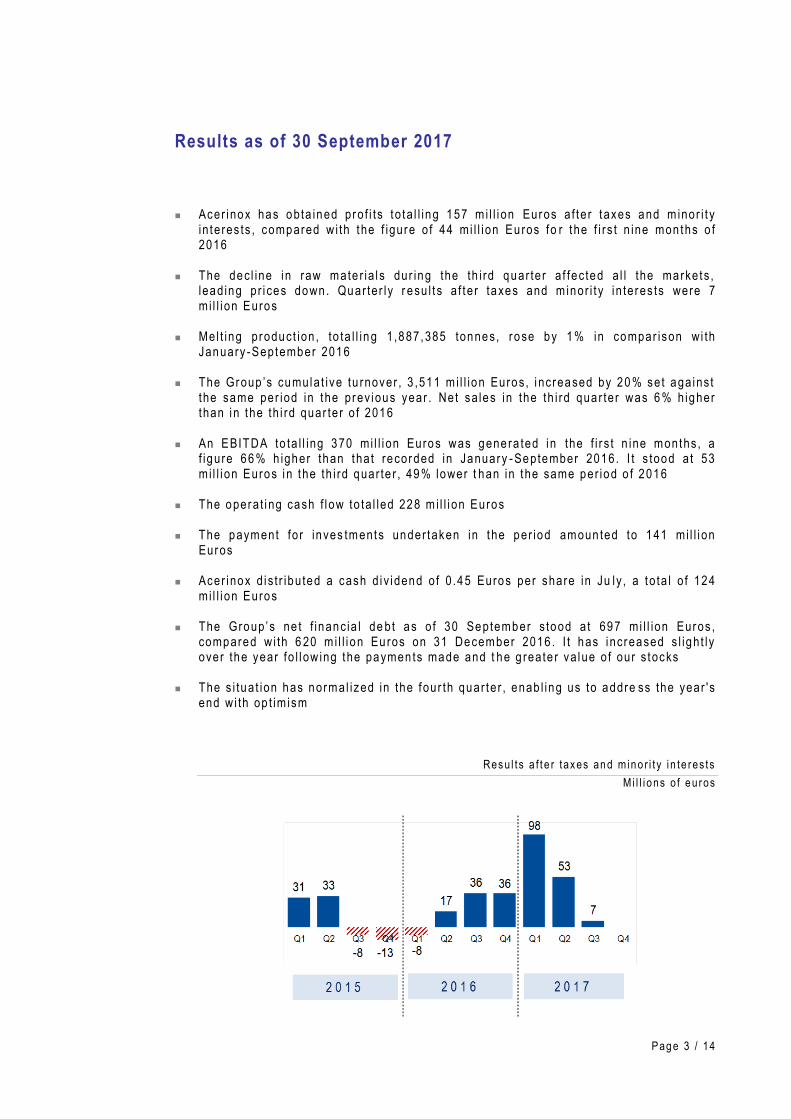
Results as of 30 September 2017
Acer inox has obta ined pro f i ts t o ta l l ing 157 m i l l i on Euros a f te r t axes and m inor i t y in te res ts , compared w i th t he f igure o f 44 mi l l ion Eu ros fo r t he f i rs t n ine mon ths o f 2016
The dec l ine i n raw mate r ia l s dur ing the th i rd quar te r a f fec ted a l l the markets , lead ing pr i ces down . Quar ter ly r esu l t s a f t e r taxes and m inor i t y i n te res ts were 7 mi l l i on Euros
Mel t ing product ion , to ta l l in g 1 ,887,385 tonnes, r ose by 1 % in compar ison wi th January -September 2016
The Group ’s cumula t ive tu rnover , 3 ,511 m i l l ion Euros, i ncreased by 20 % set aga ins t the same per iod in t he prev ious year . Net sa les in the th i rd qua r te r was 6 % h igher than in t he th i rd quar te r o f 2016
An EBITDA to ta l l ing 370 mi l l i on Euros was gene ra ted in the f i r s t n ine months, a f igure 66 % h igher than tha t recorded in January -September 2016. I t s tood a t 53 mi l l i on Euros i n t he th i rd quar te r , 49 % lower t han in t he same per iod o f 2016
The opera t i ng cash f l ow to ta l led 228 m i l l i on Euros
The payment fo r inves tments under taken in t he per iod amoun ted to 141 mi l l i on Euros
Acer inox d i s t r ibu ted a cash d i v idend o f 0 .45 Euros per share in Ju ly , a t o ta l o f 124
mi l l i on Euros
The Group ’s ne t f inanc ia l de bt as o f 30 September s tood a t 697 mi l l ion Euros , compared w i th 6 20 m i l l i on Eu ros on 31 December 2016 . I t has i ncreased s l igh t ly over the year fo l l ow ing the paymen ts made and t he g reate r va lue o f our s tocks
The s i tua t ion has normal ized in the four th quar ter , enab l ing us to addre ss the year 's end w i th op t im ism
Res u l t s a f t e r tax es an d min o r i t y i n te res ts
M i l l i o ns o f e u ros

Pag e 4 / 14
Stainless Steel Market
Wor ld s ta in less s tee l p roduct ion i ncreased by 5 % in the f i r s t ha l f o f the year , accord ing
to t he la tes t ava i lab le da ta prov ided by the In ternat iona l S ta in less Stee l Forum ( ISSF) .
The inc reased product ion i n a l l r eg ions is wor th h igh l igh t ing .
The s ta in less s tee l market in the th i rd quar te r was marked by fa l l s in t he pr i ces o f raw
mater ia ls .
The p r i ce o f fe r rochrome in the th i r d quar te r s tood a t 110US¢/Lb, equ iva len t to a 29 %
decrease f rom the f igure o f 154US¢/Lb recorded in t he second quar ter .
Ave ra ge q ua r te r l y p r i c e o f fe r roc h ro me
US ¢/ Lb . C r
Th is d rop , together w i th t he ad jus tment o f the n icke l p r ice th roughou t June and the
f i rs t ha l f o f Ju ly , led to sharp fa l ls i n a l loy su rcharges and pressure the bas e pr i ces
and sa les vo lumes.
Of f i c i a l p r i ce o f n i cke l o n th e L . M.E .
20 16 - S ep te mb e r 20 17
Pag e 5 / 14
The per fo rmance o f under l y ing demand has remained pos i t i ve in a l l the marke ts .
In the European market , accord ing to our es t imates , apparent consumpt ion con t inued
to increase by +3 %, i n the th i rd quar te r . In ma jor markets we can po in t t o r i ses in I ta ly
+2 %, Germany +3 % and Spa in +5 %, wh i l e France remains s tagnant . Impor t s o f ho t -
ro l l ed produc ts increased s ign i f icant ly , most ly f r om China, a long w i th co ld - ro l led
products f rom Ta iwan.
The inventor ies were ad jus ted in l a te August and now s tand a t norma l i zed leve ls , as
we fo recast in the Note accompany ing our Second -Quar te r Resu l ts .
F ina l demand rema ins hea l t hy , w i th increases in the ma in sectors , acco rd ing to
EUROFER’s es t i mates fo r the year 2017 (updated in October ) : car p roduc t ion r i se by
+3 %, const ruc t i on by +4 % and wh i te goods by + 1 %.
In t he United States , the market demand fo r bo th hot and co ld - ro l l ed products remains
hea l thy .
The f ina l sec tors cont inue to per fo rm we l l . Accord ing to our es t imates , t he const ruc t ion
sec tor rose by +5 % unt i l August in compar ison w i th t he same per iod the p rev ious year ,
wh i le hous eho ld app l iances increased by +6 % un t i l September . The car sector f e l l by
8% f rom i ts peak leve ls un t i l Sep tember .
The manufac turer s o f equ ipment fo r the food indus t ry main ta ined s t rong demand
dur ing the f i r s t n ine mon ths o f 2017, and the ind i ca tor s re f lec t the same t r end in the
four th quar ter . The above -men t ioned downturn o f the car sector is o f f se t by heavy
t ranspor t veh ic les ( t rac to rs , vans and lo r r ies) , espec ia l l y those assoc ia ted wi th the
food indust r y .
Inventor ies i n the d i s t r i bu t ion sector increased s l igh t l y towards the end o f t he quar ter
as a resu l t o f the h igher number o f purchases, b rought about by the expec ted increase
in the a l loy surcharge in September .
Nor th Amer i can Sta in less (NAS) ach ieved a pr i ce r i se o f about 80 USD per t onne fo r
September .
South Af r ican marke t cond i t ions remain very d i f f i cu l t and leve ls o f sa les ( -8 %) and
ac t iv i t y were l ow th roughout the th i r d quar te r , due to the s i t ua t ion in the count r y and
the va lue o f the rand .
T rade ac t iv i ty leve ls a t the year end tend to be low, bu t th i s year the greate r
compet i t i veness ach ieved by the rand may c or rec t th i s e f fec t , as can be observed in
the min ing and car sectors .
Pag e 6 / 14
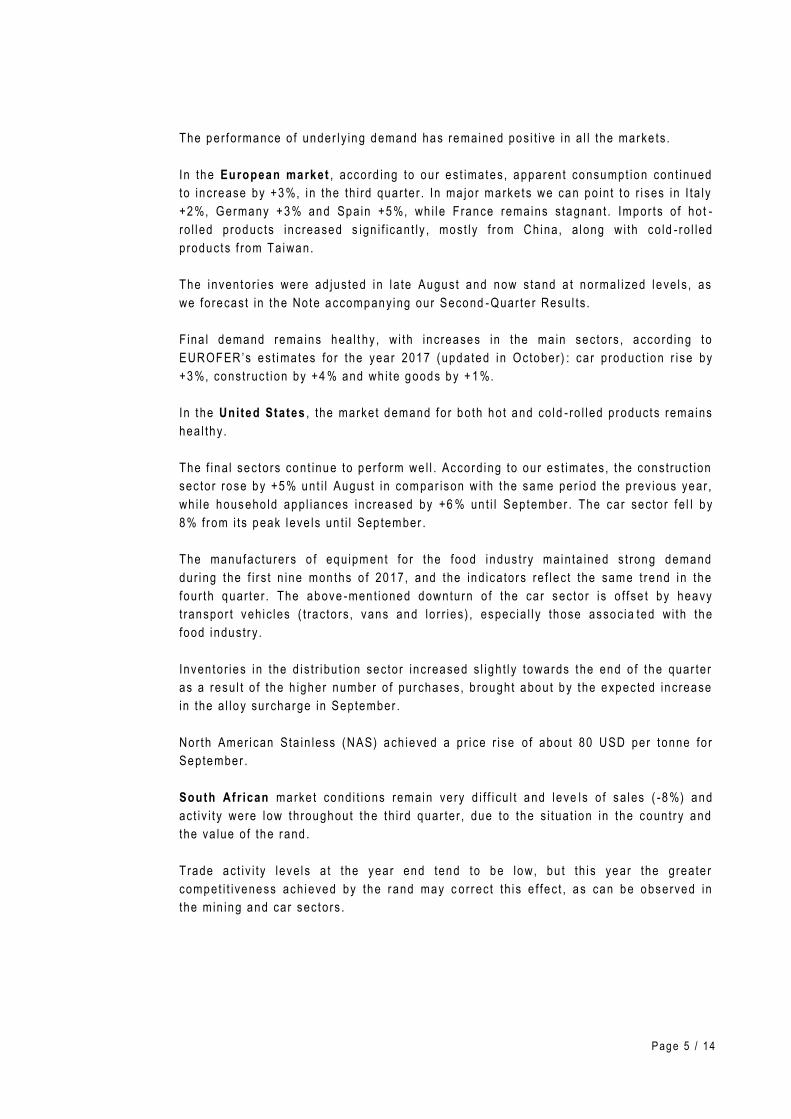
Pr i c es o f S ta i n l ess S te e l Co i l | 2 . 0m m c o ld - ro l l e d A IS I 30 4
20 15 – Se p 2 01 7
S o u rce : P l a t t s
In China , the i nventor ies a t t he Wux i and Foshan warehouses rema in be low average.
The f ina l sec tors cont inue to grow s ign i f i can t l y . Accord ing to our es t imates , car
p roduct ion i s increas ing by 5 %, const ruc t ion by 9 % and househo ld app l i ances by 12 %.
The Malaysian government has imposed prov i s iona l an t i - dumping dut ies on impor t s o f
co ld - ro l l ed s ta in less s tee l f rom China, South Korea, Ta iwan and Tha i l and , fo l lowing
the conf i rmat ion tha t there is su f f ic ien t ev idence to cont inue i ts invest iga t i on .
Due to env i ronmenta l p rob lems, many fac tor ies in Ch ina have ha l ted the i r p roduct ion
o f g raph i te e lec t rodes unt i l they unde r take the re forms enac ted by the i r gove rnmen t , a
fac tor wh ich is s ign i f i cant l y a f fec t ing the pr ices and vo lumes o f th i s p roduc t .
Pag e 7 / 14
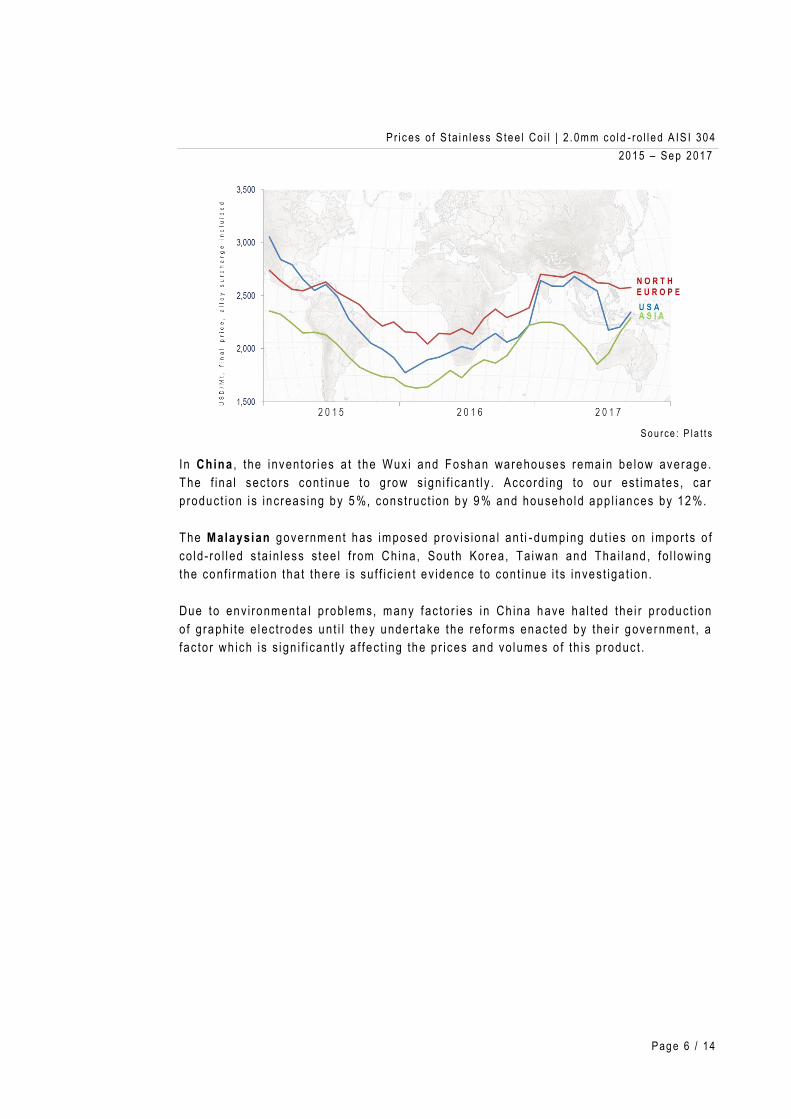
Production
Throughout the January -September per iod , Acer inox ’ s mel t ing p roduct ion , 1 ,887,385
tonnes , i ncreased by 1 % in compar i son w i th the p rev ious year .
Qua r te r l y M e l t i n g Sh op P rod uc t i on
Tho usa nds o f Mt
Simi la r ly , the manufac ture o f ho t - ro l led f l a t p roducts , 1 ,670 ,329 tonnes, was 1% h igher
than in t he January -Sep tember per iod o f 2016.
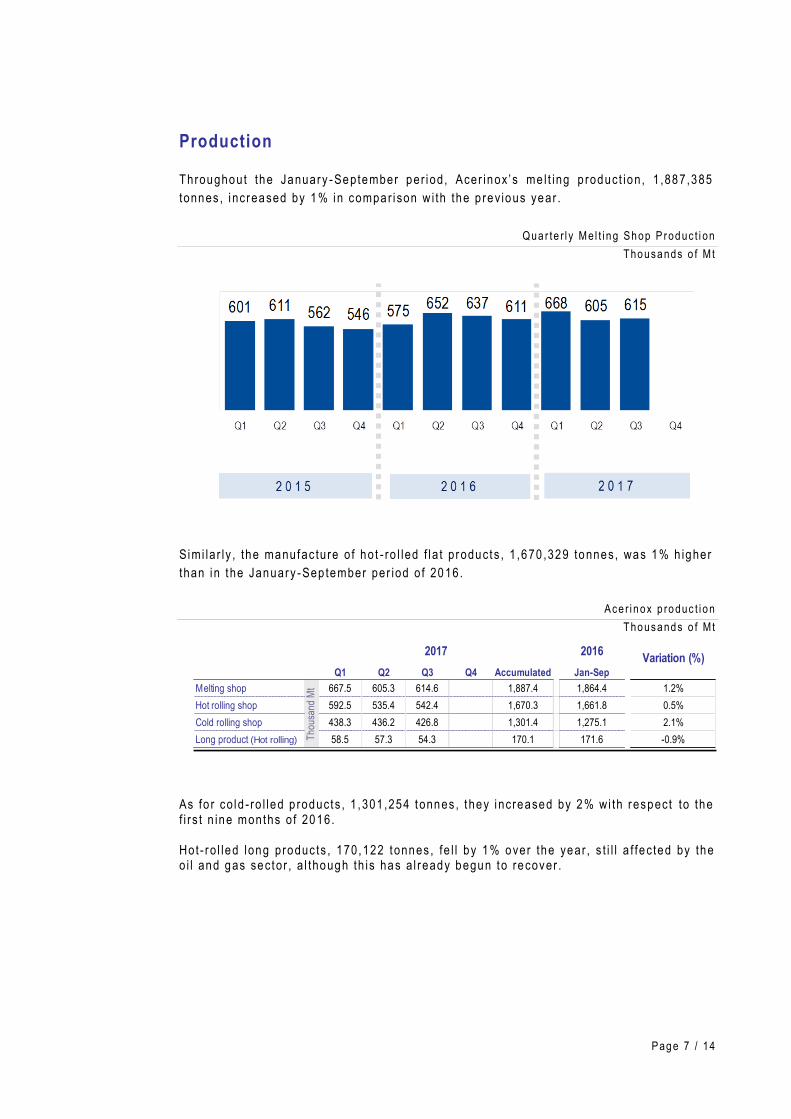
Ace r i n ox p ro duc t i o n
Tho usa nds o f Mt
As fo r co ld - ro l led p roducts , 1 ,301 ,254 tonnes , t hey i ncreased by 2 % wi th r espect to the f i rs t n ine months o f 2016. Hot - r o l led long produc ts , 170,122 tonnes , fe l l by 1% over the year , s t i l l a f fec ted by the o i l and gas sector , a l though th is has a l r eady begun to recover .
2016
Q1 Q2 Q3 Q4 Accumulated Jan-Sep
Melting shop 667.5 605.3 614.6 1,887.4 1,864.4 1.2%
Hot rolling shop 592.5 535.4 542.4 1,670.3 1,661.8 0.5%
Cold rolling shop 438.3 436.2 426.8 1,301.4 1,275.1 2.1%
Long product (Hot rolling) 58.5 57.3 54.3 170.1 171.6 -0.9%Tho
usan
d M
t
2017Variation (%)
Pag e 8 / 14
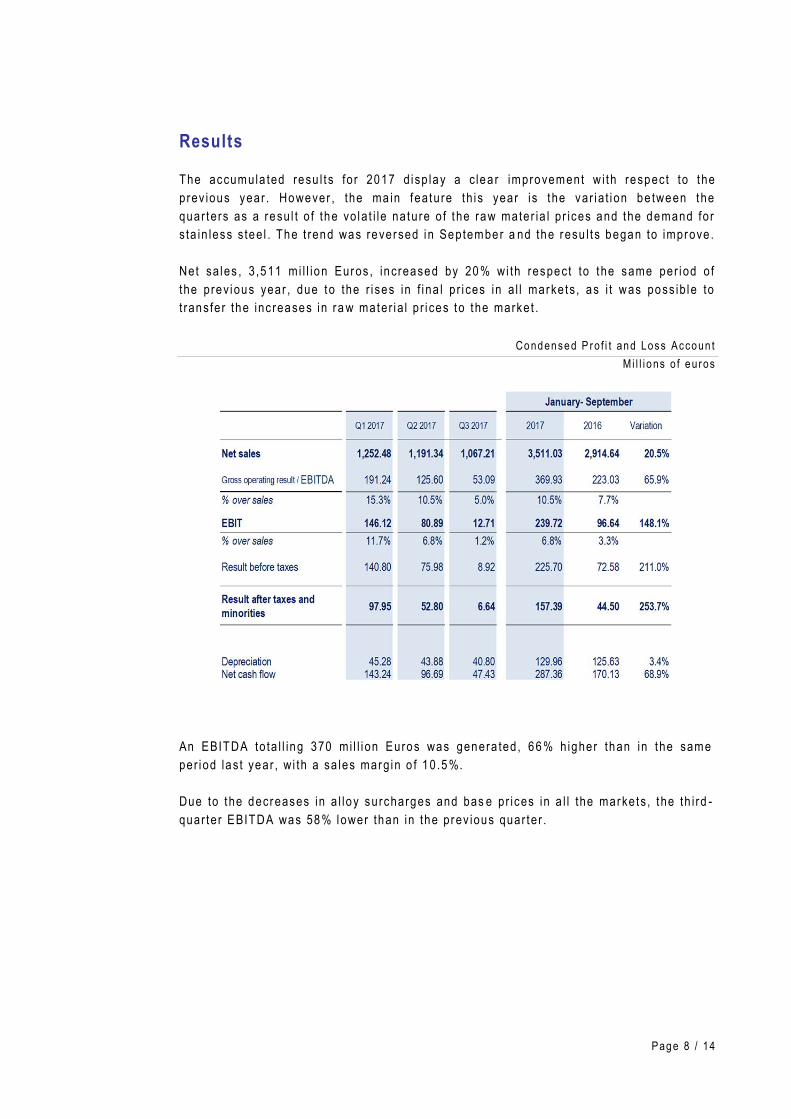
Results
The accumula ted resu l t s fo r 2017 d i sp lay a c lea r improvement w i th respect to t he
prev ious year . However , the ma in fea ture th i s year is t he var ia t i on be tween the
quar ters as a resu l t o f the vo la t i le na ture o f t he raw mater ia l p r ices and the demand fo r
s ta in less s tee l . The t rend was reversed in September a nd the resu l t s began to improve .
Net sa les , 3 ,511 mi l l ion Euros , increased by 20 % wi th respect to t he same per iod o f
the prev ious year , due to the r i ses in f i na l p r i ces in a l l markets , as i t was poss ib le to
t ransfer the inc reases in r a w mater ia l p r i ces to t he market .
Co nd en se d P ro f i t an d Loss Acco un t
M i l l i o ns o f e u ros
An EBITDA to ta l l ing 370 mi l l i on Euros was genera ted, 66 % h igher than in t he same
per iod las t year , w i th a sa les marg in o f 10 .5 %.
Due to t he decreases in a l loy surcharges and bas e pr ices in a l l the markets , t he th i rd -
quar ter EBITDA was 58 % lower than in the prev ious quar ter .
Pag e 9 / 14
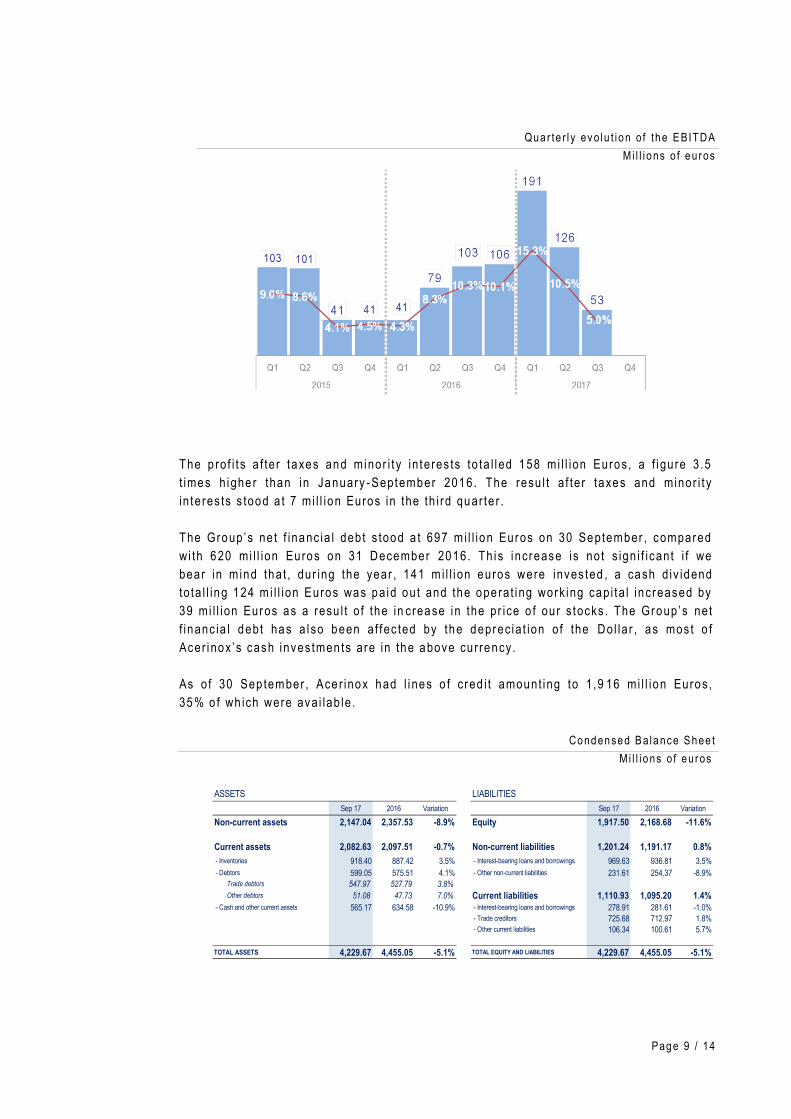
Qua r te r l y ev o lu t i o n o f th e E BITDA
Mi l l i o ns o f e u ros
The p ro f i t s a f te r taxes and minor i t y in te res ts to ta l l ed 158 mi l l ion Euros, a f i gure 3 .5
t imes h ighe r than in January -September 2016. The resu l t a f te r taxes and minor i t y
in te res ts s tood a t 7 mi l l ion Euros in the th i rd quar te r .
The Group ’s ne t f inanc ia l debt s tood a t 697 m i l l ion Euros on 30 September , compared
wi th 620 mi l l ion Euros on 31 December 2016. Th is i ncrease is no t s ign i f icant i f we
bear in m ind tha t , dur ing the year , 141 m i l l i on euros were inves ted , a cash d iv idend
to ta l l ing 124 m i l l ion Euros was pa id ou t and the ope ra t i ng work ing cap i ta l increased by
39 mi l l ion Euros as a resu l t o f the in crease in the pr ice o f our s tocks . The Group ’s net
f inanc ia l debt has a l so been a f fec ted by the deprec ia t ion o f the Do l la r , as mos t o f
Acer inox ’ s cash inves tmen ts are in the above cur rency.
As o f 30 Sep tember , Ace r inox had l i nes o f c red i t amount ing to 1 ,9 16 mi l l ion Euros,
35 % o f wh ich were ava i lab le .
Co nd en se d B a la nc e S h ee t
Mi l l i o ns o f e u ros
ASSETS LIABILITIES
Sep 17 2016 Variation Sep 17 2016 Variation
Non-current assets 2,147.04 2,357.53 -8.9% Equity 1,917.50 2,168.68 -11.6%
Current assets 2,082.63 2,097.51 -0.7% Non-current liabilities 1,201.24 1,191.17 0.8%
- Inventories 918.40 887.42 3.5% - Interest-bearing loans and borrowings 969.63 936.81 3.5%
- Debtors 599.05 575.51 4.1% - Other non-current liabilities 231.61 254.37 -8.9%
Trade debtors 547.97 527.79 3.8%
Other debtors 51.08 47.73 7.0% Current liabilities 1,110.93 1,095.20 1.4% - Cash and other current assets 565.17 634.58 -10.9% - Interest-bearing loans and borrowings 278.91 281.61 -1.0%
- Trade creditors 725.68 712.97 1.8%
- Other current liabilities 106.34 100.61 5.7%
TOTAL ASSETS 4,229.67 4,455.05 -5.1% TOTAL EQUITY AND LIABILITIES 4,229.67 4,455.05 -5.1%

Pag e 10 / 1 4
The opera t i ng work ing cap i ta l s tood a t 741 m i l l ion Euros , compared w i th 702 mi l l ion
Euros on 31 December 2016.
We shou ld men t ion the s ign i f i can t fa l l i n opera t ing work ing cap i ta l , 132 mi l l ion Eu ros ,
under taken dur ing the th i r d quar te r .
Ope ra t i ng W ork i ng Ca p i t a l
M i l l i o ns o f e u ros
As a resu l t o f the above , the opera t i ng cash f l ow to ta l led 228 mi l l ion Euros, enab l i ng
the Group to ma in ta in the pace o f i t s inves tments , 141 mi l l ion Euros, and the payment
o f d iv idends to ta l l ing 124 mi l l i on Euros.
Cas h F l o w
Jan -S ep 2 01 7 . M i l l i o ns o f e u ros

Pag e 11 / 1 4
Co nd en se d S ta te me nt o f Ca sh F l ow
Mi l l i o ns o f e u ros
Investments
Las t 27 Oc tober w i tnessed the o f f ic ia l open ing o f t he new manu factur ing l i nes a t NAS
( the new br igh t annea l i ng –BA- l i ne and the co ld - ro l l ing mi l l ) , i n the presence o f the
Governo r o f Kentucky and the Board o f D i rec tors o f Acer inox.

Pag e 12 / 1 4
Outlook
The th i r d quar te r behaved as we fo recast in Ju ly , and the reversa l o f t he t rend we
announced then has occur red too .
Th is re in for ces our op t im ism towards the four th quar ter , in te rms o f bo th ac t iv i t y and
pr ices and marg ins .
The 2017 f inanc ia l year w i l l end w i th resu l t s wh ich re f l ec t the recovery o f the market
and improved marg ins , as a r esu l t o f the sav ings ach ieved by the Exce l lence P lans.
The income genera ted w i l l enab le us to ma in ta in our s t ra teg ic i nves tmen t p lan and
con t inue w i th shareho lder remuner a t ion .
Pag e 13 / 1 4
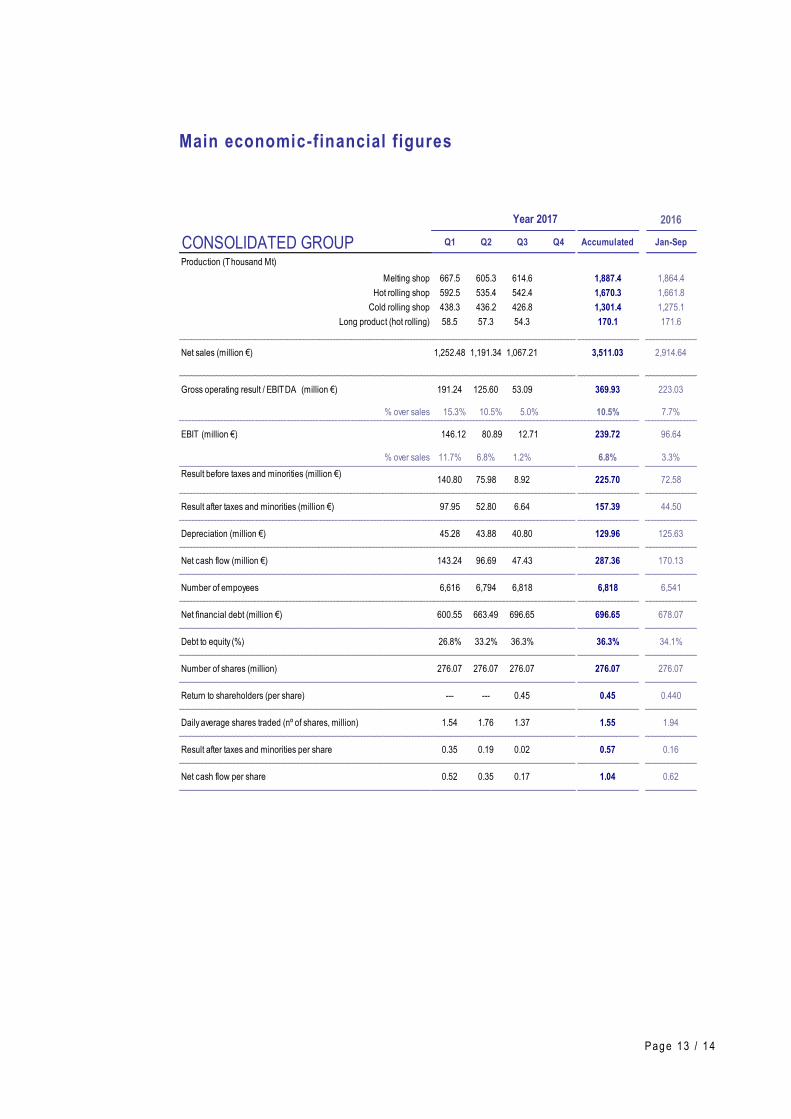
Main economic-financial figures
2016
CONSOLIDATED GROUP Q1 Q2 Q3 Q4 Accumulated Jan-Sep
Production (Thousand Mt)
Melting shop 667.5 605.3 614.6 0.0 1,887.4 1,864.4
Hot rolling shop 592.5 535.4 542.4 0.0 1,670.3 1,661.8
Cold rolling shop 438.3 436.2 426.8 0.0 1,301.4 1,275.1
Long product (hot rolling) 58.5 57.3 54.3 0.0 170.1 171.6
Net sales (million €) 1,252.48 1,191.34 1,067.21 0.00 3,511.03 2,914.64
Gross operating result / EBITDA (million €) 191.24 125.60 53.09 0.00 369.93 223.03
% over sales 15.3% 10.5% 5.0% 0.0% 10.5% 7.7%
EBIT (million €) 146.12 80.89 12.71 0.00 239.72 96.64
% over sales 11.7% 6.8% 1.2% 0.0% 6.8% 3.3%
Result before taxes and minorities (million €)140.80 75.98 8.92 0.00 225.70 72.58
Result after taxes and minorities (million €) 97.95 52.80 6.64 0.00 157.39 44.50
Depreciation (million €) 45.28 43.88 40.80 0.00 129.96 125.63
Net cash flow (million €) 143.24 96.69 47.43 0.00 287.36 170.13
Number of empoyees 6,616 6,794 6,818 0 6,818 6,541
Net financial debt (million €) 600.55 663.49 696.65 0.00 696.65 678.07
Debt to equity (%) 26.8% 33.2% 36.3% 0.0% 36.3% 34.1%
Number of shares (million) 276.07 276.07 276.07 0.00 276.07 276.07
Return to shareholders (per share) --- --- 0.45 --- 0.45 0.440
Daily average shares traded (nº of shares, million) 1.54 1.76 1.37 0.00 1.55 1.94
Result after taxes and minorities per share 0.35 0.19 0.02 0.00 0.57 0.16
Net cash flow per share 0.52 0.35 0.17 0.00 1.04 0.62
Year 2017
Pag e 14 / 1 4
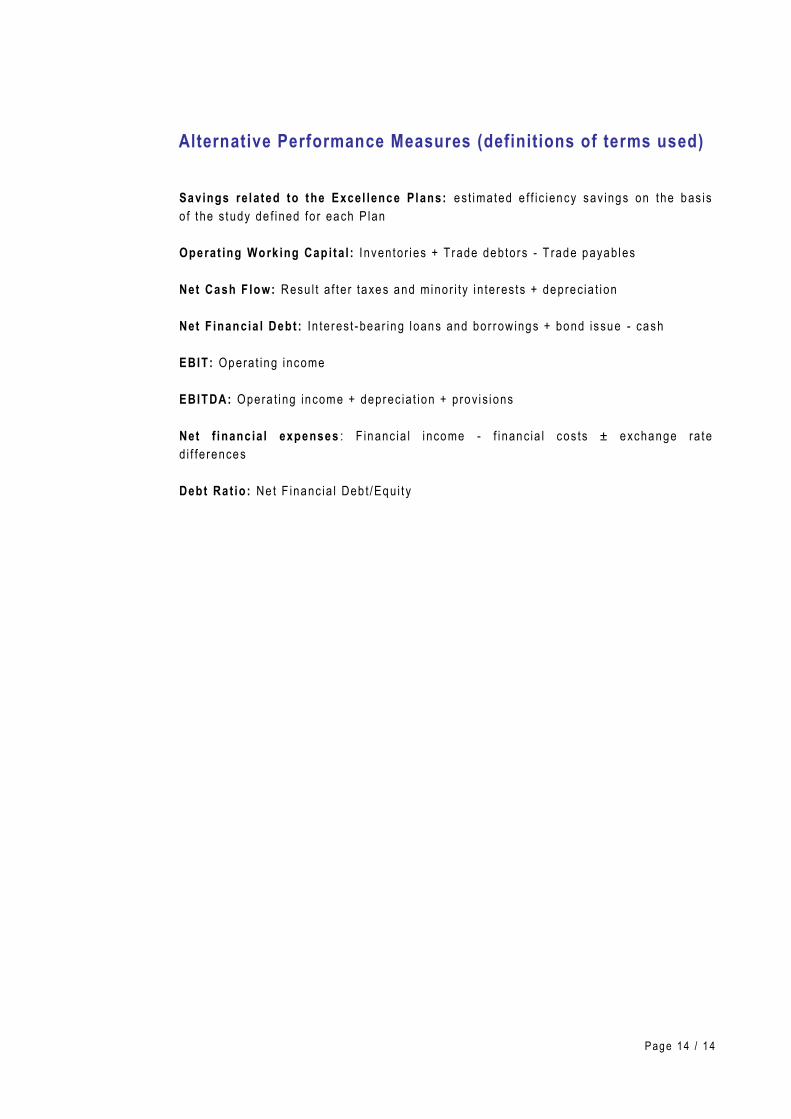
Alternative Performance Measures (definitions of terms used)
Savings re lated to the Excel lence Plans: est imated e f f ic iency sav ings on the bas is
o f t he s tudy de f ined fo r each P lan
Operat ing Work ing Cap i ta l : I nventor ies + Trade debtor s - T rade payab les
Net Cash F low: Resu l t a f t e r taxes and minor i ty i n te res ts + deprec ia t i on
Net F inancia l Debt : In te res t - bear ing l oans and bor row ings + bond issue - cash
EBIT: Opera t ing i ncome
EBITDA: Opera t i ng income + deprec ia t ion + prov i s ions
Net f inanc ia l expenses : F inanc ia l i ncome - f i nanc ia l cos ts ± exchange ra te
d i f fe rences
Debt Ra t io: Ne t F inanc ia l Deb t /Equ i t y