Embed Size (px)
Citation preview
Results and Indicators
EuropeAid– DEVCO 06 –Quality and Results
Learning Objectives
At the end of the session you will be able to:
• Understand the role of results in EuropeAid
• Articulate a results chain
• Develop indicators to monitor progress
• Understand how to compile a logframe
• Know how to use a logframe
2
3
Results: the context
• "Increasing the Impact of EU Development Policy: an Agenda for Change" (2011): The EU and its Member States committed to promote common results-based approaches and strengthen M&E for development results
• Busan High Level Forum specifically called for the promotion of results and mutual accountability agreements
• Forthcoming end of MDGs and set up of new SDGs will imply a substantial change of long term goals for the development community
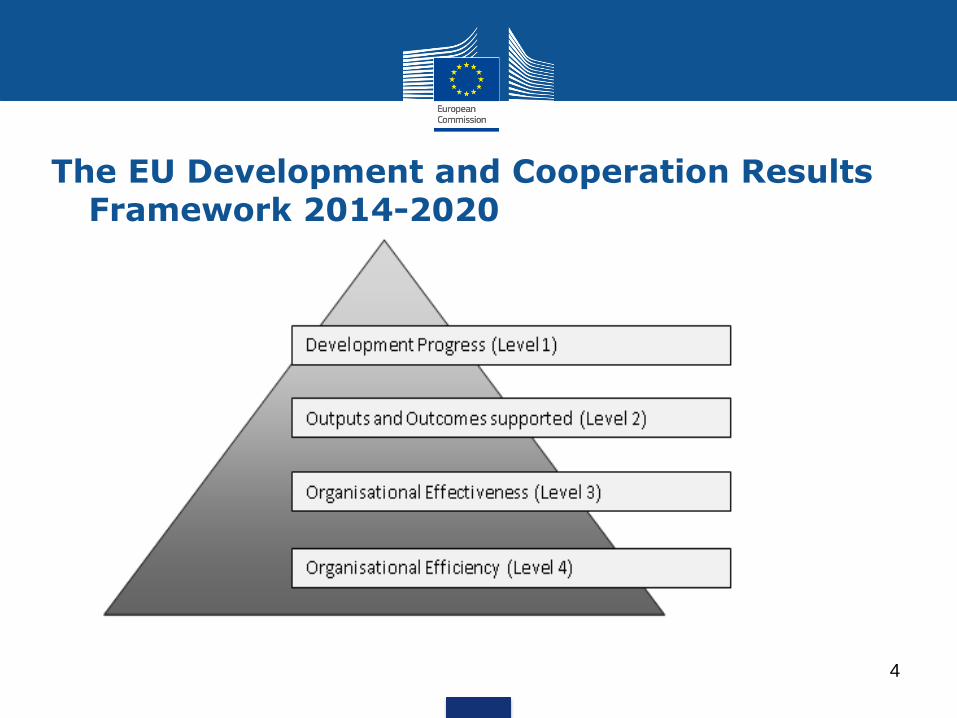
The EU Development and Cooperation Results Framework 2014-2020
4
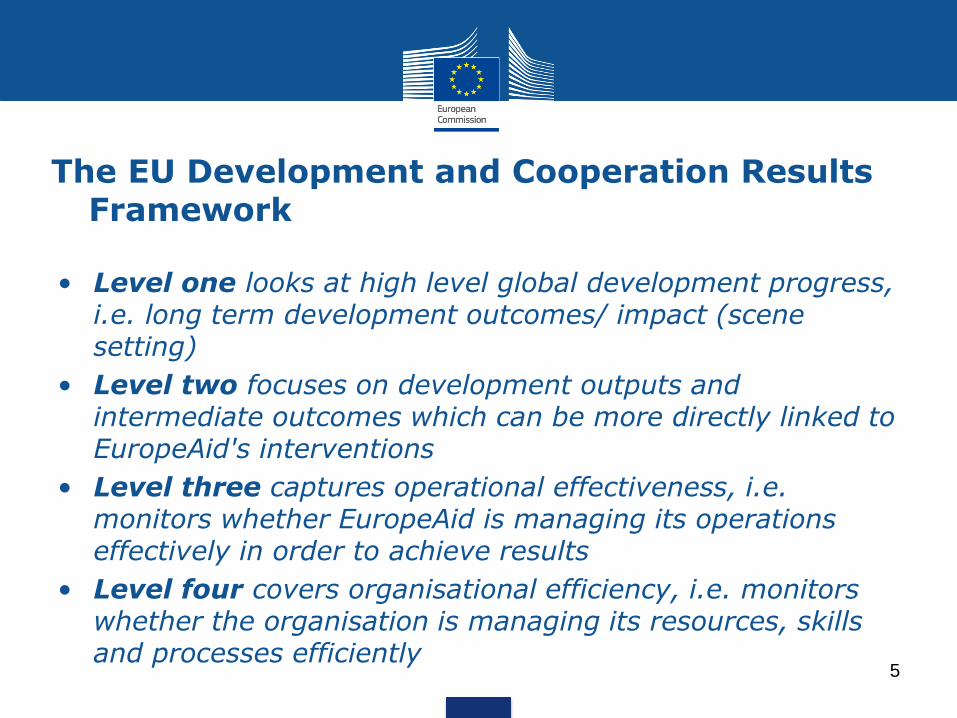
The EU Development and Cooperation Results Framework
• Level one looks at high level global development progress, i.e. long term development outcomes/ impact (scene setting)
• Level two focuses on development outputs and intermediate outcomes which can be more directly linked to EuropeAid's interventions
• Level three captures operational effectiveness, i.e. monitors whether EuropeAid is managing its operations effectively in order to achieve results
• Level four covers organisational efficiency, i.e. monitors whether the organisation is managing its resources, skills and processes efficiently
5
6
Why do we need results frameworks?
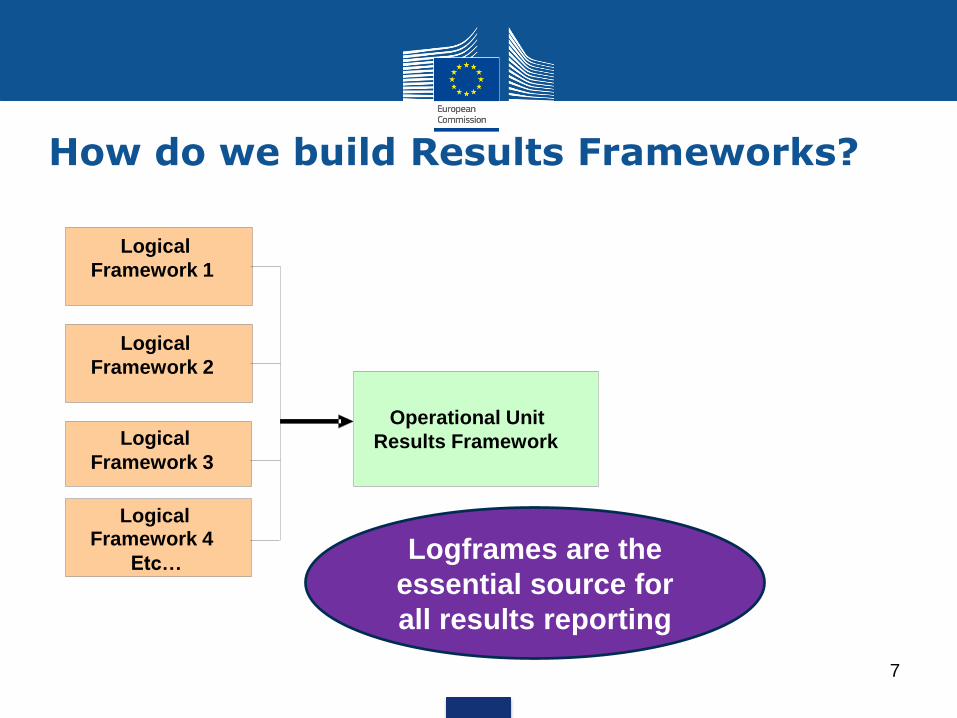
How do we build Results Frameworks?
7
Logical Framework 1
Logical Framework 2
Logical Framework 3
Operational Unit
Results Framework
Logical Framework 4
Etc… Logframes are the
essential source for
all results reporting
Benefits of a good logframe
• Design stronger interventions – use it to appraise options
• It is a useful monitoring tool – to manage delivery
• Communication & accountability tool – to demonstrate what the project is achieving and to agree with partners
• Evaluation & Reviews – need to show whether our projects/ programmes achieved what was expected
8
The logic of logical frameworks
9
A logic model is your
project/ programme ROAD
MAP
Where are you going?
How will you get there?
What will tell you that
you’ve arrived?
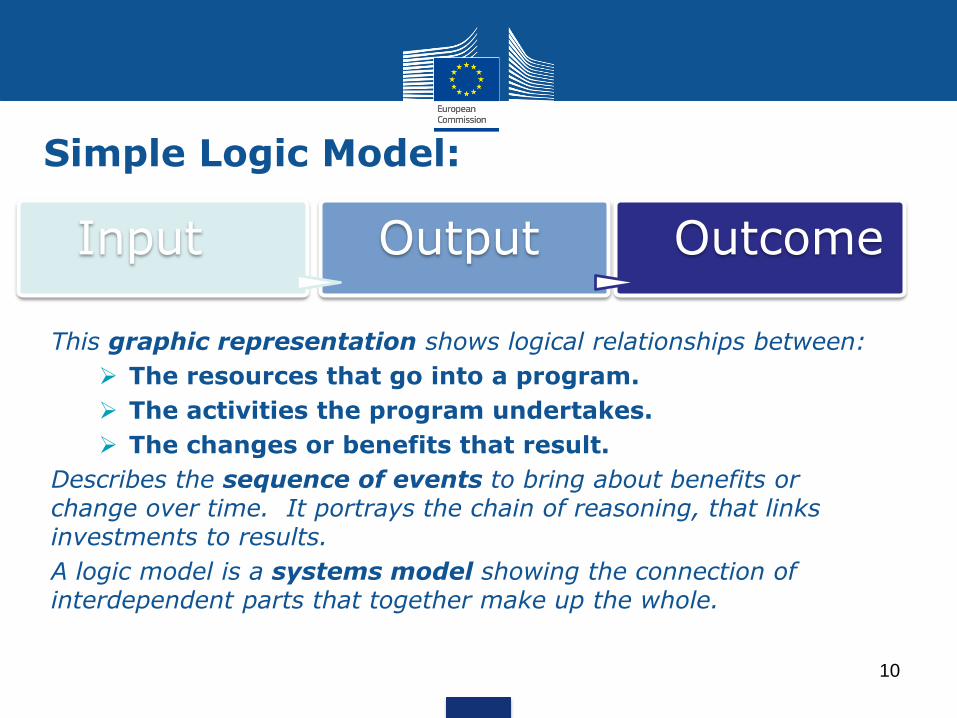
Simple Logic Model:
This graphic representation shows logical relationships between:
The resources that go into a program.
The activities the program undertakes.
The changes or benefits that result.
Describes the sequence of events to bring about benefits or change over time. It portrays the chain of reasoning, that links investments to results.
A logic model is a systems model showing the connection of interdependent parts that together make up the whole.
10
Input
Output
Outcome
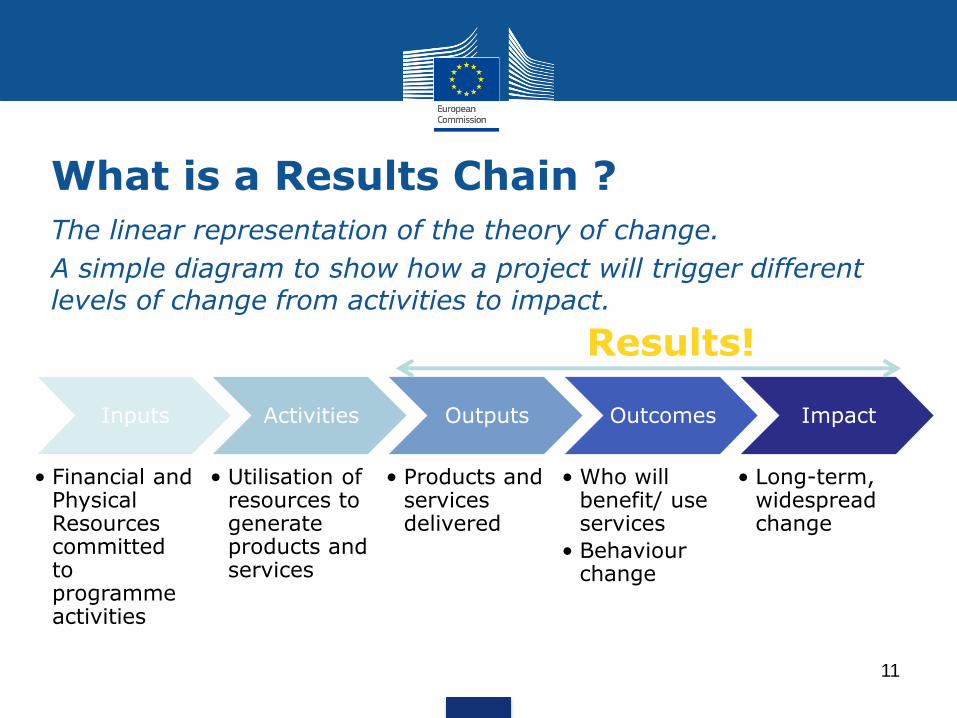
What is a Results Chain ?
The linear representation of the theory of change.
A simple diagram to show how a project will trigger different levels of change from activities to impact.
11
Inputs
• Financial and Physical Resources committed to programme activities
Activities
• Utilisation of resources to generate products and services
Outputs
• Products and services delivered
Outcomes
• Who will benefit/ use services
• Behaviour change
Impact
• Long-term, widespread change
Results!
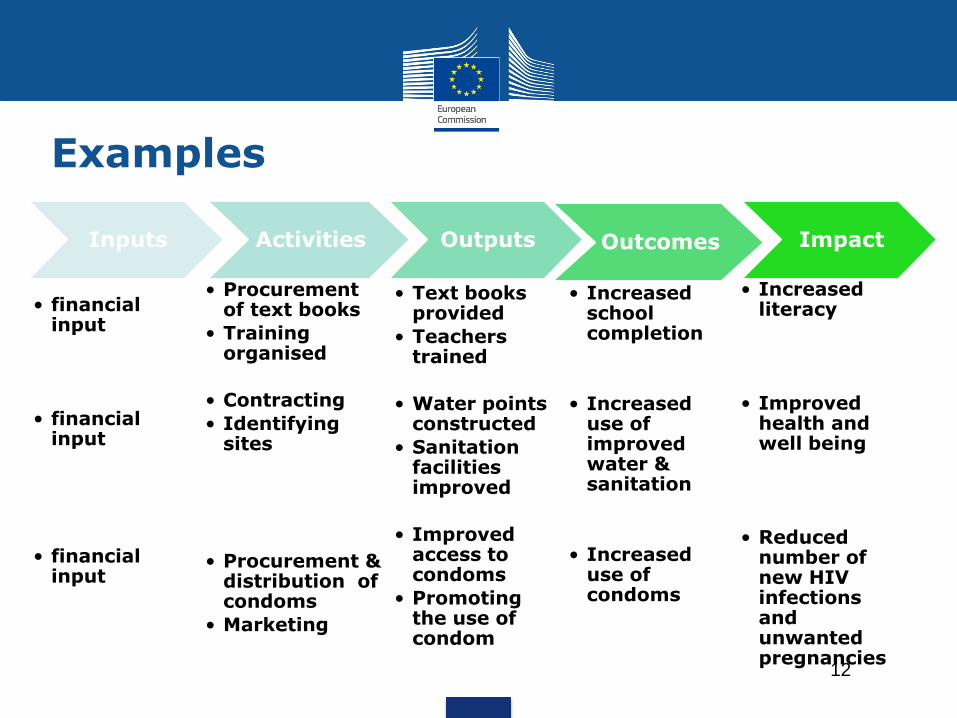
Examples
12
Inputs
• financial input
• financial input
• financial input
Activities
• Procurement of text books
• Training organised
• Contracting
• Identifying sites
• Procurement & distribution of condoms
• Marketing
Outputs
• Text books provided
• Teachers trained
• Water points constructed
• Sanitation facilities improved
• Improved access to condoms
• Promoting the use of condom
Outcomes
• Increased school completion
• Increased use of improved water & sanitation
• Increased use of condoms
Impact
• Increased literacy
• Improved health and well being
• Reduced number of new HIV infections and unwanted pregnancies
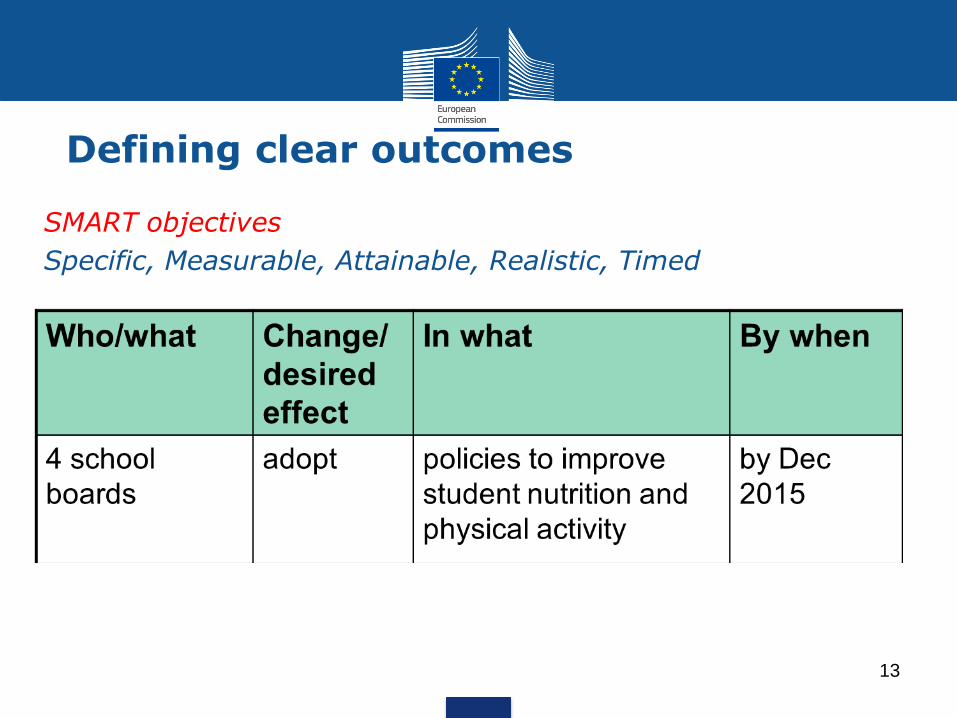
SMART objectives
Specific, Measurable, Attainable, Realistic, Timed
13
Defining clear outcomes
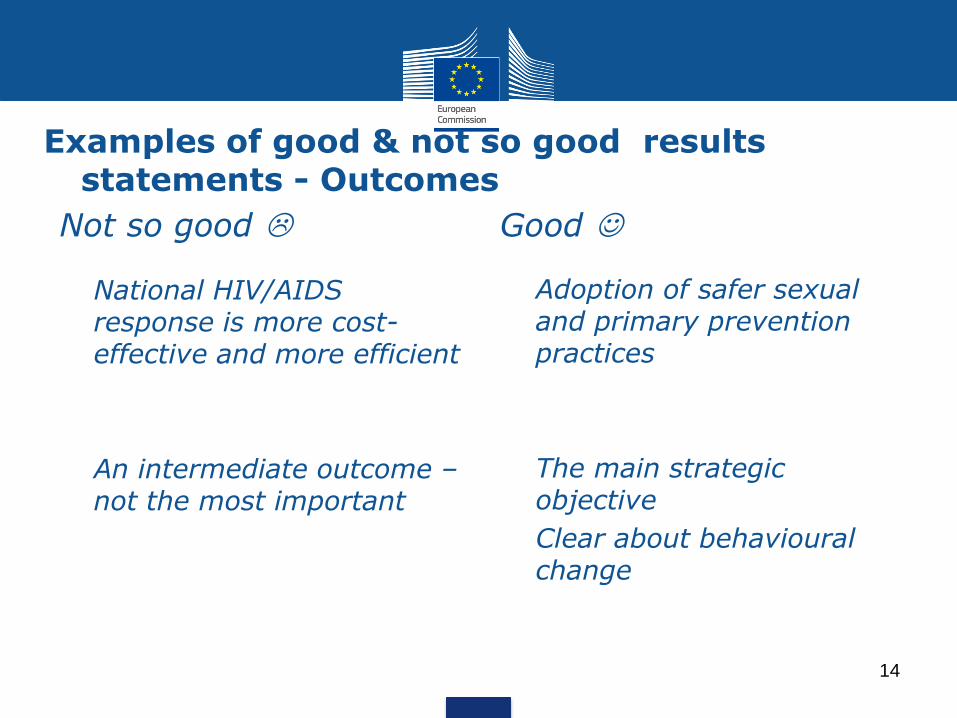
Examples of good & not so good results statements - Outcomes
14
Not so good Good
• National HIV/AIDS response is more cost-effective and more efficient
An intermediate outcome – not the most important
• Adoption of safer sexual and primary prevention practices
The main strategic objective
Clear about behavioural change
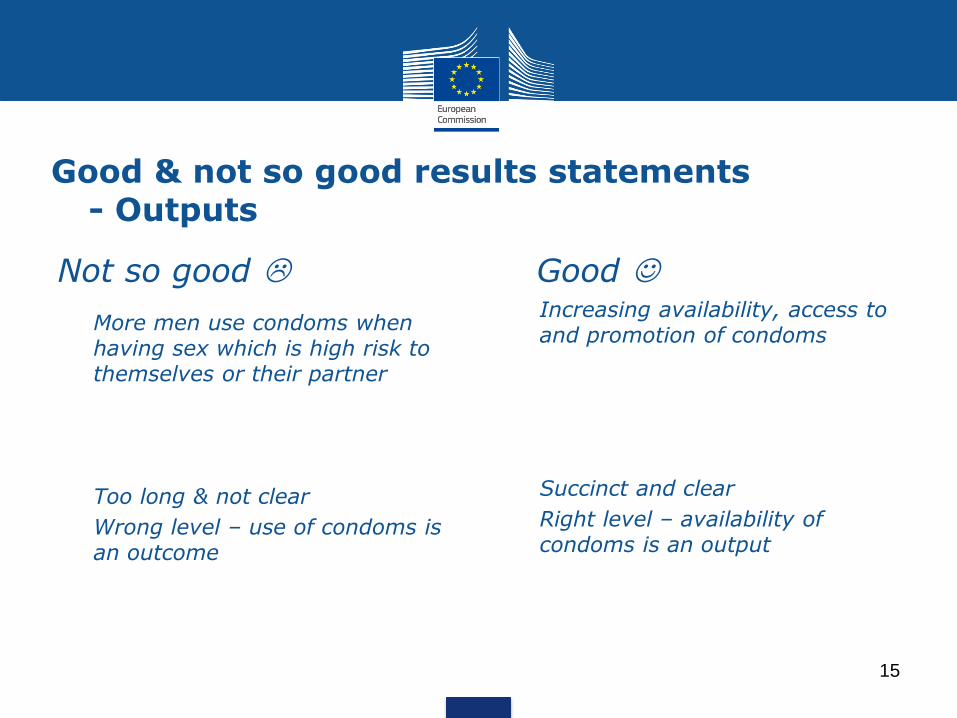
Good & not so good results statements - Outputs
15
Not so good Good
• More men use condoms when having sex which is high risk to themselves or their partner
Too long & not clear
Wrong level – use of condoms is an outcome
• Increasing availability, access to and promotion of condoms
Succinct and clear
Right level – availability of condoms is an output
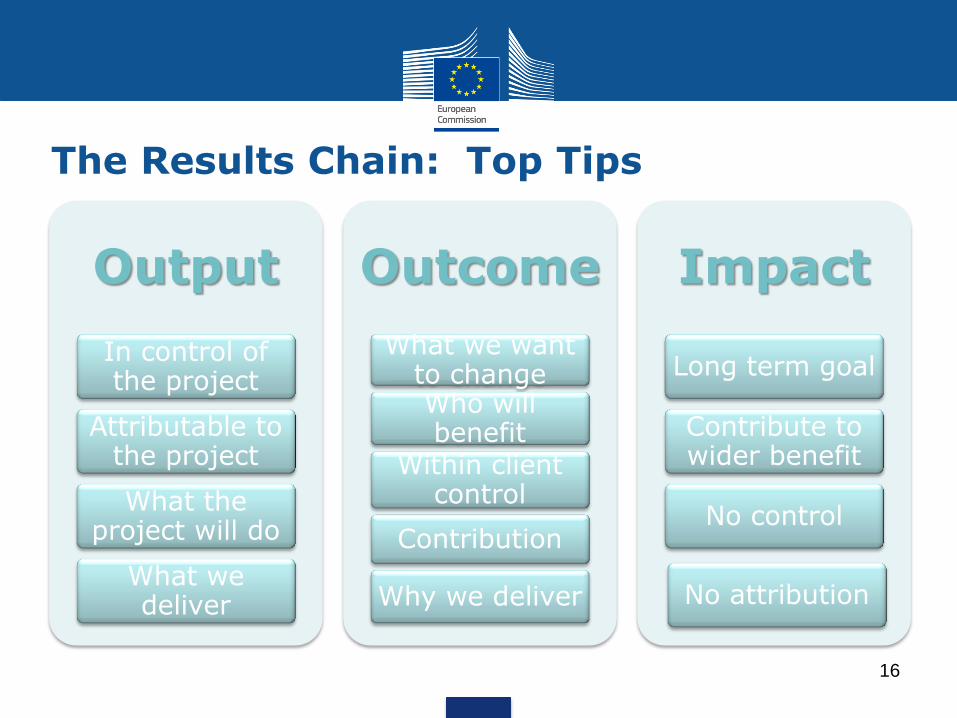
The Results Chain: Top Tips
16
Output
In control of the project
Attributable to the project
What the project will do
What we deliver
Outcome
What we want to change Who will benefit
Within client control
Contribution
Why we deliver
Impact
Long term goal
Contribute to wider benefit
No control
No attribution
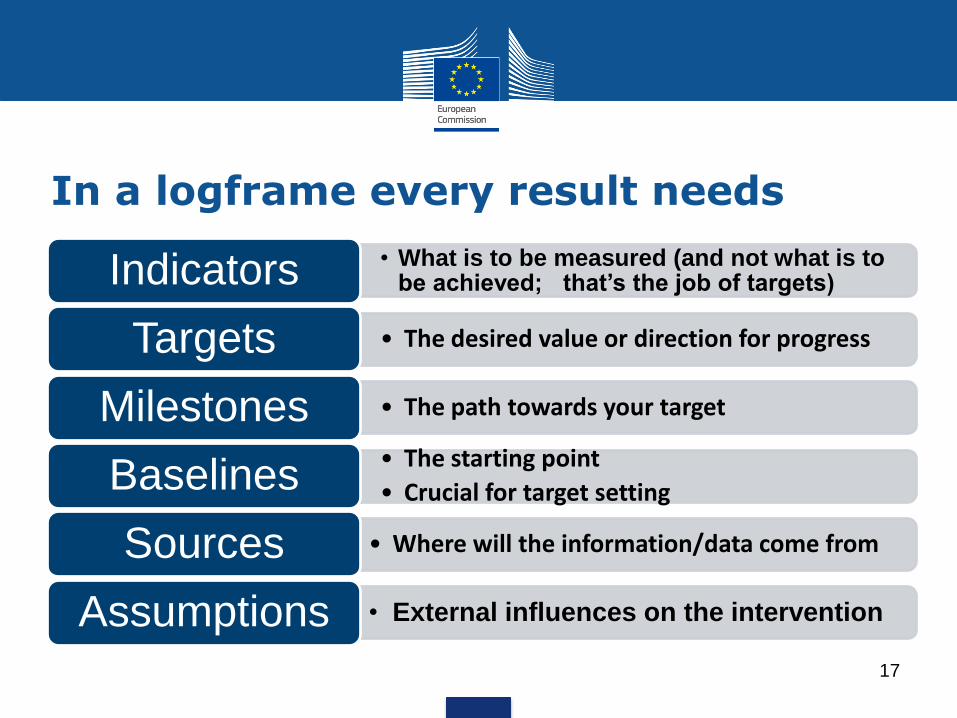
In a logframe every result needs
17
• What is to be measured (and not what is to be achieved; that’s the job of targets) Indicators
• The desired value or direction for progress Targets
• The path towards your target Milestones • The starting point
• Crucial for target setting Baselines
• Where will the information/data come from Sources
• External influences on the intervention Assumptions
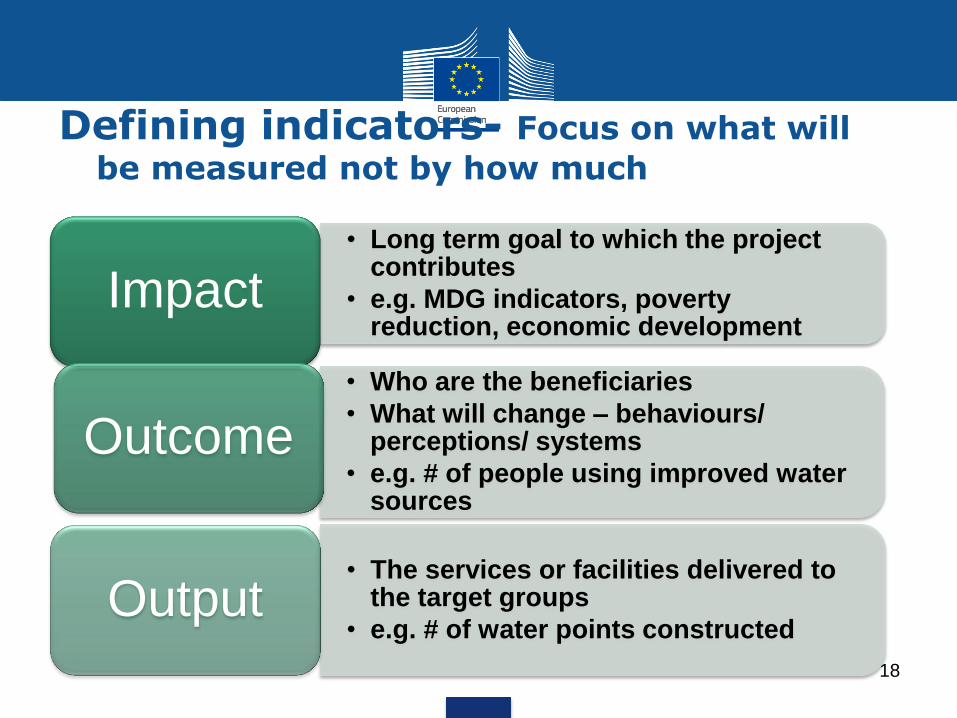
Defining indicators- Focus on what will
be measured not by how much
18
• Long term goal to which the project contributes
• e.g. MDG indicators, poverty reduction, economic development
Impact
• Who are the beneficiaries
• What will change – behaviours/ perceptions/ systems
• e.g. # of people using improved water sources
Outcome
• The services or facilities delivered to the target groups
• e.g. # of water points constructed Output
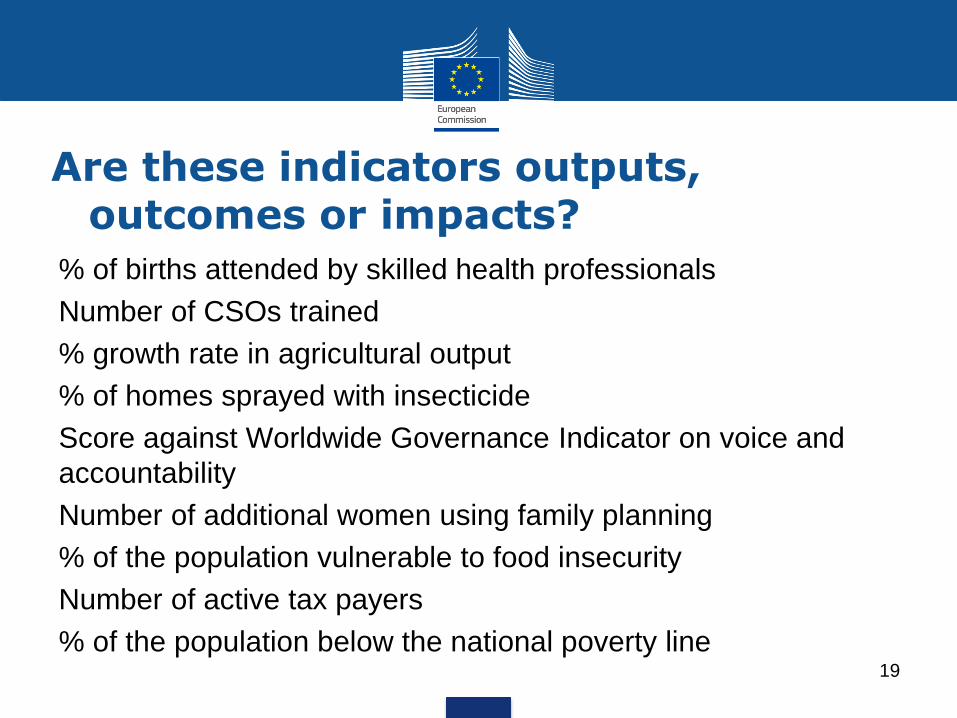
Are these indicators outputs, outcomes or impacts?
% of births attended by skilled health professionals
Number of CSOs trained
% growth rate in agricultural output
% of homes sprayed with insecticide
Score against Worldwide Governance Indicator on voice and
accountability
Number of additional women using family planning
% of the population vulnerable to food insecurity
Number of active tax payers
% of the population below the national poverty line
19
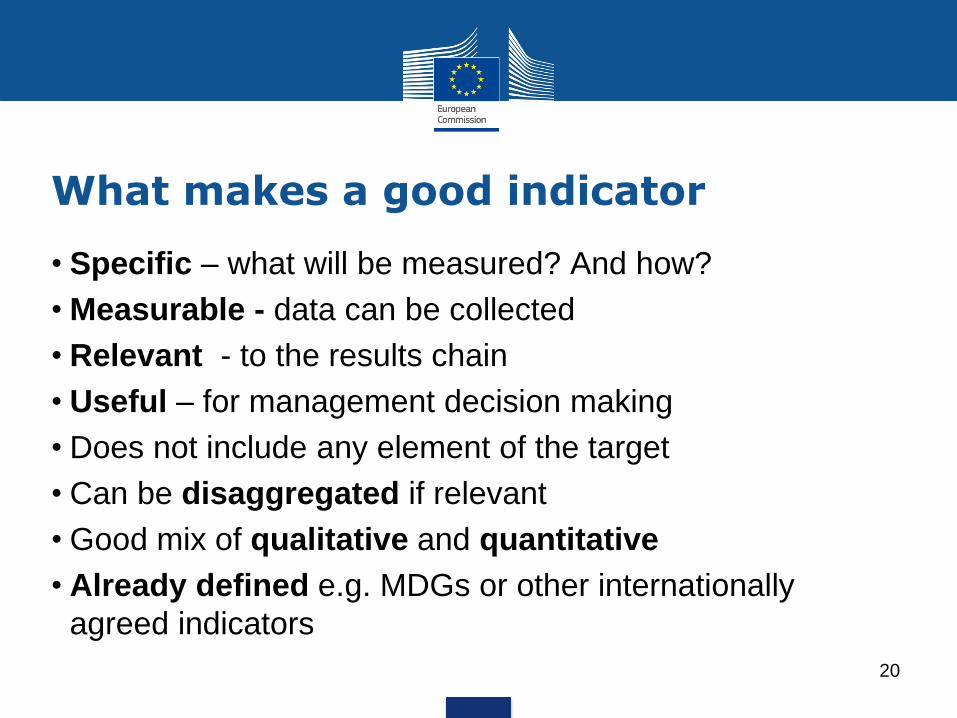
What makes a good indicator
• Specific – what will be measured? And how?
• Measurable - data can be collected
• Relevant - to the results chain
• Useful – for management decision making
• Does not include any element of the target
• Can be disaggregated if relevant
• Good mix of qualitative and quantitative
• Already defined e.g. MDGs or other internationally
agreed indicators
20
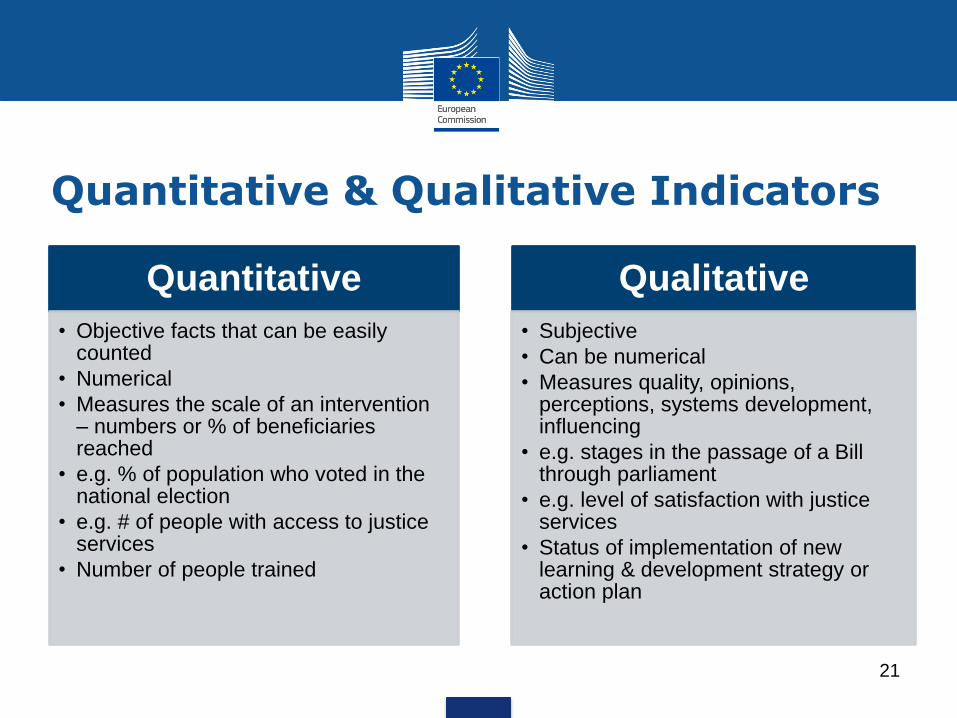
Quantitative & Qualitative Indicators
21
Quantitative
• Objective facts that can be easily counted
• Numerical
• Measures the scale of an intervention – numbers or % of beneficiaries reached
• e.g. % of population who voted in the national election
• e.g. # of people with access to justice services
• Number of people trained
Qualitative
• Subjective
• Can be numerical
• Measures quality, opinions, perceptions, systems development, influencing
• e.g. stages in the passage of a Bill through parliament
• e.g. level of satisfaction with justice services
• Status of implementation of new learning & development strategy or action plan
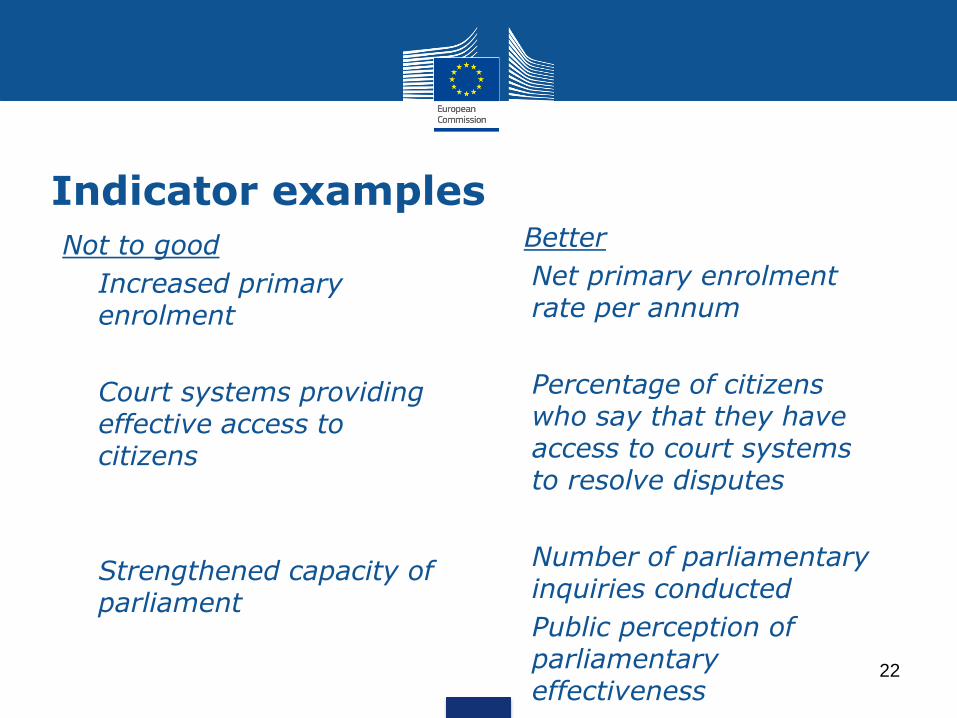
Indicator examples
22
Not to good
• Increased primary enrolment
• Court systems providing effective access to citizens
• Strengthened capacity of parliament
Better
• Net primary enrolment rate per annum
• Percentage of citizens who say that they have access to court systems to resolve disputes
• Number of parliamentary inquiries conducted
• Public perception of parliamentary effectiveness
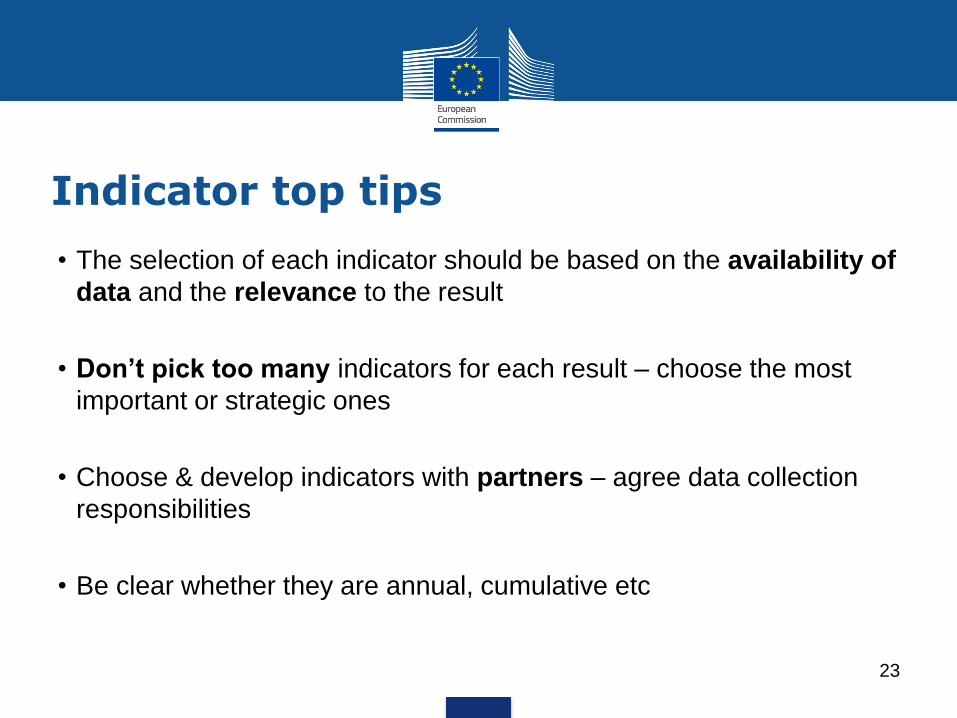
Indicator top tips
• The selection of each indicator should be based on the availability of
data and the relevance to the result
• Don’t pick too many indicators for each result – choose the most
important or strategic ones
• Choose & develop indicators with partners – agree data collection
responsibilities
• Be clear whether they are annual, cumulative etc
23
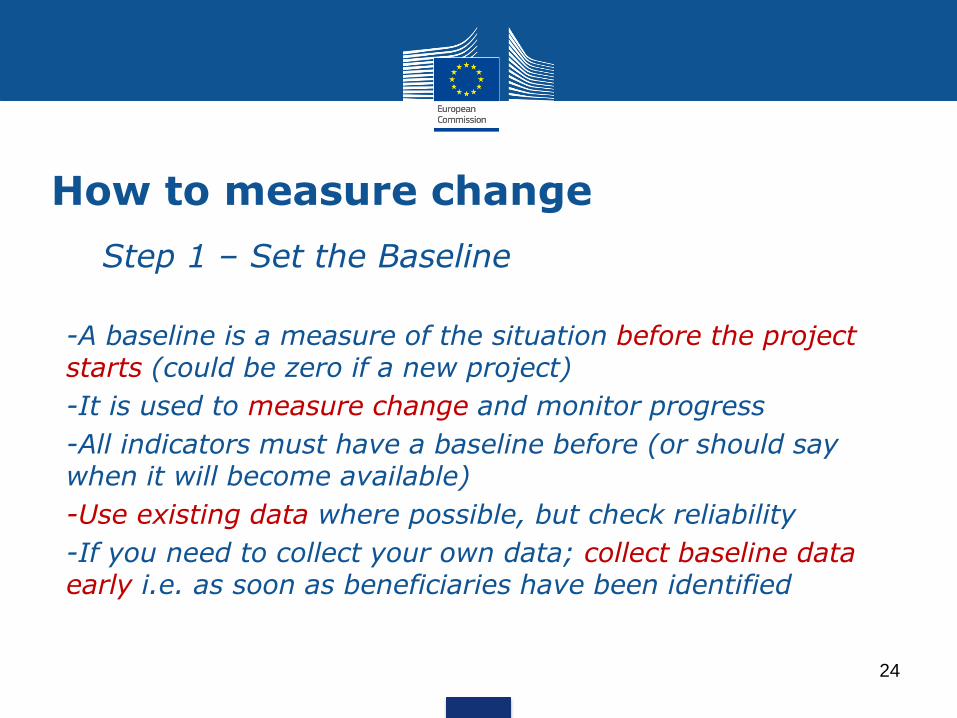
How to measure change
• Step 1 – Set the Baseline
-A baseline is a measure of the situation before the project starts (could be zero if a new project)
-It is used to measure change and monitor progress
-All indicators must have a baseline before (or should say when it will become available)
-Use existing data where possible, but check reliability
-If you need to collect your own data; collect baseline data early i.e. as soon as beneficiaries have been identified
24
How to measure results
• Step 2 – Set targets
-A target is the desired end point for each indicator. It is often the last year of the project
-Must be included where baseline data is available
-REALISTIC given resources and capacity
-Achievable within the time period available
-Disaggregated where relevant eg by sex/ geography/ income
25
What makes a good target
• Specific
• Measurable
• Achievable
• Relevant
• Time bound
26
How to measure change
Step 3 – set milestones
-Milestones are the desired trajectory from baseline to target
-Must be REALISTIC given resources and capacity
-At the output level should be annual milestones; at the outcome level data may not be available annually
-Will help you track progress and make change to under-performing areas
27
Data Sources
-List the specific data sources (do not just list the organisation and give the specific data collection, eg survey or report)
-Frequency should be clear and consistent with milestones and targets
-Provide disaggregated data as required
-Data collection and reporting responsibilities are clearly specified
28
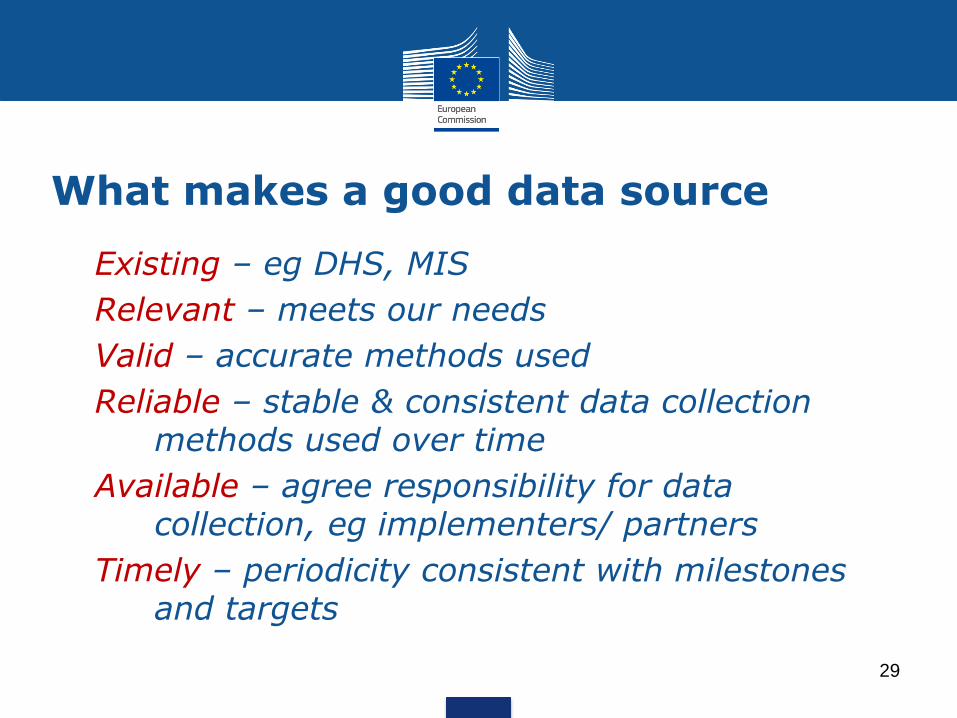
What makes a good data source
• Existing – eg DHS, MIS
• Relevant – meets our needs
• Valid – accurate methods used
• Reliable – stable & consistent data collection methods used over time
• Available – agree responsibility for data collection, eg implementers/ partners
• Timely – periodicity consistent with milestones and targets
29
Using logframes
• Monitoring
• Coordinating with partners
• Annual progress reviews
• Project completion reviews
• Mid-term evaluations
• Ex-post evaluations
30
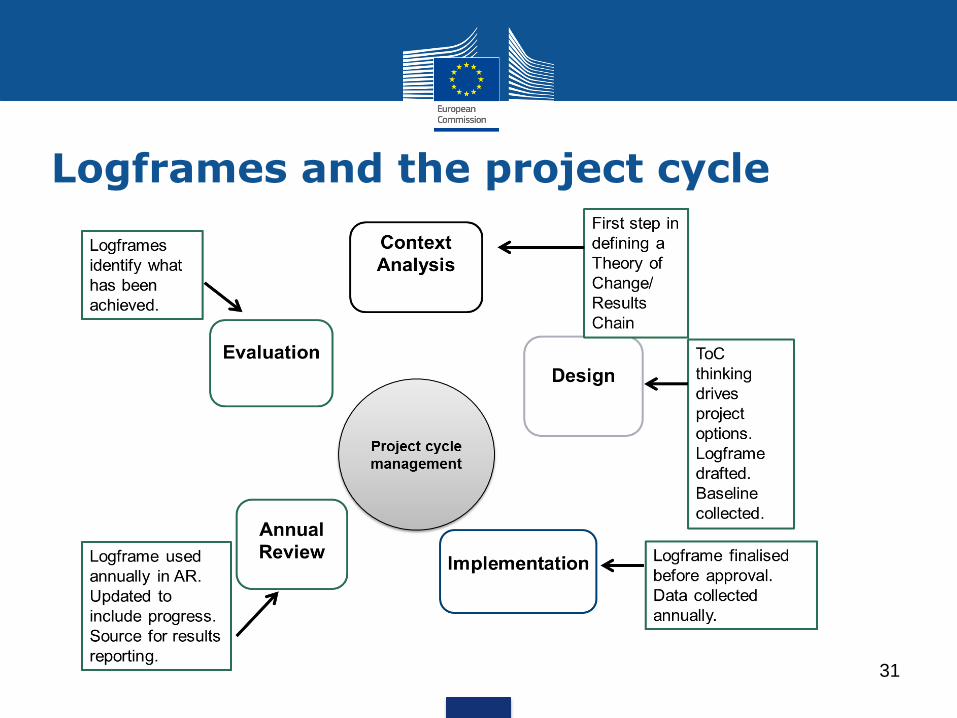
Logframes and the project cycle
31
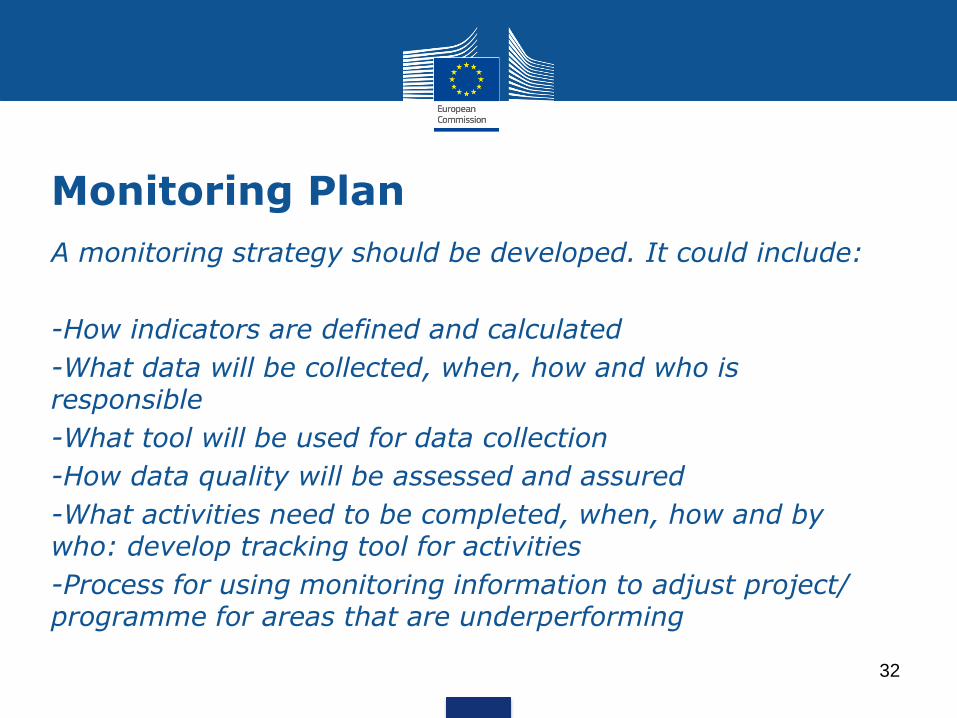
Monitoring Plan
A monitoring strategy should be developed. It could include:
-How indicators are defined and calculated
-What data will be collected, when, how and who is responsible
-What tool will be used for data collection
-How data quality will be assessed and assured
-What activities need to be completed, when, how and by who: develop tracking tool for activities
-Process for using monitoring information to adjust project/ programme for areas that are underperforming
32
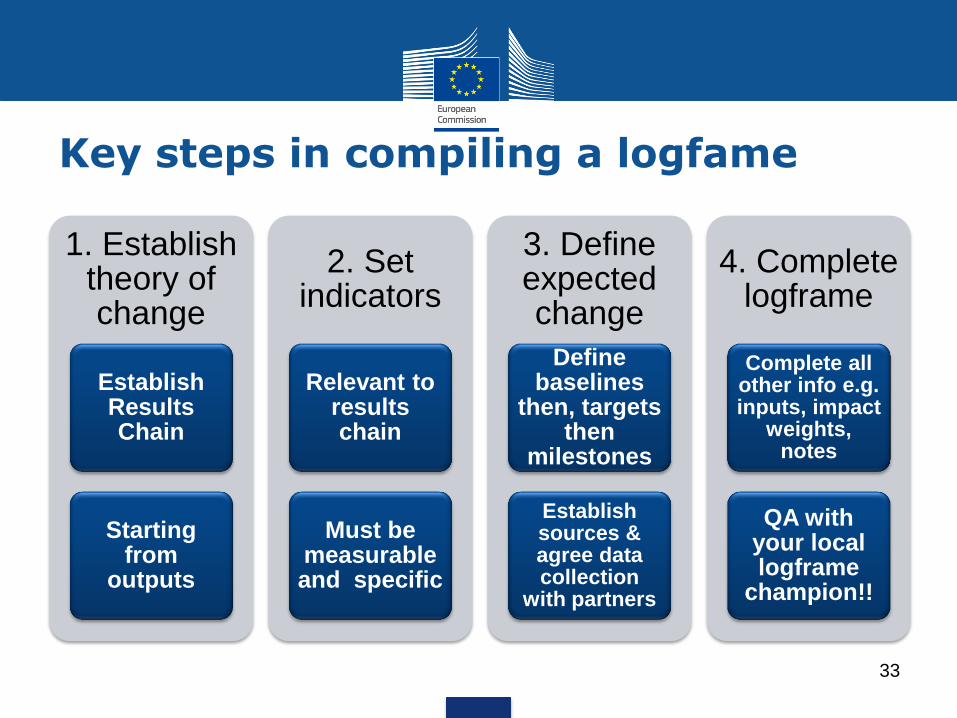
Key steps in compiling a logfame
33
1. Establish theory of change
Establish Results Chain
Starting from
outputs
2. Set indicators
Relevant to results chain
Must be measurable and specific
3. Define expected change
Define baselines
then, targets then
milestones
Establish sources & agree data collection
with partners
4. Complete logframe
Complete all other info e.g. inputs, impact
weights, notes
QA with your local logframe
champion!!