Embed Size (px)
Citation preview

Results – MQ ’10 & FY ’2010
25th May 2010
Investor Presentation
MQ‘10 Results - 25th May 2010
Safe Harbour Statement
This Release / Communication, except for the historical information, may contain statements, including the words or phrases such as ‘expects, anticipates, intends, will, would, undertakes, aims, estimates, contemplates, seeks to, objective, goal, projects, should’ and similar expressions or variations of these expressions or negatives of these terms indicating future performance or results, financial or otherwise, which are forward looking statements. These forward looking statements are based on certain expectations, assumptions, anticipated developments and other factors which are not limited to, risk and uncertainties regarding fluctuations in earnings, market growth, intense competition and the pricing environment in the market, consumption level, ability to maintain and manage key customer relationship and supply chain sources and those factors which may affect our ability to implement business strategies successfully, namely changes in regulatory environments, political instability, change in international oil prices and input costs and new or changed priorities of the trade. The Company, therefore, cannot guarantee that the forward looking statements made herein shall be realized. The Company, based on changes as stated above, may alter, amend, modify or make necessary corrective changes in any manner to any such forward looking statement contained herein or make written or oral forward looking statements as may be required from time to time on the basis of subsequent developments and events. The Company does not undertake any obligation to update forward looking statements that may be made from time to time by or on behalf of the Company to reflect the events or circumstances after the date hereof.
MQ‘10 Results - 25th May 2010
Agenda
• Market Context
• MQ’10 Highlights
• Category Overview
• MQ’10 – Financial Results
• FY’10 Performance Review
• Looking Ahead
MQ‘10 Results - 25th May 2010
MQ’10 – Market Context
• FMCG market continues to grow• At a slower pace
• Increased competitive intensity• Aggressive pricing actions
• FMCG media spends remain high
• Continued high food inflation
* Market Growth as reported by AC Nielsen
MQ‘10 Results - 25th May 2010
• Strong volume growth at 11%
• Overall growth ahead of market
• PP, Foods & Water grow in double digit
• Decisive actions to strengthen leadership in Laundry &
Personal Wash
• Net sales and Domestic Consumer business grow at 8%
MQ’10 Highlights
MQ‘10 Results - 25th May 2010
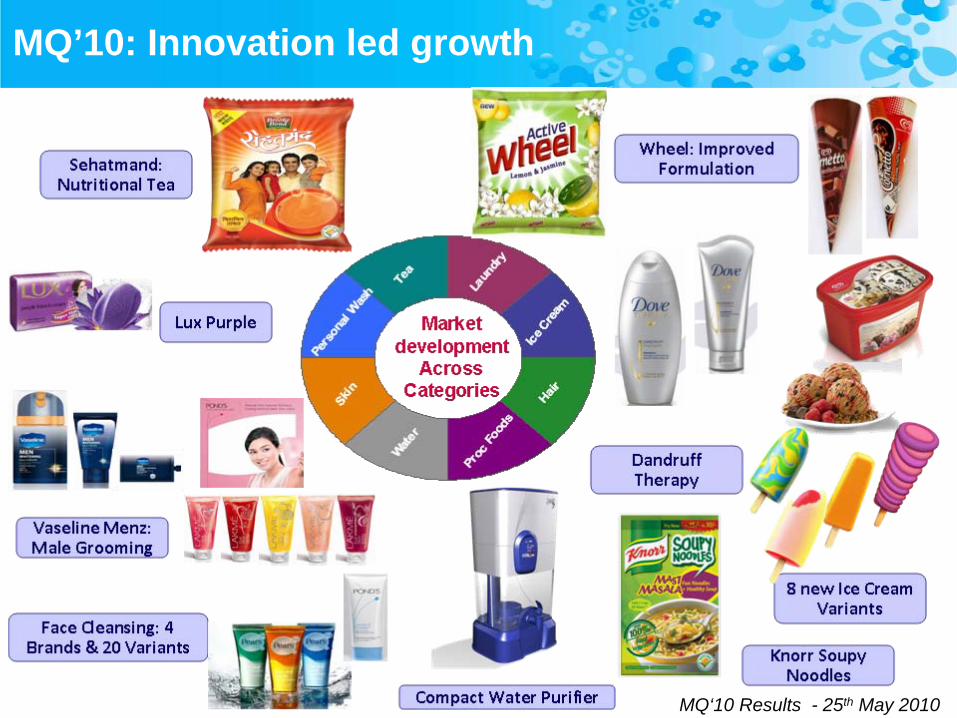
• Continued innovation to drive new categories/ segments for the future
• Male grooming: Vaseline Menz
• Nutritional Tea in mass segment: Brooke Bond Sehatmand
• Soupy Noodles: Knorr
• Pureit at mass end: Pureit Compact
• Go to Market capabilities significantly strengthened
• Sustained focus on cost management; COGS down by 80 bps
• A&P investment stepped up by 320 bps to 14.5%
• PBT (bei) maintained; Net Profit up by 47.1%; aided by exceptional/ extraordinary gains
MQ’10 Highlights
MQ‘10 Results - 25th May 2010
MQ’10: Innovation led growth
MQ‘10 Results - 25th May 2010
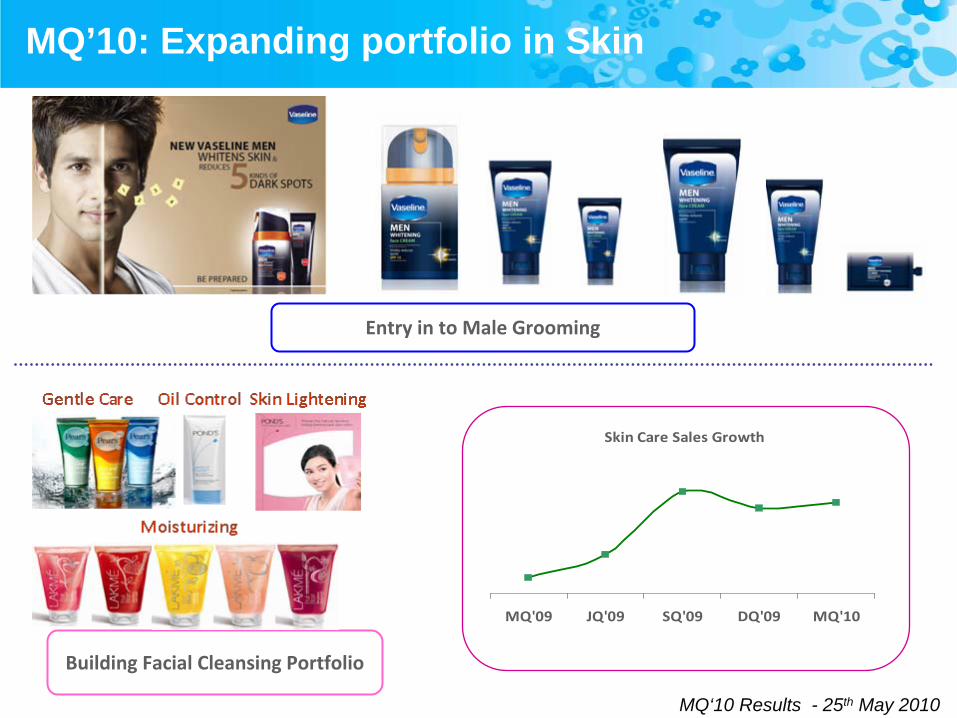
MQ’10: Expanding portfolio in Skin
Skin Care Sales Growth
MQ'09 JQ'09 SQ'09 DQ'09 MQ'10
Building Facial Cleansing Portfolio
Entry in to Male Grooming
MQ‘10 Results - 25th May 2010
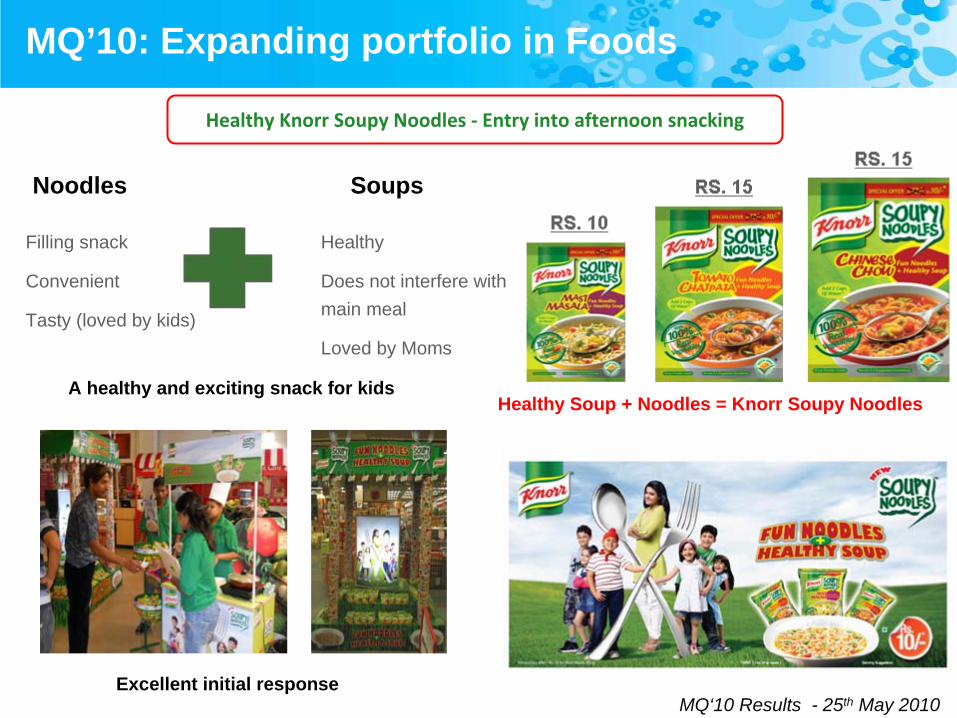
A healthy and exciting snack for kids
Healthy
Does not interfere with main meal
Loved by Moms
Filling snack
Convenient
Tasty (loved by kids)
SoupsNoodles
MQ’10: Expanding portfolio in Foods
Healthy Knorr Soupy Noodles ‐
Entry into afternoon snacking
Excellent initial response
Healthy Soup + Noodles = Knorr Soupy Noodles
MQ‘10 Results - 25th May 2010
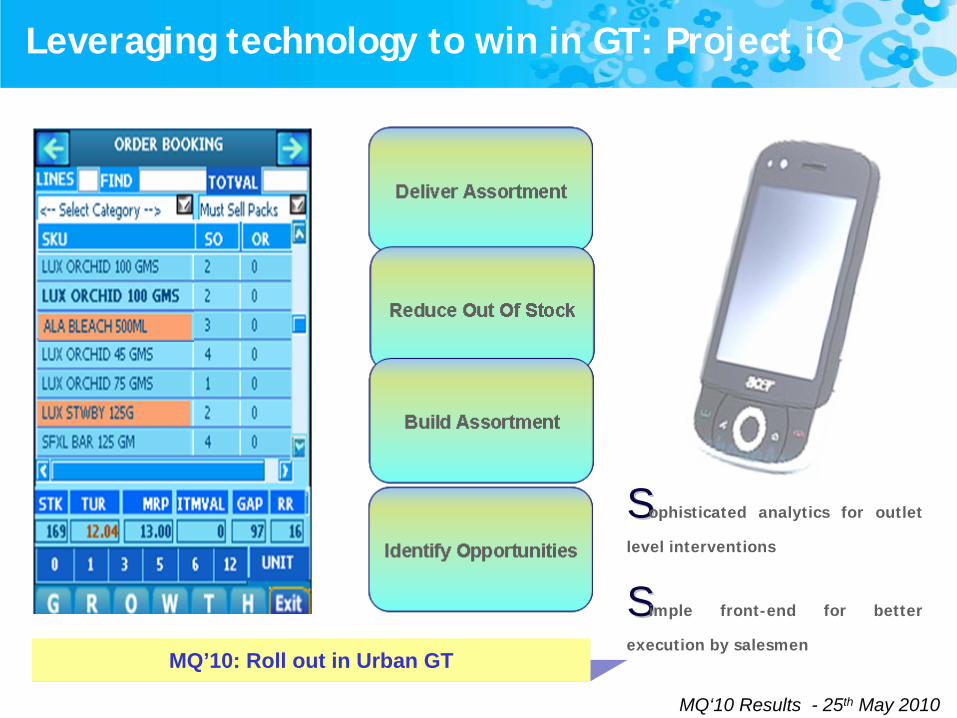
Leveraging technology to win in GT: Project iQ
SSophisticated analytics for outlet
level interventions
SSimple front-end for better
execution by salesmenMQ’10: Roll out in Urban GT
MQ‘10 Results - 25th May 2010
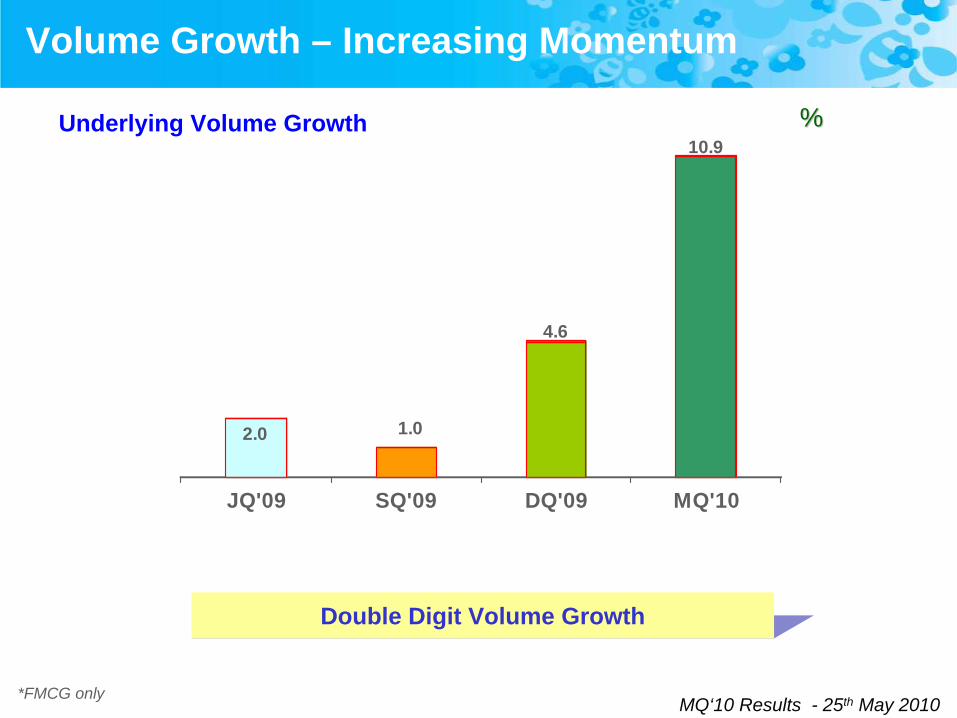
Volume Growth – Increasing Momentum
Double Digit Volume Growth
2.0 1.0
4.6
10.9
JQ'09 SQ'09 DQ'09 MQ'10
%%Underlying Volume Growth
*FMCG only
MQ‘10 Results - 25th May 2010
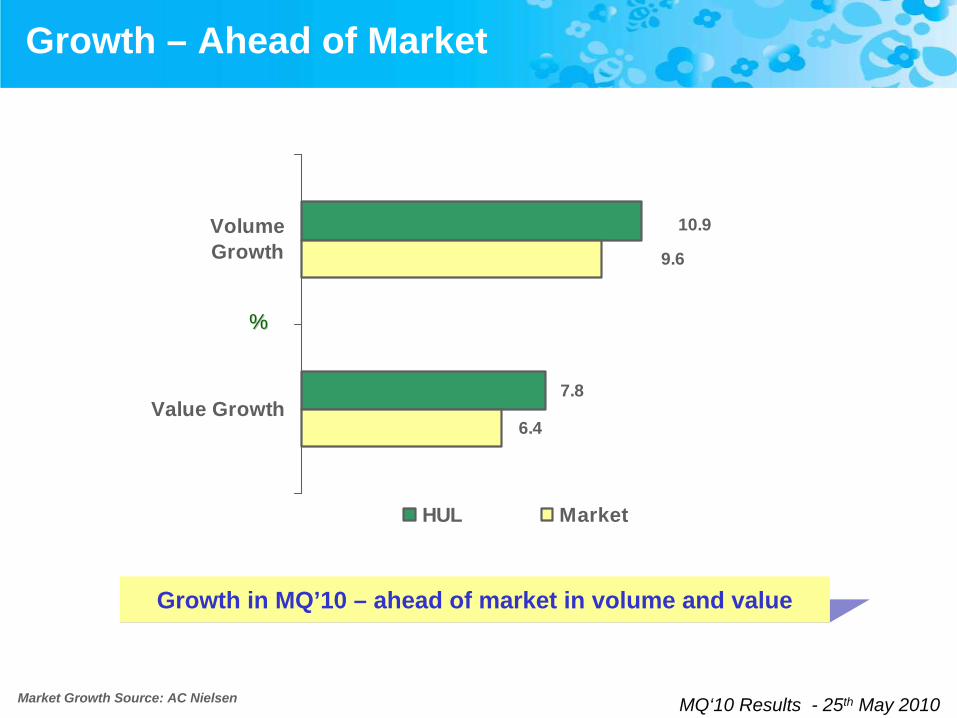
Growth – Ahead of Market
7.8
10.9
9.6
6.4
VolumeGrowth
Value Growth
HUL Market
%%
Growth in MQ’10 – ahead of market in volume and value
Market Growth Source: AC Nielsen
MQ‘10 Results - 25th May 2010
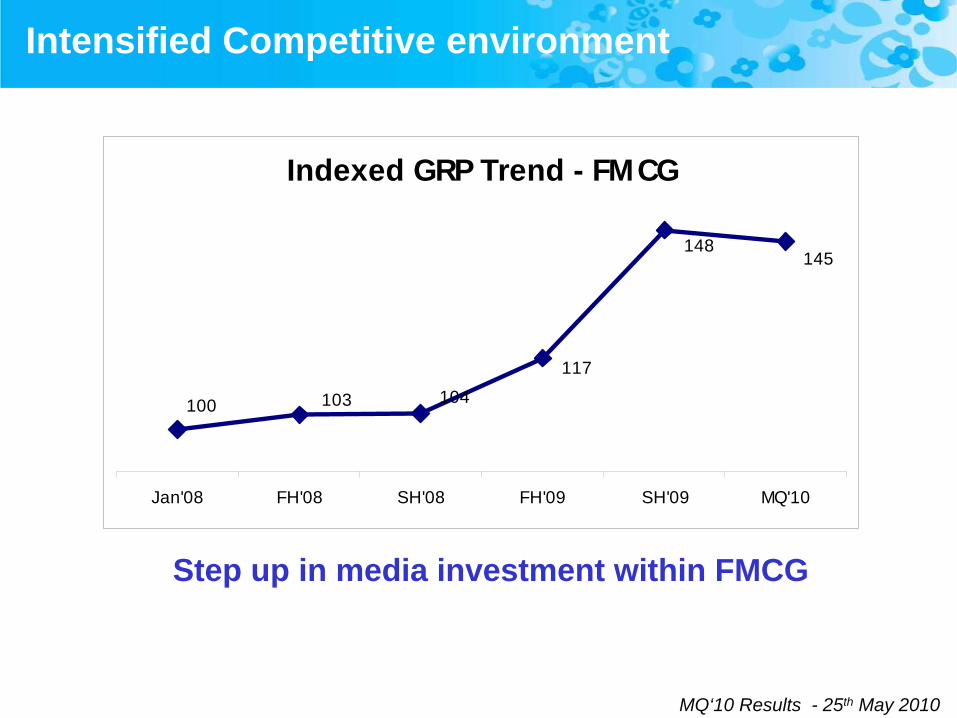
Step up in media investment within FMCG
Intensified Competitive environment
Indexed GRP Trend - FMCG
145
100 103 104
148
117
Jan'08 FH'08 SH'08 FH'09 SH'09 MQ'10
MQ‘10 Results - 25th May 2010
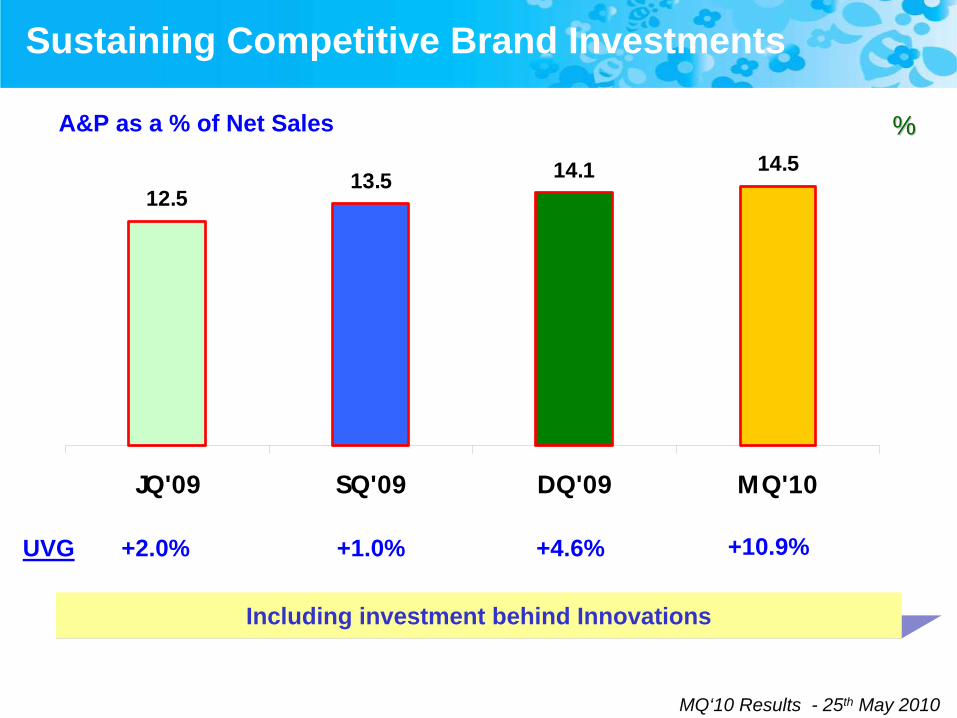
12.513.5 14.1 14.5
JQ'09 SQ'09 DQ'09 MQ'10
Sustaining Competitive Brand Investments
%%A&P as a % of Net Sales
Including investment behind Innovations
UVG +2.0% +1.0% +4.6% +10.9%
MQ‘10 Results - 25th May 2010
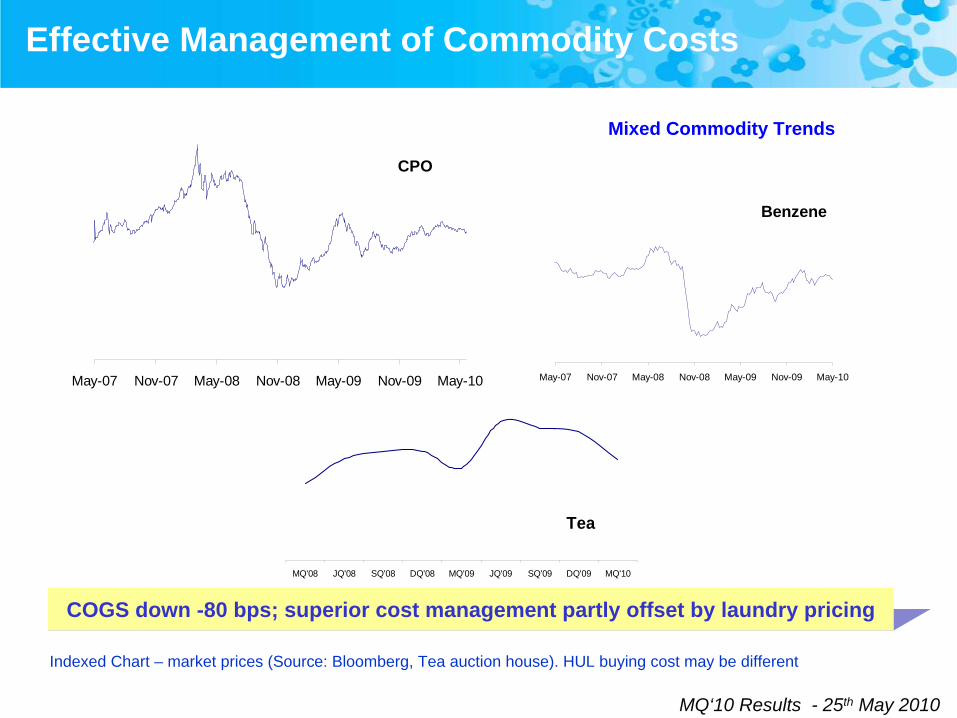
Effective Management of Commodity Costs
COGS down -80 bps; superior cost management partly offset by laundry pricing
Indexed Chart – market prices (Source: Bloomberg, Tea auction house). HUL buying cost may be different
CPO
May-07 Nov-07 May-08 Nov-08 May-09 Nov-09 May-10
Benzene
May-07 Nov-07 May-08 Nov-08 May-09 Nov-09 May-10
Tea
MQ'08 JQ'08 SQ'08 DQ'08 MQ'09 JQ'09 SQ'09 DQ'09 MQ'10
Mixed Commodity Trends
MQ‘10 Results - 25th May 2010
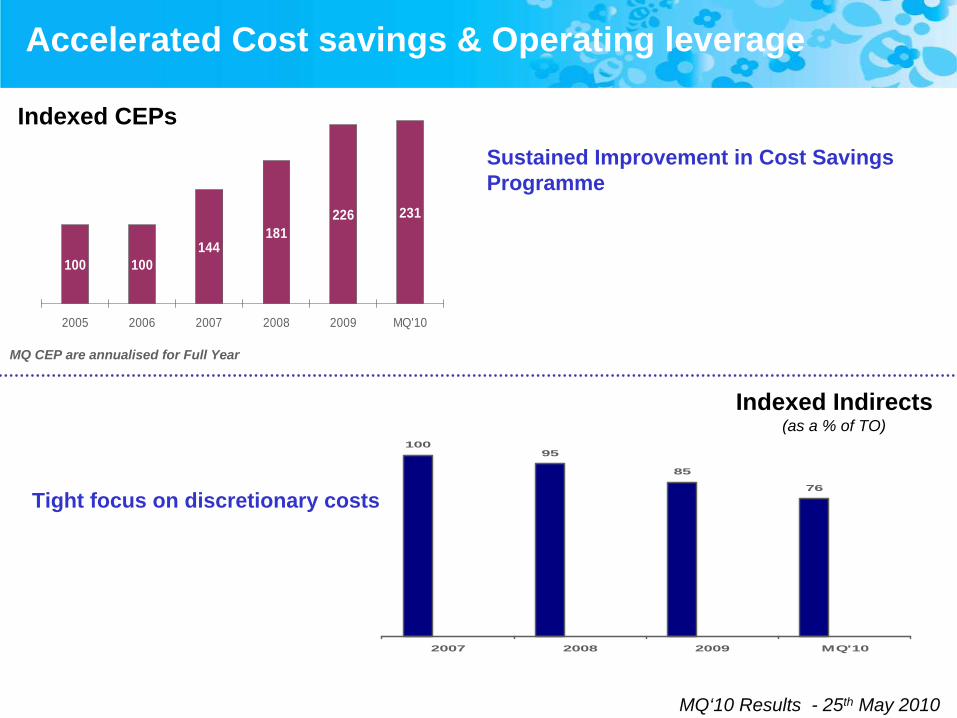
100 100144
181226 231
2005 2006 2007 2008 2009 MQ'10
Indexed Indirects(as a % of TO)
Indexed CEPsSustained Improvement in Cost Savings Programme
Tight focus on discretionary costs
10095
85
76
2007 2008 2009 MQ'10
Accelerated Cost savings & Operating leverage
MQ CEP are annualised for Full Year
MQ‘10 Results - 25th May 2010
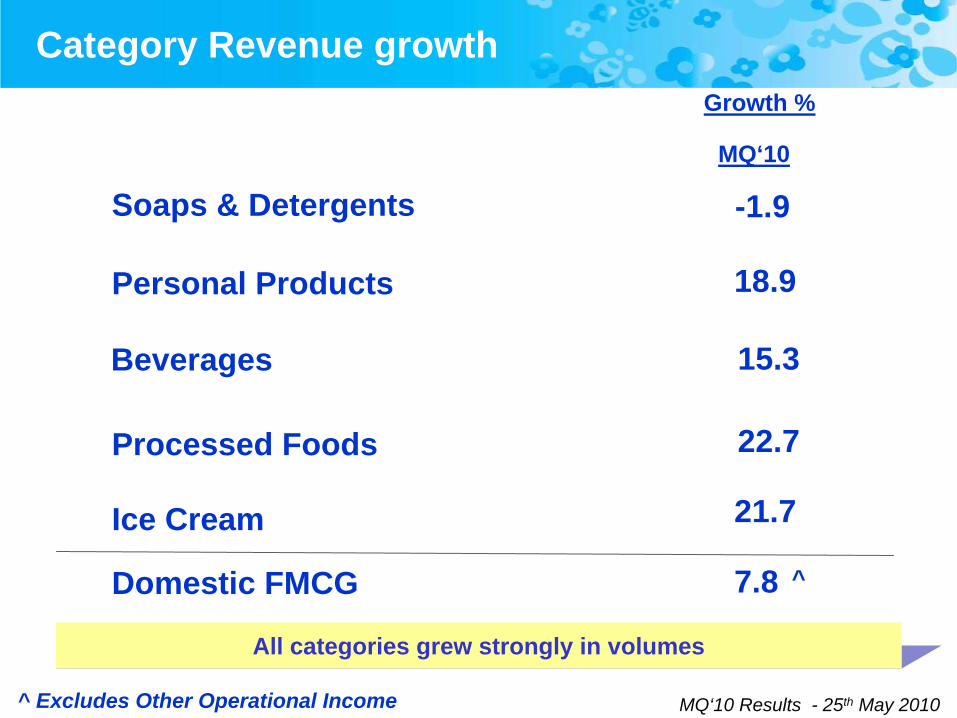
Growth %
Soaps & Detergents
Personal Products
Ice Cream
Processed Foods
Beverages
-1.9
18.9
15.3
21.7
22.7
Domestic FMCG 7.8
Category Revenue growth
MQ‘10
^
^ Excludes Other Operational Income
All categories grew strongly in volumes
MQ‘10 Results - 25th May 2010
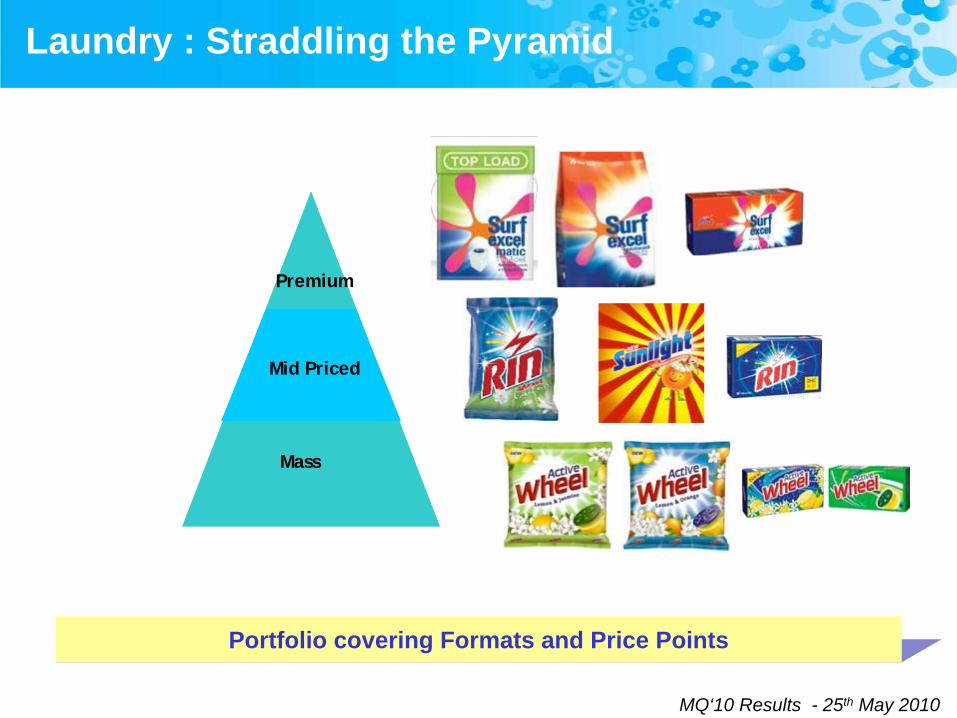
Laundry : Straddling the Pyramid
Mass
Mid Priced
Premium
Portfolio covering Formats and Price Points
MQ‘10 Results - 25th May 2010
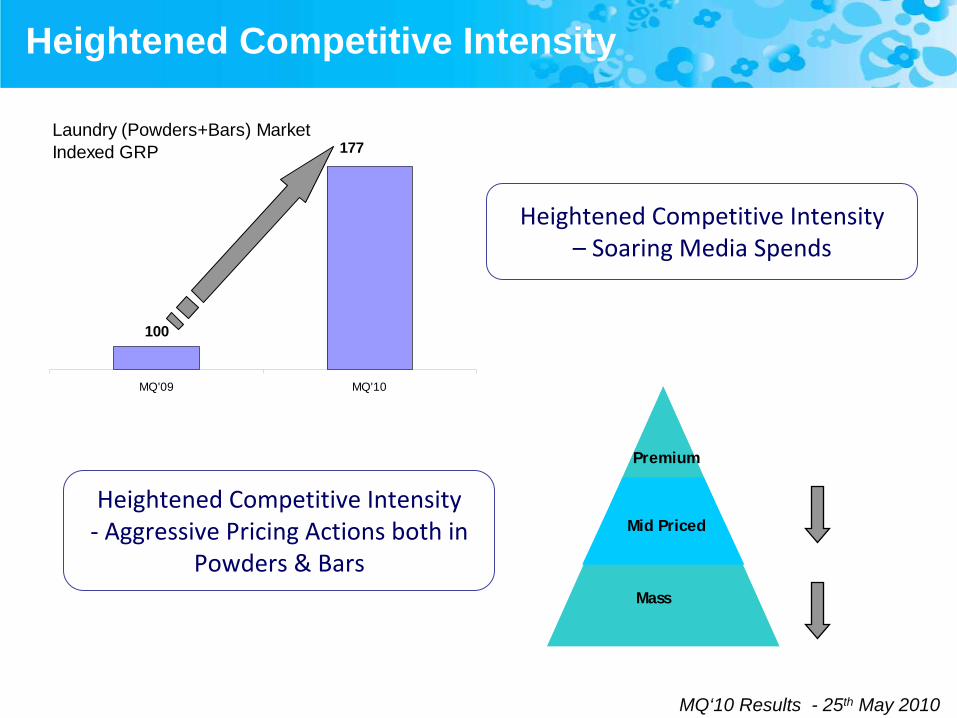
Heightened Competitive Intensity
Laundry (Powders+Bars) Market Indexed GRP
100
177
MQ'09 MQ'10
Heightened Competitive Intensity – Soaring Media Spends
Mass
Mid Priced
Premium
Heightened Competitive Intensity‐
Aggressive Pricing Actions both in
Powders & Bars
MQ‘10 Results - 25th May 2010
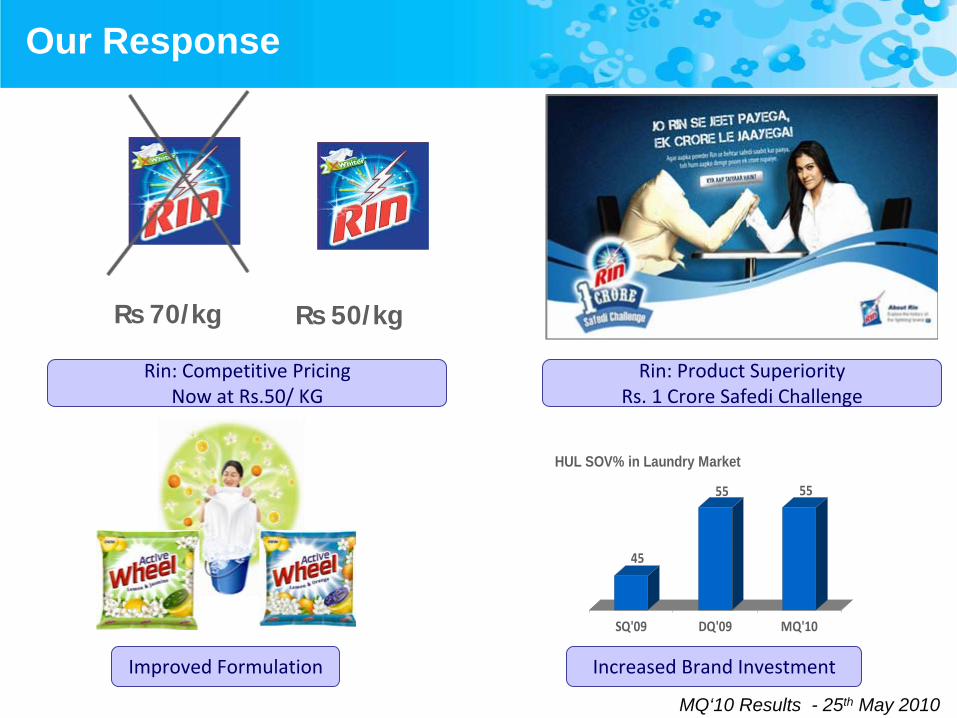
Our Response
Improved Formulation
45
55 55
SQ'09 DQ'09 MQ'10
HUL SOV% in Laundry Market
`
Increased Brand Investment
Rin: Product Superiority Rs. 1 Crore Safedi
Challenge
Rs 70/kg Rs 50/kg
Rin: Competitive Pricing Now at Rs.50/ KG
MQ‘10 Results - 25th May 2010
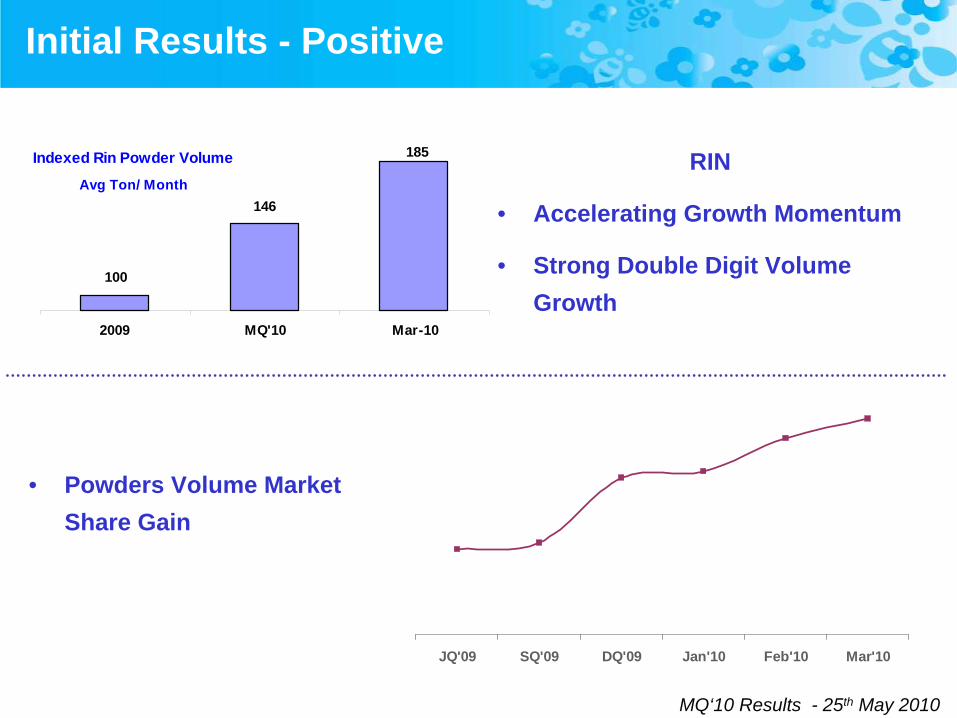
Initial Results - Positive
Indexed Rin Powder Volume
Avg Ton/ Month146
185
100
2009 MQ'10 Mar-10
RIN
• Accelerating Growth Momentum
• Strong Double Digit Volume Growth
JQ'09 SQ'09 DQ'09 Jan'10 Feb'10 Mar'10
• Powders Volume Market Share Gain
MQ‘10 Results - 25th May 2010
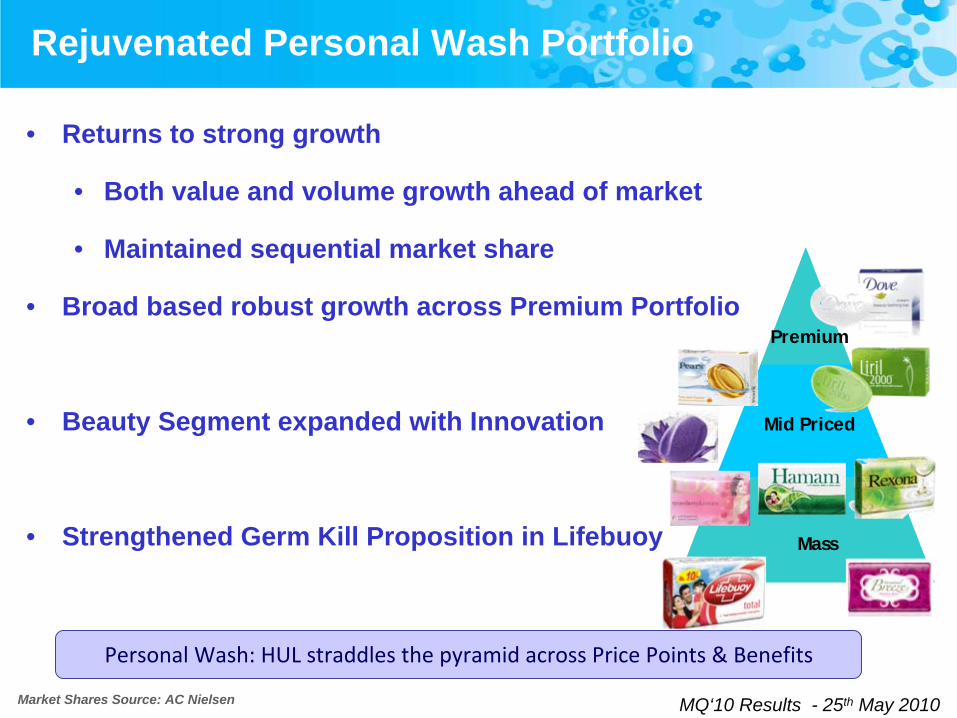
Rejuvenated Personal Wash Portfolio
Market Shares Source: AC Nielsen
Personal Wash: HUL straddles the pyramid across Price Points & Benefits
• Returns to strong growth
• Both value and volume growth ahead of market
• Maintained sequential market share
• Broad based robust growth across Premium Portfolio
• Beauty Segment expanded with Innovation
• Strengthened Germ Kill Proposition in Lifebuoy Mass
Mid Priced
Premium
MQ‘10 Results - 25th May 2010
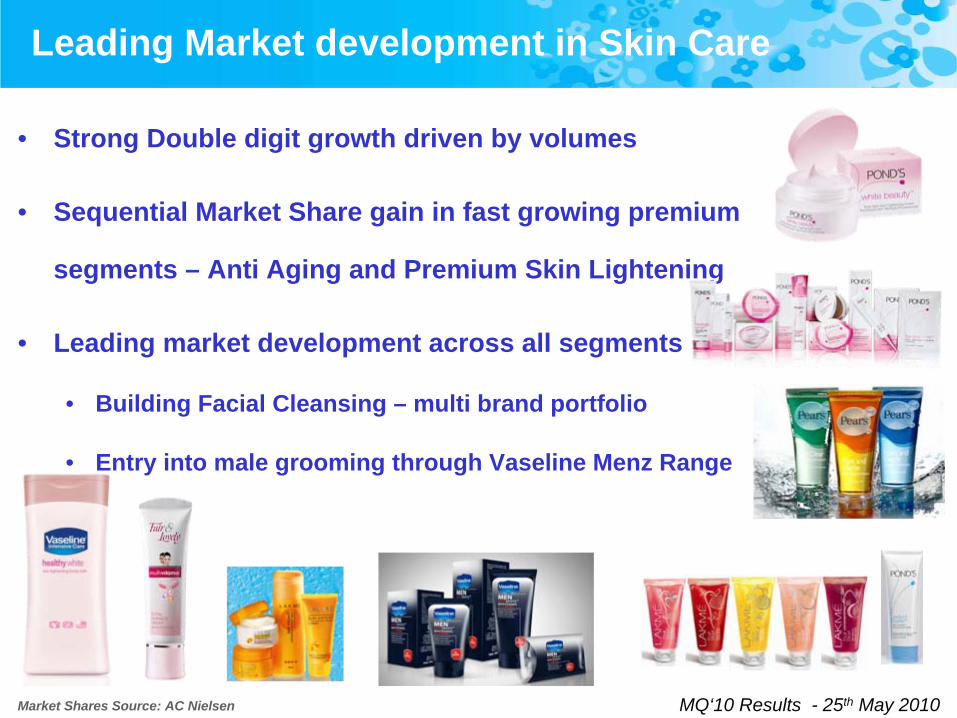
• Strong Double digit growth driven by volumes
• Sequential Market Share gain in fast growing premium
segments – Anti Aging and Premium Skin Lightening
• Leading market development across all segments
• Building Facial Cleansing – multi brand portfolio
• Entry into male grooming through Vaseline Menz Range
Leading Market development in Skin Care
Market Shares Source: AC Nielsen
MQ‘10 Results - 25th May 2010
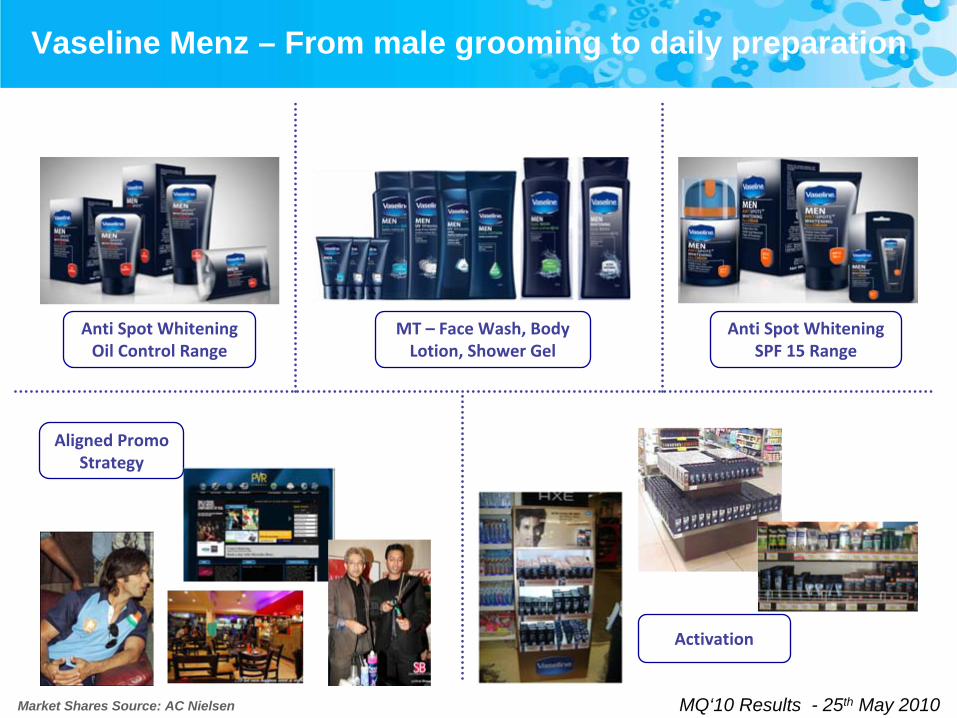
Vaseline Menz – From male grooming to daily preparation
Market Shares Source: AC Nielsen
Anti Spot Whitening
Oil Control Range
MT – Face Wash, Body
Lotion, Shower Gel
Anti Spot Whitening
SPF 15 Range
Aligned Promo
Strategy
Activation
MQ‘10 Results - 25th May 2010
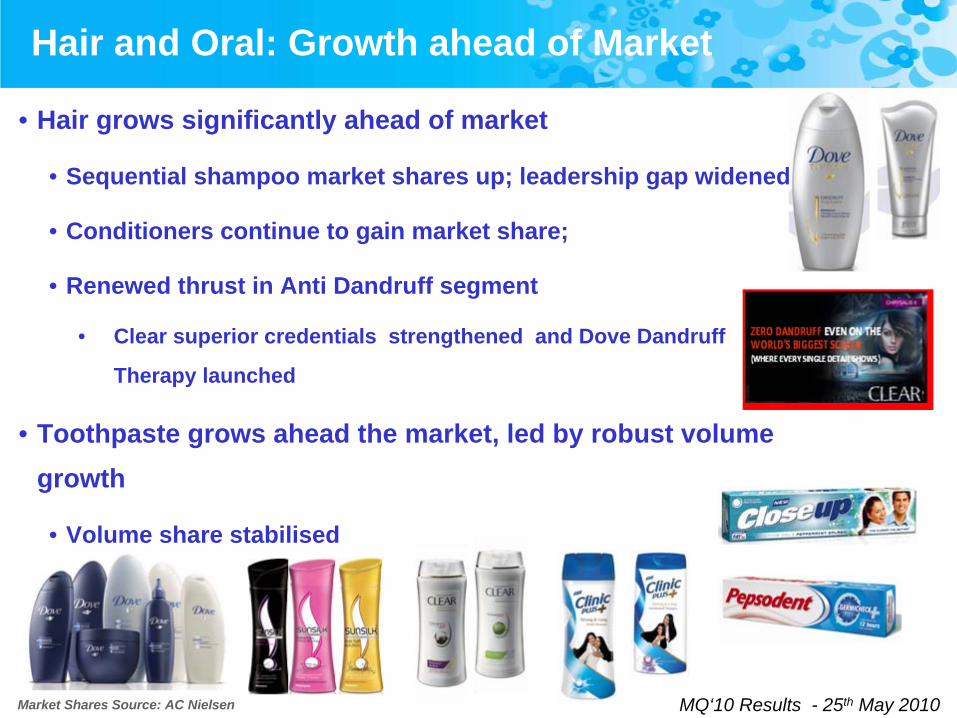
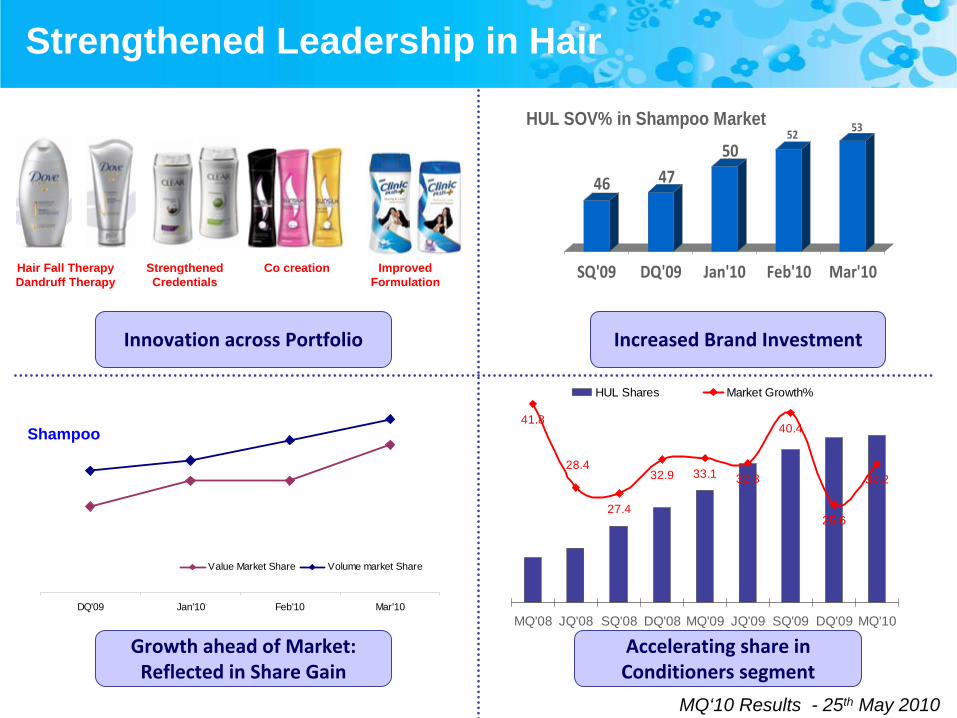
• Hair grows significantly ahead of market
• Sequential shampoo market shares up; leadership gap widened
• Conditioners continue to gain market share;
• Renewed thrust in Anti Dandruff segment
• Clear superior credentials strengthened and Dove Dandruff
Therapy launched
• Toothpaste grows ahead the market, led by robust volume growth
• Volume share stabilised
Hair and Oral: Growth ahead of Market
Market Shares Source: AC Nielsen
MQ‘10 Results - 25th May 2010
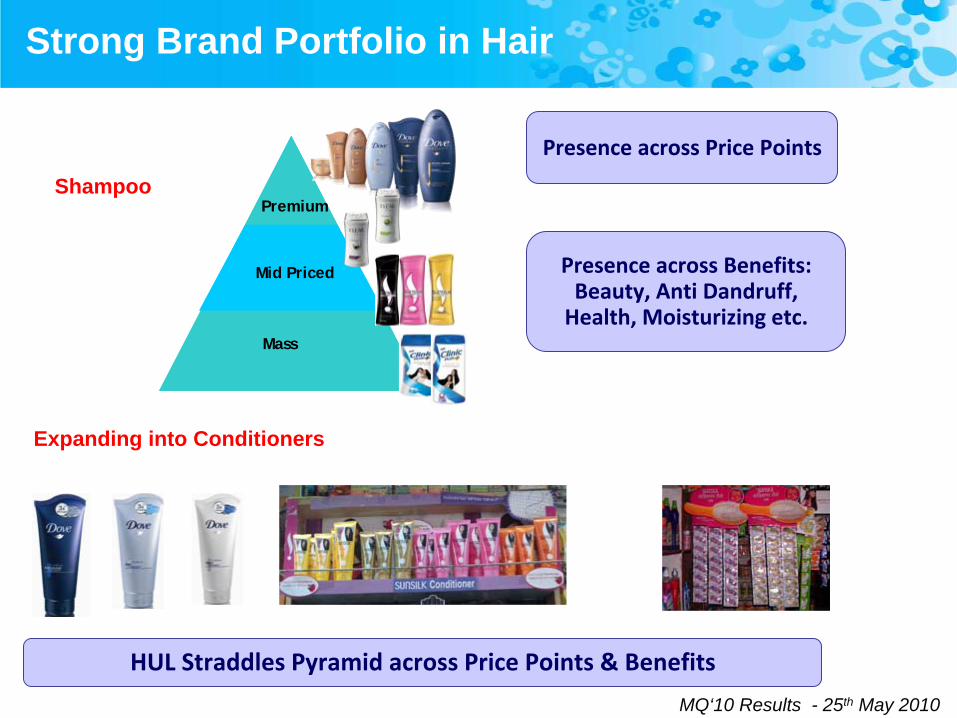
Strong Brand Portfolio in Hair
HUL Straddles Pyramid across Price Points & Benefits
Presence across Price Points
Presence across Benefits:
Beauty, Anti Dandruff,
Health, Moisturizing etc.
Shampoo
Expanding into Conditioners
Mass
Mid Priced
Premium
MQ‘10 Results - 25th May 2010
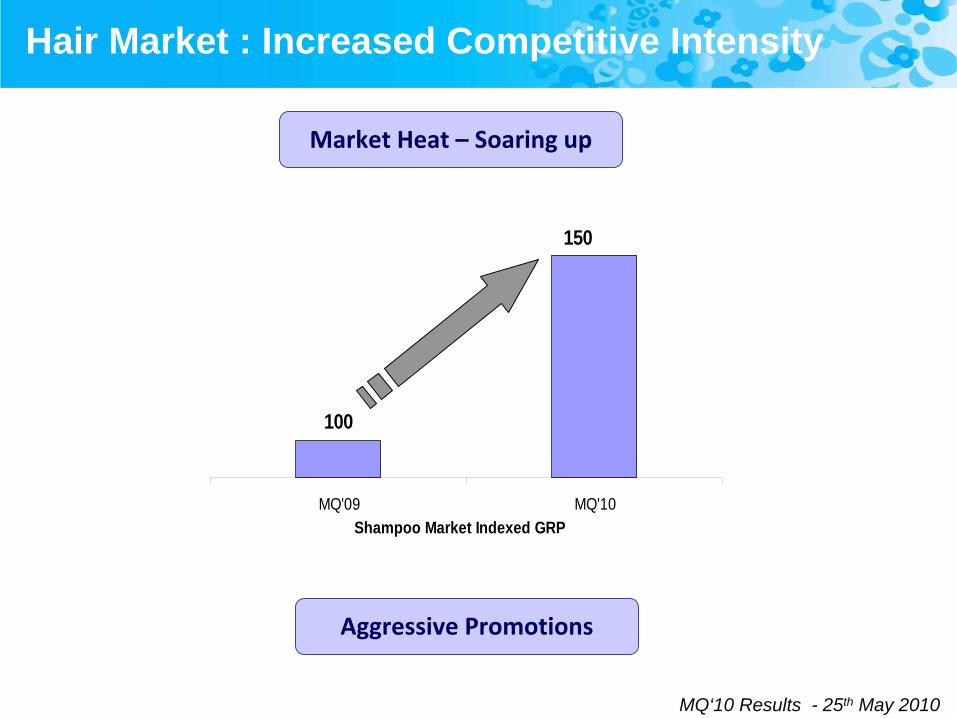
Hair Market : Increased Competitive Intensity
Shampoo Market Indexed GRP
150
100
MQ'09 MQ'10
Market Heat – Soaring up
Aggressive Promotions
MQ‘10 Results - 25th May 2010
Strengthened Leadership in Hair
46 4750
5253
SQ'09 DQ'09 Jan'10 Feb'10 Mar'10
HUL SOV% in Shampoo Market
`
Increased Brand InvestmentInnovation across Portfolio
DQ'09 Jan'10 Feb'10 Mar'10
Value Market Share Volume market Share
Growth ahead of Market:
Reflected in Share Gain
Accelerating share in
Conditioners segment
41.8
27.4
32.9 33.1 32.3
40.4
25.6
32.228.4
MQ'08 JQ'08 SQ'08 DQ'08 MQ'09 JQ'09 SQ'09 DQ'09 MQ'10
HUL Shares Market Growth%
Co creationHair Fall TherapyDandruff Therapy
StrengthenedCredentials
ImprovedFormulation
Shampoo
MQ‘10 Results - 25th May 2010
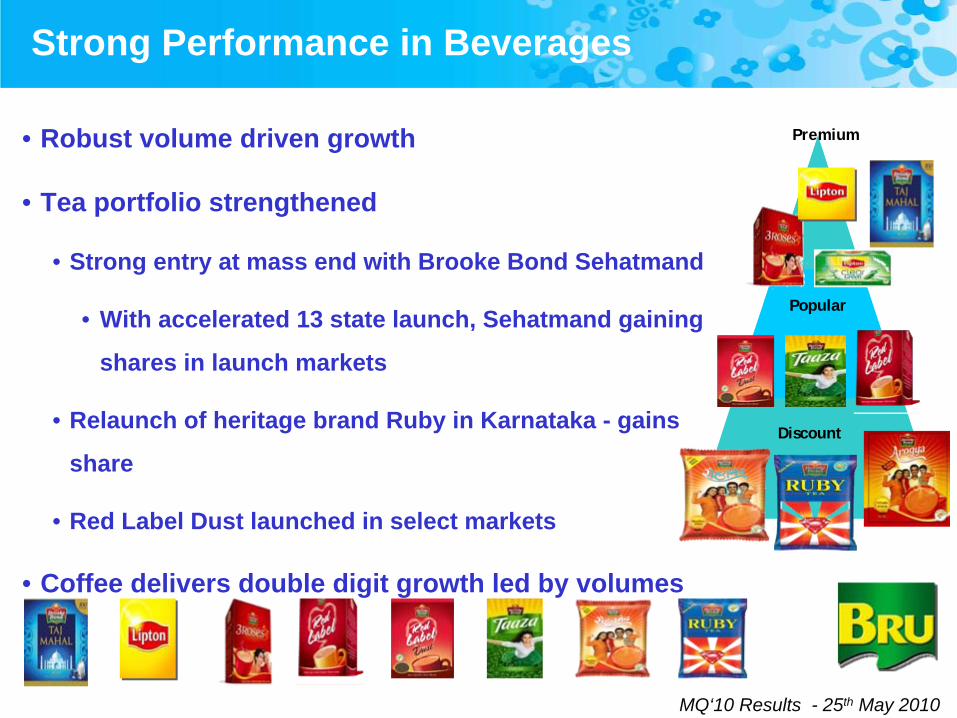
Discount
Popular
Premium
Strong Performance in Beverages
• Robust volume driven growth
• Tea portfolio strengthened
• Strong entry at mass end with Brooke Bond Sehatmand
• With accelerated 13 state launch, Sehatmand gaining
shares in launch markets
• Relaunch of heritage brand Ruby in Karnataka - gains
share
• Red Label Dust launched in select markets
• Coffee delivers double digit growth led by volumes
MQ‘10 Results - 25th May 2010
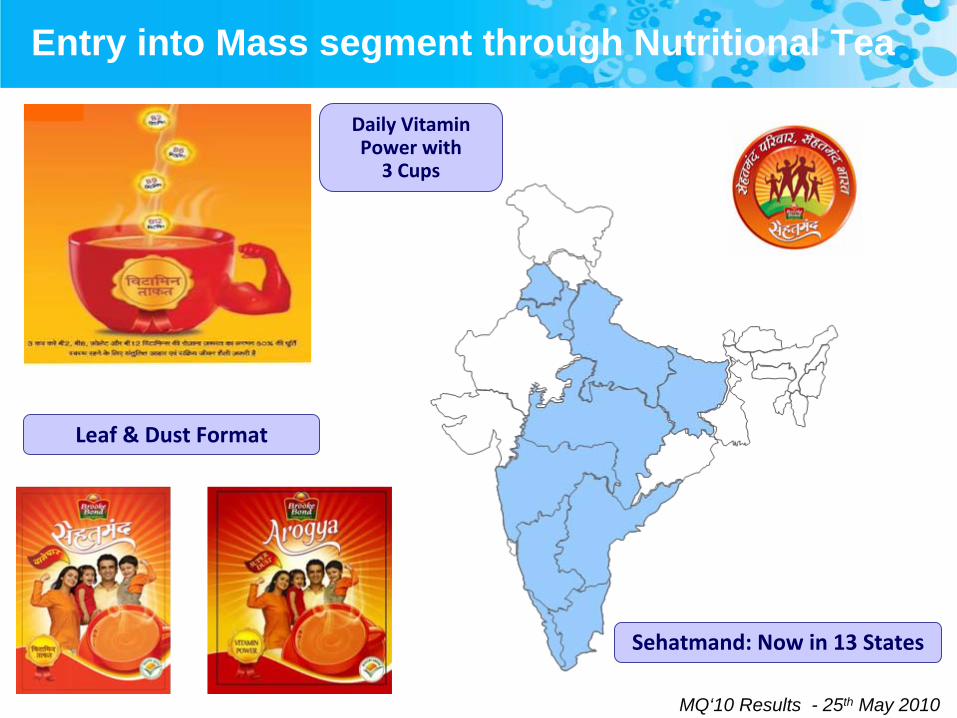
Entry into Mass segment through Nutritional Tea
Sehatmand: Now in 13 States
Leaf & Dust Format
Daily Vitamin
Power with 3 Cups
MQ‘10 Results - 25th May 2010
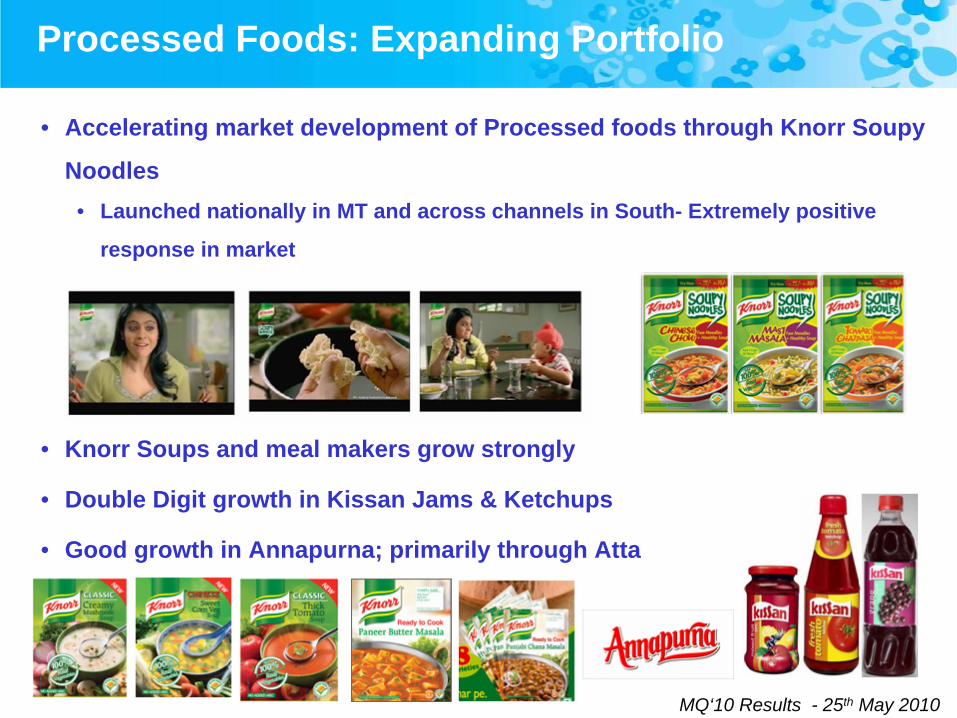
Processed Foods: Expanding Portfolio
• Accelerating market development of Processed foods through Knorr Soupy
Noodles• Launched nationally in MT and across channels in South- Extremely positive
response in market
• Knorr Soups and meal makers grow strongly
• Double Digit growth in Kissan Jams & Ketchups
• Good growth in Annapurna; primarily through Atta
MQ‘10 Results - 25th May 2010
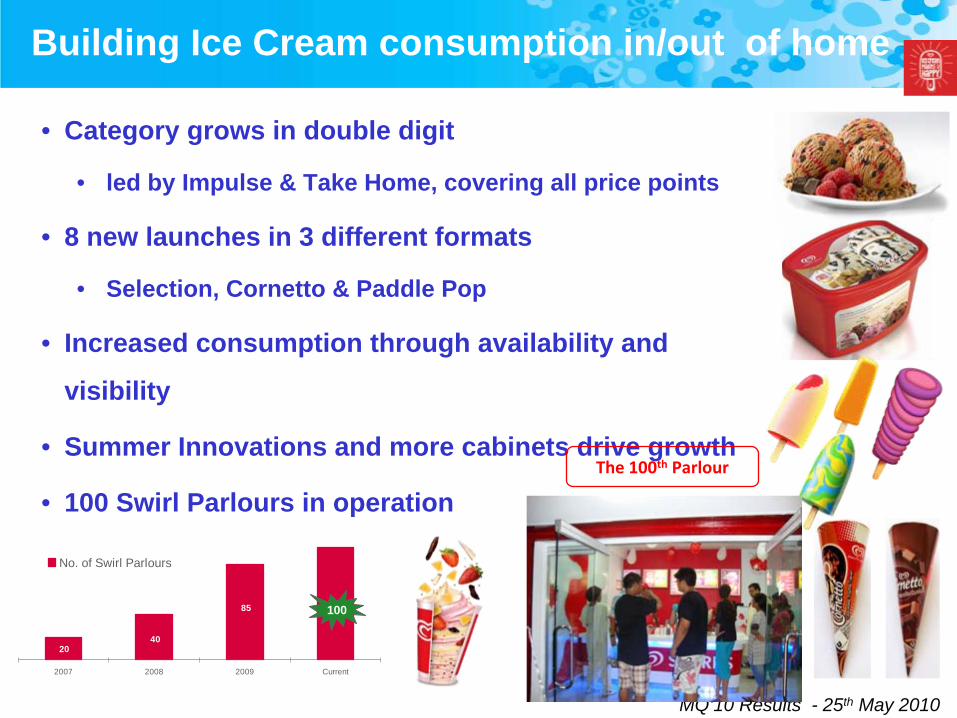
• Category grows in double digit
• led by Impulse & Take Home, covering all price points
• 8 new launches in 3 different formats
• Selection, Cornetto & Paddle Pop
• Increased consumption through availability and
visibility
• Summer Innovations and more cabinets drive growth
• 100 Swirl Parlours in operation
85 100
4020
2007 2008 2009 Current
No. of Swirl Parlours
Building Ice Cream consumption in/out of home
100
The 100th
Parlour
MQ‘10 Results - 25th May 2010
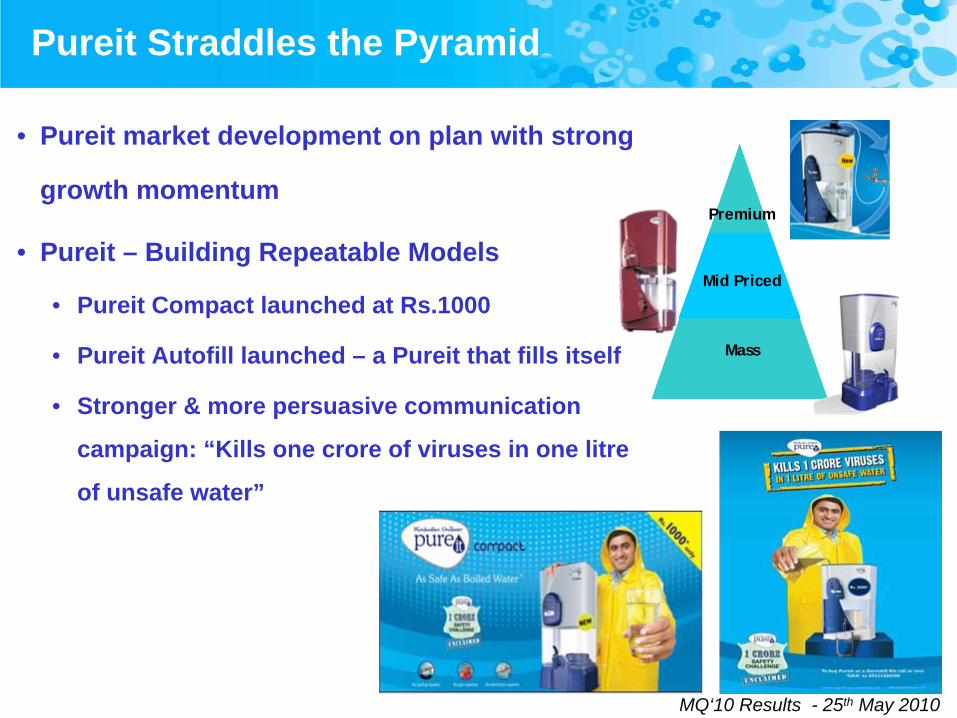
Pureit Straddles the Pyramid
• Pureit market development on plan with strong
growth momentum
• Pureit – Building Repeatable Models
• Pureit Compact launched at Rs.1000
• Pureit Autofill launched – a Pureit that fills itself
• Stronger & more persuasive communication
campaign: “Kills one crore of viruses in one litre
of unsafe water”
Mass
Mid Priced
Premium
MQ‘10 Results - 25th May 2010
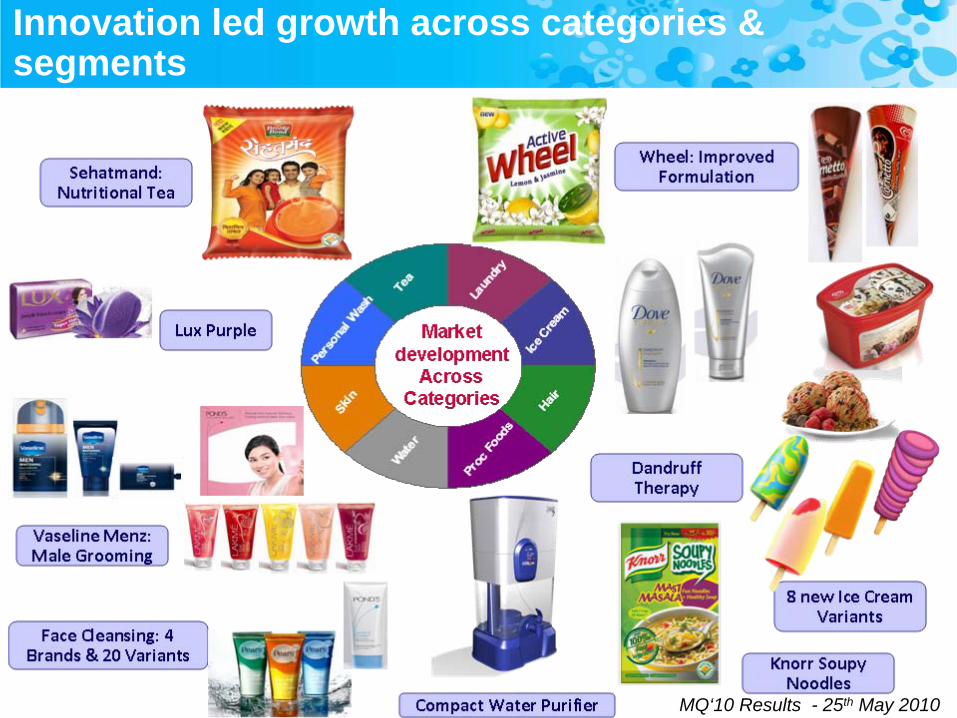
Innovation led growth across categories & segments
MQ‘10 Results - 25th May 2010
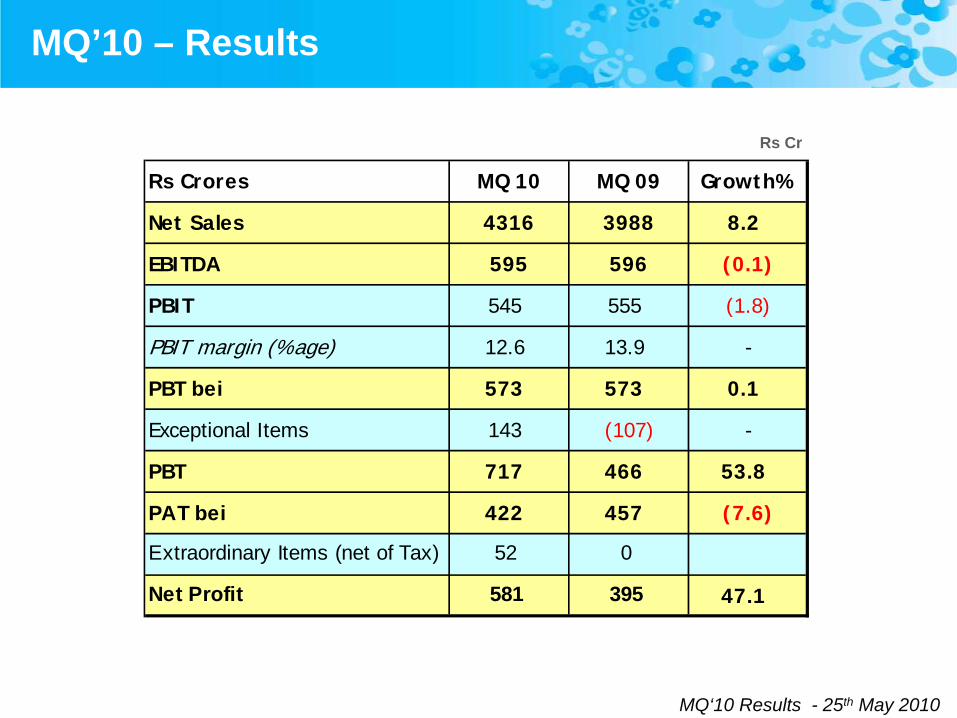
MQ’10 – Results
Rs Crores MQ 10 MQ 09 Growth%
Net Sales 4316 3988 8.2
EBITDA 595 596 (0.1)
PBIT 545 555 (1.8)
PBIT margin (%age) 12.6 13.9 -
PBT bei 573 573 0.1
Exceptional Items 143 (107) -
PBT 717 466 53.8
PAT bei 422 457 (7.6)
Extraordinary Items (net of Tax) 52 0
Net Profit 581 395 47.1
Rs Cr
MQ‘10 Results - 25th May 2010
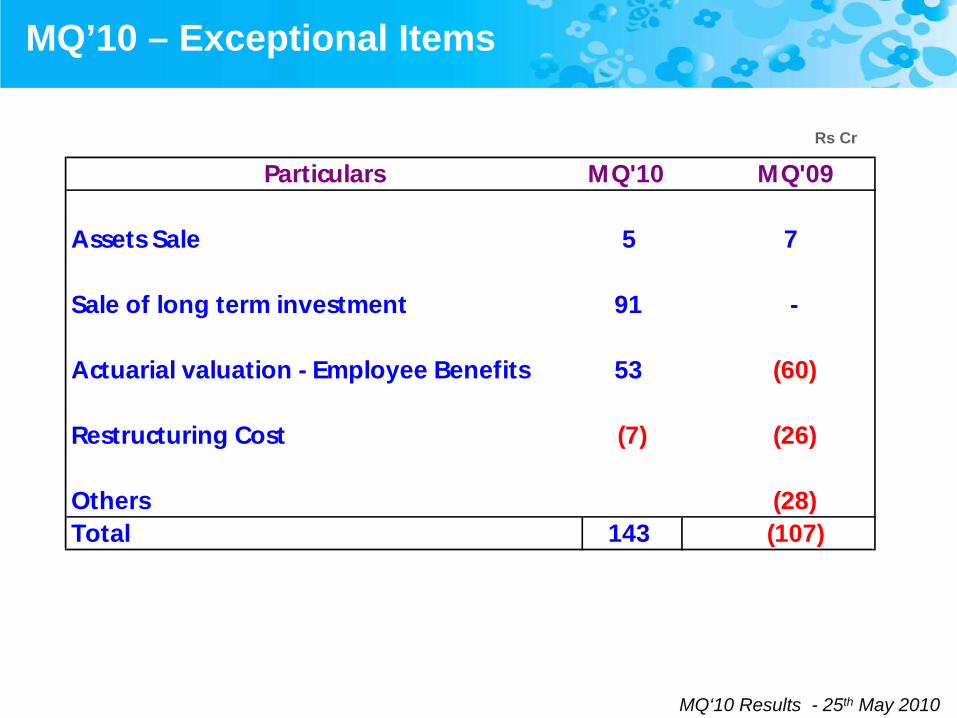
MQ’10 – Exceptional Items
Particulars MQ'10 MQ'09
Assets Sale 5 7
Sale of long term investment 91 -
Actuarial valuation - Employee Benefits 53 (60)
Restructuring Cost (7) (26)
Others (28)Total 143 (107)
Rs Cr
MQ‘10 Results - 25th May 2010
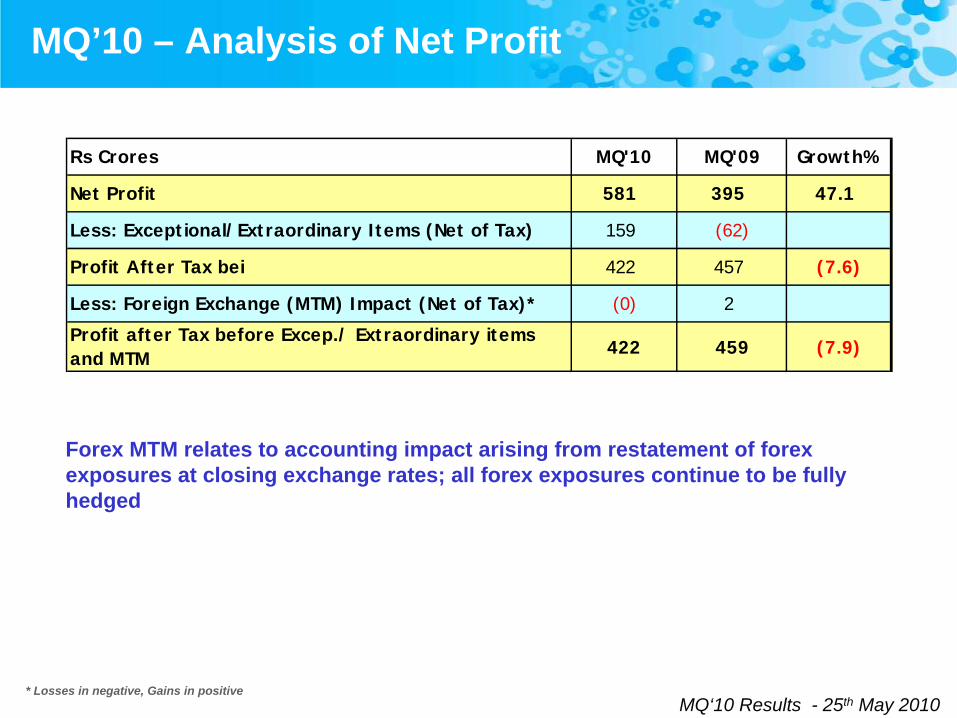
MQ’10 – Analysis of Net Profit
Rs Crores MQ'10 MQ'09 Growth%
Net Profit 581 395 47.1
Less: Exceptional/Extraordinary Items (Net of Tax) 159 (62)
Profit After Tax bei 422 457 (7.6)
Less: Foreign Exchange (MTM) Impact (Net of Tax)* (0) 2
Profit after Tax before Excep./ Extraordinary items and MTM 422 459 (7.9)
* Losses in negative, Gains in positive
Forex MTM relates to accounting impact arising from restatement of forex exposures at closing exchange rates; all forex exposures continue to be fully hedged
MQ‘10 Results - 25th May 2010
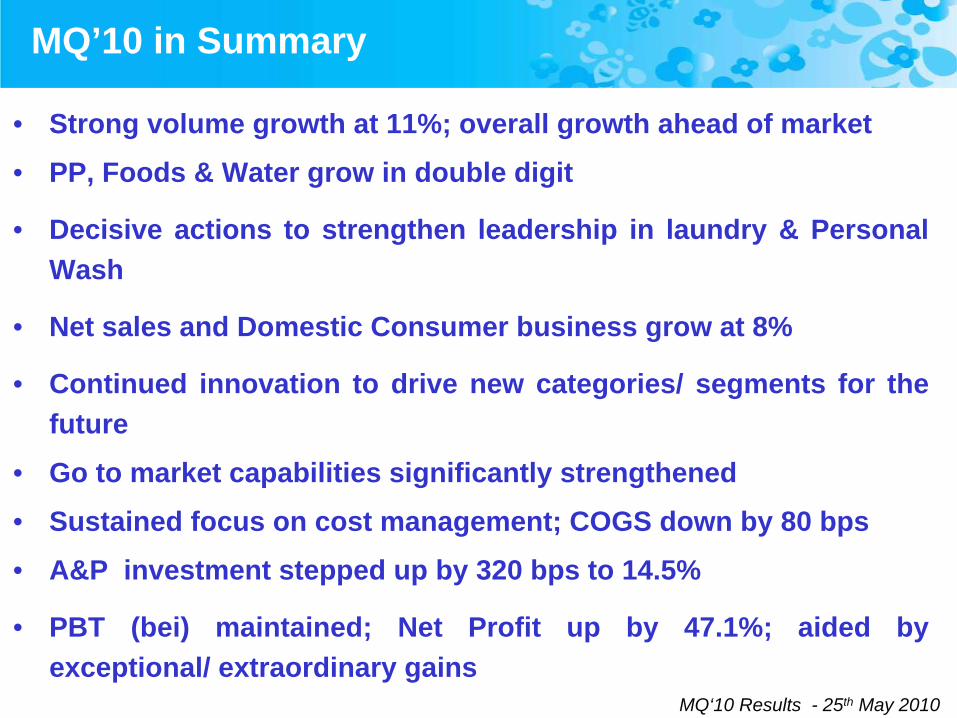
• Strong volume growth at 11%; overall growth ahead of market
• PP, Foods & Water grow in double digit
• Decisive actions to strengthen leadership in laundry & Personal Wash
• Net sales and Domestic Consumer business grow at 8%
• Continued innovation to drive new categories/ segments for the future
• Go to market capabilities significantly strengthened
• Sustained focus on cost management; COGS down by 80 bps
• A&P investment stepped up by 320 bps to 14.5%
• PBT (bei) maintained; Net Profit up by 47.1%; aided by exceptional/ extraordinary gains
MQ’10 in Summary
MQ‘10 Results - 25th May 2010
Financial year 2009- 10
Performance Review
MQ‘10 Results - 25th May 2010
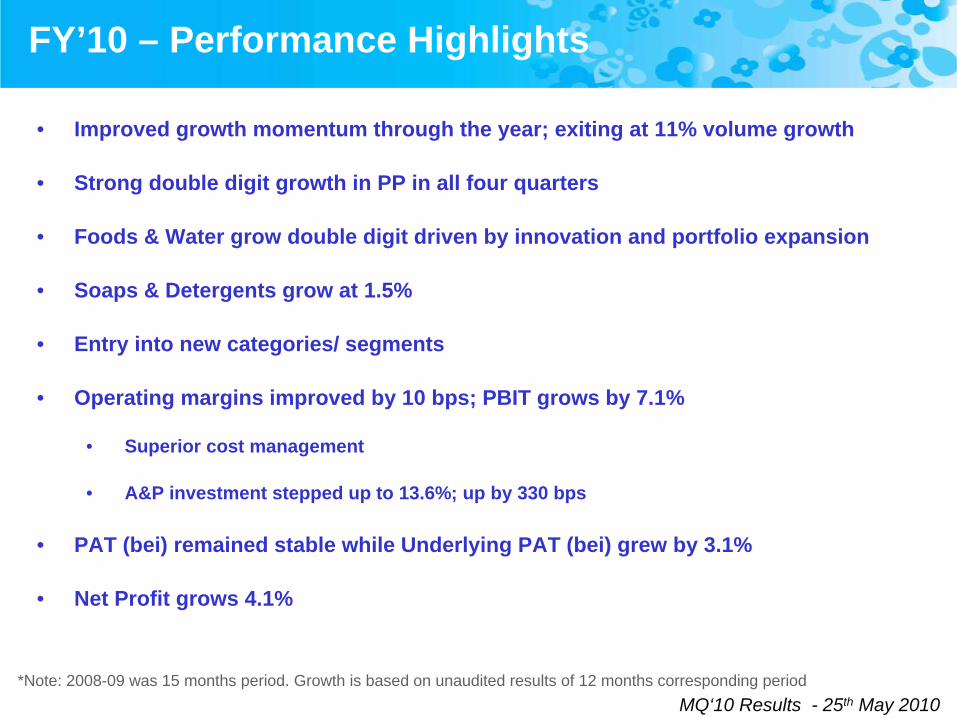
FY’10 – Performance Highlights
• Improved growth momentum through the year; exiting at 11% volume growth
• Strong double digit growth in PP in all four quarters
• Foods & Water grow double digit driven by innovation and portfolio expansion
• Soaps & Detergents grow at 1.5%
• Entry into new categories/ segments
• Operating margins improved by 10 bps; PBIT grows by 7.1%
• Superior cost management
• A&P investment stepped up to 13.6%; up by 330 bps
• PAT (bei) remained stable while Underlying PAT (bei) grew by 3.1%
• Net Profit grows 4.1%
*Note: 2008-09 was 15 months period. Growth is based on unaudited results of 12 months corresponding period
MQ‘10 Results - 25th May 2010
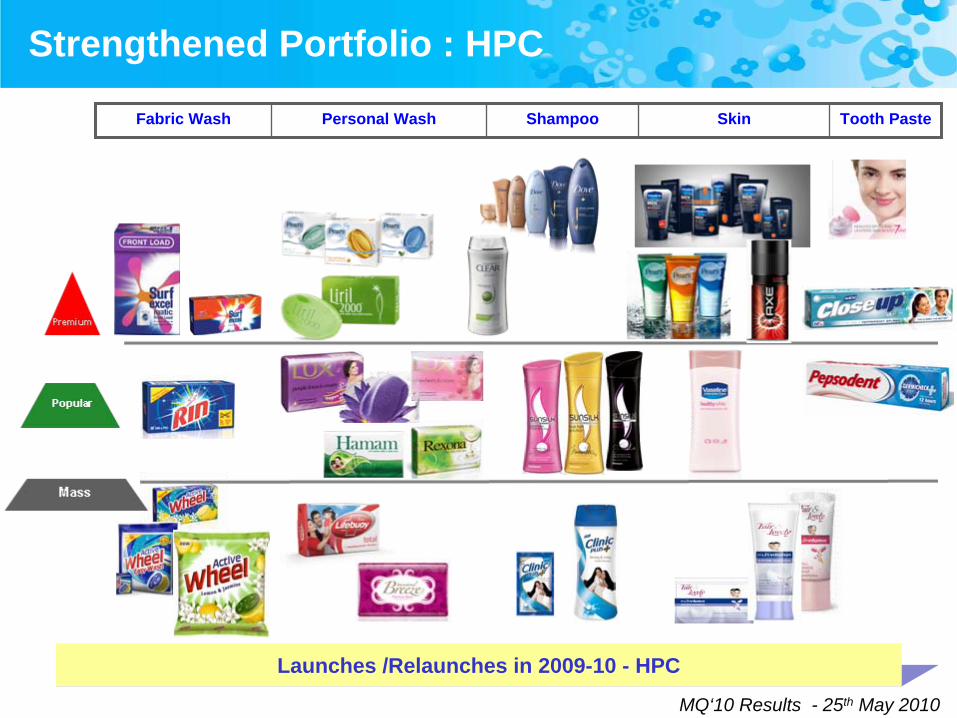
Strengthened Portfolio : HPC
Fabric Wash Personal Wash Shampoo Skin Tooth Paste
Launches /Relaunches in 2009-10 - HPC
MQ‘10 Results - 25th May 2010
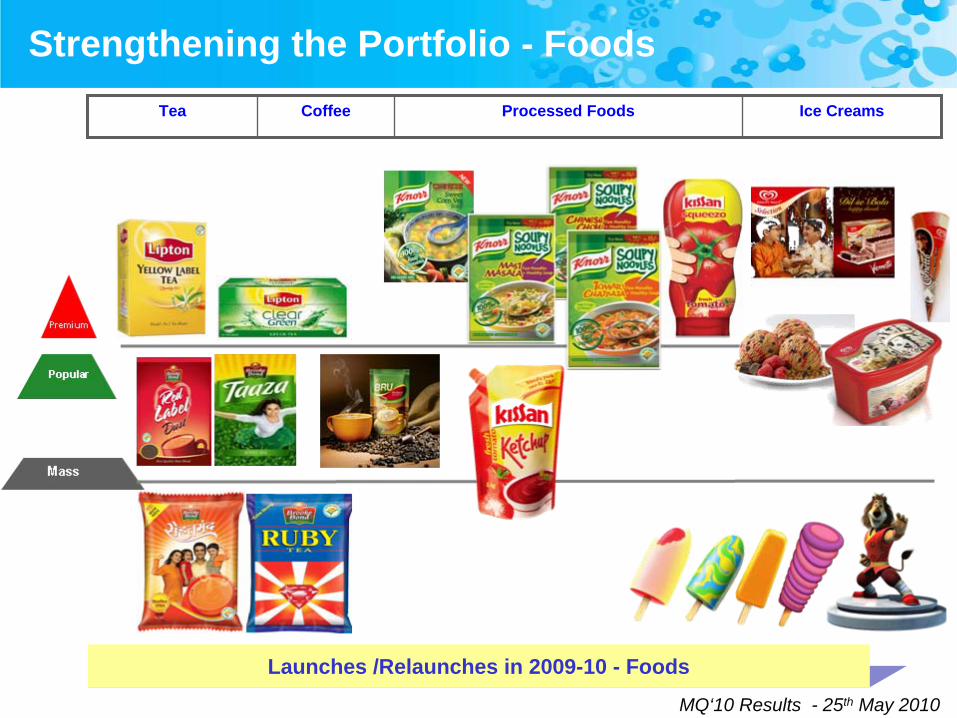
Strengthening the Portfolio - FoodsTea Coffee Processed Foods Ice Creams
Launches /Relaunches in 2009-10 - Foods
MQ‘10 Results - 25th May 2010
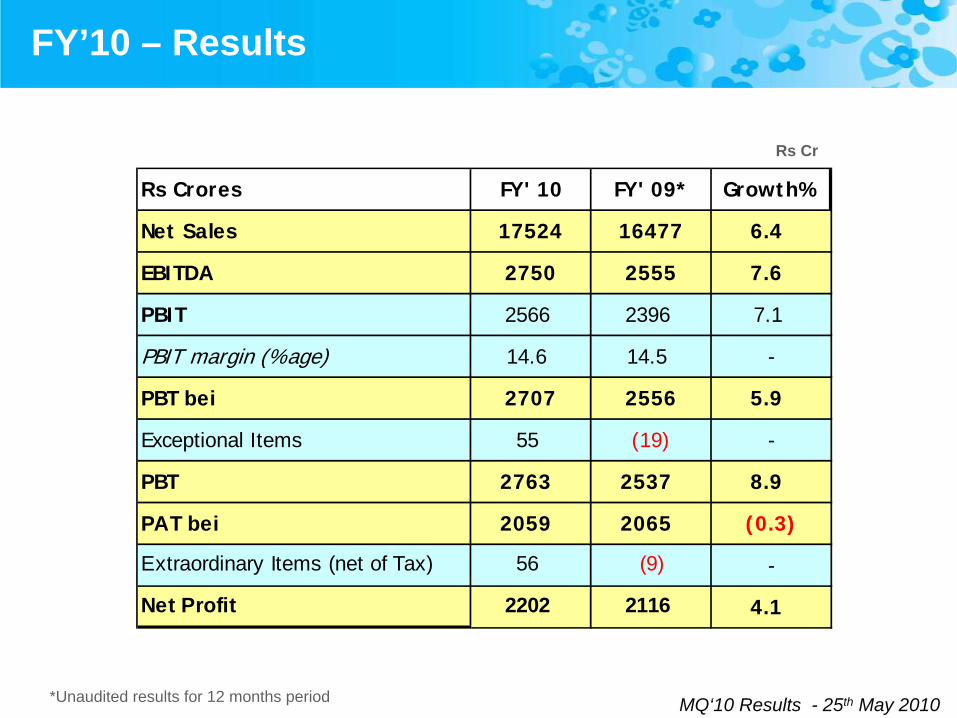
FY’10 – Results
Rs Crores FY' 10 FY' 09* Growth%
Net Sales 17524 16477 6.4
EBITDA 2750 2555 7.6
PBIT 2566 2396 7.1
PBIT margin (%age) 14.6 14.5 -
PBT bei 2707 2556 5.9
Exceptional Items 55 (19) -
PBT 2763 2537 8.9
PAT bei 2059 2065 (0.3)
Extraordinary Items (net of Tax) 56 (9) -
Net Profit 2202 2116 4.1
*Unaudited results for 12 months period
Rs Cr
MQ‘10 Results - 25th May 2010
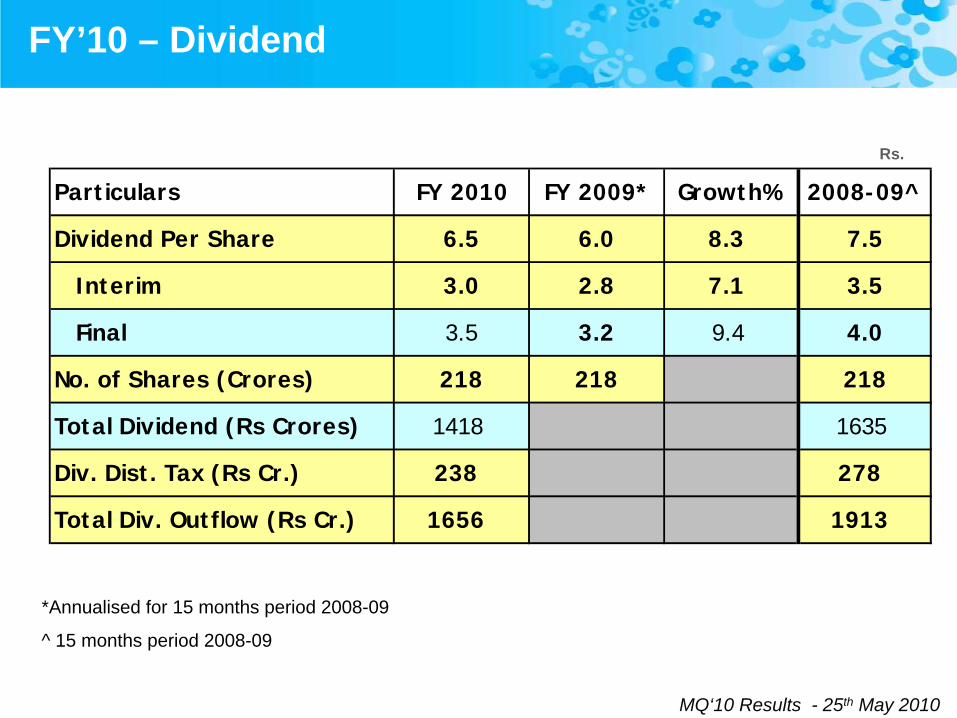
FY’10 – Dividend
Particulars FY 2010 FY 2009* Growth% 2008-09^
Dividend Per Share 6.5 6.0 8.3 7.5
Interim 3.0 2.8 7.1 3.5
Final 3.5 3.2 9.4 4.0
No. of Shares (Crores) 218 218 218
Total Dividend (Rs Crores) 1418 1635
Div. Dist. Tax (Rs Cr.) 238 278
Total Div. Outflow (Rs Cr.) 1656 1913
*Annualised for 15 months period 2008-09
^ 15 months period 2008-09
Rs.
MQ‘10 Results - 25th May 2010
Looking ahead
• Competition will intensify further - unblinking defense of our strong market leadership
• Our Focus remains to :
• Continuously strengthen competitiveness of our Portfolio and Brands
• Deliver bigger and better innovations
• Lead market development – entry into new categories and segments
• Strengthen overall organisational capabilities to continuously improve the quality of execution and speed to market

MQ‘10 Results - 25th May 2010
Thank you
For more information, please visit For more information, please visit http://http://www.hul.co.inwww.hul.co.in
Results – MQ ’10
25th May 2010
Investor Presentation
![Instability due to trapped electrons in magnetized multi ... · charging mechanisms [11], namely thermionic emission, field emission, radioactivity, impact ionization, etc. These](https://img.pdfslide.us/doc/110x75/5f8d6fa4698d2313b81b15ba/instability-due-to-trapped-electrons-in-magnetized-multi-charging-mechanisms.jpg)