Embed Size (px)
Citation preview
R E S U L T S2 0 1 1


R E S U L T S 2 0 1 1
1.
2.
3.
4.
5.
Corporate Bodies
Letter to the Shareholders
Interpump Group’s Structure
Financial highlights
Consolidated statement offinancial position
Consolidated income statement
Comprehensive consolidatedincome statement
Consolidated cash flow statement
Statement of changes inconsolidated shareholders’ equity
Directors’ remarks onperformance in 2011
Companies in the Group
Business sector information
Independent Auditor’s report
Pag. 5
Pag. 6
Pag. 9
Pag. 11
Pag. 15
Pag. 17
Pag. 19
Pag. 20
Pag. 22
Pag. 25
Pag. 32
Pag. 35
Pag. 42
Annex 1 Pag. 45
6.
7.
8.
9.
10.
11.
12.
13.
3
INDEX

Chairman
Deputy Chairmanand Executive Director
Executive Director
Independent Director
Independent Director
Non-executive Director
Non-executive Director
Non-executive Director
Independent Director
Non-executive Director
Giovanni Cavallini
Fulvio Montipò
Paolo Marinsek
Salvatore Bragantini
Sergio Erede
Giuseppe Ferrero
Marco Reboa (a), (b)
Giovanni Tamburi (b)
Franco Cattaneo (a), (b)
Giancarlo Mocchi (a)
Chairman
Statutory Auditor
Statutory Auditor
Enrico Cervellera
Achille Delmonte
Paolo Scarioni
(a) Member of the Audit Committee(b) Member of the Remuneration Committee
PricewaterhouseCoopers S.p.A.
5
Board of Directors
Board of Statutory Auditors
Independent Auditors
Interpump Group S.p.A.Head Office: 42049 Sant’Ilario d’Enza (RE) - Via E. Fermi, 25Share Capital: Euro 50,787,787.44 wolly paid up - Court of Reggio EmiliaCompanies Register R.E.- Tax Code 11666900151Vat Number IT 01682900350
CORPORATE BOD I ES 1.
Dear Shareholders,
In 2011 the Interpump Group reached a historic record for EBITDA, recording earnings of €95.0 million. Despite differences betweenbusiness activities and geographical areas, we can consider that the 2009 crisis is now behind us, even though reasons for uncertaintyin the global macroeconomic scenario persist. In relation to sales, the Industrial Sector far exceeded pre-crisis levels, while the HydraulicSector reached approximately 80% of pre-crisis levels. Highly encouraging signals were received from North America and EmergingCountries (BRIC) with significant growth percentages (respectively +20.5% and +48.2%). Contrasting signals were recorded in Europe(including Italy), which anyway returned average growth of 16.2%, although results country by country varied widely. The driving rolewas played by Germany (+35.3%).
The Interpump Group achieved the following consolidated results in 2011:- sales rose by 16.1% to €493.3 million (€472.3 million, excluding the sales of Unielectric, which was sold in September 2011),
compared to the €424.9 million of 2010;- as already mentioned, EBITDA rose to €95.0 million, equivalent to 19.3% of sales (€94.7 million without Unielectric or 20.0% of sales)
compared to €74.1 million in 2010 (equivalent to 17.4% of sales), representing growth of 28.2%;- EBIT reached €75.8 million, equivalent to 15.4% of sales (€54.7 million in 2010), reflecting an increase of 38.5%;- net profit rose by 55.5% to reach €42.6 million, compared to the €27.4 million of 2010;- earnings per share were €0.439 versus €0.284 for 2010 (+54.6%);- ROCE reached 16.4% versus 12.5% of 2010 and ROE rose to 13.5% compared to the 9.5% of 2010;- Net financial indebtedness, including debts for the acquisition of the minority interests of already controlled companies (equivalent to
€19.0 million) was €146.0 million at 31 December 2011 (€147.8 million at 31 December 2010). The €28.8 million free cash flow was entirely utilised for the acquisition of investments, treasury stock and dividends.
Performance by sector
Sales of the Hydraulic Sector totalled €229.9 million compared to the €190.3 million for 2010 and were therefore up by 20.8% (+18.1%on a like for like basis). Sales of US companies increased by 38.3% in dollar on dollar terms (+27.8% on a like for like basis); translatedinto euro the increase was 31.6% (+21.7% on a like for like basis). Sales of the other companies in the Hydraulic Sector rose by 16.7%with respect to the figure for 2010.
EBITDA for the Hydraulic Sector was €32.9 million or 14.3% of sales (€23.6 million in 2010, equivalent to 12.4% of sales), reflectinggrowth of 39.2% and improving by 1.9 percentage points both due to increase in volumes and the control of costs.
Industrial Sector turnover was up by 15.5% at €242.4 million compared to the €209.8 million of 2010. Sales of very-high pressuresystems reached €148.4 million, with growth of 21.3% compared to the €122.4 million in 2010. Sales of high pressure water pumpsreached €82.1 million and were up by 8.8% compared to the €75.4 million of 2010.
Industrial Sector EBITDA totalled €60.7 million (25.0% of sales) compared to the figure of €50.3 million recorded in 2010 (23.9% ofsales), reflecting growth of 20.5%.
External growth
2011 saw an increase in the Group’s rate of external growth. In April 2011 the Group acquired American Mobile Power (AMP)headquartered in Fairmont (Indiana - USA), one of the main US manufacturers of aluminium and steel tanks for industrial vehicle hydraulicsystems. The Company's sales from 1 April to 31 December 2011 (nine months) totalled $7.7 million with EBITDA of $1.5 million, equivalentto 19.6% of sales. The Group acquired 80% of American Mobile's shares for the overall price of $6.8 million, paid in cash. AMP’soperations are highly synergistic with respect to the business of the Interpump Group's Hydraulic Division. In this context, Muncie PowerProducts, which is a wholly owned subsidiary of Interpump Group, is the US leader in power take-offs for industrial vehicles and it hasstrengthened its position on the US market thanks to the acquisition of American Mobile, expanding its product offering with AMP's tanks.
In addition, preliminary contracts were signed in 2011 for the acquisition of Takarada, Galtech and MTC: the deals were closed in Januaryand February of 2012 so these companies were excluded from the 2011 consolidated financial statements, although they will feature inthe 2012 report.
Takarada, with registered office in Caxias do Sul (state of Rio Grande do Sul - Brazil), is a leading manufacturer and seller of powertake-offs and related hydraulic components for industrial vehicles in Brazil. In 2011 the company recorded sales of 17.9 million Reais(€8.0 million) and EBITDA of 3.3 million Reais (€1.5 million), equivalent to 18.6% of sales. A total of 29.0 million Reais (€12.9 million)was paid for 100% of Takarada's capital, inclusive of the company's financial debt. Also Takarada’s operations are highly synergisticwith respect to the business of the Interpump Group's Hydraulic Division. With the acquisition of Takarada, the Interpump Group lays thegroundwork for substantial growth of the Hydraulic Sector in Brazil, currently on the verge of allocating significant funds to the developmentof infrastructure in the coming years, also thanks to its selection as the host of forthcoming top international sporting events (Football WorldCup and the Olympics).
R E S U LT S 2 0 1 1
Galtech and MTC, both headquartered in Reggio Emilia, Italy, are engaged in the manufacture and sale of directional control valves,hydraulic valves and accessories, gear pumps and gear motors. The companies recorded combined sales of € 20.7 million in 2011, withEBITDA of €1.1 million. The net financial indebtedness of the two companies at 31 December 2011 was €1.1 million. 53% of Galtech'sshare capital and 60% of the capital of MTC was acquired for €6.3 million, of which €4.7 million paid in cash and the remaining amountsettled with 300,831 Interpump Group S.p.A. treasury shares.
Also the operations of Galtech and MTC are highly synergistic with respect to the business of the Interpump Group's Hydraulic Sector. Inthis context, it should be noted that Interpump Hydraulics S.p.A., a 100% owned subsidiary of Interpump Group S.p.A, is world leaderin power take-offs for industrial vehicles and through the acquisitions of Galtech and MTC it has strengthened its market position bybroadening its product offering.
Treasury stock
In 2011 the Group acquired 3,548,594 treasury shares at an average price of €4.6468; the shares can be used for the acquisition ofequity investments or to service stock option plans. In the same period, 1,074,286 treasury shares were sold for €4.3 million to pay forinvestments, and 50,000 for the exercise of stock options. At 31 December 2011 Interpump Group held 5,484,280 treasury shares,equivalent to 5.6% of the share capital, with an average unit cost of €4.449.
Dividends
The Board of Directors made a proposal to the shareholders' meeting to distribute a dividend of 12 euro cents per share. If approved,the dividend will be distributed as from 10 May with coupon clipping date of 7 May.From the share listing date (16 December 1996) to 8 March 2012 (share reference price of €6.35), the total return for shareholders hasbeen 11% annually for more than 15 consecutive years, considering the increase in value of the share, the dividends, the purchase oftreasury stock and the capital increase.
Warrants
October 2011 saw the end of the second exercise period of Interpump Group warrants; 10,464 warrants were exercised during theperiod, and consequently 6,431 newly issued shares were subscribed for an equivalent value of €31 thousand. There are therefore18,446,168 outstanding warrants exercisable in October 2012 by underwriting 59 newly issued shares for each 96 warrants at a priceof €5.10 per share.
Strategy for 2012 and coming years
For 2012 and future years the Interpump Group will focus a significant amount of resources on development in countries with fast-growingeconomies. In this context, the Group considers that structured growth in the future will be achieved above all through surging businessin emerging economies. In this regard we draw your attention to an additional initiative undertaken in 2011: December saw the incorporationof the Dubai based Interpump Hydraulics Middle East FZCO, founded in order to provide a local branch to penetrate the Middle Easternmarket more effectively.
As in the past, much importance will be awarded to North America, which is currently the most important market for the Group and whichis displaying highly encouraging signs of recovery. With regard to Europe, Interpump Group plans to consolidate its competitive positionsand improve them wherever possible.
Special attention will be devoted to controlling costs and to finance management, in order to maximise the generation of free cash flowto be allocated to structured external growth and the remuneration of shareholders.
I thank you for your confidence in Interpump Group S.p.A. . With the unwavering commitment of all our staff and that of myself, it is mybelief that the Group will continue to generate adequate resources for growth and for increased value of the Group for the benefit of allour shareholders.
Yours sincerely
Sant’Ilario d’Enza (RE), 13 March 2012 Giovanni Cavallini Chairman
The manager responsible for drafting company accounting documents, Carlo Banci, declares, pursuant to the terms of section 2 article 154(2) of the FinancialServices Act, that the accounting disclosures in the present document correspond to the contents of documents, the account books and the accounting entries
Sant’Ilario d’Enza (RE), 13 March 2012Carlo Banci
Manager responsible for draftingcompany accounting documents
L E T T ER TO THE SHAREHOLDERS 2.
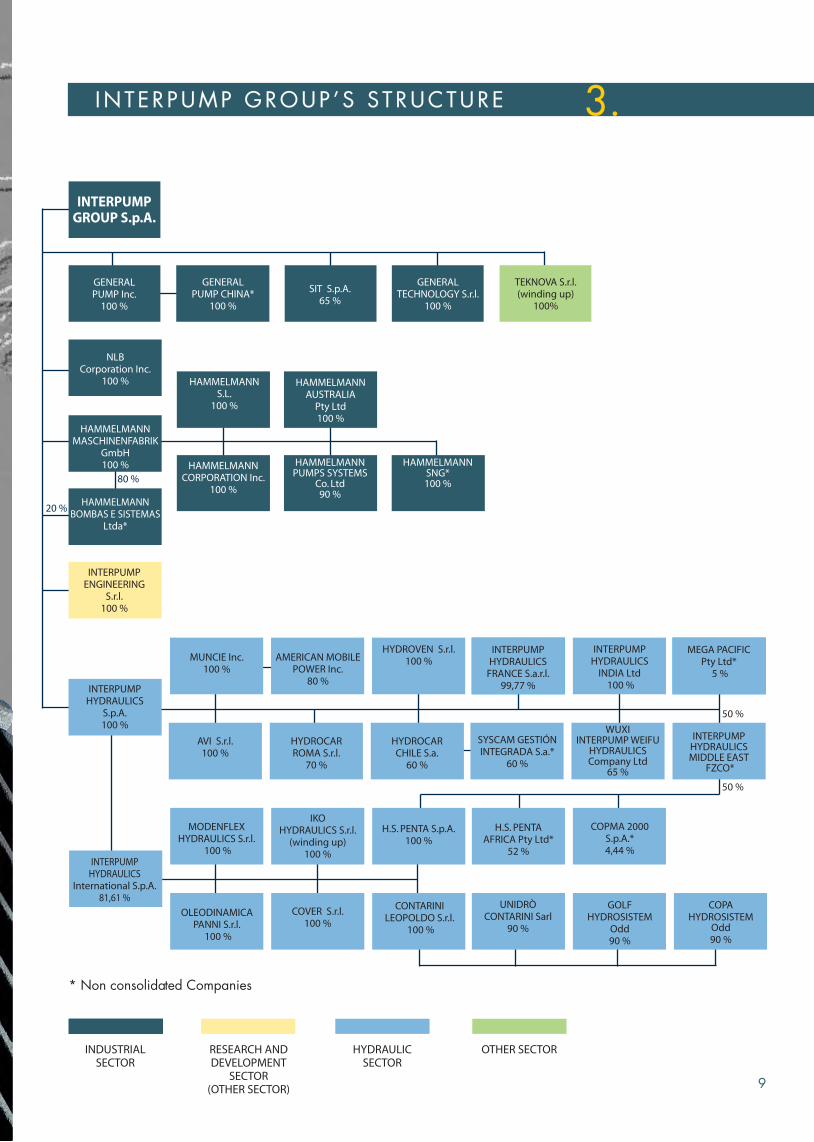
INDUSTRIALSECTOR
RESEARCH ANDDEVELOPMENT
SECTOR(OTHER SECTOR)
HYDRAULICSECTOR
* Non consolidated Companies
OTHER SECTOR
COPMA 2000S.p.A.*4,44 %
OLEODINAMICAPANNI S.r.l.
100 %
MODENFLEXHYDRAULICS S.r.l.
100 %
IKOHYDRAULICS S.r.l.
(winding up)100 %
H.S. PENTAAFRICA Pty Ltd*
52 %
COVER S.r.l.100 %
CONTARINILEOPOLDO S.r.l.
100 %
H.S. PENTA S.p.A.100 %
UNIDRÒCONTARINI Sarl
90 %
GOLFHYDROSISTEM
Odd90 %
INTERPUMPHYDRAULICS
International S.p.A.81,61 %
INTERPUMPENGINEERING
S.r.l.100 %
INTERPUMPHYDRAULICS
S.p.A.100 %
MUNCIE Inc.100 %
AMERICAN MOBILEPOWER Inc.
80 %
HYDROVEN S.r.l.100 %
HYDROCARCHILE S.a.
60 %
HYDROCARROMA S.r.l.
70 %
AVI S.r.l.100 %
SYSCAM GESTIÓNINTEGRADA S.a.*
60 %
INTERPUMPHYDRAULICS
FRANCE S.a.r.l.99,77 %
WUXIINTERPUMP WEIFU
HYDRAULICSCompany Ltd
65 %
GENERALPUMP Inc.
100 %
GENERALPUMP CHINA*
100 %
SIT S.p.A.65 %
GENERALTECHNOLOGY S.r.l.
100 %
HAMMELMANNS.L.
100 %
HAMMELMANNCORPORATION Inc.
100 %
HAMMELMANNMASCHINENFABRIK
GmbH100 %
HAMMELMANNAUSTRALIA
Pty Ltd100 %
HAMMELMANNPUMPS SYSTEMS
Co. Ltd90 %
NLBCorporation Inc.
100 %
TEKNOVA S.r.l.(winding up)
100%
INTERPUMPGROUP S.p.A.
HAMMELMANNBOMBAS E SISTEMAS
Ltda*
20 %
80 %
INTERPUMP GROUP ’S S TRUCTURE 3.
HAMMELMANNSNG*100 %
INTERPUMPHYDRAULICS
INDIA Ltd 100 %
MEGA PACIFICPty Ltd*
5 %
INTERPUMPHYDRAULICSMIDDLE EAST
FZCO*
COPAHYDROSISTEM
Odd90 %
9
50 %
50 %
2011 confirmed the recovery in sales and profitability that began in March2010. Sales of continuing operations rose by 18.0% to €472.3 million.The Industrial Sector surpassed the highest levels of the pre-recession periodwith 15.5% growth, while the Hydraulic Sector, which had suffered a farmore significant downturn, rose to around 80% of the sales recorded priorto the economic crisis. The reason for this difference is connected with thefact that the Hydraulic Sector is mainly driven by the sale of industrialvehicles in a market that has been particularly hard-hit by the slump in thebuilding construction sector, which has yet to display any significant signsof growth – at least on European markets – after the crisis. Despite thisbackground, in 2011 the Hydraulic Sector grew by 20.8% on the heelsof the promising performance in 2010, when the sector achieved growthof 27.1%.
A major contribution to recovery came from BRIC countries (Brazil, Russia,India and China), which together recorded growth of 48.2%. Althoughvolumes remain modest (sales in 2011 totalled €43.5 million), the overallincidence on consolidated sales rose from 7.3% to 9.2%. We can thereforesee that the initiatives undertaken in India, and especially in China in recentyears, are starting to generate rewards. In addition, to strengthen itscompetitive position in Brazil, on 15 February 2012 the Group acquired100% of Takarada, a Brazilian manufacture of power take-offs and otherhydraulic components, as illustrated in greater detail below.
The Group retained all the initiatives undertaken in 2009 and 2010 aimedat cutting back on costs and ensuring rigorous control of working capitaland expenditure, as described in the Board of Directors' Report accompanyingthe consolidated financial statements at 31/12/2010. Thanks also to allthe initiatives undertaken, EBITDA of continuing operations was up by28.0% versus 2010, reaching €94.7 million (20.0% of sales), reflectinga rise of 1.5 percentage points. Comprehensive EBITDA (inclusive of theElectric Motors Sector) totalled €95.0 million. This is a record in the historyof the Interpump Group, higher than the prior record of 2007 when thefigure was €94.3 million, thus confirming the solidity of the Group'scompetitive positions, which have made it possible to achieve this resultin a period like the present, in which the macroeconomic outlook is uncertainin the extreme.
From the standpoint of liquidity management we continued to focus attentionon the control of working capital; this said, the significant level of growthrecorded in sales volumes resulted in absorption of liquidity of continuingoperations in the measure of €21.4 million, after the actions taken in 2009and 2010 had served to generate liquidity from the management ofworking capital, respectively, of €44.7 million and €5.5 million.
Since April, 2011 data also include American Mobile Power, which wasacquired on 15 April 2011. American Mobile Power (AMP), headquarteredin Fairmount (Indiana), is among the primary US manufacturers and sellersof tanks for industrial vehicle hydraulic systems, mainly constructed ofaluminium and steel. The company's sales from 1 April to 31 December2011 (nine months) totalled $7.7 million, while EBITDA totalled $1.5million, equivalent to 19.6% of sales. The Group acquired 80% of AmericanMobile's shares for a total of $6.8 million, paid in cash. The remaining20% will be acquired in April 2016 for a price based on the resultsachieved by the company in the two preceding years. The operations ofAMP are highly synergistic with respect to the business of the InterpumpGroup's Hydraulic Division. In this context, Muncie Power Products, whichis a wholly owned subsidiary of Interpump Group, is the US leader inpower take-offs for industrial vehicles, and through the acquisition ofAmerican Mobile it has strengthened its position on the US market, expandingits product offering with AMP’s tanks.
The Group accentuated initiatives for external growth during the financialperiod.
An outline agreement was signed on 11 July 2011 for the acquisition ofGaltech. This transaction was closed on 31 January 2012. Headquarteredin Reggio Emilia, Galtech is active in the production and sale of gearpumps and motors, directional control valves, hydraulic accessories, andgeneral components. In 2011 company sales were €15.0 million, whileadjusted EBITDA was negative in the amount of €0.3 million. The netfinancial indebtedness of the company as at 31 December 2011 was €1.7million. The acquisition of 53% of Galtech's share capital was achievedfor a total price of €3.3 million, paid half in cash and half with 300,831Interpump Group S.p.A. treasury shares. The sellers are entitled to divestthe remaining 47% from the date of approval of the 2014 financialstatements until the date of approval of the 2025 financial statements.
An outline agreement was signed on 28 November 2011 for the acquisitionof MTC. This transaction was closed on 18 January 2012. Headquarteredin the province of Reggio Emilia, MTC is active in the production and saleof directional control valves and a range of other hydraulic valves. In 2011the company recorded sales of €5.7 million and EBITDA of €1.4 million,equivalent to 23.9% of sales. At 31 December 2011 the company heldcash totalling €0.6 million. The acquisition of 60% of the share capital ofMTC took place for a total cash payment of €3.0 million. The sellers areentitled to dispose of the remaining 40% from the date of approval of the2014 financial statements until the date of approval of the 2025 financialstatements.
The operations of Galtech and MTC are highly synergic with respect to thebusiness of the Interpump Group's Hydraulic Division. In this context, itshould be noted that Interpump Hydraulics S.p.A., a 100% owned subsidiaryof Interpump Group S.p.A, is the world leader in power take-offs for industrialvehicles and through the acquisitions of Galtech and MTC, it has strengthenedits market position, broadening its product offering.
On 2 November 2011 the Group acquired the remaining 49% of thesubsidiary AVI S.r.l. for €1,350 thousand, of which €270 thousand paidat the same time as the acquisition of the holdings with the remainder tobe settled in four annual instalments of €270 thousand each. Thereforesince that date the Group has held 100% of AVI s.r.l..
An outline agreement was signed on 21 December 2011 for the acquisitionof Takarada. This transaction was closed on 15 February 2012. Takarada,with registered office in Caxias do Sul (Brazil – the state of Rio Grande doSul ), is a leading manufacturer and seller of power take-offs and relatedhydraulic components for industrial vehicles. In 2011 the company recordedsales of 17.9 million Reais (€8.0 million) and EBITDA of 3.3 million Reais(€1.5 million), equivalent to 18.6% of sales. Acquisition of 100% of theshare capital of Takarada occurred for a total cash payment of 29.0 millionReais (€12.9 million), including received financial indebtedness. The businessof Takarada is highly synergic with respect to the business of the InterpumpGroup's Hydraulic Division. With the acquisition of Takarada, the InterpumpGroup lays the groundwork for substantial growth of the Hydraulic Sectorin Brazil, currently on the verge of allocating significant funds to thedevelopment of infrastructure in the coming years, also thanks to its selectionas the host of forthcoming top international sporting events (Football WorldCup and the Olympics).
In addition, a new company, Interpump Hydraulics Middle East FZCO withregistered office in Dubai, was incorporated on 19 December 2011. Thecompany, which is held in the measure of 50% by Interpump HydraulicsS.p.A. and 50% by HS Penta S.p.A., was created with the aim of obtaininga local distributor able to achieve more effective market penetration. Theincorporation of this company forms part of the Group's strategy of growthin areas with the greatest potential and fastest rate of development.
On 26 September 2011 Interpump Group divested its 70% stake inUnielectric, a company active in the production of windings and electricmotors for a price of €3.5 million. This amount was paid in cash on theexecution date in the quantity of one third (€1.2 million) while a furtherthird will be paid within 15 December 2012 and the final third will besettled within 15 December 2013. The extended payments are secured bybank guarantees. Unielectric was sold because Interpump Group no longerconsidered the investment to be strategic in the framework of the businesssectors of the Group, which is currently focused in the Industrial Sector (highand very high-pressure water pumps) and the Hydraulic Sector (power take-offs, hydraulic pumps, cylinders and other hydraulic components). With thesale of Unielectric the Interpump Group has therefore withdrawn from theElectric Motors Sector. The sale, which complied with the requirements ofIFRS 5 and the most recent orientations of international accounting principles,has been represented in this report as a Discontinued Operation and itis the only one of its kind in the period.
11
Main events of the year
F INANC IA L H IGHL IGHTS 4.
Consolidated net revenues
Foreign sales
EBITDA(Earnings before interest, tax, depreciation and amortization)
Consolidated operating profit
Operating profit %
Consolidated net profit
Cash flow from operations
Net financial indebtedness
Consolidated shareholders' equity
Debt/Equity ratio
Net capital expenditure for the year in tangibleand intangible fixed assets
Average number of employees
ROE
EPS -
Dividend per share -
ROCE
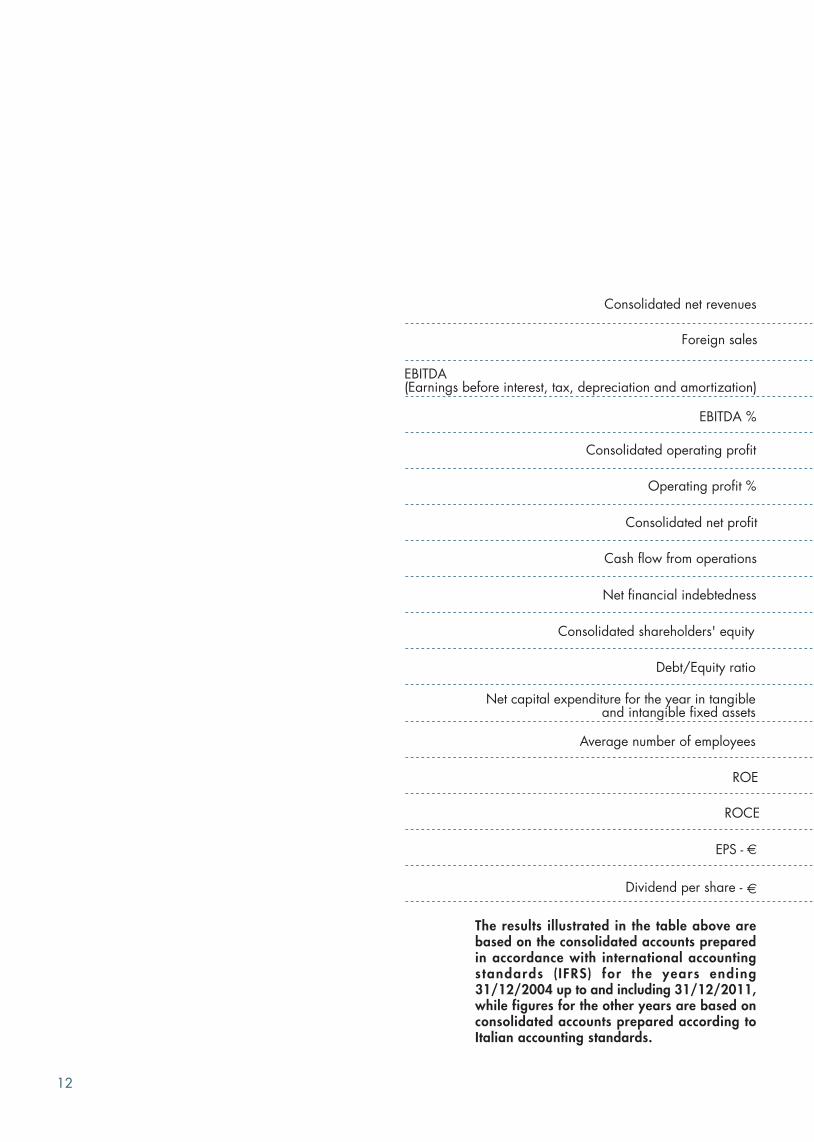
The results illustrated in the table above arebased on the consolidated accounts preparedin accordance with international accountingstandards ( IFRS) for the years ending31/12/2004 up to and including 31/12/2011,while figures for the other years are based onconsolidated accounts prepared according toItalian accounting standards.
EBITDA %
12
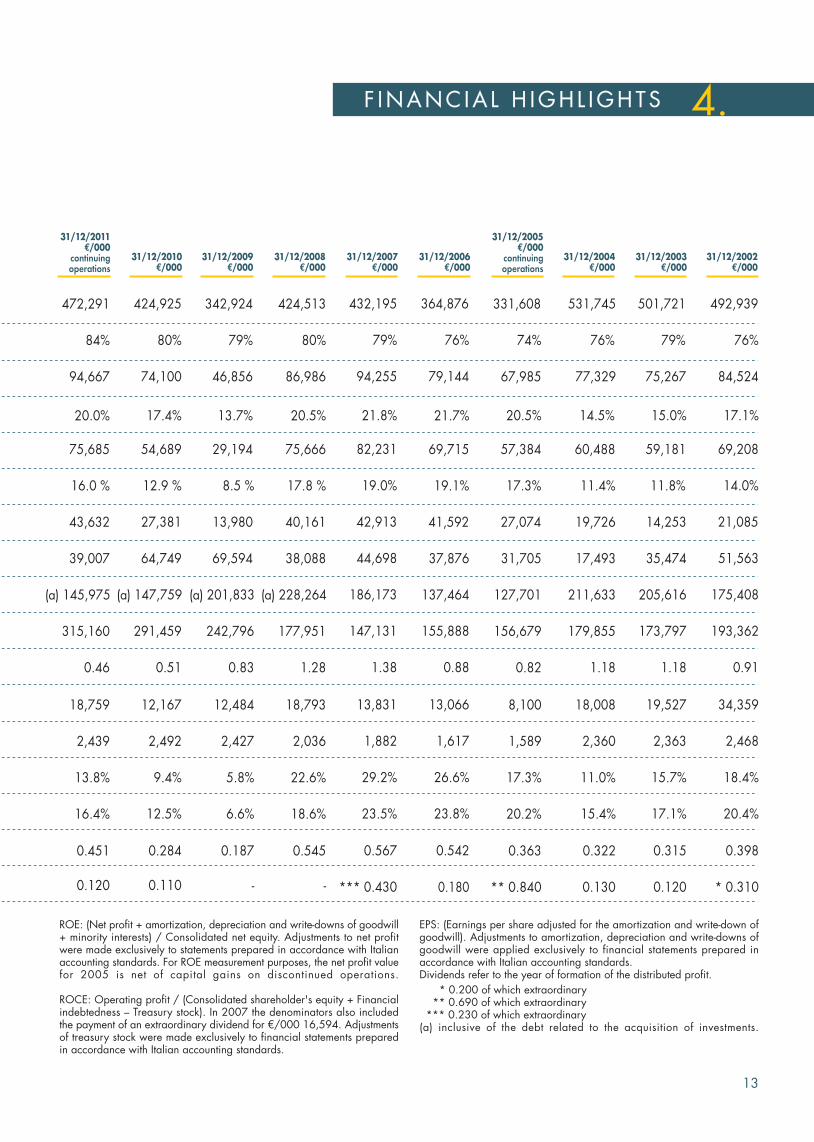
EPS: (Earnings per share adjusted for the amortization and write-down ofgoodwill). Adjustments to amortization, depreciation and write-downs ofgoodwill were applied exclusively to financial statements prepared inaccordance with Italian accounting standards.Dividends refer to the year of formation of the distributed profit.
* 0.200 of which extraordinary ** 0.690 of which extraordinary *** 0.230 of which extraordinary(a) inclusive of the debt related to the acquisition of investments.
331,608
74%
67,985
156,679
0.82
8,100
1,589
17.3%
20.2%
0.363
** 0.840
57,384
27,074
31,705
127,701
17.3%
60,488
11.4%
19,726
17,493
211,633
179,855
1.18
18,008
2,360
11.0%
15.4%
0.322
0.130
531,745
77,329
76%
501,721
79%
75,267
59,181
11.8%
14,253
35,474
205,616
173,797
1.18
19,527
2,363
15.7%
17.1%
0.315
0.120
492,939
76%
84,524
193,362
0.91
34,359
2,468
18.4%
20.4%
0.398
* 0.310
69,208
21,085
51,563
175,408
14.0%
432,195
79%
94,255
147,131
1.38
13,831
1,882
29.2%
23.5%
0.567
*** 0.430
82,231
42,913
44,698
186,173
19.0%
20.5% 14.5% 15.0% 17.1%21.8%
364,876
76%
79,144
155,888
0.88
13,066
1,617
26.6%
23.8%
0.542
0.180
69,715
41,592
37,876
137,464
19.1%
21.7%
424,513
80%
86,986
177,951
1.28
18,793
2,036
22.6%
18.6%
0.545
75,666
40,161
38,088
(a) 228,264
17.8 %
20.5%
-
342,924
79%
46,856
242,796
0.83
12,484
2,427
5.8%
6.6%
0.187
29,194
13,980
69,594
(a) 201,833
8.5 %
13.7%
-
424,925
80%
74,100
291,459
0.51
12,167
2,492
9.4%
12.5%
0.284
54,689
27,381
64,749
(a) 147,759
12.9 %
17.4%
0.110
31/12/2011€/000
continuingoperations
31/12/2009€/000
31/12/2008€/000
31/12/2007€/000
31/12/2005€/000
continuingoperations
31/12/2006€/000
31/12/2004€/000
31/12/2003€/000
31/12/2002€/000
ROE: (Net profit + amortization, depreciation and write-downs of goodwill+ minority interests) / Consolidated net equity. Adjustments to net profitwere made exclusively to statements prepared in accordance with Italianaccounting standards. For ROE measurement purposes, the net profit valuefor 2005 is net of capital gains on discontinued operations.
ROCE: Operating profit / (Consolidated shareholder's equity + Financialindebtedness – Treasury stock). In 2007 the denominators also includedthe payment of an extraordinary dividend for €/000 16,594. Adjustmentsof treasury stock were made exclusively to financial statements preparedin accordance with Italian accounting standards.
472,291
84%
94,667
315,160
0.46
18,759
2,439
13.8%
16.4%
0.451
75,685
43,632
39,007
(a) 145,975
16.0 %
20.0%
0.120
31/12/2010€/000
13
F INANC IA L H IGHL IGHTS 4.
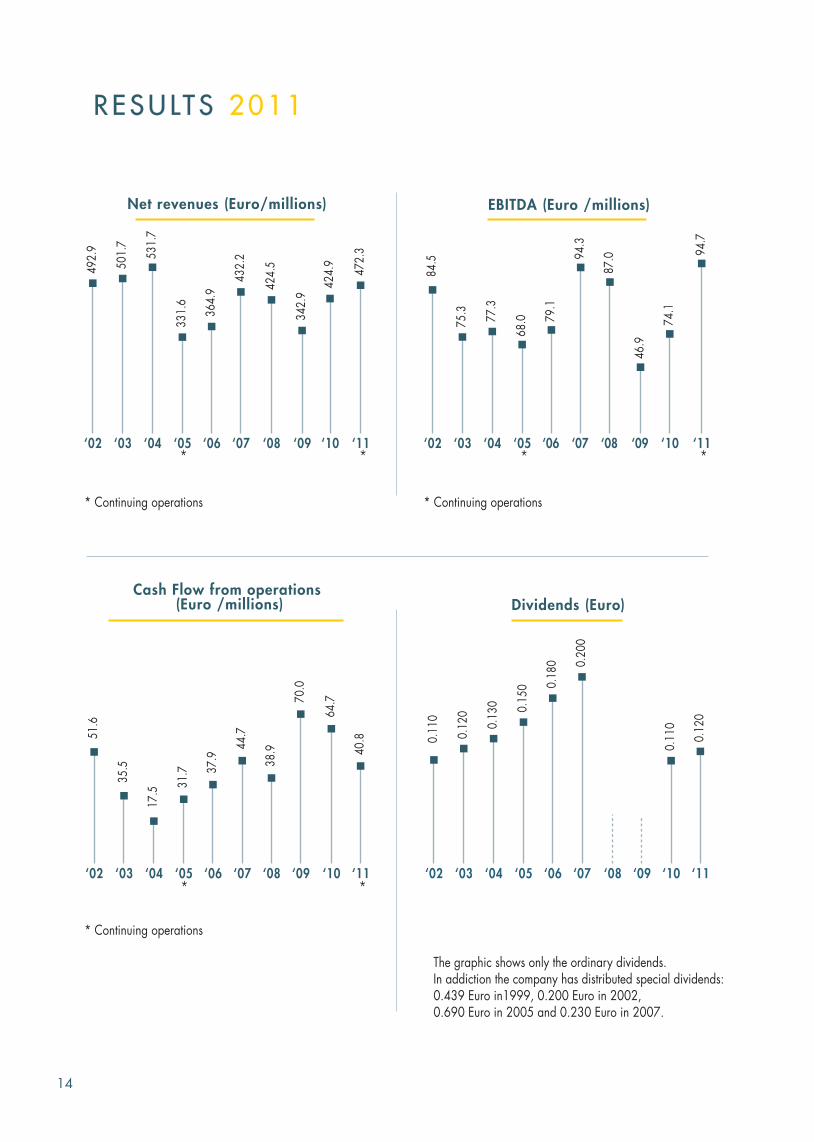
EBITDA (Euro /millions)Net revenues (Euro/millions)
Cash Flow from operations (Euro /millions) Dividends (Euro)
The graphic shows only the ordinary dividends.In addiction the company has distributed special dividends:0.439 Euro in1999, 0.200 Euro in 2002,0.690 Euro in 2005 and 0.230 Euro in 2007.
‘02 ‘03 ‘04 ‘0584
.5
75.3
77.3
68.0
‘02 ‘03 ‘04 ‘05
492.
9
501.
7
531.
7
331.
6
‘06
79.1
‘06
364.
9
‘02 ‘03 ‘04 ‘05
51.6
35.5
17.5
31.7
‘02 ‘03 ‘04 ‘05
0.11
0
0.12
0
0.13
0 0.15
0
‘06
0.18
0
‘06
37.9
* *
*
* Continuing operations
* Continuing operations * Continuing operations
‘07
432.
2
‘07
44.7
‘07
94.3
‘07
0.20
0
‘08
424.
5
‘08
87.0
‘08
38.9
‘09
342.
9
‘09
46.9
‘09
70.0
‘10
424.
9
‘10
74.1
‘10
64.7
‘08 ‘09 ‘10
0.11
0
‘11
472.
3
‘11
94.7
‘11
40.8
‘11
0.12
0
* *
*
14
R E S U LT S 2 0 1 1
( /000)
ASSETSCurrent assetsCash and cash equivalentsTrade receivablesInventoriesTax receivablesDerivative financial instrumentsAssets held for saleOther current assetsTotal current assets
LIABILITIESCurrent liabilitiesTrade payablesPayables to banks
Interest-bearing financial payables (current portion)
Derivative financial instruments
Taxes payable
Other current liabilitiesProvisions for risks and charges
Total current liabilities
Non-current liabilitiesInterest-bearing financial payablesLiabilities for employee benefits
Deferred tax liabilities
Other non-current liabilities
Provisions for risks and chargesTotal non-current liabilitiesTotal liabilities
SHAREHOLDERS’ EQUITYShare capital
Legal reserve
Share premium reserve
Reserve for measurement of hedging derivatives at fair valueTranslation provisionOther reserves
Shareholders’ equity for the GroupMinority interestsTotal shareholders’ equityTotal shareholders’ equity and liabilities
Non-current assetsProperty, plant and equipmentGoodwillOther intangible assetsOther financial assets
Tax receivablesDeferred tax assetsOther non-current assetsTotal non-current assetsTotal assets
31/12/2011 31/12/2010
109,06895,912
117,0214,425
-2,1238,754
337,303
57,9628,762
113,700
2,006
8,55222,943
2,851
216,776
113,569
9,698
20,66820,439
1,720
47,936
10,157
64,719
(1,086)
(2,908)190,879
309,6975,463
166,094382,870
315,160698,030
102,777
360,727
213,40023,562
3,4241,017
15,0571,490
698,030
138,72188,536
108,0045,277
3754,5563,835
349,304
61,7327,751
125,374
2,651
8,12519,805
2,243
227,681
131,718
10,225
18,85623,175
1,856
49,193
10,064
74,427
(1,730)
(8,196)160,524
284,2827,177
185,830413,511
291,459704,970
103,121
355,666
209,65523,895
3,3991,021
14,161414
704,970
15
CONSOLIDATED STATEMENT OF FINANCIAL POSITION 5.
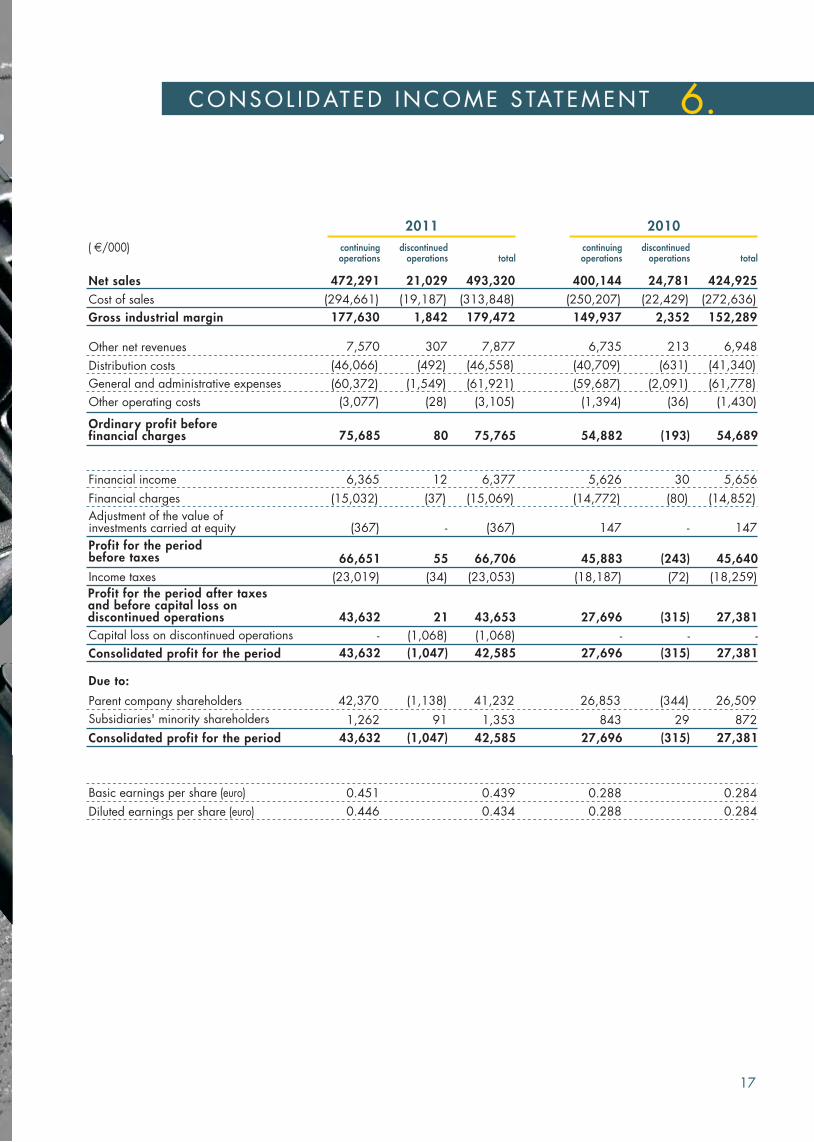
Net salesCost of sales
Gross industrial margin
Other net revenues
Distribution costs
General and administrative expenses
Other operating costs
Financial income
Financial charges
Adjustment of the value ofinvestments carried at equity
Profit for the periodbefore taxes
Income taxes
Consolidated profit for the period
Due to:
Parent company shareholders
Subsidiaries' minority shareholders
Consolidated profit for the period
Basic earnings per share (euro)
Diluted earnings per share (euro)
Ordinary profit beforefinancial charges
( /000)
424,925(272,636)
152,289
6,948
(41,340)
(61,778)
(1,430)
5,656
(14,852)
147
45,640(18,259)
27,381
26,509
872
27,381
0.284
0.284
54,689
Profit for the period after taxesand before capital loss ondiscontinued operationsCapital loss on discontinued operations -
27,381
472,291(294,661)
177,630
7,570
(46,066)
(60,372)
(3,077)
6,365
(15,032)
(367)
66,651(23,019)
43,632
42,370
1,262
43,632
0.451
0.446
75,685
43,632-
21,029(19,187)
1,842
307
(492)
(1,549)
(28)
12
(37)
-
55(34)
(1,047)
(1,138)
91
(1,047)
80
21(1,068)
493,320(313,848)
179,472
7,877
(46,558)
(61,921)
(3,105)
6,377
(15,069)
(367)
66,706(23,053)
42,585
41,232
1,353
42,585
0.439
0.434
75,765
43,653(1,068)
400,144(250,207)
149,937
6,735
(40,709)
(59,687)
(1,394)
5,626
(14,772)
147
45,883(18,187)
27,696
26,853
843
27,696
0.288
0.288
54,882
-
27,696
24,781(22,429)
2,352
213
(631)
(2,091)
(36)
30
(80)
-
(243)(72)
(315)
(344)
29
(315)
(193)
-
(315)
17
CONSOL IDATED INCOME S TATEMENT 6.
continuingoperations
discontinuedoperations total
continuingoperations
discontinuedoperations total
2011 2010
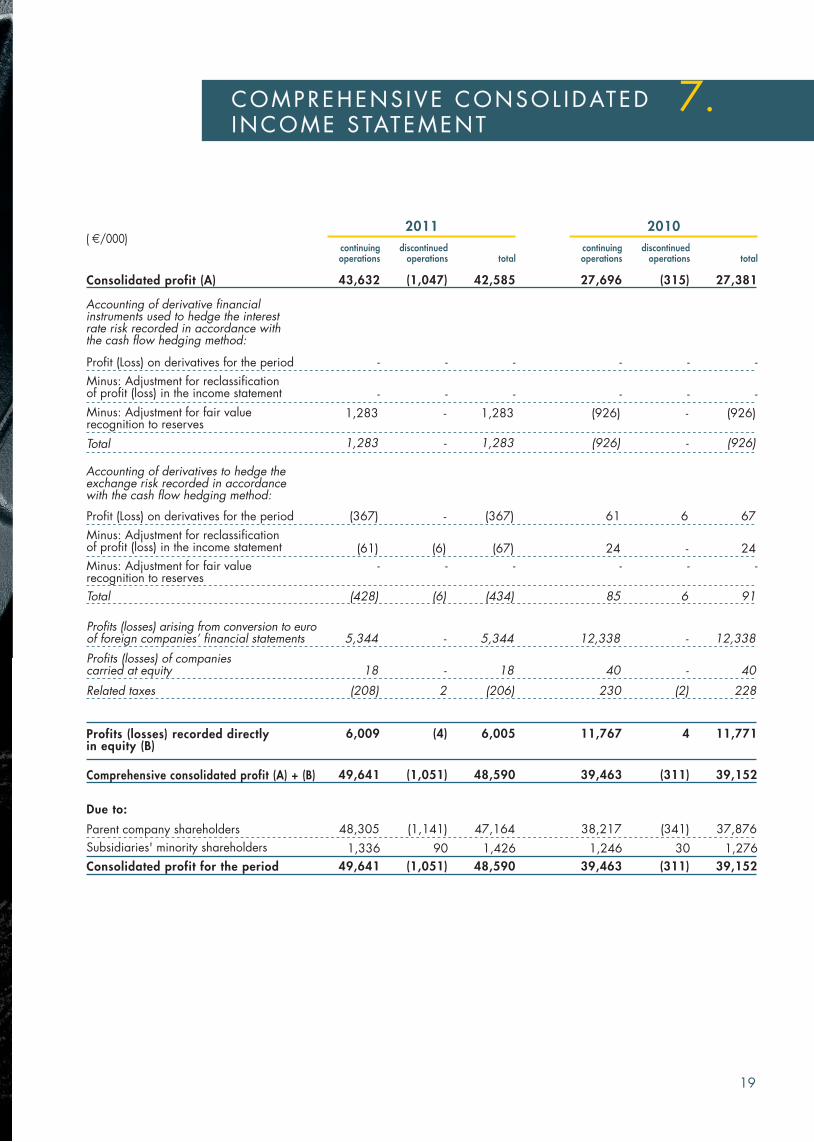
Consolidated profit (A)
Profit (Loss) on derivatives for the period
Minus: Adjustment for reclassificationof profit (loss) in the income statement
Minus: Adjustment for fair valuerecognition to reserves
Total
Profit (Loss) on derivatives for the period
Minus: Adjustment for reclassificationof profit (loss) in the income statement
Minus: Adjustment for fair valuerecognition to reserves
Total
Profits (losses) recorded directlyin equity (B)
Due to:
Parent company shareholders
Subsidiaries' minority shareholders
Consolidated profit for the period
42,585
-
1,283
(367)
(67)
-
(434)
6,005
47,164
1,426
48,590
( /000)
Accounting of derivative financialinstruments used to hedge the interestrate risk recorded in accordance withthe cash flow hedging method:
Accounting of derivatives to hedge theexchange risk recorded in accordancewith the cash flow hedging method:
Profits (losses) arising from conversion to euroof foreign companies’ financial statements
Related taxes
5,344
(206)
Profits (losses) of companiescarried at equity 18
Comprehensive consolidated profit (A) + (B) 48,590
-
1,283
27,381
-
(926)
67
24
-
91
11,771
37,876
1,276
39,152
12,338
228
40
39,152
-
(926)
continuingoperations
43,632
-
1,283
(367)
(61)
-
(428)
6,009
48,305
1,336
49,641
5,344
(208)
18
49,641
-
1,283
discontinuedoperations
(1,047)
-
-
-
(6)
-
(6)
(4)
(1,141)
90
(1,051)
-
2
-
(1,051)
-
-
totalcontinuingoperations
discontinuedoperations total
(315)
-
-
6
-
-
6
4
(341)
30
(311)
-
(2)
-
(311)
-
-
27,696
-
(926)
61
24
-
85
11,767
38,217
1,246
39,463
12,338
230
40
39,463
-
(926)
19
2011
COMPREHENS IVE CONSOL IDATEDINCOME S TATEMENT
7.
2010
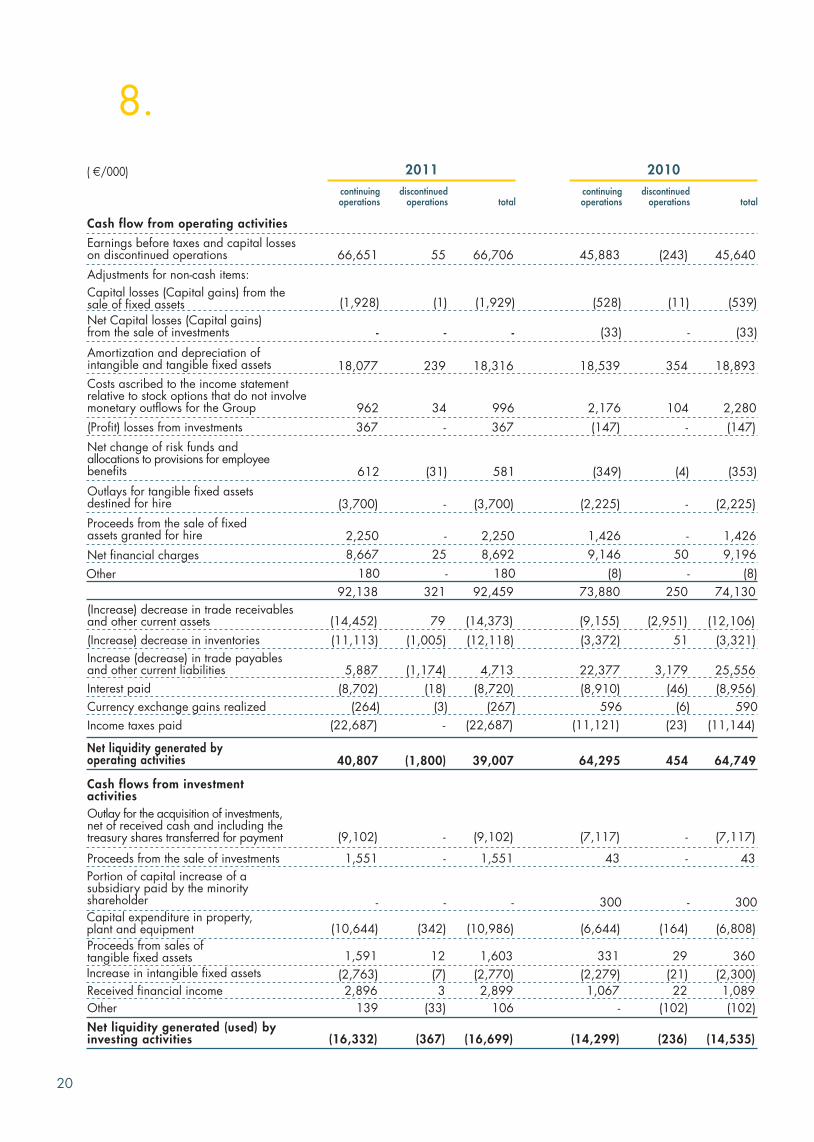
Cash flow from operating activities
Earnings before taxes and capital losseson discontinued operations
Adjustments for non-cash items:
Capital losses (Capital gains) from thesale of fixed assets
Amortization and depreciation ofintangible and tangible fixed assets
(Profit) losses from investments
Net liquidity generated byoperating activities
Net Capital losses (Capital gains)from the sale of investments
Costs ascribed to the income statementrelative to stock options that do not involvemonetary outflows for the Group
Net change of risk funds andallocations to provisions for employeebenefits
Net financial charges
Other
(Increase) decrease in trade receivablesand other current assets
(Increase) decrease in inventories
Increase (decrease) in trade payablesand other current liabilities
Interest paid
Currency exchange gains realized
Income taxes paid
Cash flows from investmentactivitiesOutlay for the acquisition of investments,net of received cash and including thetreasury shares transferred for payment
Proceeds from the sale of investments
Proceeds from sales oftangible fixed assets
Received financial income
18,316
996
367
581
8,692
180
92,459
(14,373)
(12,118)
4,713
(8,720)
(267)
(22,687)
39,007
(1,929)
(10,986)
Increase in intangible fixed assets (2,770)
Portion of capital increase of asubsidiary paid by the minorityshareholder
Capital expenditure in property,plant and equipment
1,603
2,899
Outlays for tangible fixed assetsdestined for hire (3,700)
Proceeds from the sale of fixedassets granted for hire 2,250
Other 106
Net liquidity generated (used) byinvesting activities
-
(9,102)
1,551
-
( /000)
45,640
18,893
2,280
(147)
(353)
9,196
(8)
74,130
(12,106)
(3,321)
25,556
(8,956)
590
(11,144)
64,749
(539)
(6,808)
(2,300)
360
1,089
(2,225)
1,426
(102)
(14,535)
(33)
(7,117)
43
300
(16,699)
-
66,706
18,077
962
367
612
8,667
180
92,138
(14,452)
(11,113)
5,887
(8,702)
(264)
(22,687)
40,807
(1,928)
(10,644)
(2,763)
1,591
2,896
(3,700)
2,250
139
-
(9,102)
1,551
-
66,651
(16,332)
-
239
34
-
(31)
25
-
321
79
(1,005)
(1,174)
(18)
(3)
-
(1,800)
(342)
(7)
12
3
-
-
(33)
-
-
55
(1)
(367)
-
-
-
(243)
354
104
-
(4)
50
-
250
(2,951)
51
3,179
(46)
(6)
(23)
454
(11)
(164)
(21)
29
22
-
-
(102)
(236)
-
-
-
-
45,883
18,539
2,176
(147)
(349)
9,146
(8)
73,880
(9,155)
(3,372)
22,377
(8,910)
596
(11,121)
64,295
(528)
(6,644)
(2,279)
331
1,067
(2,225)
1,426
-
(14,299)
(33)
(7,117)
43
300
20
8.
continuingoperations
discontinuedoperations total
continuingoperations
discontinuedoperations total
2011 2010
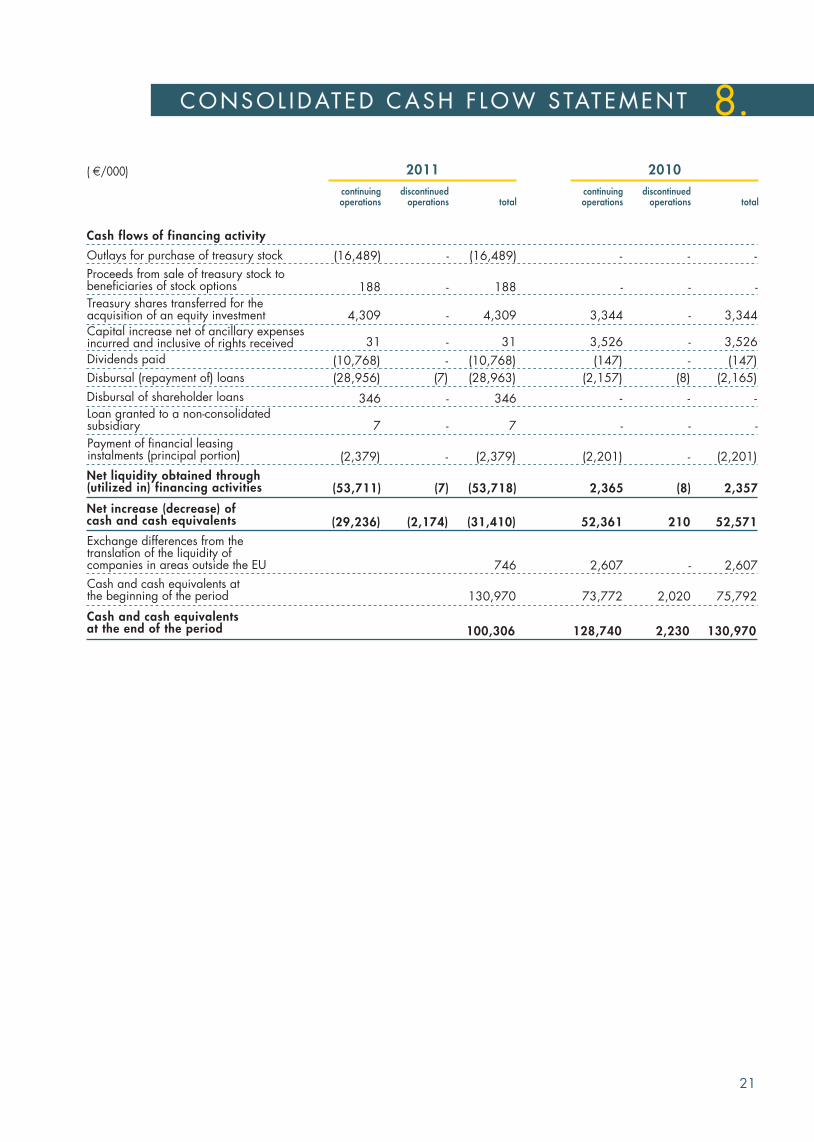
Cash flows of financing activity
Outlays for purchase of treasury stock
Proceeds from sale of treasury stock tobeneficiaries of stock options
Disbursal of shareholder loans
Net liquidity obtained through(utilized in) financing activities
Net increase (decrease) ofcash and cash equivalents
Cash and cash equivalents atthe beginning of the period
Disbursal (repayment of) loans
Exchange differences from thetranslation of the liquidity ofcompanies in areas outside the EU
-
(7)
(2,174)
Cash and cash equivalentsat the end of the period
Payment of financial leasinginstalments (principal portion) -
(7)
Capital increase net of ancillary expensesincurred and inclusive of rights received -
( /000)
Treasury shares transferred for theacquisition of an equity investment -
Dividends paid -
Loan granted to a non-consolidatedsubsidiary -
-
-
2,357
52,571
130,970
(2,201)
-
(2,165)
3,526
3,344
(147)
-
75,792
2,607
-
-
188
(53,711)
(29,236)
(2,379)
(28,956)
31
4,309
(10,768)
7
(16,489)
346
188
(53,718)
(31,410)
100,306
(2,379)
(28,963)
31
4,309
(10,768)
7
130,970
746
(16,489)
346
-
-
2,365
52,361
128,740
(2,201)
-
(2,157)
3,526
3,344
(147)
-
73,772
2,607
-
-
(8)
210
2,230
-
-
(8)
-
-
-
-
2,020
-
21
CONSOL IDATED CASH F LOW STATEMENT 8.
continuingoperations
discontinuedoperations total
continuingoperations
discontinuedoperations total
2011 2010
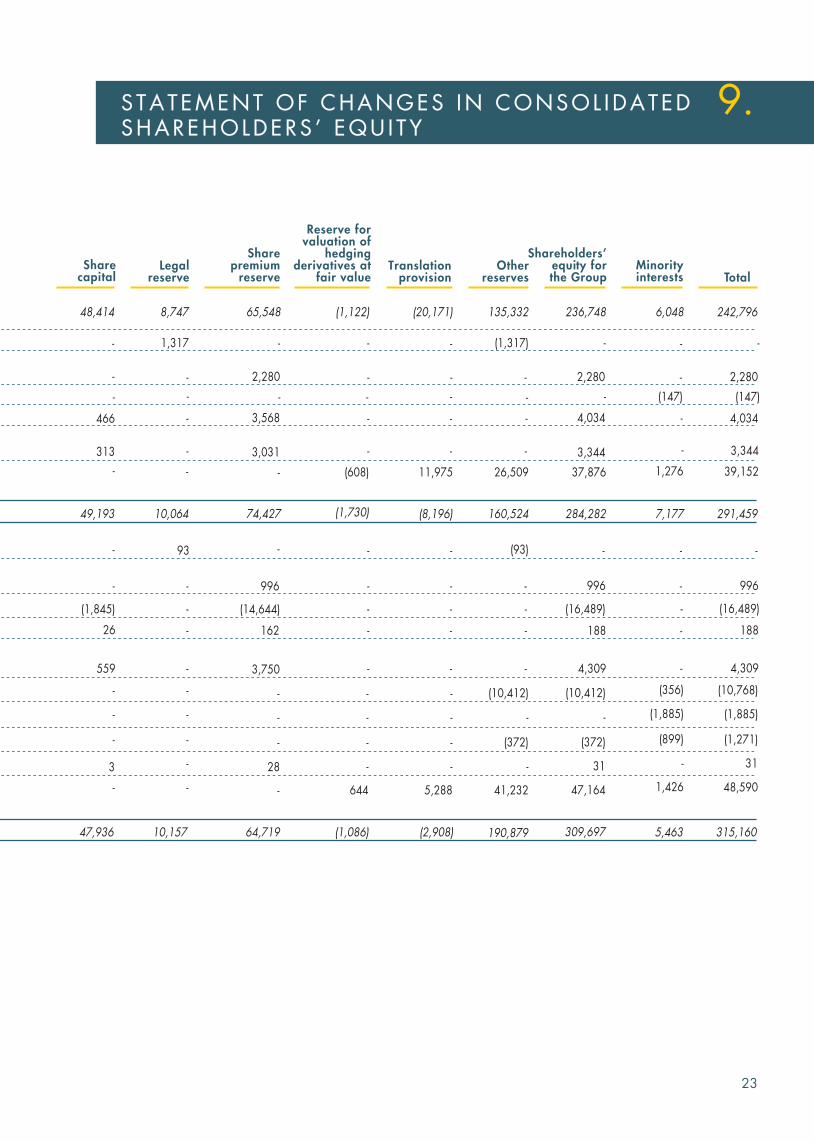
Balances as at 1 January 2010
Capital increase following exercise of warrants
Disposal of treasury stock to pay debts forthe acquisition of equity investments
Balances at 31 December 2010
Sale of treasury stock to the beneficiaries of stock options
Purchase of treasury stock
Balances at 31 December 2011
Recording in the income statement of the fair value of the stock options assigned and exercisable
Allocation of 2010 residual profit
Recording in the income statement of the fair valueof the stock options assigned and exercisable
Dividends paid
Allocation of 2009 profit
Comprehensive profit (loss) for 2010
Dividends paid
Transfer of treasury stock to support the acquisition of the additional11% of Interpump Hydraulics International
( /000)
Disposal of investment in Unielectric
Acquisition of additional 49% of AVI
Capital increase following exercise of warrants
Comprehensive profit (loss) for 2011
22
9.
Sharecapital
Legalreserve
Sharepremium
reserveOther
reserves
Shareholders’equity forthe Group
Minorityinterests Total
242,796
Translationprovision
Reserve forvaluation of
hedgingderivatives at
fair value
2,280
291,459
-
996
(16,489)
188
4,309
(10,768)
315,160
6,048
-
7,177
-
-
5,463
236,748
2,280
284,282
-
996
190,879
135,332
-
-
160,524
-
-
-
-
309,697
(20,171)
-
-
-
(8,196)
-
-
-
-
-
(2,908)
65,548
74,427
64,719
(1,122)
-
-
-
-
-
-
-
-
(1,086)
8,747
-
-
-
10,064
-
-
-
-
-
10,157
48,414
49,193
-
-
47,936
- -
-
-
-
-
-
-
-
-
(147)
4,034
3,344
39,152
(356)
-
2,280
-
996
- - - (10,412)
-
-
(10,412)
-
-
1,276
-
-
-
-
-
26
559
93
-
-
-
162
3,750
(608)
(1,730)
11,975 26,509
(93)
37,876
188
4,309
-
-
(1,885)-- (1,885)- - - - -
(1,271)-- (899)- - - (372) (372)
31- -- - - 31
48,590-- 1,426- 644 5,288 41,232 47,164
466
313
(1,845)
3
1,317
3,568
3,031
(14,644)
28
(1,317)
4,034
3,344
(16,489)
(147)
23
S TATEMENT OF CHANGES IN CONSOL IDATEDSHAREHOLDERS ’ EQU I TY
9.
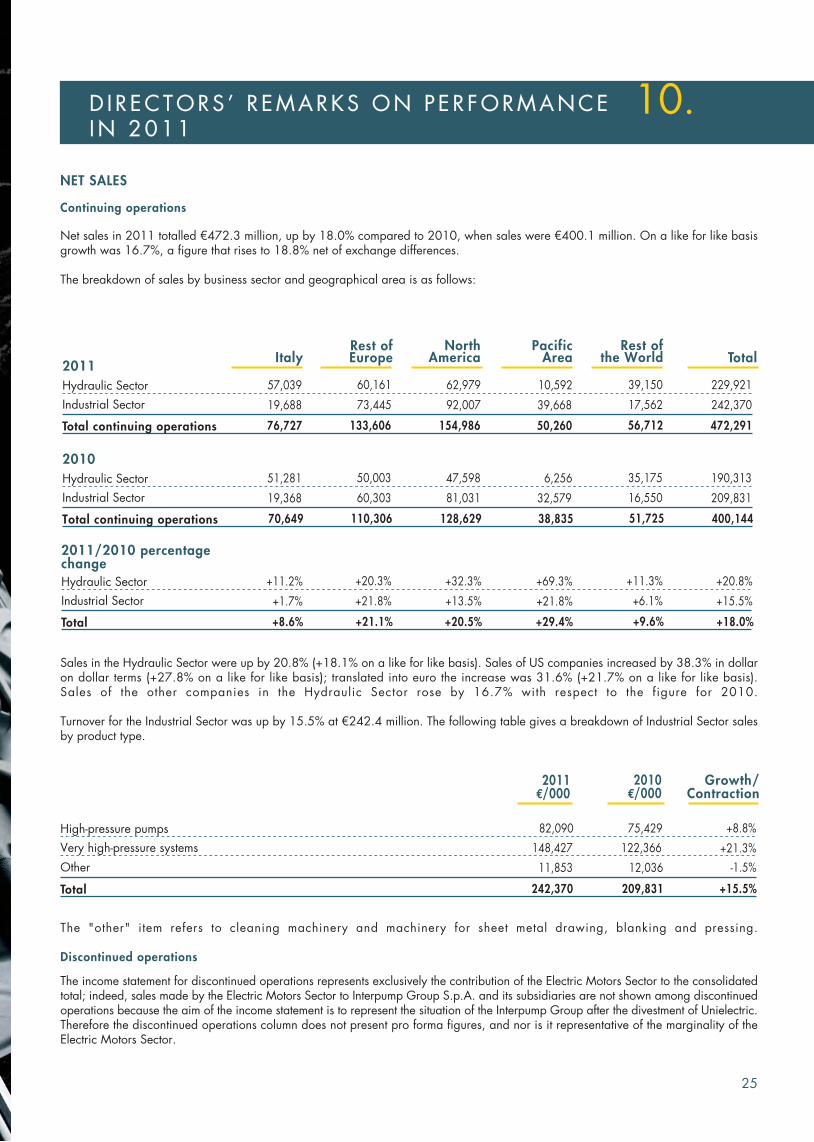
The "other" item refers to cleaning machinery and machinery for sheet metal drawing, blanking and pressing.
Discontinued operations
The income statement for discontinued operations represents exclusively the contribution of the Electric Motors Sector to the consolidatedtotal; indeed, sales made by the Electric Motors Sector to Interpump Group S.p.A. and its subsidiaries are not shown among discontinuedoperations because the aim of the income statement is to represent the situation of the Interpump Group after the divestment of Unielectric.Therefore the discontinued operations column does not present pro forma figures, and nor is it representative of the marginality of theElectric Motors Sector.
NET SALES
Continuing operations
Net sales in 2011 totalled €472.3 million, up by 18.0% compared to 2010, when sales were €400.1 million. On a like for like basisgrowth was 16.7%, a figure that rises to 18.8% net of exchange differences.
The breakdown of sales by business sector and geographical area is as follows:
+69.3% +11.3%Hydraulic Sector
+29.4%
+20.8%+11.2% +20.3%
+21.8%
+8.6%
+32.3%
Industrial Sector
Total
+1.7%
+21.1%
+13.5%
+20.5%
+21.8% +6.1%
+9.6%
+15.5%
+18.0%
2011/2010 percentagechange
PacificArea Total
Rest of the WorldItaly
Rest ofEurope
North America
10,592 39,150Hydraulic Sector
50,260
229,92157,039 60,161
73,445
76,727
62,979
Industrial Sector
Total continuing operations
19,688
133,606
92,007
154,986
39,668 17,562
56,712
242,370
472,291
2011
Sales in the Hydraulic Sector were up by 20.8% (+18.1% on a like for like basis). Sales of US companies increased by 38.3% in dollaron dollar terms (+27.8% on a like for like basis); translated into euro the increase was 31.6% (+21.7% on a like for like basis).Sales of the other companies in the Hydraulic Sector rose by 16.7% with respect to the figure for 2010.
Turnover for the Industrial Sector was up by 15.5% at €242.4 million. The following table gives a breakdown of Industrial Sector salesby product type.
Hydraulic Sector
Industrial Sector
Total continuing operations
2010
38,83570,649 110,306 128,629 51,725 400,144
82,090High-pressure pumps
11,853
242,370
+8.8%
Very high-pressure systems
Other
Total
148,427 +21.3%
-1.5%
+15.5%
Growth/ Contraction
2010€/000
75,429
12,036
209,831
122,366
2011€/000
6,256 35,175 190,31351,281 50,003
60,303
47,598
19,368 81,031 32,579 16,550 209,831
25
D I R ECTORS ’ R EMARKS ON PERFORMANCEIN 2011
10.
PROFITABILITY
Continuing operations
It should be noted that the income statement for 2011 reflects various non-recurring revenues and costs which largely offset each otherso EBITDA and EBIT were unaffected. Non-recurring income took the form of a capital gain of €1.2 million included under OtherOperating Revenues and related to the sale of a building classified under assets held for sale. Non-recurring costs were composed ofallocations of extraordinary amount although not of exceptional nature, made to the allowance for inventories and to the bad debtprovision on the basis of prudential evaluations of certain specific contingencies. The allocations to the allowance for inventories howeverhad a negative impact on the gross industrial margin in the measure of 0.2 percentage points, which were subsequently recovered interms of EBIT and EBITDA.
The cost of sales accounted for 62.4% of turnover (62.5% in 2010). Production costs totalled €102.3 million (€90.1 million in 2010),equivalent to 21.7% of sales (22.7% in 2010). The purchase costs of raw materials and components sourced on the market, includingchanges in inventories, totalled €192.4 million (€159.4 million in 2010). The incidence of purchase costs, including changes ininventories, was 40.7% compared to 39.8% in 2010. The effects of the consolidation of American Mobile are not significant.
On a like for like basis distribution costs rose by 12.3% with respect to 2010, while the relative incidence on sales fell by 0.4 percentagepoints.
General and administrative expenses rose by 0.5% like for like with respect to 2010, although their incidence on sales fell by 2.1percentage points. In 2010 general and administrative expenses were influenced by the recognition of costs for stock options relativeto the fourth tranche of the 2006/2009 plan (allocation of 1,100,000 options exercisable from 1 July 2010) and the recalculation ofthe exercise prices of options already allocated in prior years and not yet exercised, further to the share capital increase. The foregoingcosts of a one-off basis totalled €1.2 million. General and administrative expenses, net of the said non-recurring one-off amount were2.4% higher than in 2010, like for like.
Overall payroll costs of continuing operations were €106.7 million (€98.1 million in 2010) for an average headcount is 2,439 (therewere 2,349 employees of companies within continuing operations, hence excluding Unielectric, in 2010; the figure rises to 2,492 ifUnielectric is included). The increase in the average number of employees is due, in the number of 38, to the consolidation of AmericanMobile, which was not present in 2010. For calculation of the average number we draw your attention to the fact that the employeesof American Mobile were considered only for the period of consolidation and hence by three quarters. On a like for like basis payrollcosts were up by 7.4%, with an increase of 53 in the number of personnel (+2.2%) and a 5.0% increase in the average per-capitacost. The increase in the average headcount can be broken down as follows: -17 in Europe, +63 in the US (of which 38 due to theconsolidation of American Mobile, so the increase was 25 staff on a like for like basis) and +45 in the Rest of the World (China, India,Chile and Australia). The increase in the per-capita cost is due to the reduced recourse to social shock absorbers, the greater use ofovertime to cope with higher sales volumes, and also contractual salary raises and bonus awards for the achievement of targets.
EBITDA stood at €94.7 million or 20.0% of sales, compared to the €73.9 million of 2010 which accounted for 18.5% of sales (+28.0%and +26.6% on a like for like basis). The following table shows EBITDA for each business sector:
26
10.
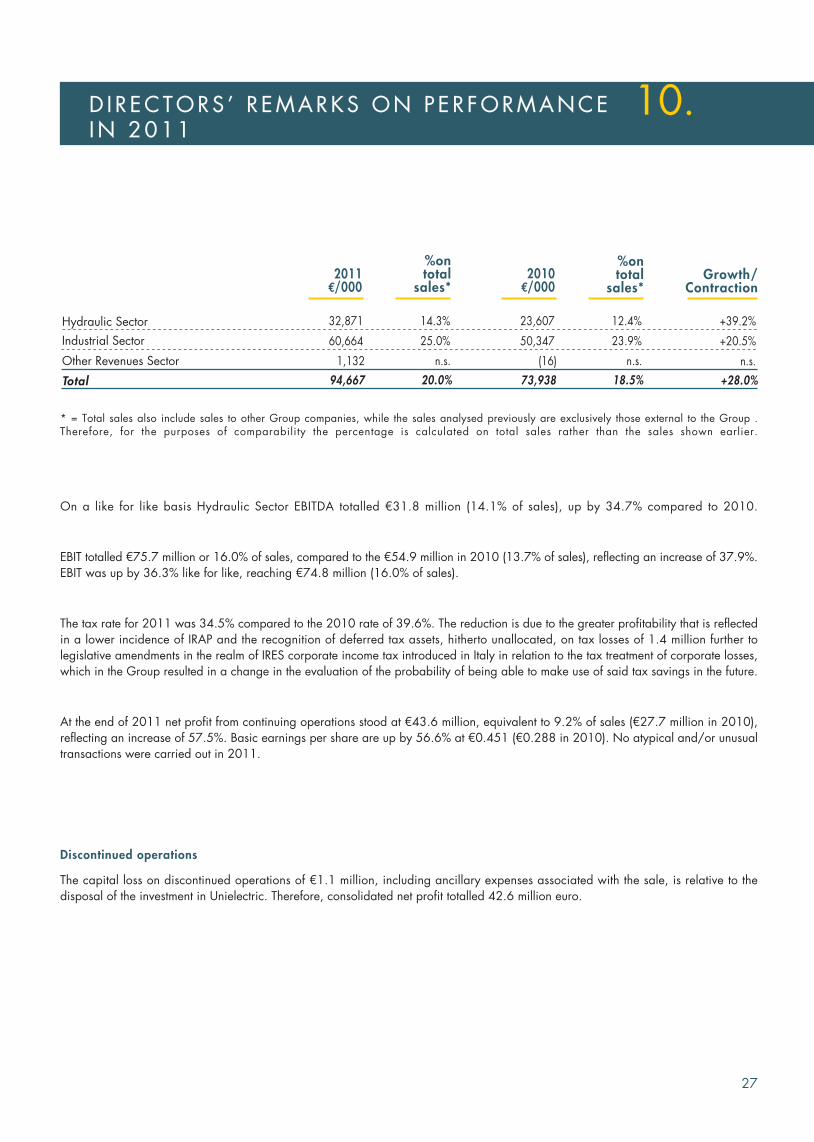
On a like for like basis Hydraulic Sector EBITDA totalled €31.8 million (14.1% of sales), up by 34.7% compared to 2010.
EBIT totalled €75.7 million or 16.0% of sales, compared to the €54.9 million in 2010 (13.7% of sales), reflecting an increase of 37.9%.EBIT was up by 36.3% like for like, reaching €74.8 million (16.0% of sales).
The tax rate for 2011 was 34.5% compared to the 2010 rate of 39.6%. The reduction is due to the greater profitability that is reflectedin a lower incidence of IRAP and the recognition of deferred tax assets, hitherto unallocated, on tax losses of 1.4 million further tolegislative amendments in the realm of IRES corporate income tax introduced in Italy in relation to the tax treatment of corporate losses,which in the Group resulted in a change in the evaluation of the probability of being able to make use of said tax savings in the future.
At the end of 2011 net profit from continuing operations stood at €43.6 million, equivalent to 9.2% of sales (€27.7 million in 2010),reflecting an increase of 57.5%. Basic earnings per share are up by 56.6% at €0.451 (€0.288 in 2010). No atypical and/or unusualtransactions were carried out in 2011.
Discontinued operations
The capital loss on discontinued operations of €1.1 million, including ancillary expenses associated with the sale, is relative to thedisposal of the investment in Unielectric. Therefore, consolidated net profit totalled 42.6 million euro.
Hydraulic Sector +39.2%32,871
60,664
1,132
Industrial Sector
Other Revenues Sector
Total 94,667
+20.5%
n.s.
+28.0%
14.3%
25.0%
n.s.
20.0%
%ontotal
sales*
* = Total sales also include sales to other Group companies, while the sales analysed previously are exclusively those external to the Group .Therefore, for the purposes of comparability the percentage is calculated on total sales rather than the sales shown earlier.
%ontotal
sales*Growth/
Contraction
23,607
50,347
(16)
73,938
12.4%
23.9%
n.s.
18.5%
2011€/000
2010€/000
27
D I R ECTORS ’ R EMARKS ON PERFORMANCEIN 2011
10.
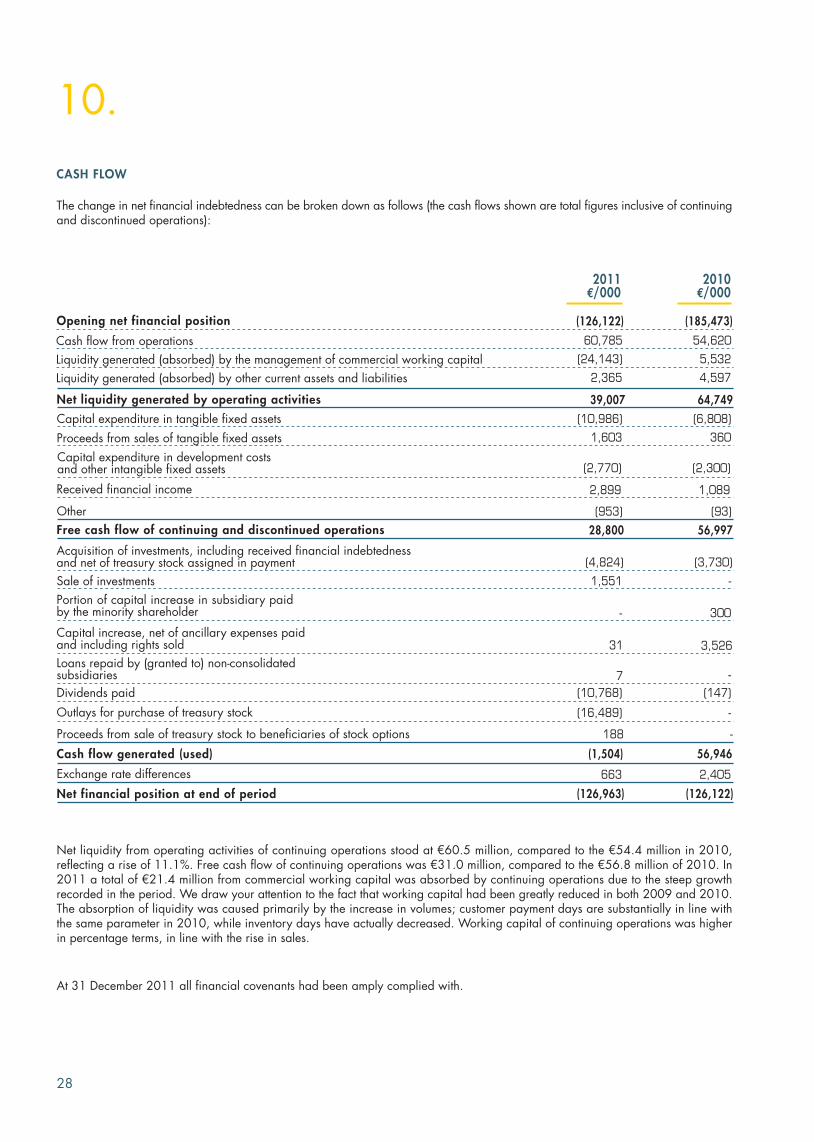
The change in net financial indebtedness can be broken down as follows (the cash flows shown are total figures inclusive of continuingand discontinued operations):
(126,122)Opening net financial position
Capital expenditure in tangible fixed assets
Proceeds from sales of tangible fixed assets
Received financial income
(10,986)
1,603
(2,770)
2,899
Other
Free cash flow of continuing and discontinued operations
Acquisition of investments, including received financial indebtednessand net of treasury stock assigned in payment
Portion of capital increase in subsidiary paidby the minority shareholder
Loans repaid by (granted to) non-consolidatedsubsidiaries
-
(10,768)
Capital expenditure in development costsand other intangible fixed assets
Outlays for purchase of treasury stock
Proceeds from sale of treasury stock to beneficiaries of stock options
Cash flow generated (used)
Exchange rate differences
(1,504)
663
Net financial position at end of period (126,963)
(953)
28,800
188
60,785Cash flow from operations
(24,143)Liquidity generated (absorbed) by the management of commercial working capital
2,365Liquidity generated (absorbed) by other current assets and liabilities
Net liquidity generated by operating activities 39,007
CASH FLOW
(4,824)
2011€/000
2010€/000
Sale of investments 1,551
Capital increase, net of ancillary expenses paidand including rights sold
Dividends paid
(16,489)
(185,473)
(6,808)
360
(2,300)
1,089
300
-
(147)
56,946
2,405
(126,122)
(93)
56,997
-
54,620
5,532
4,597
64,749
(3,730)
-
-
3,52631
7
28
Net liquidity from operating activities of continuing operations stood at €60.5 million, compared to the €54.4 million in 2010,reflecting a rise of 11.1%. Free cash flow of continuing operations was €31.0 million, compared to the €56.8 million of 2010. In2011 a total of €21.4 million from commercial working capital was absorbed by continuing operations due to the steep growthrecorded in the period. We draw your attention to the fact that working capital had been greatly reduced in both 2009 and 2010.The absorption of liquidity was caused primarily by the increase in volumes; customer payment days are substantially in line withthe same parameter in 2010, while inventory days have actually decreased. Working capital of continuing operations was higherin percentage terms, in line with the rise in sales.
At 31 December 2011 all financial covenants had been amply complied with.
10.
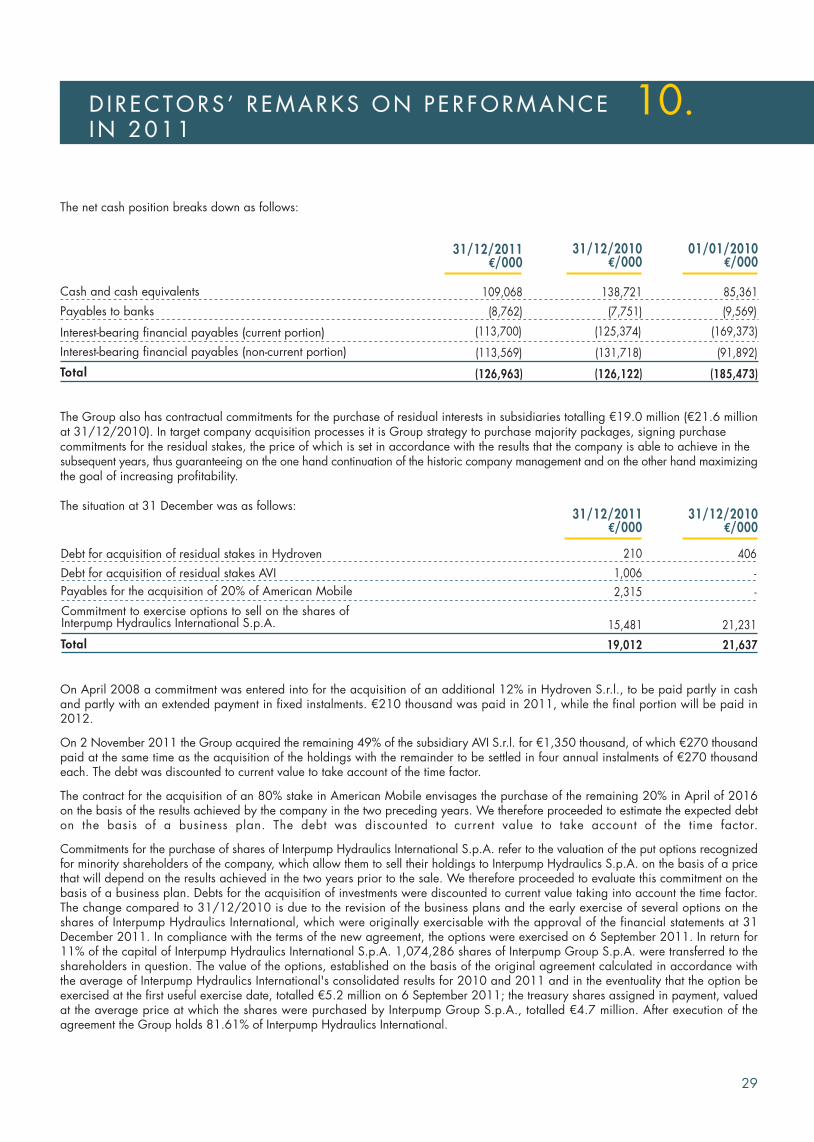
Cash and cash equivalents 109,068
(8,762)
(113,700)
(113,569)
(126,963)
The net cash position breaks down as follows:
The Group also has contractual commitments for the purchase of residual interests in subsidiaries totalling €19.0 million (€21.6 millionat 31/12/2010). In target company acquisition processes it is Group strategy to purchase majority packages, signing purchasecommitments for the residual stakes, the price of which is set in accordance with the results that the company is able to achieve in thesubsequent years, thus guaranteeing on the one hand continuation of the historic company management and on the other hand maximizingthe goal of increasing profitability.
The situation at 31 December was as follows:
On April 2008 a commitment was entered into for the acquisition of an additional 12% in Hydroven S.r.l., to be paid partly in cashand partly with an extended payment in fixed instalments. €210 thousand was paid in 2011, while the final portion will be paid in2012.
On 2 November 2011 the Group acquired the remaining 49% of the subsidiary AVI S.r.l. for €1,350 thousand, of which €270 thousandpaid at the same time as the acquisition of the holdings with the remainder to be settled in four annual instalments of €270 thousandeach. The debt was discounted to current value to take account of the time factor.
The contract for the acquisition of an 80% stake in American Mobile envisages the purchase of the remaining 20% in April of 2016on the basis of the results achieved by the company in the two preceding years. We therefore proceeded to estimate the expected debton the basis of a business plan. The debt was discounted to current value to take account of the time factor.
Commitments for the purchase of shares of Interpump Hydraulics International S.p.A. refer to the valuation of the put options recognizedfor minority shareholders of the company, which allow them to sell their holdings to Interpump Hydraulics S.p.A. on the basis of a pricethat will depend on the results achieved in the two years prior to the sale. We therefore proceeded to evaluate this commitment on thebasis of a business plan. Debts for the acquisition of investments were discounted to current value taking into account the time factor.The change compared to 31/12/2010 is due to the revision of the business plans and the early exercise of several options on theshares of Interpump Hydraulics International, which were originally exercisable with the approval of the financial statements at 31December 2011. In compliance with the terms of the new agreement, the options were exercised on 6 September 2011. In return for11% of the capital of Interpump Hydraulics International S.p.A. 1,074,286 shares of Interpump Group S.p.A. were transferred to theshareholders in question. The value of the options, established on the basis of the original agreement calculated in accordance withthe average of Interpump Hydraulics International's consolidated results for 2010 and 2011 and in the eventuality that the option beexercised at the first useful exercise date, totalled €5.2 million on 6 September 2011; the treasury shares assigned in payment, valuedat the average price at which the shares were purchased by Interpump Group S.p.A., totalled €4.7 million. After execution of theagreement the Group holds 81.61% of Interpump Hydraulics International.
Debt for acquisition of residual stakes in Hydroven
Debt for acquisition of residual stakes AVI
Payables for the acquisition of 20% of American Mobile
Commitment to exercise options to sell on the shares ofInterpump Hydraulics International S.p.A.
Total
1,006
15,481
19,012
406
-
-
21,231
21,637
31/12/2011€/000
85,361
(9,569)
(169,373)
(91,892)
(185,473)
31/12/2010€/000
01/01/2010€/000
138,721
(7,751)
(125,374)
(131,718)
(126,122)
31/12/2011€/000
31/12/2010€/000
210
2,315
Payables to banks
Interest-bearing financial payables (current portion)
Interest-bearing financial payables (non-current portion)
Total
29
D I R ECTORS ’ R EMARKS ON PERFORMANCEIN 2011
10.
Milan, 13 March 2012 For the Board of Directors
Mr. Giovanni Cavallini
Chairman
CAPITAL EXPENDITURE
Expenditure in property, plant and equipment totalled €16.5 million, of which €0.6 million through the acquisition of American Mobile(€9.8 million in 2010). We point out that the companies belonging to the very-high pressure systems segment record machinerymanufactured and hired out to customers under tangible fixed assets (€3.7 million at 31/12/2011 and €2.2 million at 31/12/2010).Net of these latter amounts and expenditure related to the acquisition of equity investments, actual capital expenditure stood at €12.2million in 2011 (€7.6 million at 31/12/2010) and refers to the normal renewal and modernization of plant, machinery and equipment.The difference with respect to the expenditure recorded in the cash flow statement is due to the dynamics of payments.
Increases in intangible fixed assets were €3.8 million, of which €1.0 million through the acquisition of American Mobile (€2.3 millionin 2010), and they mainly refer to expenditure for the development of new products, while the increases of American Mobile are mainlyrelated to the enhancement of the trademark deriving from the acquisition of a line of business.
RESEARCH AND DEVELOPMENT
The Research and Design Centre (Interpump Engineering S.r.l.), set up to centralize design and development of new products in highpressure pumps, hydraulic pumps and hydraulic components, completed a new family of high pressure pumps and a new family ofhydraulic pumps in 2011, in addition to two new valves. There are also several projects currently underway to design new high andvery-high pressure pumps, valves for the industrial sector, and hydraulic pumps. Research and development was conducted primarilywithin Interpump Hydraulics for the Hydraulic Sector and in Hammelmann for very high pressure pumps and systems.
Group strategy over the next few years is to continue with high levels of expenditure in the area of research and development in orderto impart renewed impetus to structured growth. Research costs have been capitalized in accordance with their multi-annual usefulness.The development costs capitalized in 2011 amount to €/000 2,434 (€/000 2,044 in 2010), while the costs charged to the incomestatement were €/000 6,846 (€/000 6,825 in 2010).
31
D I R ECTORS ’ R EMARKS ON PERFORMANCEIN 2011
10.
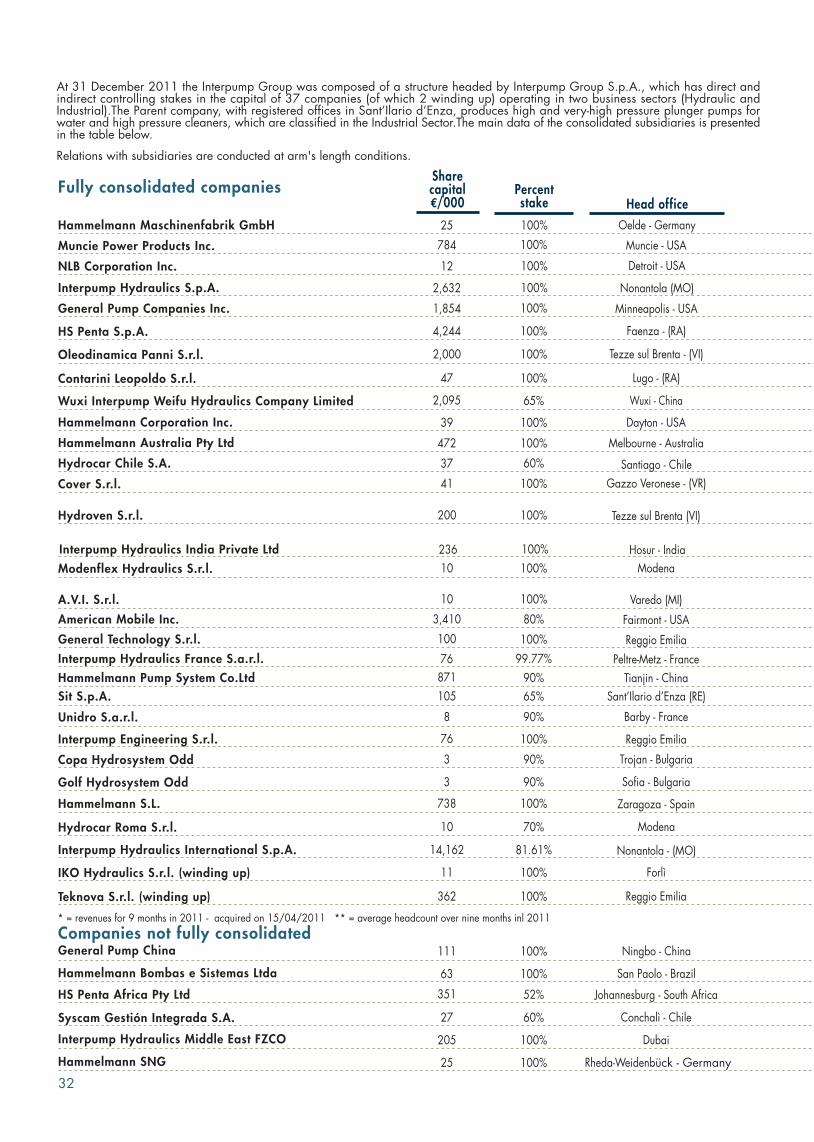
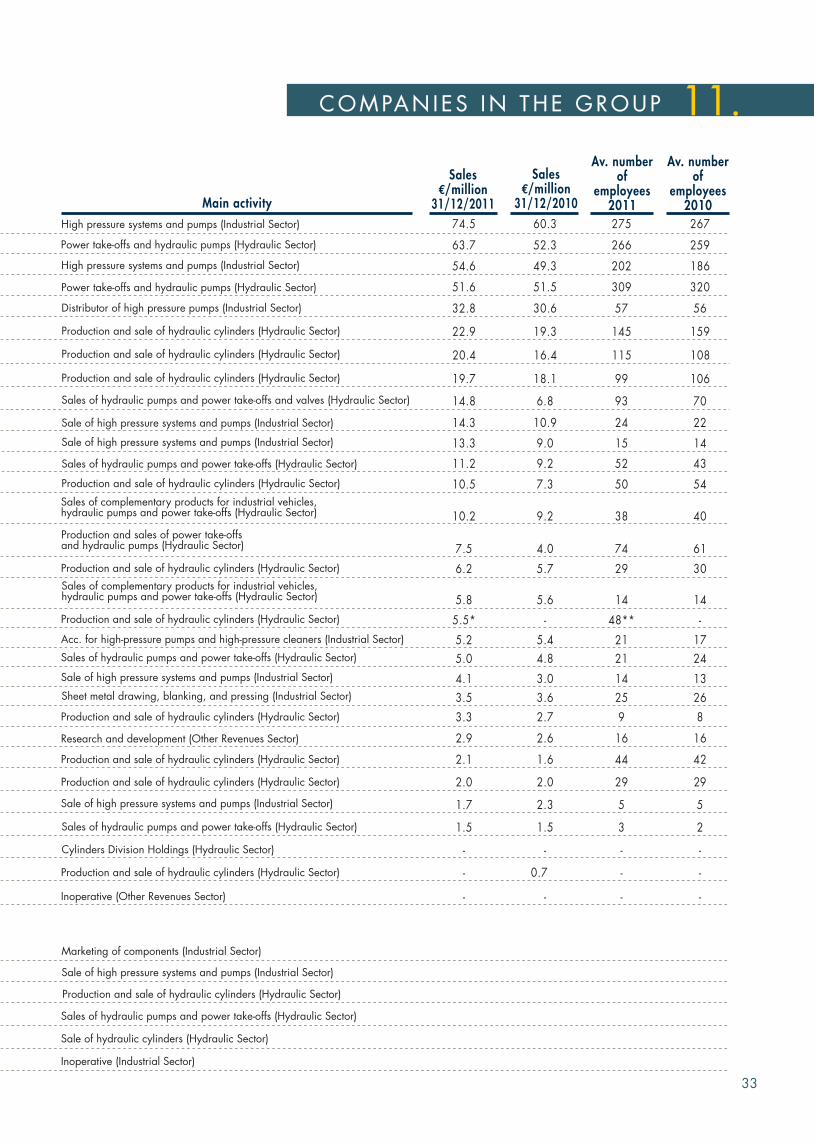
At 31 December 2011 the Interpump Group was composed of a structure headed by Interpump Group S.p.A., which has direct andindirect controlling stakes in the capital of 37 companies (of which 2 winding up) operating in two business sectors (Hydraulic andIndustrial).The Parent company, with registered offices in Sant’Ilario d’Enza, produces high and very-high pressure plunger pumps forwater and high pressure cleaners, which are classified in the Industrial Sector.The main data of the consolidated subsidiaries is presentedin the table below.
Relations with subsidiaries are conducted at arm's length conditions.
100%Muncie Power Products Inc. 784 Muncie - USA
General Pump Companies Inc.
Hammelmann Maschinenfabrik GmbH
Hydroven S.r.l.
Hammelmann Australia Pty Ltd
A.V.I. S.r.l.
Sit S.p.A.
Wuxi Interpump Weifu Hydraulics Company Limited
Hydrocar Chile S.A.
Interpump Hydraulics France S.a.r.l.
Contarini Leopoldo S.r.l.
Interpump Hydraulics International S.p.A.
Hammelmann S.L.
General Technology S.r.l.
Unidro S.a.r.l.
Interpump Engineering S.r.l.
25
1,854
200
472
10
37
2,095
105
76
14,162
47
738
100
76
8
100%
100%
100%
100%
100%
60%
65%
65%
99.77%
81.61%
100%
100%
100%
100%
90%
Minneapolis - USA
Oelde - Germany
Tezze sul Brenta (VI)
Melbourne - Australia
Varedo (MI)
Sant’Ilario d’Enza (RE)
Wuxi - China
Santiago - Chile
Peltre-Metz - France
Lugo - (RA)
Nonantola - (MO)
Zaragoza - Spain
Reggio Emilia
Reggio Emilia
Barby - France
* = revenues for 9 months in 2011 - acquired on 15/04/2011 ** = average headcount over nine months inl 2011
100%Interpump Hydraulics S.p.A. 2,632 Nonantola (MO)
Hammelmann Corporation Inc. 39 100% Dayton - USA
Interpump Hydraulics India Private Ltd 236 100% Hosur - India
Fully consolidated companies
Hydrocar Roma S.r.l. 10 70% Modena
NLB Corporation Inc. 12 100% Detroit - USA
Hammelmann Pump System Co.Ltd 871 90% Tianjin - China
Copa Hydrosystem Odd 3 90% Trojan - Bulgaria
Modenflex Hydraulics S.r.l. 10 100% Modena
IKO Hydraulics S.r.l. (winding up) 11 100% Forlì
Companies not fully consolidated
Syscam Gestión Integrada S.A.
HS Penta Africa Pty Ltd 351
27
52%
60%
Johannesburg - South Africa
Conchalì - Chile
Hammelmann Bombas e Sistemas Ltda 63 100% San Paolo - Brazil
Interpump Hydraulics Middle East FZCO 205 100% Dubai
HS Penta S.p.A. 4,244 100% Faenza - (RA)
Cover S.r.l. 41 100% Gazzo Veronese - (VR)
Oleodinamica Panni S.r.l. 2,000 100% Tezze sul Brenta - (VI)
Golf Hydrosystem Odd 3 90% Sofia - Bulgaria
General Pump China 111 100% Ningbo - China
Sharecapital€/000
Percentstake Head office
American Mobile Inc. 3,410 80% Fairmont - USA
Teknova S.r.l. (winding up) 362 100% Reggio Emilia
Hammelmann SNG 25 100% Rheda-Weidenbück - Germany
32
266
202
309
145
115
99
93
52
50
74
14
21
29
15
25
16
63.7
54.6
51.6
22.9
20.4
19.7
14.8
11.2
10.5
7.5
5.8
5.2
6.2
13.3
3.5
2.9
Power take-offs and hydraulic pumps (Hydraulic Sector)
Distributor of high pressure pumps (Industrial Sector)
High pressure systems and pumps (Industrial Sector)
Sales of complementary products for industrial vehicles,hydraulic pumps and power take-offs (Hydraulic Sector)
Sale of high pressure systems and pumps (Industrial Sector)
Sales of complementary products for industrial vehicles,hydraulic pumps and power take-offs (Hydraulic Sector)
Sheet metal drawing, blanking, and pressing (Industrial Sector)
Sales of hydraulic pumps and power take-offs (Hydraulic Sector)
Sales of hydraulic pumps and power take-offs and valves (Hydraulic Sector)
Sales of hydraulic pumps and power take-offs (Hydraulic Sector)
Production and sale of hydraulic cylinders (Hydraulic Sector)
Cylinders Division Holdings (Hydraulic Sector)
Sale of high pressure systems and pumps (Industrial Sector)
Acc. for high-pressure pumps and high-pressure cleaners (Industrial Sector)
Research and development (Other Revenues Sector)
Production and sale of hydraulic cylinders (Hydraulic Sector)
27574.5
Power take-offs and hydraulic pumps (Hydraulic Sector)
2414.3Sale of high pressure systems and pumps (Industrial Sector)
Production and sales of power take-offsand hydraulic pumps (Hydraulic Sector)
3810.2
144.1
Sales of hydraulic pumps and power take-offs (Hydraulic Sector)
5732.8
High pressure systems and pumps (Industrial Sector)
93.3
Sale of high pressure systems and pumps (Industrial Sector)
442.1Production and sale of hydraulic cylinders (Hydraulic Sector)
51.7
Production and sale of hydraulic cylinders (Hydraulic Sector)
31.5
Production and sale of hydraulic cylinders (Hydraulic Sector)
--
Production and sale of hydraulic cylinders (Hydraulic Sector)
Sales of hydraulic pumps and power take-offs (Hydraulic Sector)
Sale of high pressure systems and pumps (Industrial Sector)
Sale of hydraulic cylinders (Hydraulic Sector)
48**5.5*
Production and sale of hydraulic cylinders (Hydraulic Sector)
215.0
Production and sale of hydraulic cylinders (Hydraulic Sector)
Production and sale of hydraulic cylinders (Hydraulic Sector)
292.0Production and sale of hydraulic cylinders (Hydraulic Sector)
259
186
320
159
108
106
70
43
54
61
14
17
30
14
26
16
267
22
40
13
56
8
42
5
2
-
-
24
29
52.3
49.3
51.5
19.3
16.4
18.1
6.8
9.2
7.3
4.0
5.6
5.4
5.7
9.0
3.6
2.6
60.3
10.9
9.2
3.0
30.6
2.7
1.6
2.3
1.5
-
-
4.8
2.0
Marketing of components (Industrial Sector)
Main activity
Sales€/million
31/12/2011
Av. numberof
employees2011
Av. numberof
employees2010
Production and sale of hydraulic cylinders (Hydraulic Sector)
--
Inoperative (Other Revenues Sector)
-
Inoperative (Industrial Sector)
Sales€/million
31/12/2010
--- -
0.7
33
COMPAN IES IN THE GROUP 11.
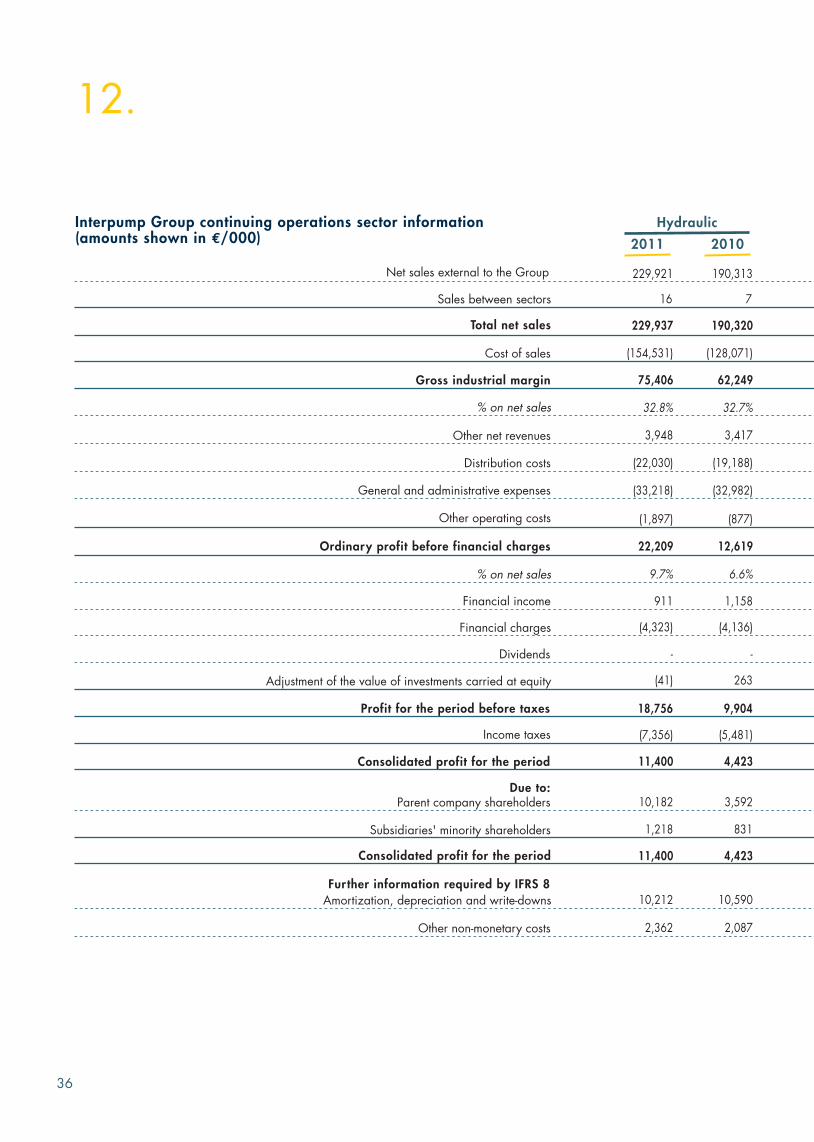
Business sector information is supplied with reference to operating sectors. We also present the information required by IFRS bygeographical area. Information on operating sectors reflects the Group’s internal reporting structure.
The value of components and products transferred between sectors is generally the effective sales price between Group companiesand corresponds to the best customer sale prices.
Sector information includes directly attributable costs and costs allocated on the basis of reasonable estimates. The holding costs(remuneration of directors, auditors and functions of the Group's financial management, control and internal auditing, and also consultancycosts and other related costs) were ascribed to the sectors on the basis of sales.
BUSINESS SECTORS
The Group is composed of the following business sectors:
Hydraulic Sector
. Mainly composed of high and very high-pressure pumps and pumping systems used in a wide range of industrial sectors for theconveyance of fluids. High-pressure plunger pumps are the main component of professional high-pressure washers. These pumps arealso utilized for a broad range of industrial applications including car wash installations, forced lubrication systems for machine tools,and inverse osmosis systems for water desalination plants. Very high-pressure pumps and systems are used for cleaning surfaces, ships,various types of pipes, and also for removing machining burr, cutting and removing cement, asphalt, and paint coatings from stone,cement and metal surfaces, and for cutting solid materials. Marginally, this sector also includes operations of drawing, shearing andpressing sheet metal and the manufacture and sale of cleaning machinery.
Industrial Sector
Includes the production and sale of power take-offs, hydraulic cylinders, pumps, and other hydraulic components. Power take-offs aremechanical devices designed to transmit drive from an industrial vehicle engine or transmission to power a range of ancillary servicesthrough hydraulic components. These products, combined with other hydraulic components (spool valves, controls, etc.) allow theexecution of special functions such as lifting tipping bodies, moving truck-mounted cranes, operating mixer truck drums, and so forth.Hydraulic cylinders are components of the hydraulic system of various vehicle types, utilized in a wide range of applications dependingon the type. Front-end and underbody cylinders (single acting) are utilized mainly on industrial vehicles in the construction sector, whiledouble acting cylinders are utilized in a range of applications: earthmoving machinery, agricultural machinery, cranes and truck cranes,waste compactors, etc.
35
BUS INESS SECTOR INFORMAT ION 12.
Net sales external to the Group
Sales between sectors
Total net sales
% on net sales
Cost of sales
Gross industrial margin
Other net revenues
Distribution costs
Other operating costs
Ordinary profit before financial charges
% on net sales
Financial income
Dividends
Adjustment of the value of investments carried at equity
Profit for the period before taxes
Income taxes
Consolidated profit for the period
Due to:Parent company shareholders
Subsidiaries' minority shareholders
Consolidated profit for the period
General and administrative expenses
229,921
229,937
(154,531)
75,406
32.8%
3,948
(22,030)
(33,218)
(1,897)
22,209
(41)
18,756
9.7%
Hydraulic
2011 2010
Financial charges
Further information required by IFRS 8Amortization, depreciation and write-downs
Other non-monetary costs
16
911
(4,323)
-
(7,356)
11,400
10,182
1,218
11,400
10,212
2,362
190,313
190,320
(128,071)
62,249
32.7%
3,417
(19,188)
(32,982)
(877)
12,619
263
9,904
6.6%
7
1,158
(4,136)
-
(5,481)
4,423
3,592
831
4,423
10,590
2,087
36
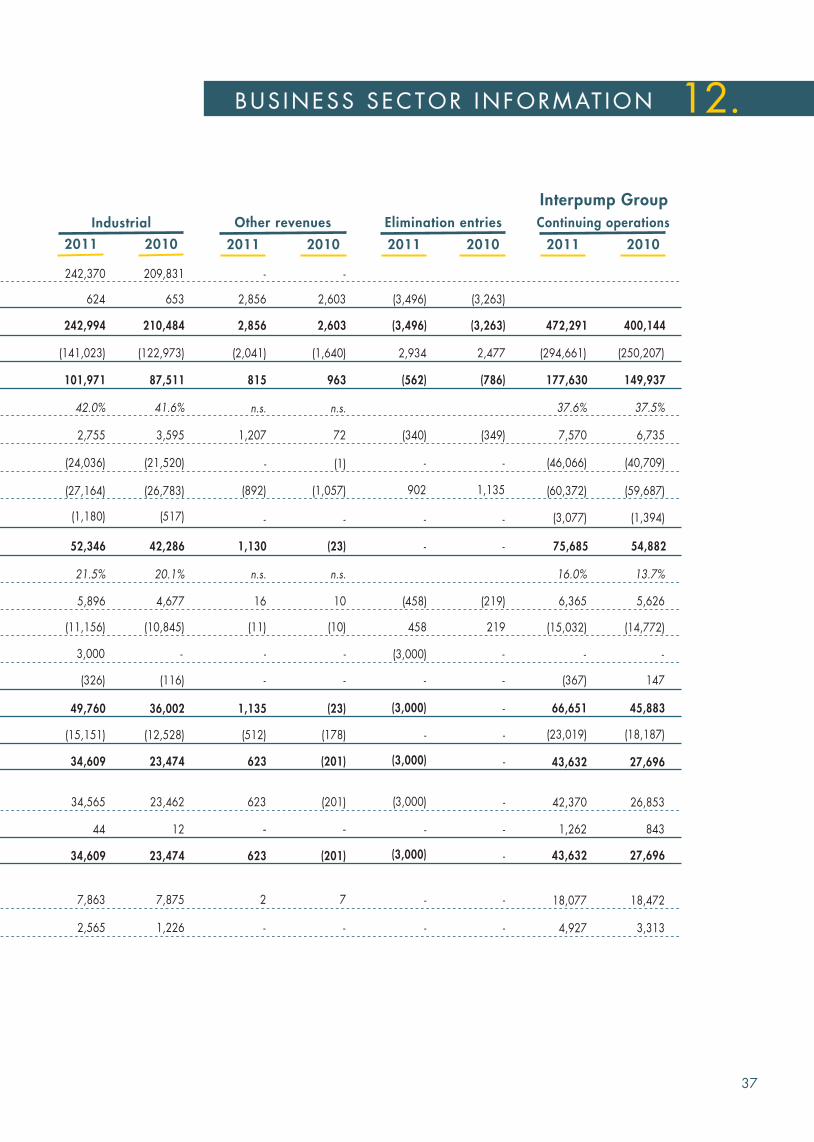
Interpump Group continuing operations sector information(amounts shown in €/000)
12.
472,291
(294,661)
177,630
37.6%
7,570
(46,066)
(3,077)
75,685
(367)
16.0%
6,365
-
66,651
(23,019)
43,632
42,370
1,262
43,632
(60,372)
(3,496)
(3,496)
2,934
(562)
(340)
-
-
-
-
902
-
2,856
2,856
(2,041)
815
n.s.
1,207
-
1,130
-
1,135
n.s.
(892)
242,370
624
242,994
(141,023)
101,971
42.0%
2,755
(24,036)
(1,180)
52,346
(326)
49,760
21.5%
(27,164)
Industrial
2011 2010 2011 2010
Other revenues
2011 2010
Elimination entries
2011 2010
Interpump Group
(15,032)
18,077
4,927
5,896
(11,156)
3,000
16
(11)
-
(458)
458
(15,151)
34,609
34,565
44
34,609
7,863
2,565
(512)
623
623
-
623
2
-
-
-
-
-
-
209,831
653
210,484
(122,973)
87,511
41.6%
3,595
(21,520)
(517)
42,286
(116)
36,002
20.1%
(26,783)
4,677
(10,845)
-
(12,528)
23,474
23,462
12
23,474
7,875
1,226
-
2,603
2,603
(1,640)
963
n.s.
72
-
(23)
-
(23)
n.s.
(1,057)
10
(10)
-
(178)
(201)
(201)
-
(201)
7
-
(1)
(3,263)
(3,263)
2,477
(786)
(349)
-
-
-
-
1,135
(219)
219
-
-
-
-
-
-
-
-
-
(3,000)
(3,000)
(3,000)
(3,000)
(3,000)
400,144
(250,207)
149,937
37.5%
6,735
(40,709)
(1,394)
54,882
147
13.7%
5,626
-
45,883
(18,187)
27,696
26,853
843
27,696
(59,687)
(14,772)
18,472
3,313
Continuing operations
37
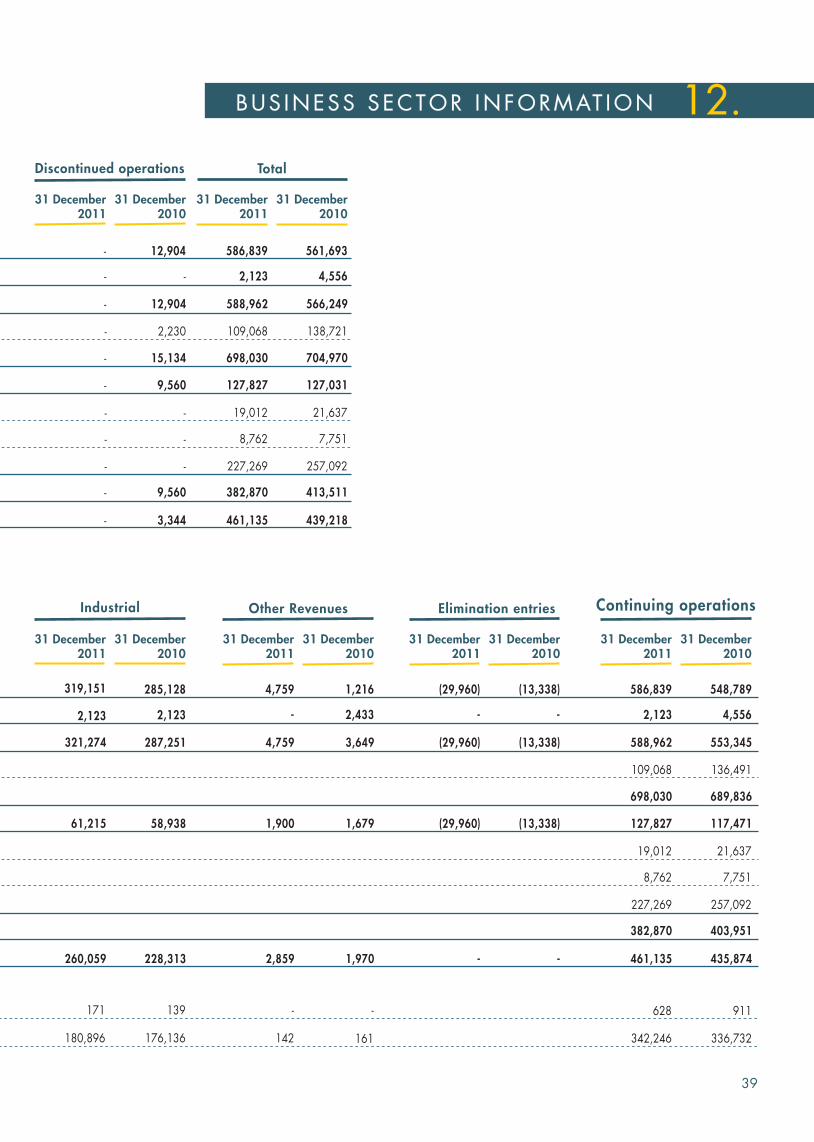
BUS INESS SECTOR INFORMAT ION 12.
Hydraulic
31 December2011
Assets by sector
Assets held for sale
Cash and cash equivalents
Liabilities of the sector (B)
Total assets
Payables to banks
Total liabilities
Interest-bearing financial payables
-
94,672
Payables for payment of investments
Subtotal of assets of the sector (A)
Total assets, net (A-B)
292,889
198,217
31 December2010
292,889
-
70,192
275,783
205,591
275,783
Further information required by IFRS 8Investments carried at equity
Non-current assets other than financial assets and deferred tax assets
457
161,208
772
160,435
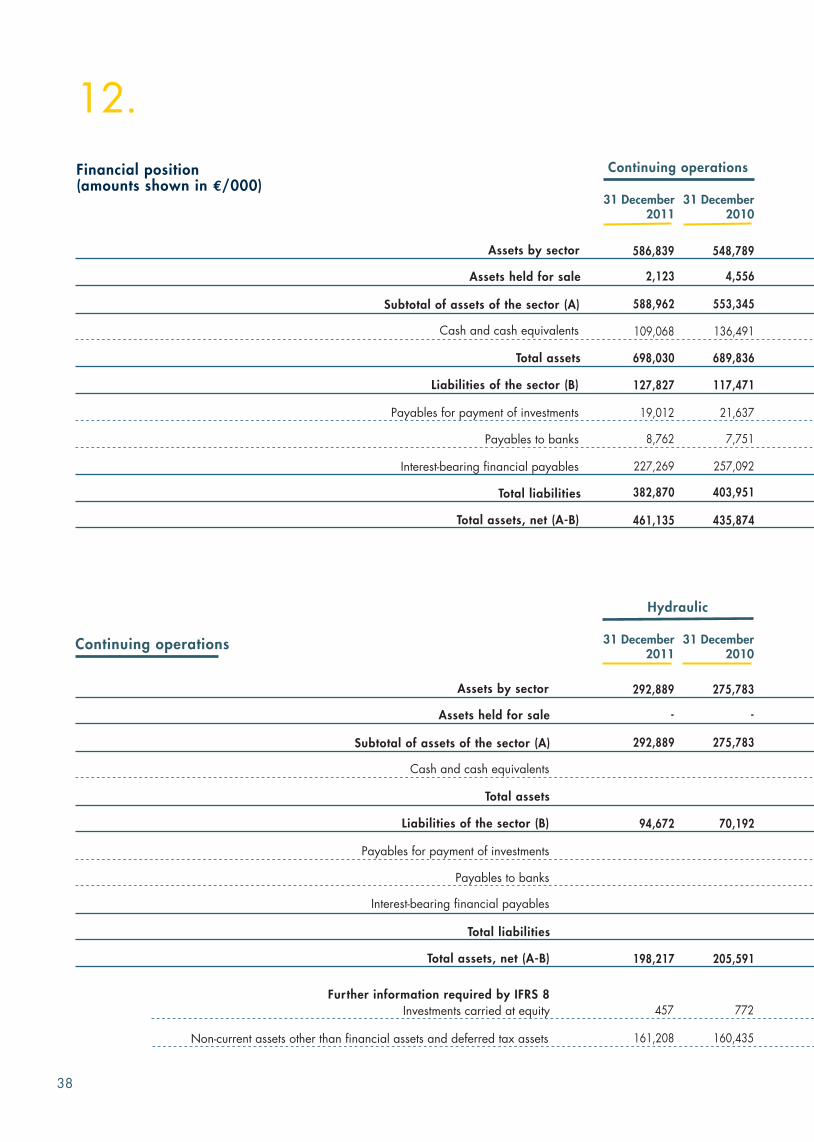
Continuing operations
31 December2011
Assets by sector
Assets held for sale
Cash and cash equivalents
Liabilities of the sector (B)
Total assets
Payables to banks
Total liabilities
Interest-bearing financial payables
2,123
127,827
Payables for payment of investments
Subtotal of assets of the sector (A)
Total assets, net (A-B)
588,962
461,135
31 December2010
586,839
698,030
109,068
19,012
8,762
227,269
382,870
4,556
117,471
553,345
435,874
548,789
689,836
136,491
21,637
7,751
257,092
403,951
12.
Continuing operations
38
Financial position(amounts shown in €/000)
Other RevenuesIndustrial
31 December2011
31 December2010
31 December2011
31 December2010
58,938
287,251
228,313
285,128
-
1,900
4,759
2,859
4,759
2,433
1,679
3,649
1,970
1,216
Elimination entries
31 December2011
31 December2010
-
(29,960)
(29,960)
-
(29,960)
-
(13,338)
(13,338)
-
(13,338)
Continuing operations
31 December2011
31 December2010
2,123
127,827
588,962
461,135
586,839
698,030
109,068
19,012
8,762
227,269
382,870
4,556
117,471
553,345
435,874
548,789
689,836
136,491
21,637
7,751
257,092
403,951
61,215
321,274
260,059
2,123
319,151
2,123
171
180,896
139
176,136
- - 628
342,246
911
336,732142 161
TotalDiscontinued operations
31 December2011
31 December2010
31 December2011
31 December2010
-
-
-
-
-
-
-
-
-
-
-
-
9,560
12,904
3,344
12,904
15,134
2,230
-
-
-
9,560
2,123
127,827
588,962
461,135
586,839
698,030
109,068
19,012
8,762
227,269
382,870
4,556
127,031
566,249
439,218
561,693
704,970
138,721
21,637
7,751
257,092
413,511
39
BUS INESS SECTOR INFORMAT ION 12.
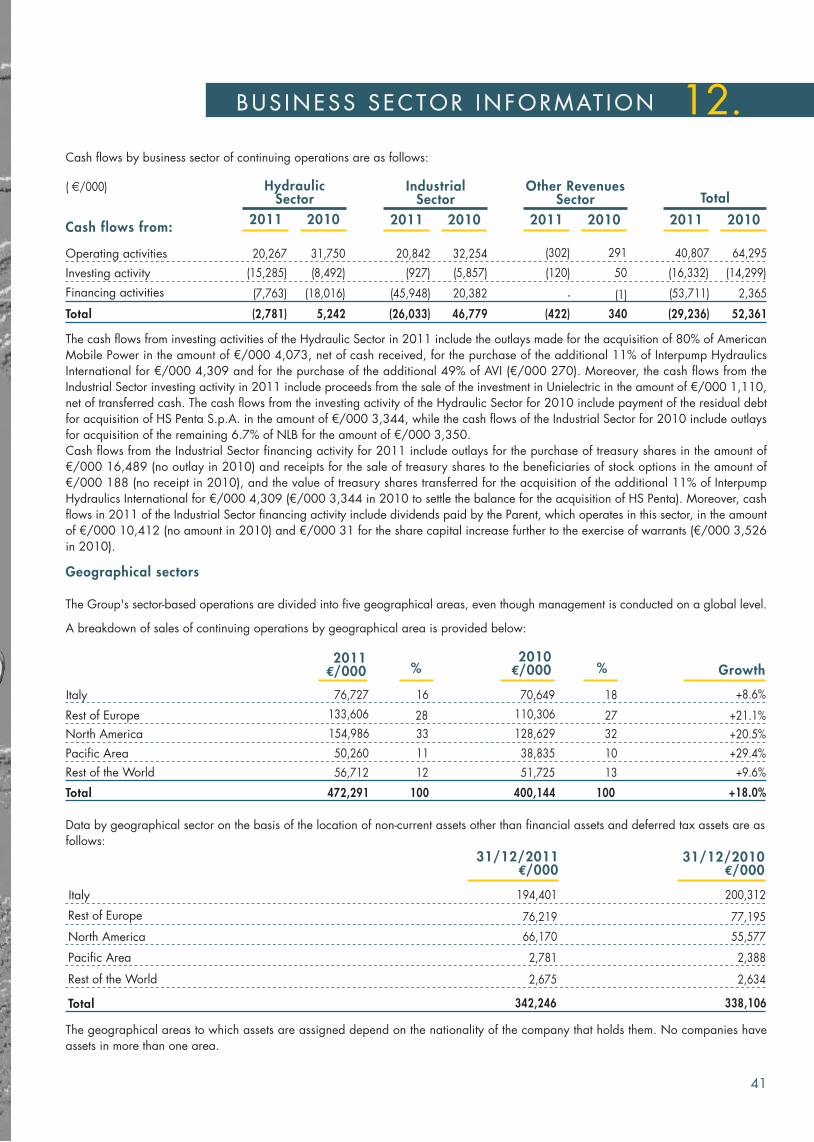
Cash flows by business sector of continuing operations are as follows:
Cash flows from:
Operating activities
Total
Investing activity
Financing activities
(29,236)
40,807
(53,711)
(16,332)
(2,781)
20,267
(7,763)
(15,285)
(26,033)
20,842
(45,948)
(927)
(422)
(302)
(120)
-
HydraulicSector
2011 2010
IndustrialSector
2011 2010
Other RevenuesSector
2011 2010
Total
2011 2010
5,242
31,750
(18,016)
(8,492)
46,779
32,254
20,382
(5,857)
340
291
50
(1)
52,361
2,365
(14,299)
64,295
( /000)
Data by geographical sector on the basis of the location of non-current assets other than financial assets and deferred tax assets are asfollows:
The geographical areas to which assets are assigned depend on the nationality of the company that holds them. No companies haveassets in more than one area.
194,401
76,219
66,170
Italy
Rest of Europe
North America
Pacific Area
Total
2,781
342,246
Rest of the World 2,675
Geographical sectors
The Group's sector-based operations are divided into five geographical areas, even though management is conducted on a global level.
A breakdown of sales of continuing operations by geographical area is provided below:
76,727
133,606
154,986
Italy
Rest of Europe
North America
Pacific Area
Total
50,260
472,291
16
28
33
11
100
Rest of the World 56,712 12
+8.6%
+21.1%
+20.5%
+29.4%
+18.0%
+9.6%
%%2011€/000 Growth
31/12/2011€/000
18
27
32
10
100
13
70,649
110,306
128,629
400,144
51,725
2010€/000
38,835
31/12/2010€/000
200,312
77,195
55,577
2,388
338,106
2,634
41
The cash flows from investing activities of the Hydraulic Sector in 2011 include the outlays made for the acquisition of 80% of AmericanMobile Power in the amount of €/000 4,073, net of cash received, for the purchase of the additional 11% of Interpump HydraulicsInternational for €/000 4,309 and for the purchase of the additional 49% of AVI (€/000 270). Moreover, the cash flows from theIndustrial Sector investing activity in 2011 include proceeds from the sale of the investment in Unielectric in the amount of €/000 1,110,net of transferred cash. The cash flows from the investing activity of the Hydraulic Sector for 2010 include payment of the residual debtfor acquisition of HS Penta S.p.A. in the amount of €/000 3,344, while the cash flows of the Industrial Sector for 2010 include outlaysfor acquisition of the remaining 6.7% of NLB for the amount of €/000 3,350.Cash flows from the Industrial Sector financing activity for 2011 include outlays for the purchase of treasury shares in the amount of€/000 16,489 (no outlay in 2010) and receipts for the sale of treasury shares to the beneficiaries of stock options in the amount of€/000 188 (no receipt in 2010), and the value of treasury shares transferred for the acquisition of the additional 11% of InterpumpHydraulics International for €/000 4,309 (€/000 3,344 in 2010 to settle the balance for the acquisition of HS Penta). Moreover, cashflows in 2011 of the Industrial Sector financing activity include dividends paid by the Parent, which operates in this sector, in the amountof €/000 10,412 (no amount in 2010) and €/000 31 for the share capital increase further to the exercise of warrants (€/000 3,526in 2010).
BUS INESS SECTOR INFORMAT ION 12.
42
43
INDEPENDENT AUD I TOR ’S REPORT 13.
1. The undersigned Paolo Marinsek and Carlo Banci, respectively Executive Director and Managerresponsible for the drafting of company accounting documents of Interpump Group S.p.A., takingaccount also of the provisions of art. 154-(2), paras. 3 and 4 of decree D.Lgs 24 February 1998no. 58:
– the adequacy in relation to the characteristics of the business and– the effective application
of the administrative and accounting procedures for the formation of the consolidated financial statements during 2011.
2. In addition, it is confirmed that consolidated financial statements of Interpump Group S.p.A. and its subsidiaries for the year ended 31 December 2011, which show consolidated total assetsof €698,030 thousand, consolidated net profit of €42,585 thousand and consolidated shareholder'sequity of €315,160 thousand:
Attestation of the consolidated financial statements pursuant to art. 81-(3) ofConsob regulation no. 11971 (which refers to ar t. 154-(2) para. 5 of theConsolidated Finance Act) of 14 May 1999 and subsequent amendments
a) correspond to the results of the company books and accounting entries;b) were prepared in compliance with the international accounting standards approved by the
European Commission further to the enforcement of Ruling (CE) no. 1606/2002 of the EuropeanParliament and the European Council of 19 July 2002, and the provisions issued in implementationof art. 9 of decree D. Lgs. 38/2005 and the contents are suitable for providing a truthful andfair representation of the equity, economic and financial situation of the company and the group of companies included in the scope of consolidation;
c) the Board of Directors' report contains a reliable analysis of performance and results and thesituation of the issuer and the companies included in the consolidation together with a descriptionof the main risks and uncertainties to which they are exposed.
Milan, 13 March 2012
Mr. Paolo Marinsek Mr. Carlo BanciExecutive Director Manager responsible for drafting
company accounting documents
45
ANNEX 1

The information herein reportedhave been extracted from the
Annual Financial Report which can bedownloaded from the website
www.interpumpgroup.itor requested to
Interpump Group S.p.A.Via E.Fermi, 25 - 42049 Sant’Ilario d’Enza - RE
Fax: +39 0522 904444e-mail: [email protected]
Graphic lay-out: GI&VI - Reggio EmiliaPhotolitography: Recos la Fotolito - Castelnovo di Sotto (RE)Printed by : Arti Grafiche De Pietri - Castelnovo di Sotto (RE)
47


http :// www.interpumpgroup.it