Embed Size (px)
Citation preview

BNP Paribas European Leader With Strong Capital
Generation Capacity
Jean-Laurent Bonnafé Chief Executive Officer
Goldman Sachs Conference, Rome
17 June 2015
Goldman Sachs Conference – June 2015 2
Disclaimer
Figures included in this presentation are unaudited. On 24 March 2015, BNP Paribas issued a restatement of its quarterly results for
2014 reflecting, in particular, the new organization of the Bank’s operating divisions as well as the adoption of the accounting
standards IFRIC 21. This presentation is based on the published or the restated 2014 data as appropriate.
This presentation includes forward-looking statements based on current beliefs and expectations about future events. Forward-
looking statements include financial projections and estimates and their underlying assumptions, statements regarding plans,
objectives and expectations with respect to future events, operations, products and services, and statements regarding future
performance and synergies. Forward-looking statements are not guarantees of future performance and are subject to inherent risks,
uncertainties and assumptions about BNP Paribas and its subsidiaries and investments, developments of BNP Paribas and its
subsidiaries, banking industry trends, future capital expenditures and acquisitions, changes in economic conditions globally or in
BNP Paribas’ principal local markets, the competitive market and regulatory factors. Those events are uncertain; their outcome may
differ from current expectations which may in turn significantly affect expected results. Actual results may differ materially from those
projected or implied in these forward looking statements. Any forward-looking statement contained in this presentation speaks as of
the date of this presentation. BNP Paribas undertakes no obligation to publicly revise or update any forward-looking statements in
light of new information or future events.
The information contained in this presentation as it relates to parties other than BNP Paribas or derived from external sources has
not been independently verified and no representation or warranty expressed or implied is made as to, and no reliance should be
placed on the fairness, accuracy, completeness or correctness of, the information or opinions contained herein. None of BNP
Paribas or its representatives shall have any liability whatsoever in negligence or otherwise for any loss however arising from any
use of this presentation or its contents or otherwise arising in connection with this presentation or any other information or material
discussed.

Goldman Sachs Conference – June 2015 3
Overview
Progressive recovery of the Eurozone economy
Strong solvency and capital generation capacity
Good operating performance in 1Q15

Goldman Sachs Conference – June 2015 4
Strong Operating Performance
Strong Solvency and Capital Generation Capacity
Progressive Recovery of the Eurozone Economy

Goldman Sachs Conference – June 2015 5
Positive macro factors for the EU economy in 2015
Depreciation of the Euro vs. USD to benefit exporting European corporates
Drop in oil price should translate into higher disposable income for households and lower charges for corporates (IMF estimated benefit: ~+0.5% GDP)
Non-conventional measures by the ECB to re-launch economic growth
TLTRO: massive additional liquidity favouring credit development in the Eurozone
Quantitative Easing started on 9 March 2015
Resulting in prolonged very low interest rates which will be favourable for investments
The “Juncker Plan”: a €315bn investment plan
Allocated to long-term investments & SMEs/Mid-caps
Eurozone Economic Outlook
A favourable combination of positive factors
to support economic recovery in Europe * As at 1 June 2015
1
1.1
1.2
1.3
1.4
EUR / USD
June 15 June 14
$
40
60
80
100
120
WTI Crude Oil
June 15 June 14
$
-20%*
-42%*
Goldman Sachs Conference – June 2015 6
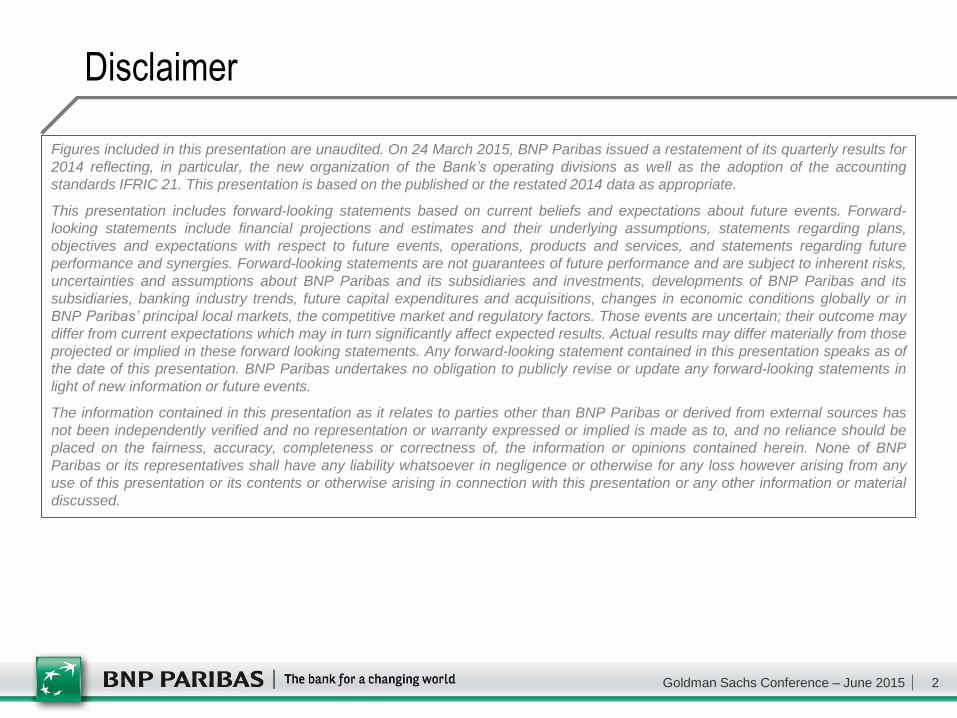
Eurozone Macroeconomic Indicators
* Lending from banks to non-financial corporates and households, source: ECB; ** PMI composite new orders Eurozone (Markit), European Commission Consumer Confidence survey EZ
Confidence indicators pointing towards stronger EZ growth
-25
-20
-15
-10
-5
0
45
47
49
51
53
55
April 15
Index
April 13
PMI composite (LHS)
Consumer confidence (RHS)
Index
April 14
Confidence indicators**
2013 2014 2015 2016 2017
ECB growth forecast for Eurozone GDP
9,472 9,537
+0.7%
GDP in Volume €bn
Eurozone lending*
August 14 March 15
9,500
10,500
10,000
+0.8% +1.5%
+1.9%
+2.1%
Yoy %
Goldman Sachs Conference – June 2015 7
Strong Operating Performance
Strong Solvency and Capital Generation Capacity
Progressive Recovery of the Eurozone Economy

Goldman Sachs Conference – June 2015 8
1Q15 - Strong Underlying Profitability (1/2)
953
1,717 1,648
1,536(2)
1,064
868 784
544 512 366
287
SAN BNPP BBVA ISP SG CASA DB UCI CBK Natixis
1Q15 Net Income(1)
€m
(1) Attributable to equity holders, as disclosed by banks; (2) Including €583m of capital gain on CNBC’s stake disposal
Good profit-generation capacity
Return on Equity excluding one-off items: 9.6%
(but including the first contribution to the SRF)

Goldman Sachs Conference – June 2015 9
1Q15 - Strong Underlying Profitability (2/2)
9.6% 8.8%
7.9% 7.6%
6.0% 5.5% 4.2%
3.1%
BNPP SG BBVA SAN CASA CBK UCI DB
1Q15 Annualised Return on Equity(1)
(1) As disclosed by banks; Bloomberg estimates when not available; (2) Excl. €583m of capital gain on CNBC’s stake disposal
Best in class returns
11.7% 10.0% 9.2% 11.5% n.a 6.2% 4.8% 3.9% RoTE
(2)
Goldman Sachs Conference – June 2015 10
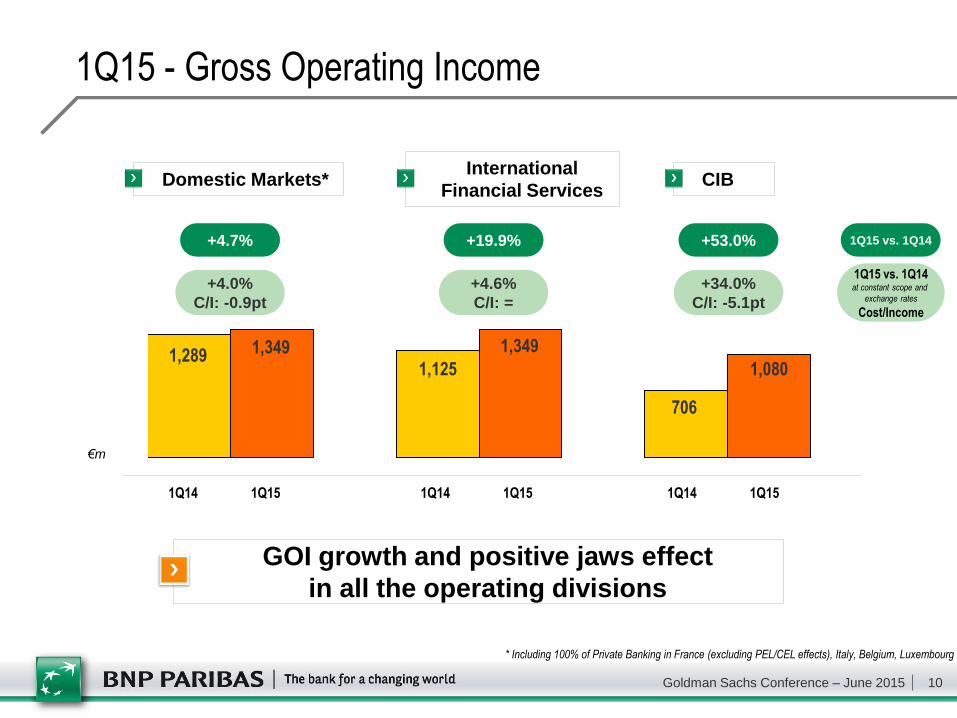
1Q15 - Gross Operating Income
* Including 100% of Private Banking in France (excluding PEL/CEL effects), Italy, Belgium, Luxembourg
Domestic Markets* International
Financial Services CIB
1,289 1,349 1,125
1,349
706
1,080
+4.0%
C/I: -0.9pt
GOI growth and positive jaws effect
in all the operating divisions
1Q15 vs. 1Q14
+4.6%
C/I: =
+34.0%
C/I: -5.1pt
1Q15 vs. 1Q14 at constant scope and
exchange rates
Cost/Income
€m
1Q15 1Q14 1Q15 1Q14 1Q15 1Q14
+4.7% +19.9% +53.0%

Goldman Sachs Conference – June 2015 11
0.66 0.72 0,62*
2013 2014 2015 2016
Simple & Efficient
S&E: positive impact of 1.9bn€ on operating expenses in 2016
In line with the Plan
0.8 1.8
2,6* 3.0
2013 2014 2015 2016
Cumulative recurring cost savings
€bn
One-off transformation costs
€bn
0.1 0.8
1.9 0.6
0.4
2015 2016 2016 vs 2014
Reduction of operating expenses
deriving from Simple & Efficient by 2016
€bn
Decrease in transformation costs
0.9
1.0
Additional recurring cost savings
0
+0.8 +0.4
-0.1 -0.6
* Recurring cost savings: €2bn at the end of 1Q15; Transformation costs: €110m booked in 1Q15

Goldman Sachs Conference – June 2015 12
2016 ROE Target
≥10% ROE target in 2016 confirmed
Equivalent to a ROTE of ≥ 12%
Positive: several levers contributing to ROE improvement
Bolt-on acquisitions closed in 2014
Simple & Efficient
Progressive growth of loan volumes in the context of a European economic upturn
BNL balance sheet de-risking
Negative:
Low interest rates environment
New taxes and regulations
Achieving ≥ 10% ROE target
9.0%
≥ 10%
2014 ROE (underlying*)
2016 ROE
target
S&E
savings
2014 bolt-on
acquisitions
Eurozone
“green shoots”,
BNL CoR,
…
Low
interest
rates
9.6% (1Q15)
* Excluding exceptional items (of which €720m Simple & Efficient transformation costs)
Goldman Sachs Conference – June 2015 13
Strong Operating Performance
Strong Solvency and Capital Generation Capacity
Progressive Recovery of the Eurozone Economy

Goldman Sachs Conference – June 2015 14
An Integrated Business Model Resulting in Strong Diversification
2014 Allocated equity* by business
Corporate Banking: 14%
Other Domestic
Market Activities: 5%
Advisory and
Capital Markets: 15%
Retail France: 12%
Retail Italy: 10%
Personal
Finance: 6%
BancWest: 8%
Retail Belgium: 7%
Europe-Mediterranean: 7%
A well balanced business model
2014 Revenues by geography
Rest of the World : 7%
Germany: 3%
France: 33%
Italy: 13%
APAC: 7%
North America: 10%
Belgium: 11%
Other Europe: 16%
A balanced business model: a clear competitive advantage in terms of revenues and risk diversification
Mostly in wealthy markets (>85%)
Revenues well spread among countries and businesses with different cycles
No single business line weighing more than 15% of allocated equity
Insurance: 12%
WAM: 3%
Securities Services: 1%
* Operating divisions

Goldman Sachs Conference – June 2015 15
Leading to Recurrent Profitability Through the Cycle
Recurrent earnings generation through the cycle
Thanks to diversification
Strong proven capacity to withstand local crisis and external shocks
38% 44% 46%
53% 53% 54%
71% 73%
14%
31% 35% 48%
54%
70%
94%
463%
BNPP DB SAN ISP BBVA SG CASA UCI CS WF JPM HSBCBARC BoA Citi RBS
Cost of Risk/Gross Operating Income 2008-2014
Low risk and limited volatility of earnings
Diversification => lower risk profile
* Adjusted for costs and provisions relating to the comprehensive settlement with U.S. authorities
Low risk appetite and strong diversification lead to low cost of risk
One of the lowest CoR/GOI through the cycle
Net Income Group Share 2008-2014
3.0
5.8
7.8
6.1 6.6 5.6* 6.1*
2008 2009 2010 2011 2012 2013 2014
In €bn
0.2
4.8

Goldman Sachs Conference – June 2015 16
Banking Union Strengthens the Eurozone Banking Sector
Single Supervisory
Mechanism (SSM)
• ECB in charge of the supervision of
130 Eurozone banks since Nov 2014
• Comprehensive Assessment
successfully completed
Single Resolution
Mechanism (SRM)
• Voted in April 2014
• Single Resolution Board operational
• Single Resolution Fund (banks’
contributions starting in 2015)
Deposit Guarantee Scheme
(DGS)
• Voted in April 2014
• To be transposed by July 2015
• Harmonisation of rules governing
national DGS
Banking Union 3 Pillars
Banking Union: relative size of BNPP to relevant GDP
smaller than non-Eurozone peers
0%
20%
40%
60%
80%
100%
120%
140%
160%
180%
CBK ISP BBVA UCI ING SAN SG DB CA BNPP WF Citi BoA JPM StanC Llo SWB RBS SEB BAR NykR HSBC CS NOR UBS DanB
Banks’ Balance Sheet as a % of relevant GDP*
* As at 31.12.14, IFRS estimates for US banks; based on the economic area under the jurisdiction of the Banking Regulator, i.e. Eurozone GDP for banks supervised by the SSM
Goldman Sachs Conference – June 2015 17
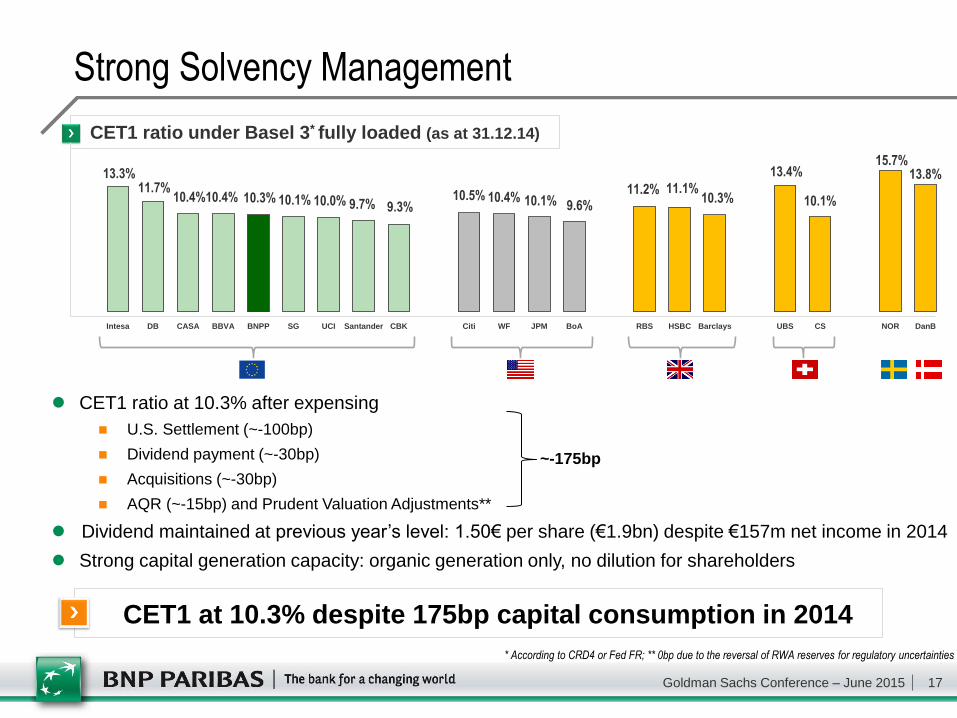
Strong Solvency Management
CET1 ratio at 10.3% after expensing
U.S. Settlement (~-100bp)
Dividend payment (~-30bp)
Acquisitions (~-30bp)
AQR (~-15bp) and Prudent Valuation Adjustments**
Dividend maintained at previous year’s level: 1.50€ per share (€1.9bn) despite €157m net income in 2014
Strong capital generation capacity: organic generation only, no dilution for shareholders
CET1 at 10.3% despite 175bp capital consumption in 2014
* According to CRD4 or Fed FR; ** 0bp due to the reversal of RWA reserves for regulatory uncertainties
~-175bp
13.3% 11.7%
10.4% 10.4% 10.3% 10.1% 10.0% 9.7% 9.3% 10.5% 10.4% 10.1% 9.6%
11.2% 11.1% 10.3%
13.4%
10.1%
15.7% 13.8%
Intesa DB CASA BBVA BNPP SG UCI Santander CBK Citi WF JPM BoA RBS HSBC Barclays UBS CS NOR DanB
CET1 ratio under Basel 3* fully loaded (as at 31.12.14)

Goldman Sachs Conference – June 2015 18
4.5% 4.5% 4.5% 4.5% 4.5%
0.5% 1.0% 1.5% 2.0% 0.6% 1.3%
1.9% 2.5%
2015 2016 2017 2018 2019
A risk-based approach by ECB as witnessed by its public statements and Comprehensive Assessment
Group CET1 largely above regulatory requirements and consistent with Group risk profile
High Quality CET1
Proven global asset quality confirmed by AQR results
PVA & full deduction of goodwill taken into account
Sovereigns already weighted & sovereign AFS filtered
DTA: very limited
Danish compromise: treatment well adapted to banks with insurance activities
Tier 1 and Tier 2 instruments
Tier 1: resume issuance (€1bn to €2bn each year until 01.01.2019*)
Tier 2: €2bn to € 3bn each year until 01.01.2019*
BNPP’s CET 1 requirements
CET1
G-SIB surcharge
Capital conservation buffer
4.5% 5.6%
6.8%
7.9% 9.0%
Capital Adequacy
BNP Paribas YE 2014 fully loaded ratio: 10.3%
Phase-in period
AQR impact on CET1 ratio
-4 -7 -15 -18 -19 -21 -22 -25 -29 -29
-40
-55 -58
BNPP AQR
average
in bp
CET1 well above applicable requirements * Depending on opportunities and market conditions
Goldman Sachs Conference – June 2015 19
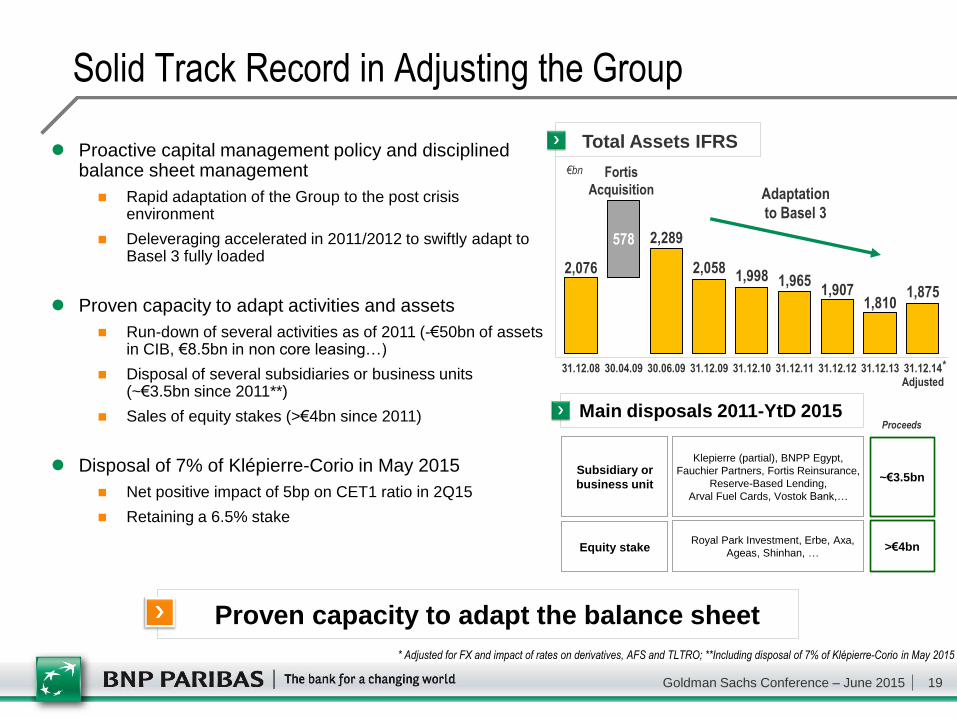
Solid Track Record in Adjusting the Group
Proven capacity to adapt the balance sheet
Proactive capital management policy and disciplined balance sheet management
Rapid adaptation of the Group to the post crisis environment
Deleveraging accelerated in 2011/2012 to swiftly adapt to Basel 3 fully loaded
Proven capacity to adapt activities and assets
Run-down of several activities as of 2011 (-€50bn of assets in CIB, €8.5bn in non core leasing…)
Disposal of several subsidiaries or business units (~€3.5bn since 2011**)
Sales of equity stakes (>€4bn since 2011)
Disposal of 7% of Klépierre-Corio in May 2015
Net positive impact of 5bp on CET1 ratio in 2Q15
Retaining a 6.5% stake
* Adjusted for FX and impact of rates on derivatives, AFS and TLTRO; **Including disposal of 7% of Klépierre-Corio in May 2015
Subsidiary or
business unit
Klepierre (partial), BNPP Egypt,
Fauchier Partners, Fortis Reinsurance,
Reserve-Based Lending,
Arval Fuel Cards, Vostok Bank,…
~€3.5bn
Equity stake Royal Park Investment, Erbe, Axa,
Ageas, Shinhan, … >€4bn
Main disposals 2011-YtD 2015
Proceeds
2,076
2,289
2,058 1,998 1,965
1,907 1,810
1,875
578
31.12.08 30.04.09 30.06.09 31.12.09 31.12.10 31.12.11 31.12.12 31.12.13 31.12.14Adjusted
Total Assets IFRS
€bn Fortis
Acquisition Adaptation
to Basel 3
*

Goldman Sachs Conference – June 2015 20
Proactive and Flexible Capital Management
Strong capital generation capacity in 2015-2016
~100bp per annum (before dividend distribution)*
Pay-out ratio of 45%
Implied dividend yield based on current share price**: 4.3% in 2015 and 4.9% in 2016
Available free cash flow: ~35bp per annum
After devoting 20bp to organic growth
Provides capital flexibility (bolt-ons, buy backs,…)
Dynamic management of the balance sheet
Strong track-record in swiftly executing disposals and adapting balance sheet if/when necessary
Dividends
~45%
Organic RWA growth
~20%
Free cash flow
~35%
Capital management as % of 2015-2016 cumulative net earnings
Capital management: considerable room to manoeuvre
Focus on delivering 45% dividend pay-out
*Based on current analysts’ consensus; **Based on current analysts’ consensus and €54.6 share price as at 8 June 2015

Goldman Sachs Conference – June 2015 21
Continued LT Growth of Book Value per Share
Book Value per Share
€
Net tangible book value
per share
Recurrent value creation through the cycle
32.0 40.8 44.1 45.1
52.4 55.0 55.7 58.8
13.7
11.1 11.5 11.7
10.7 10.1 10.9 11.4
31.12.08 31.12.09 31.12.10 31.12.11 31.12.12 31.12.13 31.12.14 31.03.15
45.7 51.9
55.6 56.8 63.1
+7.1% CAGR
66.6 70.2
65.1

Goldman Sachs Conference – June 2015 22
Conclusion
A European leader well positioned to benefit from EU economic recovery
Strong operating performance in 1Q15 Confirming ROE target ≥ 10% in 2016 (equivalent ROTE ≥12%)
Proven organic capital generation capacity
Goldman Sachs Conference – June 2015 23
Strong Operating Performance
Appendix
Progressive Recovery of the Eurozone Economy
Strong Solvency and Capital Generation Capacity
Goldman Sachs Conference – June 2015 24
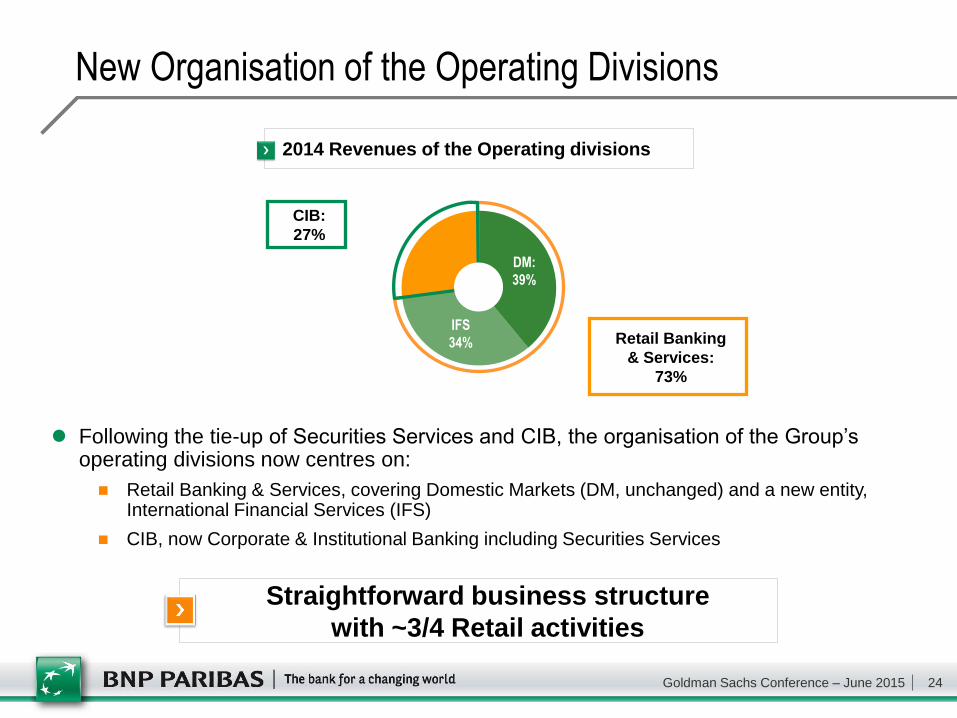
New Organisation of the Operating Divisions
Following the tie-up of Securities Services and CIB, the organisation of the Group’s operating divisions now centres on:
Retail Banking & Services, covering Domestic Markets (DM, unchanged) and a new entity, International Financial Services (IFS)
CIB, now Corporate & Institutional Banking including Securities Services
2014 Revenues of the Operating divisions
DM:
39%
IFS
34%
CIB:
27%
Retail Banking
& Services:
73%
Straightforward business structure
with ~3/4 Retail activities

Goldman Sachs Conference – June 2015 25
An Integrated Business Model based on Strong Client Franchises, Cross-selling and Risk Diversification
Individual
customers
Corporates Institutional
clients
DM
IFS
CIB
4 domestic markets (France, Italy, Belgium and Luxembourg)
~15 million individual clients and 1 million corporates and SMEs
#1 online broker and #5 digital bank in Germany
European leader in specialised equipment financing (leasing, fleet,…)
Personal Finance: #1 in consumer credit in Europe
Wealth Management: #1 in Eurozone and #5 worldwide
Investment Partners: #7 European Asset Manager
Insurance: #7 life insurer in Europe, 90 million clients worldwide
Diversified international Retail Banking networks (~15 million clients)
Fixed Income: #1 all bonds in euros, #8 all international bonds
GECD: #1 European Equity Derivatives
Corporate Banking: #1 for syndicated financing in Europe
Cash Management: #1 in Europe, #5 Global Provider
Securities Services: #1 in Europe, #5 worldwide
Cro
ss
-se
lling
R
isk
div
ers
ific
ati
on
Leveraging top ranking businesses
on strong and diversified client franchises

Goldman Sachs Conference – June 2015 26
Significant Cross-selling at the Core of the Model
IFS
clients
CIB
clients
Insurance: ~€0.7bn
CIB & other businesses: ~€0.4bn
Retail: ~€1.1bn
Securities Services & Asset management: ~€1.1bn
* Management accounting; aggregated revenues booked in client and business entities; ** 100% JV Private Banking
Main cross-selling revenues (2014)*
>€7.5bn of cross-selling revenues generated at Group level
Contribution
to revenues
~€4.3bn
~€1.1bn
~€2.2bn
DM
clients
Insurance: ~€1.3bn
Wealth Management: ~€1.5bn**
Asset Management: ~€0.7bn
CIB & Specialised businesses: ~€0.8bn

Goldman Sachs Conference – June 2015 27
One Bank for Corporates
A leading position with corporates in Europe
17 5
2 1 9
1
6 3
1
1
1
1 1
1 1
1
1
1
Domestic Networks
Corporate Banking Europe
International Retail Banking
1
28
16
16 1
# 116 Business centres
A unique network for corporate clients
One Bank for Corporates: a network of 216 business centres, o/w 116 in Europe
A presence in 75 countries
Cash management: #1(1) position strengthened in Europe
# Business centres
32
37
7
24
61 55
(1) Source: Greenwich

Goldman Sachs Conference – June 2015 28
Italy
Wealth Management
(market share)
3%
in 2008
6%
in 2014
Cash Management
(ranking)
>#10
in 2006
#1
in 2014*
Belgium
Wealth Management
(market share)
#7
in 2009
#1
in 2014
Consumer Finance
(outstandings)FY2009 FY2014
Corporate Finance
(ranking)
#10
in 2007
#1
in 2014
Broad Product Offering Allowing Market Share Gains
Cross-selling leading to improved market positions
Strong development following BNL’s acquisition in 2006 and Fortis’ in 2009
Roll out of the model in International Retail Banking
BancWest’s Wealth Management AuM: +68%** vs. 2012
TEB’s Wealth Management AuM: +72%** vs. 2012
One Bank for Corporates: success confirmed with improved market penetration in 2014
#1 European Corporate Banking and #1 Eurozone Corporate Banking***
#1 European Cash Management and #1 European Trade Finance***
Improvements also as a leader in several quality ratings
* Euromoney survey; ** Constant exchange rate; *** Greenwich Associates, Share Leaders 2014
Successful cross-selling leading to stronger market positions
54 56 58 60 64 66
2012 2013 2014 2012 2013 2014
Greenwich Share Leaders - 2014
#1 European Top-Tier
Large Corporate Banking
#1 Eurozone Large
Corporate Banking
Market penetration (%)
+4pts +6pts
x2
+84%
Goldman Sachs Conference – June 2015 29
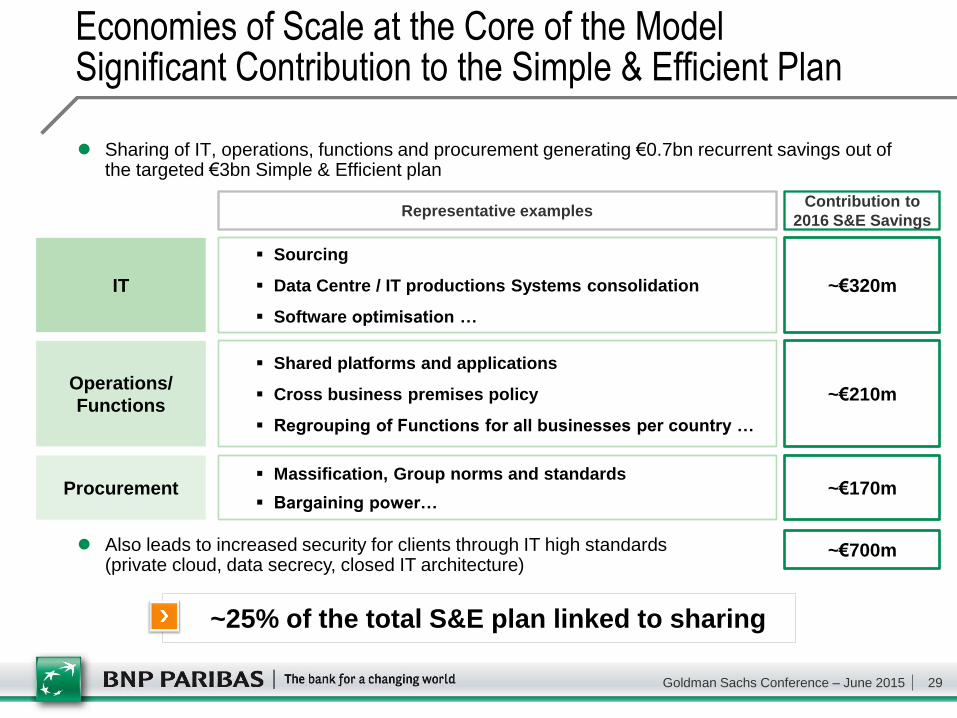
Economies of Scale at the Core of the Model Significant Contribution to the Simple & Efficient Plan
~25% of the total S&E plan linked to sharing
Operations/
Functions
Procurement
Shared platforms and applications
Cross business premises policy
Regrouping of Functions for all businesses per country …
Massification, Group norms and standards
Bargaining power…
~€320m
~€210m
~€170m
IT
Sourcing
Data Centre / IT productions Systems consolidation
Software optimisation …
Contribution to
2016 S&E Savings Representative examples
~€700m
Sharing of IT, operations, functions and procurement generating €0.7bn recurrent savings out of the targeted €3bn Simple & Efficient plan
Also leads to increased security for clients through IT high standards (private cloud, data secrecy, closed IT architecture)

Goldman Sachs Conference – June 2015 30
Revenues of the Operating Divisions - 1Q15
* Including 100% of Private Banking in France (excluding PEL/CEL effects), in Italy, Belgium, Luxembourg, at BancWest and TEB
1Q15
€m
Domestic Markets* International
Financial Services* CIB
3,932 4,022 3,099 3,729 2,705 3,346
+23.7% +2.3%
+20.3%
1Q14
Good growth in the revenues of the operating divisions
Very good performance of Corporate and Institutional Banking
1Q15 vs. 1Q14
+12.8% +1.2%
+4.4%
1Q15 vs. 1Q14 at constant scope and
exchange rates
Impact of acquisitions made in 2014 and significant foreign exchange effect

Goldman Sachs Conference – June 2015 31
Operating Expenses of the Operating Divisions - 1Q15
* Including 100% of Private Banking in France (excluding PEL/CEL effects), Italy, Belgium, Luxembourg, at BancWest and TEB; ** At constant scope and exchange rates
Effects of Simple & Efficient
Rise in regulatory costs and continued business development plans
€m
2,643 2,673 1,974 2,380 1,999 2,266
+13.4% +1.1%
+20.6%
+4.9% -0.1%
+4.3%
Impact of acquisitions made in 2014 and significant foreign exchange effect
Positive jaws effect in all the operating divisions**
1Q15
Domestic Markets* International
Financial Services* CIB
1Q14 1Q15 vs. 1Q14
1Q15 vs. 1Q14 at constant scope and
exchange rates

Goldman Sachs Conference – June 2015 32
Net provisions/Customer loans (in annualised bp)
58 59 57 68 53 47 60 61
2012 2013 2014 1Q14 2Q14 3Q14 4Q14 1Q15
Group
Cost of risk: €1,044m
+€32m vs. 4Q14
-€40m vs. 1Q14
Cost of risk stable overall
Cost of Risk by Business Unit - 1Q15 (1/3)
* Restated
CIB - Corporate Banking
36 41 12
47 20
-25
9 26
2012 2013* 2014 1Q14 2Q14 3Q14 4Q14 1Q15
Cost of risk: €74m
+€48m vs. 4Q14
-€48m vs. 1Q14
Low cost of risk

Goldman Sachs Conference – June 2015 33
Cost of Risk by Business Unit - 1Q15 (2/3)
21 23 28 30 29 24 30 25
2012 2013 2014 1Q14 2Q14 3Q14 4Q14 1Q15
FRB Cost of risk: €89m
-€17m vs. 4Q14
-€19m vs. 1Q14
Cost of risk still low
BNL bc Cost of risk: €321m
-€1m vs. 4Q14
-€43m vs. 1Q14
Moderate decrease in the cost of risk this quarter
BNL bc
116 150 179 185 185 178 167 166
2012 2013 2014 1Q14 2Q14 3Q14 4Q14 1Q15
BRB Cost of risk: €33m
+€5m vs. 4Q14
-€19m vs. 1Q14
Cost of risk still low 18 16 15 23 7 16 13 15
2012 2013 2014 1Q14 2Q14 3Q14 4Q14 1Q15
Net provisions/Customer loans (in annualised bp)
Goldman Sachs Conference – June 2015 34
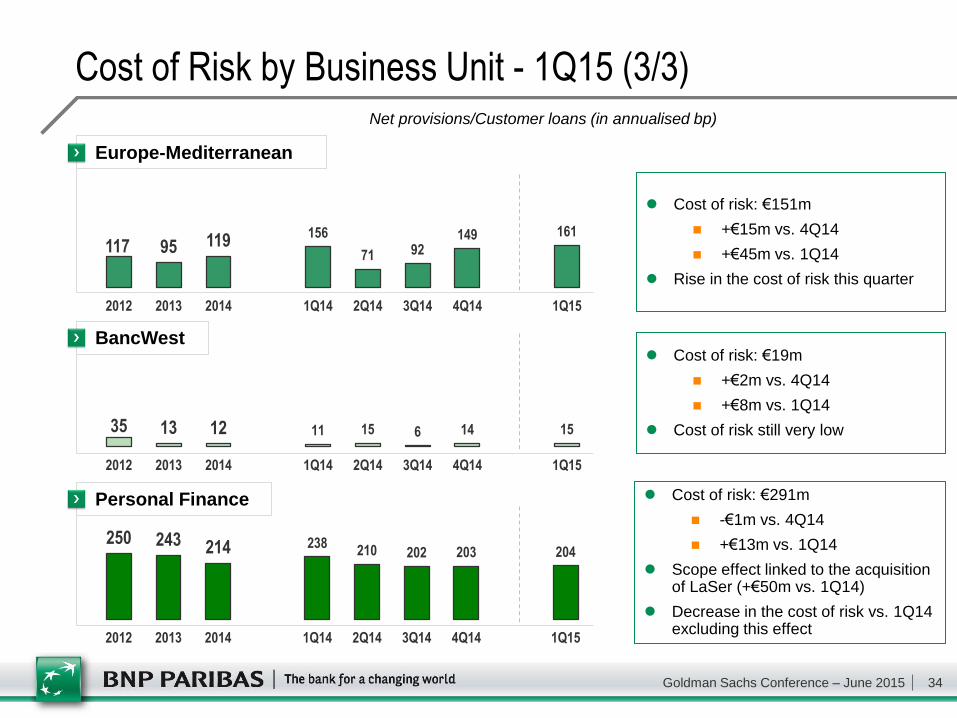
117 95 119 156
71 92 149 161
2012 2013 2014 1Q14 2Q14 3Q14 4Q14 1Q15
Cost of Risk by Business Unit - 1Q15 (3/3)
Europe-Mediterranean
Cost of risk: €151m
+€15m vs. 4Q14
+€45m vs. 1Q14
Rise in the cost of risk this quarter
35 13 12 11 15 6 14 15
2012 2013 2014 1Q14 2Q14 3Q14 4Q14 1Q15
BancWest Cost of risk: €19m
+€2m vs. 4Q14
+€8m vs. 1Q14
Cost of risk still very low
250 243 214 238 210 202 203 204
2012 2013 2014 1Q14 2Q14 3Q14 4Q14 1Q15
Cost of risk: €291m
-€1m vs. 4Q14
+€13m vs. 1Q14
Scope effect linked to the acquisition of LaSer (+€50m vs. 1Q14)
Decrease in the cost of risk vs. 1Q14 excluding this effect
Personal Finance
Net provisions/Customer loans (in annualised bp)
Goldman Sachs Conference – June 2015 35
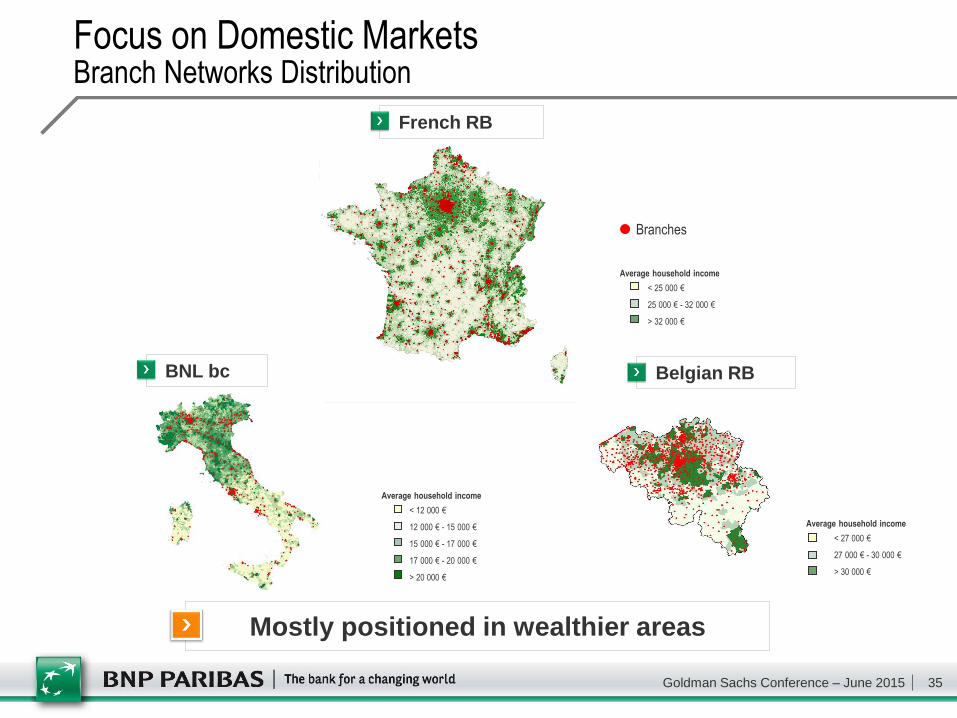
Focus on Domestic Markets Branch Networks Distribution
Mostly positioned in wealthier areas
Average household income
< 25 000 €
25 000 € - 32 000 €
> 32 000 €
Average household income
< 12 000 €
12 000 € - 15 000 €
15 000 € - 17 000 €
17 000 € - 20 000 €
> 20 000 €
French RB
BNL bc Belgian RB
Average household income
< 27 000 €
27 000 € - 30 000 €
> 30 000 €
Branches
Goldman Sachs Conference – June 2015 36
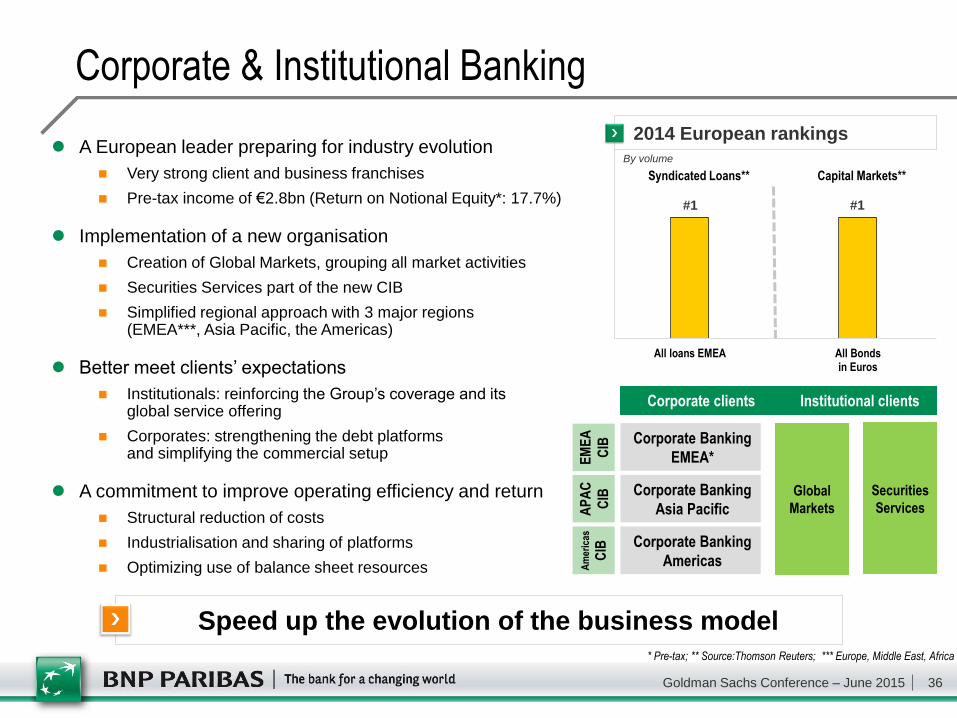
Corporate & Institutional Banking
A European leader preparing for industry evolution
Very strong client and business franchises
Pre-tax income of €2.8bn (Return on Notional Equity*: 17.7%)
Implementation of a new organisation
Creation of Global Markets, grouping all market activities
Securities Services part of the new CIB
Simplified regional approach with 3 major regions (EMEA***, Asia Pacific, the Americas)
Better meet clients’ expectations
Institutionals: reinforcing the Group’s coverage and its global service offering
Corporates: strengthening the debt platforms and simplifying the commercial setup
A commitment to improve operating efficiency and return
Structural reduction of costs
Industrialisation and sharing of platforms
Optimizing use of balance sheet resources
Corporate clients Institutional clients
Corporate Banking
EMEA*
Corporate Banking
Asia Pacific
Corporate Banking
Americas
EM
EA
CIB
AP
AC
CIB
Am
eric
as
CIB
Global
Markets
Securities
Services
* Pre-tax; ** Source:Thomson Reuters; *** Europe, Middle East, Africa
Speed up the evolution of the business model
All loans EMEA All Bondsin Euros
2014 European rankings
By volume
#1 #1
Syndicated Loans** Capital Markets**

Goldman Sachs Conference – June 2015 37
Bank BGZ Poland
ROE Accretive Bolt-on Acquisitions in 2014
• Becoming a reference bank in a growing market
Levers for additional profit generation going forward
Contribution of acquisitions to pre-tax income in 2016-2017 (vs. €0.1bn contribution in 2014*)
€bn
Revenues Operating
expenses
Cost of
risk
Restructuring
expenses
2016 Pre-tax
income
2017 Pre-tax
income
~+0.3 ~+0.6
1.6 -0.9
-0.3 -0.1
Restructuring
costs termination
+ synergies
~+0.3
* Closing dates: Bank BGZ (17 Sept. 2014); 50% of LaSer (25 July 2014); DAB Bank (17 Dec. 2014)
Bolting onto existing businesses
BNPP
Polska
50% of LaSer Europe - France
• LaSer now wholly owned: firming up PF’s position as #1
specialised player in Europe Cetelem
DAB Bank Germany
• Contributing to the development plan in Germany and to
strengthen our digital banking offer in Europe
Consors
bank