Embed Size (px)
Citation preview
CMP 561.40
Target Price 610.00
ISIN: INE191H01014
FEBRURARY 11th
2014
PVR LIMITED Result Update: Q3 FY14
BUY
Index Details
Stock Data
Sector Media & Entertainment
BSE Code 532689
Face Value 10.00
52wk. High / Low (Rs.) 657.50/229.55
Volume (2wk. Avg.) 54000
Market Cap (Rs. in mn.) 22405.47
Annual Estimated Results (A*: Actual / E*: Estimated)
YEARS FY13A FY14E FY15E
Net Sales 6715.20 9057.80 11050.52
EBITDA 1126.10 1542.47 1858.62
Net Profit 548.50 624.76 743.95
EPS 13.84 15.65 18.64
P/E 40.55 35.86 30.12
Shareholding Pattern (%)
1 Year Comparative Graph
PVR LTD S&P BSE SENSEX
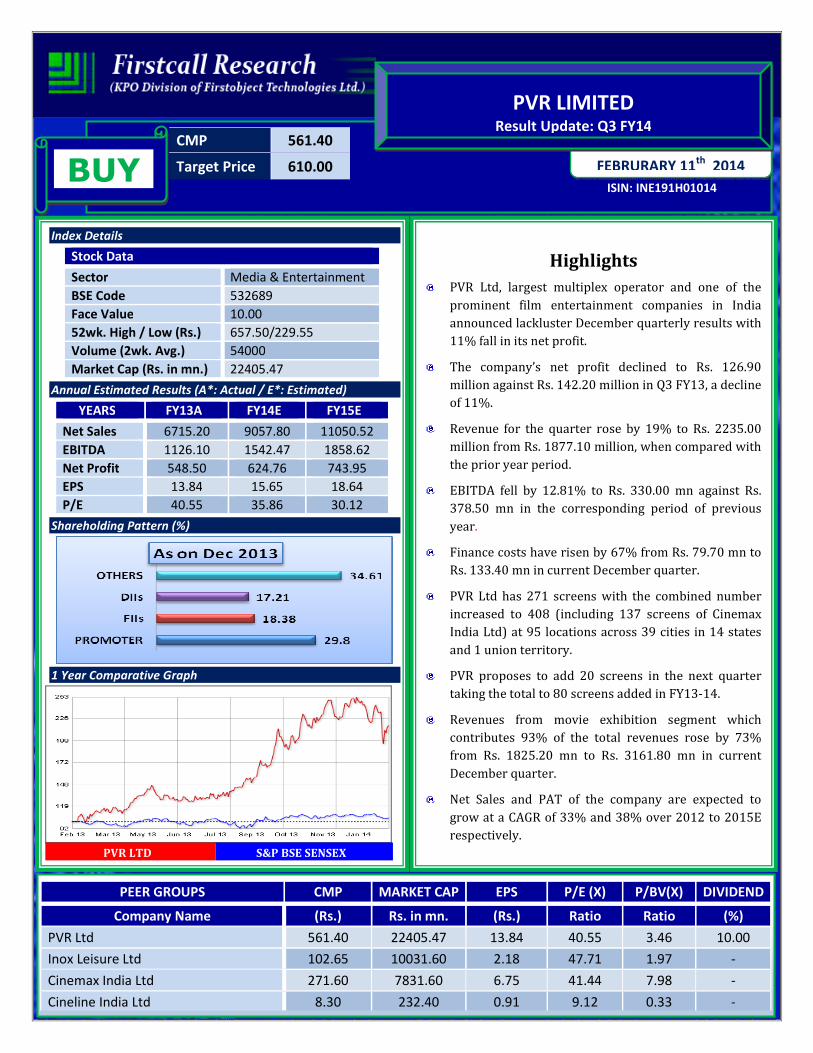
Highlights
PVR Ltd, largest multiplex operator and one of the
prominent film entertainment companies in India
announced lackluster December quarterly results with
11% fall in its net profit.
The company’s net profit declined to Rs. 126.90
million against Rs. 142.20 million in Q3 FY13, a decline
of 11%.
Revenue for the quarter rose by 19% to Rs. 2235.00
million from Rs. 1877.10 million, when compared with
the prior year period.
EBITDA fell by 12.81% to Rs. 330.00 mn against Rs.
378.50 mn in the corresponding period of previous
year.
Finance costs have risen by 67% from Rs. 79.70 mn to
Rs. 133.40 mn in current December quarter.
PVR Ltd has 271 screens with the combined number
increased to 408 (including 137 screens of Cinemax
India Ltd) at 95 locations across 39 cities in 14 states
and 1 union territory.
PVR proposes to add 20 screens in the next quarter
taking the total to 80 screens added in FY13-14.
Revenues from movie exhibition segment which
contributes 93% of the total revenues rose by 73%
from Rs. 1825.20 mn to Rs. 3161.80 mn in current
December quarter.
Net Sales and PAT of the company are expected to
grow at a CAGR of 33% and 38% over 2012 to 2015E
respectively.
PEER GROUPS CMP MARKET CAP EPS P/E (X) P/BV(X) DIVIDEND
Company Name (Rs.) Rs. in mn. (Rs.) Ratio Ratio (%)
PVR Ltd 561.40 22405.47 13.84 40.55 3.46 10.00
Inox Leisure Ltd 102.65 10031.60 2.18 47.71 1.97 -
Cinemax India Ltd 271.60 7831.60 6.75 41.44 7.98 -
Cineline India Ltd 8.30 232.40 0.91 9.12 0.33 -
Recommendation & Analysis - ‘BUY’
PVR Ltd, India’s largest multiplex operator, in the business of exhibition and production of films reported
subdued December quarterly results with 10.76% fall in its net profit. Though revenues rose by 19%, higher
expenditure and finance costs led to lower PAT at Rs. 126.90 mn compared to Rs. 142.20 mn in the
corresponding quarter of the previous year. Higher expenditure with 20% rise YOY led to 13% decline in EBDITA
at Rs. 330 mn against Rs. 378.50 mn in Q3 FY13. Finance costs increased by 67% YOY as PVR Ltd raised short
term borrowings of Rs. 200 mn as on 30th September 2013. In addition to that, long term borrowings almost
doubled, rising by 97% as on 31st March 2013 compared to corresponding period previous year. Though long
term borrowings have been reduced by 20% as on 30th September 2013 compared to the same period previous
year, debt burden is weighing on the profitability of the company. PVR Ltd has sound financials and is a dominant
player in movie exhibition business which constitutes 93% of its revenues. Movie exhibition revenues have risen
by 73% from Rs. 1825.20 mn to Rs. 3161.80 mn in the current December quarter. The company is on an
expansion spree with 60 screens already added in FY13 and more 20 new screens are expected to be added in
the next March quarter. With paring of debt and improvement in economic scenario, PVR Ltd has bright future in
the long run. Thus we recommend ‘BUY’ with the target price of Rs. 610.00 for medium to long term.
COMPANY PROFILE
PVR is the largest and the most premium film entertainment Company in India and is listed as the “Most Trusted
Brand” in the Category of Entertainment by the “Brand Trust Report, 2013”. The Company was incorporated in
April 1995 pursuant to a Joint Venture Agreement between Priya Exhibitors Private Limited and Village
Roadshow Limited, Australia. The Company pioneered the multiplex revolution in the country by establishing the
first multiplex cinema in 1997 at Saket, New Delhi. The opening of the first multiplex heralded a new era in the
Indian cinema viewing experience, which also set a role model for others to follow suit. PVR has set new
benchmarks in the cinema exhibition business including establishment of the first largest 11 screen multiplex in
the country, Gold Class Cinema, luxury cinema, IMAX theatres and ECX (Enhanced Cinema Experience).
The retail entertainment landscape, PVR entered into a JV with Major Cineplex Group in 2008, a leading Film
exhibition and retail entertainment company based out of Thailand, to bring lifestyle entertainment concepts to
Indian consumers. The Joint Venture enjoined setting up of bowling alleys, karaoke centers, ice skating rinks and
gaming zones across the country to enhance the out of home entertainment experience for Indian consumers.
In January 2013 PVR Ltd acquired 93.19% of controlling stake in Cinemax India Limited, having 135 Screens
spread across 38 locations in India, through its wholly owned subsidiary Cine Hospitality Private Limited to
become the undisputed leader in the cinema exhibition business in India. Today PVR is the dominant leader with
30-35% share of box office collections for Hollywood movies in India & 20-25% share of Bollywood movies. PVR
commands a phenomenal 70% of the advertising revenue in the cinema medium space and delivers 360 degree
exposure & innovative opportunities to brands, both on-screen and off-screen. The Company is associated with
the top 100 brands in the country. The company also operates a film distribution and production business
through PVR Pictures, a 100% subsidiary of PVR Ltd.
QUARTERLY HIGHLIGHTS (STANDALONE)
Q3 FY14
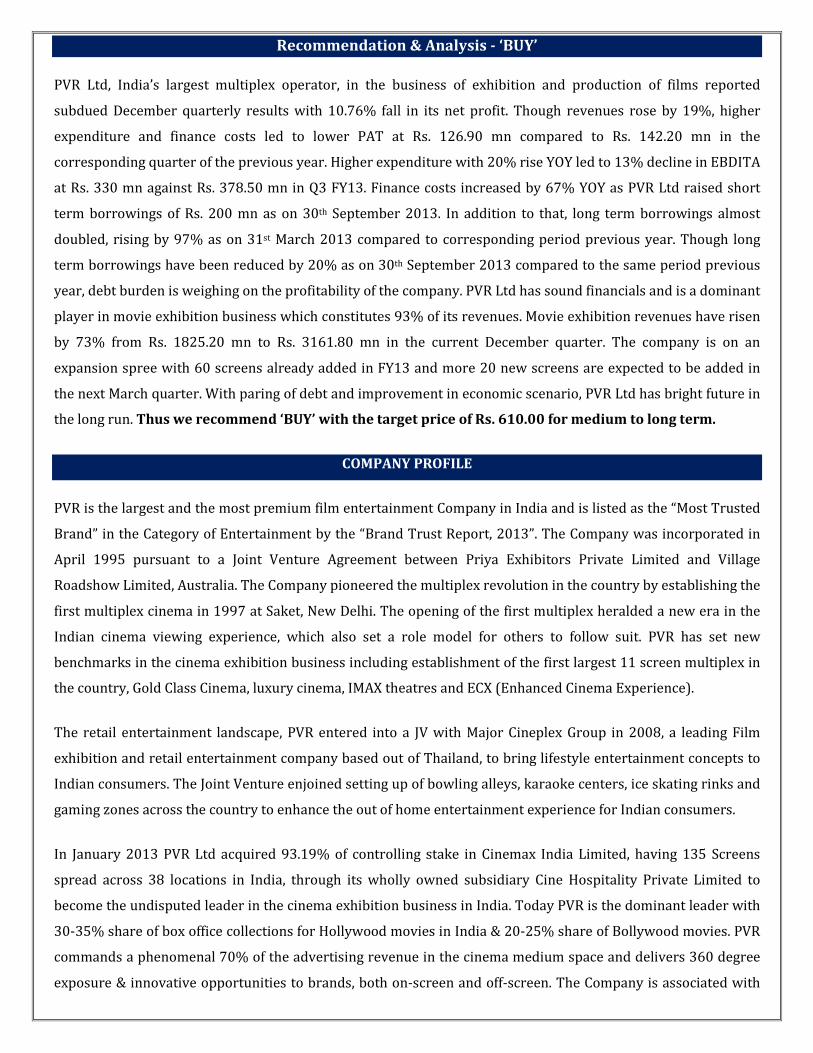
Net sales of the company rose by 19% to Rs. 2235.00
million against Rs. 1877.10 million in the
corresponding quarter of previous year. Net profit
declined by 11% from Rs. 142.20 mn to Rs. 126.90
mn in current December quarter. Profit before
interest, depreciation and tax stood at Rs. 330 mn
against Rs. 387.50 mn in the corresponding quarter
of the previous year. Other income also fell by 30%
at Rs. 7.40 mn in Q3 FY14. Net Profit and EBDITA
Margin declined by 189 and 540 basis points
respectively in Q3 FY14.
Months Dec-13 Dec-12 % Change
Net Sales 2235.00 1877.10 19.07%
Net Profit 126.90 142.20 -10.76%
Net Profit Margin 5.68% 7.57% (189 BP)
EBITDA 330.00 378.50 -12.81%
EBITDA Margin 14.76% 20.16% (540 BP)
Other Income 7.40 10.50 -29.52%
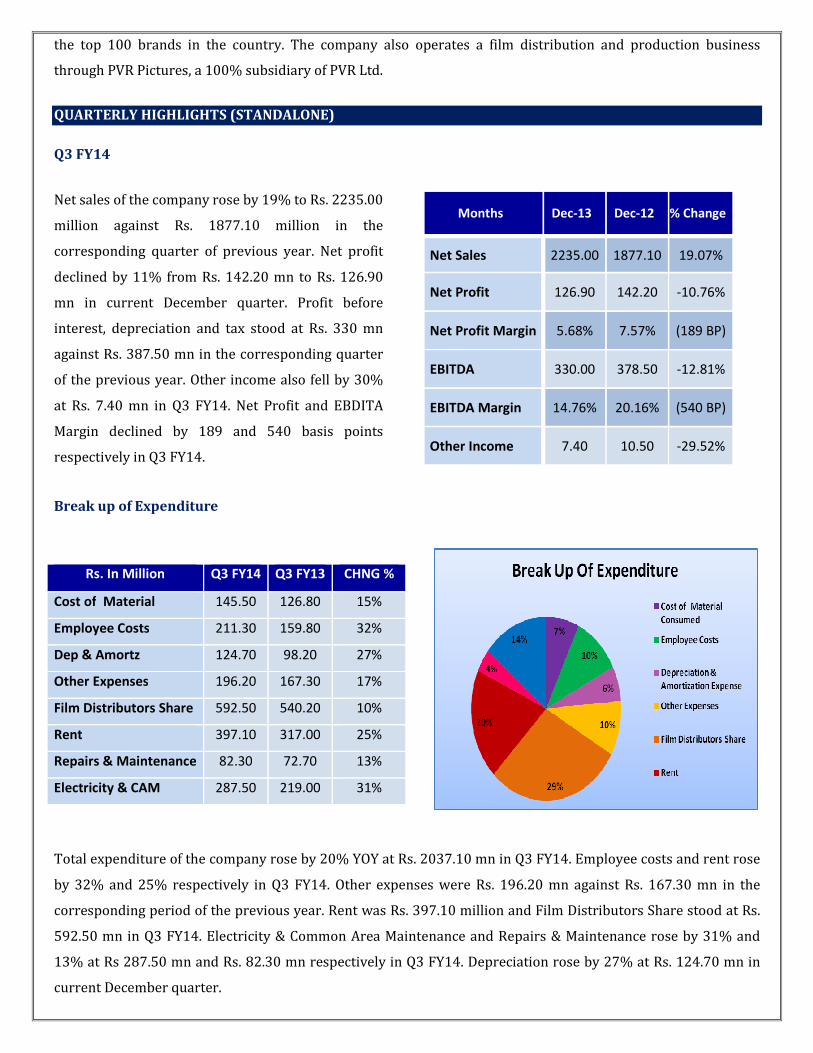
Break up of Expenditure
Total expenditure of the company rose by 20% YOY at Rs. 2037.10 mn in Q3 FY14. Employee costs and rent rose
by 32% and 25% respectively in Q3 FY14. Other expenses were Rs. 196.20 mn against Rs. 167.30 mn in the
corresponding period of the previous year. Rent was Rs. 397.10 million and Film Distributors Share stood at Rs.
592.50 mn in Q3 FY14. Electricity & Common Area Maintenance and Repairs & Maintenance rose by 31% and
13% at Rs 287.50 mn and Rs. 82.30 mn respectively in Q3 FY14. Depreciation rose by 27% at Rs. 124.70 mn in
current December quarter.
Rs. In Million Q3 FY14 Q3 FY13 CHNG %
Cost of Material 145.50 126.80 15%
Employee Costs 211.30 159.80 32%
Dep & Amortz 124.70 98.20 27%
Other Expenses 196.20 167.30 17%
Film Distributors Share 592.50 540.20 10%
Rent 397.10 317.00 25%
Repairs & Maintenance 82.30 72.70 13%
Electricity & CAM 287.50 219.00 31%
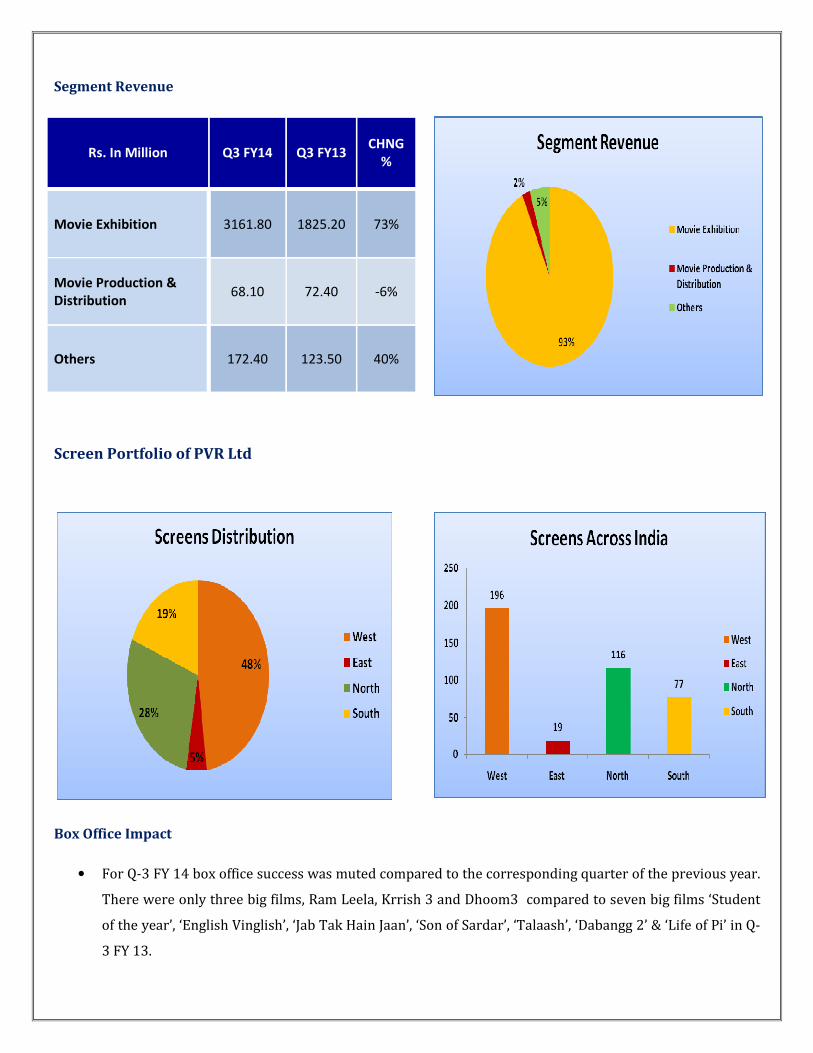
Segment Revenue
Rs. In Million Q3 FY14 Q3 FY13 CHNG
%
Movie Exhibition 3161.80 1825.20 73%
Movie Production &
Distribution 68.10 72.40 -6%
Others 172.40 123.50 40%
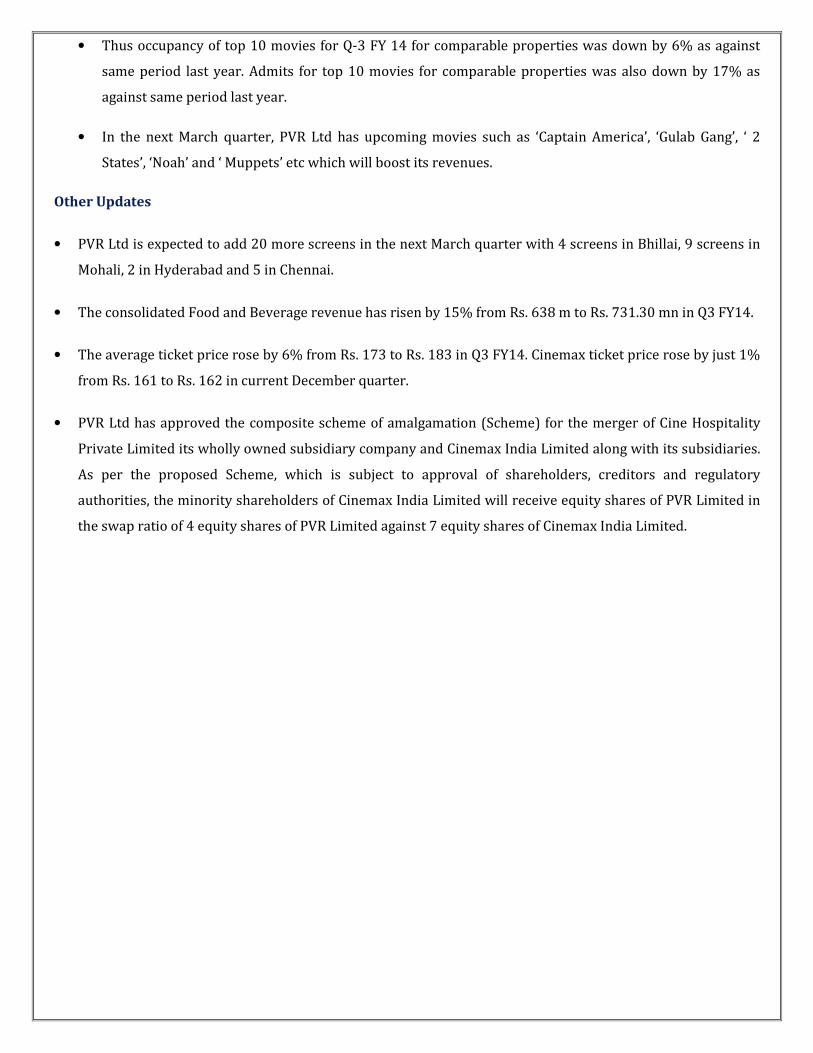
Screen Portfolio of PVR Ltd
Box Office Impact
• For Q-3 FY 14 box office success was muted compared to the corresponding quarter of the previous year.
There were only three big films, Ram Leela, Krrish 3 and Dhoom3 compared to seven big films ‘Student
of the year’, ‘English Vinglish’, ‘Jab Tak Hain Jaan’, ‘Son of Sardar’, ‘Talaash’, ‘Dabangg 2’ & ‘Life of Pi’ in Q-
3 FY 13.
• Thus occupancy of top 10 movies for Q-3 FY 14 for comparable properties was down by 6% as against
same period last year. Admits for top 10 movies for comparable properties was also down by 17% as
against same period last year.
• In the next March quarter, PVR Ltd has upcoming movies such as ‘Captain America’, ‘Gulab Gang’, ‘ 2
States’, ‘Noah’ and ‘ Muppets’ etc which will boost its revenues.
Other Updates
• PVR Ltd is expected to add 20 more screens in the next March quarter with 4 screens in Bhillai, 9 screens in
Mohali, 2 in Hyderabad and 5 in Chennai.
• The consolidated Food and Beverage revenue has risen by 15% from Rs. 638 m to Rs. 731.30 mn in Q3 FY14.
• The average ticket price rose by 6% from Rs. 173 to Rs. 183 in Q3 FY14. Cinemax ticket price rose by just 1%
from Rs. 161 to Rs. 162 in current December quarter.
• PVR Ltd has approved the composite scheme of amalgamation (Scheme) for the merger of Cine Hospitality
Private Limited its wholly owned subsidiary company and Cinemax India Limited along with its subsidiaries.
As per the proposed Scheme, which is subject to approval of shareholders, creditors and regulatory
authorities, the minority shareholders of Cinemax India Limited will receive equity shares of PVR Limited in
the swap ratio of 4 equity shares of PVR Limited against 7 equity shares of Cinemax India Limited.
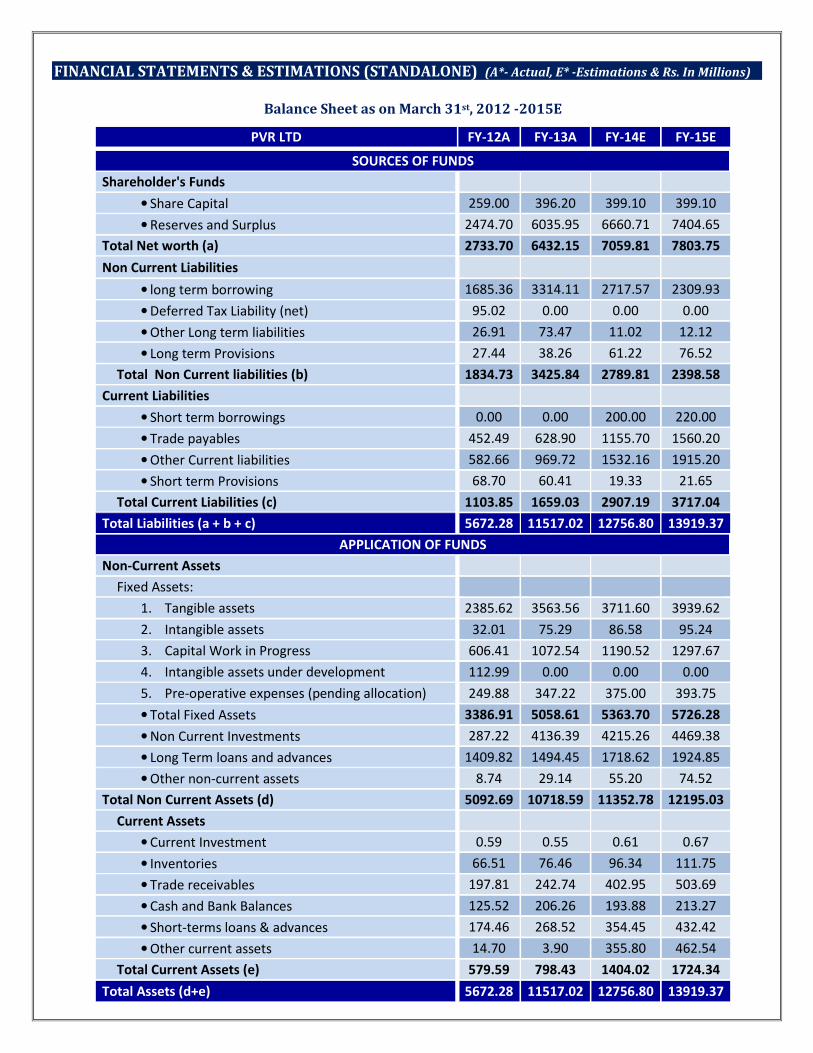
FINANCIAL STATEMENTS & ESTIMATIONS (STANDALONE) (A*- Actual, E* -Estimations & Rs. In Millions)
Balance Sheet as on March 31st, 2012 -2015E
PVR LTD FY-12A FY-13A FY-14E FY-15E
SOURCES OF FUNDS
Shareholder's Funds
• Share Capital 259.00 396.20 399.10 399.10
• Reserves and Surplus 2474.70 6035.95 6660.71 7404.65
Total Net worth (a) 2733.70 6432.15 7059.81 7803.75
Non Current Liabilities
• long term borrowing 1685.36 3314.11 2717.57 2309.93
• Deferred Tax Liability (net) 95.02 0.00 0.00 0.00
• Other Long term liabilities 26.91 73.47 11.02 12.12
• Long term Provisions 27.44 38.26 61.22 76.52
Total Non Current liabilities (b) 1834.73 3425.84 2789.81 2398.58
Current Liabilities
• Short term borrowings 0.00 0.00 200.00 220.00
• Trade payables 452.49 628.90 1155.70 1560.20
• Other Current liabilities 582.66 969.72 1532.16 1915.20
• Short term Provisions 68.70 60.41 19.33 21.65
Total Current Liabilities (c) 1103.85 1659.03 2907.19 3717.04
Total Liabilities (a + b + c) 5672.28 11517.02 12756.80 13919.37
APPLICATION OF FUNDS
Non-Current Assets
Fixed Assets:
1. Tangible assets 2385.62 3563.56 3711.60 3939.62
2. Intangible assets 32.01 75.29 86.58 95.24
3. Capital Work in Progress 606.41 1072.54 1190.52 1297.67
4. Intangible assets under development 112.99 0.00 0.00 0.00
5. Pre-operative expenses (pending allocation) 249.88 347.22 375.00 393.75
• Total Fixed Assets 3386.91 5058.61 5363.70 5726.28
• Non Current Investments 287.22 4136.39 4215.26 4469.38
• Long Term loans and advances 1409.82 1494.45 1718.62 1924.85
• Other non-current assets 8.74 29.14 55.20 74.52
Total Non Current Assets (d) 5092.69 10718.59 11352.78 12195.03
Current Assets
• Current Investment 0.59 0.55 0.61 0.67
• Inventories 66.51 76.46 96.34 111.75
• Trade receivables 197.81 242.74 402.95 503.69
• Cash and Bank Balances 125.52 206.26 193.88 213.27
• Short-terms loans & advances 174.46 268.52 354.45 432.42
• Other current assets 14.70 3.90 355.80 462.54
Total Current Assets (e) 579.59 798.43 1404.02 1724.34
Total Assets (d+e) 5672.28 11517.02 12756.80 13919.37
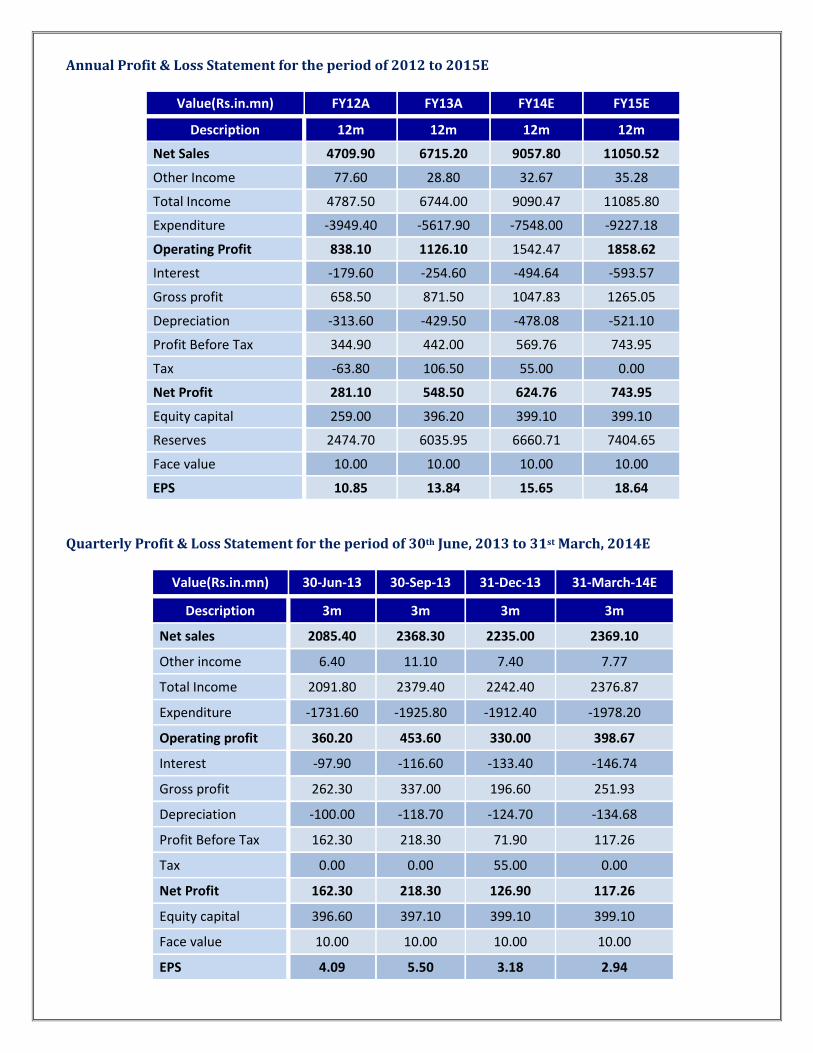
Annual Profit & Loss Statement for the period of 2012 to 2015E
Value(Rs.in.mn) FY12A FY13A FY14E FY15E
Description 12m 12m 12m 12m
Net Sales 4709.90 6715.20 9057.80 11050.52
Other Income 77.60 28.80 32.67 35.28
Total Income 4787.50 6744.00 9090.47 11085.80
Expenditure -3949.40 -5617.90 -7548.00 -9227.18
Operating Profit 838.10 1126.10 1542.47 1858.62
Interest -179.60 -254.60 -494.64 -593.57
Gross profit 658.50 871.50 1047.83 1265.05
Depreciation -313.60 -429.50 -478.08 -521.10
Profit Before Tax 344.90 442.00 569.76 743.95
Tax -63.80 106.50 55.00 0.00
Net Profit 281.10 548.50 624.76 743.95
Equity capital 259.00 396.20 399.10 399.10
Reserves 2474.70 6035.95 6660.71 7404.65
Face value 10.00 10.00 10.00 10.00
EPS 10.85 13.84 15.65 18.64
Quarterly Profit & Loss Statement for the period of 30th June, 2013 to 31st March, 2014E
Value(Rs.in.mn) 30-Jun-13 30-Sep-13 31-Dec-13 31-March-14E
Description 3m 3m 3m 3m
Net sales 2085.40 2368.30 2235.00 2369.10
Other income 6.40 11.10 7.40 7.77
Total Income 2091.80 2379.40 2242.40 2376.87
Expenditure -1731.60 -1925.80 -1912.40 -1978.20
Operating profit 360.20 453.60 330.00 398.67
Interest -97.90 -116.60 -133.40 -146.74
Gross profit 262.30 337.00 196.60 251.93
Depreciation -100.00 -118.70 -124.70 -134.68
Profit Before Tax 162.30 218.30 71.90 117.26
Tax 0.00 0.00 55.00 0.00
Net Profit 162.30 218.30 126.90 117.26
Equity capital 396.60 397.10 399.10 399.10
Face value 10.00 10.00 10.00 10.00
EPS 4.09 5.50 3.18 2.94
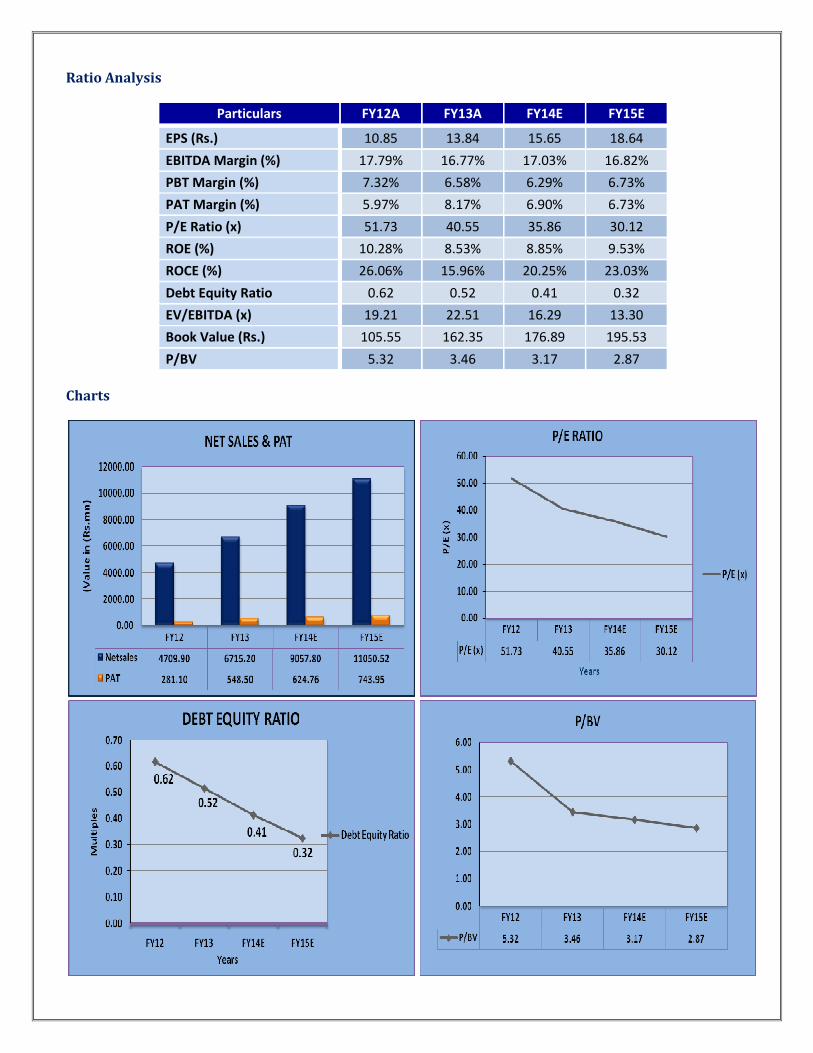
Ratio Analysis
Particulars FY12A FY13A FY14E FY15E
EPS (Rs.) 10.85 13.84 15.65 18.64
EBITDA Margin (%) 17.79% 16.77% 17.03% 16.82%
PBT Margin (%) 7.32% 6.58% 6.29% 6.73%
PAT Margin (%) 5.97% 8.17% 6.90% 6.73%
P/E Ratio (x) 51.73 40.55 35.86 30.12
ROE (%) 10.28% 8.53% 8.85% 9.53%
ROCE (%) 26.06% 15.96% 20.25% 23.03%
Debt Equity Ratio 0.62 0.52 0.41 0.32
EV/EBITDA (x) 19.21 22.51 16.29 13.30
Book Value (Rs.) 105.55 162.35 176.89 195.53
P/BV 5.32 3.46 3.17 2.87
Charts
INDUSTRY OVERVIEW
The Rs 83, 000 crore (US$ 13.23 billion)-Indian Media and Entertainment (M&E) industry is making high
growth strides. Proving its resilience when the global economy is going through tough times, the Indian M&E
sector is on the cusp of a strong phase of growth, backed by rising consumer payments and advertising
revenues across all sectors.
The industry has been largely driven by increasing digitization and higher internet usage over the last decade.
Internet has almost become a mainstream media for entertainment for most of the people. Recent statistics and
developments pertaining to the sector are discussed hereafter.
Market Dynamics
• The size of the Indian M&E sector increased from about Rs 805 billion (US$ 12.84 billion) in 2011 to
almost Rs 965 billion (US$ 15.38 billion) in 2012, showcasing a year-on-year (y-o-y) growth of 20 per
cent, according to PwC India.
• India's television market expanded by 13 per cent with revenues increasing from Rs 340 billion (US$
5.42 billion) in 2011 to Rs 383 billion (US$ 6.11 billion) in 2012.
• Filmed entertainment recorded a growth of 17 per cent; revenues increased from Rs 96 billion (US$
1.53 billion) in 2011 to Rs 112 billion (US$ 1.79 billion) in 2012.
• The print sector continued to sustain its beneficiary position. The revenues are expected to increase by
more than 9 per cent compounded annual growth rate (CAGR) to reach Rs 331 billion (US$ 5.28 billion)
in 2017 from Rs 212 billion (US$ 3.38 billion) in 2012.
• A report by CII-PwC states that the television and print sectors dominated the industry with about 40
per cent and 22 per cent contribution to industry revenues respectively in 2012. On the other hand,
Internet access and films account for about 18 per cent and 12 per cent of the industry revenues,
respectively.
Advertising, Online and Mobile Entertainment
In today’s times, the Indian entertainment segment is largely driven by digitisation and internet penetration.
More than 227 million Indians use their mobiles, computers, tablets or other devices to access internet to listen
to music, watch a film, a TV show or a cricket match.
• A recent industry report has stated that in 2012, of the Rs 27,000 crore (US$ 4.31 billion) that digital
media made, more than 80 per cent of the revenues were contributed by the entertainment products
online.
Meanwhile, video consumption in India has doubled to 3.7 billion a month over the last two years,
according to comScore. India ranks third in the world in watching videos online through a PC/laptop
and fourth in the world when it comes to watching videos on the phone, according to the statistics.
• Another study made by Mobile Marketing Association (MMA) in association with media platform,
exchange4media, states that the mobile advertisement market is estimated US$ 45 million in India. It is
expected to grow 43 per cent to Rs 430 crore (US$ 68.57 million) in 2014, driven by affordable
smartphones and tablets.
Investments
• OnMobile Global Ltd, has finally completed the transaction of acquiring the business assets of Boston-
based mobile entertainment company Livewire Mobile for US$ 17.8 million. The new integrated
company would offer VAS to cater to high value subscriber segments, including the youth and mobile-
savvy professionals.
• Meanwhile, Adlabs Entertainment Limited (AEL) has launched its online platform
‘www.adlabsimagica.com’ with the help of Infibeam. Infibeam has provided AEL with an end to end
park ticketing solution through its e-Ticketing service platform INCEPT.
INCEPT e-Ticketing service has enabled Adlabs Imagica to easily align its marketing, sales, customer
service and other back-end-processes to provide smoother transitions throughout the customer
lifecycle.
Inaugurated in April 2013, Adlabs Imagica is a Rs 1,600 crore (US$ 255.14 million)-theme park that
offers entertainment, dining, shopping and accommodation.
• Furthermore, social media agency Gozoop has recently acquired Mumbai-based Red Digital, a media
agency with clients across the entertainment and technology industries, for about Rs 7 crore (US$ 1.11
million) to strengthen its footprint in India. Gozoop expects that the deal will double its revenues along
with the headcount.
Red Digital currently looks after the digital and social media marketing for clients such as Mumbai
Indians, Mirinda and Dell. Gozoop intends to infuse about Rs 12 crore (US$ 1.91 million) to expand its
international presence in markets like the US, Australia and Qatar.
Government Initiatives
As a part of ‘Friendly Exchanges’ between the two nations, India and China have decided to mutually promote
high level media co-operation. Both the sides have agreed to include certain projects and proposals under the
Media domain to mark the commemoration of ‘Friendly Exchanges’ celebrations.
Both – India and China - have a vibrant M&E industry. Sharing experiences regarding strategies, policy
initiatives, innovation and implementation across different media platforms would prove to be healthy for both
the economies.
On the similar lines, India and Senegal have strengthened their commitment to have sustained cultural
exchanges by signing ‘Executive Programme for Cultural Cooperation’ for the period 2013-2015.
The Executive Programme for Cultural Cooperation seeks to exchange the experts in the field of theatre and
promote training in the areas of artistic heritage, creative activities, audio visual, music, dance, theatre and
puppetry. Apart from exchanging publications on cultural heritage, the agreement envisages various exchange
clauses related to canvas works, pre-historic archaeology, performing arts, sports etc.
Road Ahead
The CII-PwC report named 'India Entertainment & Media Outlook 2013' estimates that the Indian M&E
industry would exceed Rs 224,500 crore (US$ 35.8 billion) by 2017, growing at a CAGR of 18 per cent from
2012. The growth would be majorly driven by increasing penetration of digital platforms across the industry
segments.
While the print sector is expected to register a CAGR of 9 per cent and touch Rs 33,100 crore (US$ 5.28 billion)
of revenues by 2017, sectors such as internet access, internet advertising, gaming and music are expected to
continue on their high growth trajectory, said the report. The radio sector is also expected to have a face-lift
with the successful conclusion of Phase III licence auctions and is projected to grow at a robust CAGR of about
16 per cent.
The report highlighted that immense use of the internet, high penetration of smart phones; digital advertising,
wireless broadband, digital content consumption and supportive regulatory eco-system have had and will
continue to have a significant impact on the E&M sector.
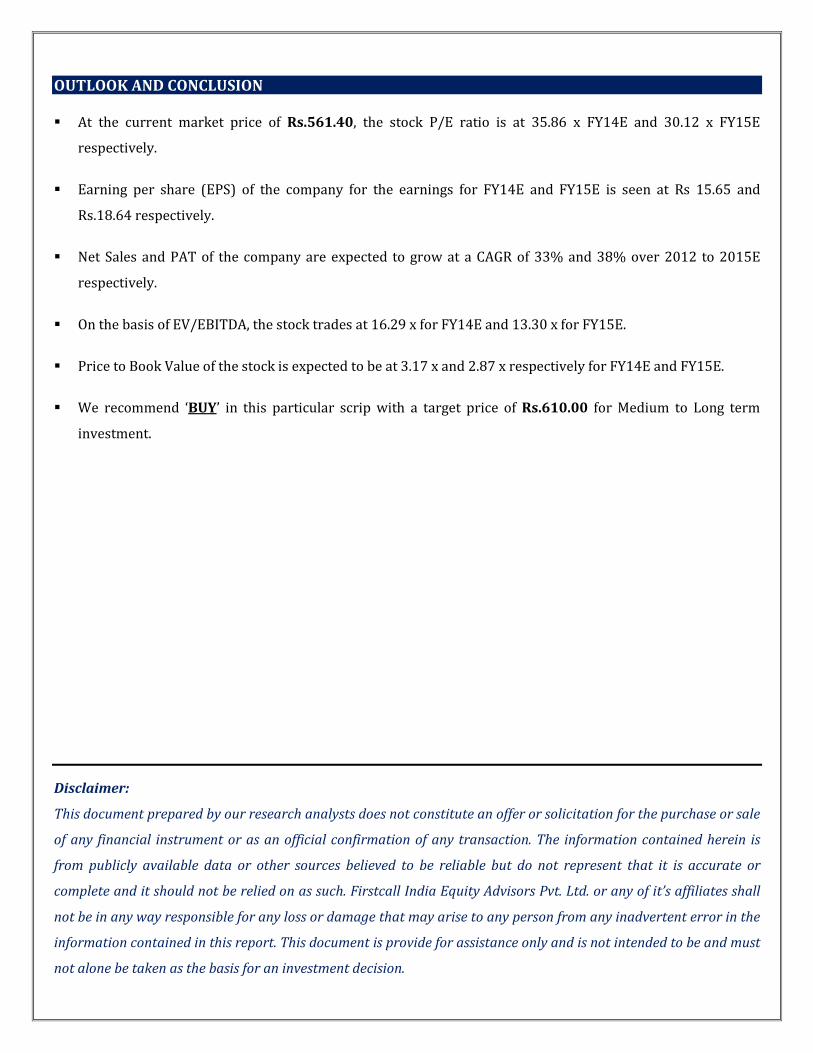
OUTLOOK AND CONCLUSION
� At the current market price of Rs.561.40, the stock P/E ratio is at 35.86 x FY14E and 30.12 x FY15E
respectively.
� Earning per share (EPS) of the company for the earnings for FY14E and FY15E is seen at Rs 15.65 and
Rs.18.64 respectively.
� Net Sales and PAT of the company are expected to grow at a CAGR of 33% and 38% over 2012 to 2015E
respectively.
� On the basis of EV/EBITDA, the stock trades at 16.29 x for FY14E and 13.30 x for FY15E.
� Price to Book Value of the stock is expected to be at 3.17 x and 2.87 x respectively for FY14E and FY15E.
� We recommend ‘BUY’ in this particular scrip with a target price of Rs.610.00 for Medium to Long term
investment.
Disclaimer:
This document prepared by our research analysts does not constitute an offer or solicitation for the purchase or sale
of any financial instrument or as an official confirmation of any transaction. The information contained herein is
from publicly available data or other sources believed to be reliable but do not represent that it is accurate or
complete and it should not be relied on as such. Firstcall India Equity Advisors Pvt. Ltd. or any of it’s affiliates shall
not be in any way responsible for any loss or damage that may arise to any person from any inadvertent error in the
information contained in this report. This document is provide for assistance only and is not intended to be and must
not alone be taken as the basis for an investment decision.
Firstcall India Equity Research: Email – [email protected]
C.V.S.L.Kameswari Pharma
U. Janaki Rao Capital Goods
B. Anil Kumar Auto, IT & FMCG
Suhani Adilabadkar Pharma & Banking
M. Vinayak Rao Diversified
Firstcall India also provides
Firstcall India Equity Advisors Pvt.Ltd focuses on, IPO’s, QIP’s, F.P.O’s,Takeover
Offers, Offer for Sale and Buy Back Offerings.
Corporate Finance Offerings include Foreign Currency Loan Syndications,
Placement of Equity / Debt with multilateral organizations, Short Term Funds
Management Debt & Equity, Working Capital Limits, Equity & Debt
Syndications and Structured Deals.
Corporate Advisory Offerings include Mergers & Acquisitions(domestic and
cross-border), divestitures, spin-offs, valuation of business, corporate
restructuring-Capital and Debt, Turnkey Corporate Revival – Planning &
Execution, Project Financing, Venture capital, Private Equity and Financial
Joint Ventures
Firstcall India also provides Financial Advisory services with respect to raising
of capital through FCCBs, GDRs, ADRs and listing of the same on International
Stock Exchanges namely AIMs, Luxembourg, Singapore Stock Exchanges and
other international stock exchanges.
For Further Details Contact:
3rd Floor,Sankalp,The Bureau,Dr.R.C.Marg,Chembur,Mumbai 400 071
Tel. : 022-2527 2510/2527 6077/25276089 Telefax : 022-25276089
E-mail: [email protected]
www.firstcallindiaequity.com