Embed Size (px)
Citation preview
Restructuring speech representations using a pitch-adaptivetime±frequency smoothing and an instantaneous-frequency-based F0 extraction: Possible role of a repetitive structure in
sounds 1
Hideki Kawahara *,2, Ikuyo Masuda-Katsuse 3, Alain de Cheveign�e 4
ATR Human Information Processing Research Laboratories, 2-2 Hikaridai, Seika-cho, Soraku-gun, Kyoto 619-02, Japan
Received 12 February 1998; received in revised form 24 September 1998
Abstract
A set of simple new procedures has been developed to enable the real-time manipulation of speech parameters. The
proposed method uses pitch-adaptive spectral analysis combined with a surface reconstruction method in the time±
frequency region. The method also consists of a fundamental frequency (F0) extraction using instantaneous frequency
calculation based on a new concept called `fundamentalness'. The proposed procedures preserve the details of time±
frequency surfaces while almost perfectly removing ®ne structures due to signal periodicity. This close-to-perfect
elimination of interferences and smooth F0 trajectory allow for over 600% manipulation of such speech parameters as
pitch, vocal tract length, and speaking rate, while maintaining high reproductive quality. Ó 1999 Elsevier Science B.V.
All rights reserved.
Keywords: Speech analysis; Pitch-synchronous; Spline smoothing; Instantaneous frequency; F0 extraction; Speech synthesis; Speech
modi®cation
1. Introduction
The need for ¯exible speech modi®cationmethods is increasing in both commercial andscienti®c ®elds. Various sophisticated methodshave been proposed (McAulay and Quatieri, 1986;Stylianou et al., 1995; Narendranath et al., 1995;Veldhuis and He, 1996) but their ¯exibility andresultant speech quality have been limited. Thissuggests that an appropriate representation ofspeech has yet to be found, or it may simply in-dicate that we have not fully explored the potentialof existing representations. If we revisit old con-cepts with `Auditory Scene Analysis' (Bregman,
Speech Communication 27 (1999) 187±207
* Corresponding author. E-mail: [email protected]
u.ac.jp1 Speech ®les available. See http://www.elsevier.nl/locate/
specom2 Present address: Department of Design Information Science,
Faculty of Systems Engineering, Wakayama University, 930
Sakaedani, Wakayama, Wakayama 640-8510, Japan. Also a
project head under CREST.3 Present address: Institute of System and Information
Technologies/KYUSHU, 2-1-22-7F, Momochihama, Sawara-
ku, Fukuoka 814-0001, Japan.4 Present address: Laboratoire de Linguistique Formelle,
CNRS/Universit�e Paris 7, case 7003, 2 place Jussieu, 75251
Paris CEDEX 05, France.
0167-6393/99/$ ± see front matter Ó 1999 Elsevier Science B.V. All rights reserved.
PII: S 0 1 6 7 - 6 3 9 3 ( 9 8 ) 0 0 0 8 5 - 5
1990) in mind, perhaps we can develop this po-tential. Indeed, special emphasis on ecologicalpoint of views found in the book, promoted ourinvestigations toward seeking robust procedures toextract stable structures for periodic sounds whichare vitally important. Speech sound for human issuch an example. It is our belief when underlyingprinciple of procedures are conceptually simpleand shows robustness under ecologically validconditions, it is very likely that human AuditoryScene Analysis functions already take advantageof the principle at least at the computational levelin Marr's terminology (Marr, 1982).
The channel VOCODER (Dudley, 1939) whichseparates spectral and source information to ma-nipulate and transmit speech sounds, is a goodexample of a simple and appealing idea madepowerful by introducing such views. The channelVOCODER and its modern variant, Linear Pre-dictive Coding (LPC) (Itakura and Saito, 1970;Atal and Hanauer, 1971) are potentially very¯exible in parameter manipulations, because thereare few inter-related constraints between spectraland source parameters. VOCODER-based repre-sentations are also attractive, because they areconceptually easy to understand and have directcorrespondence to the speech production mecha-nism and the auditory periphery. However, the re-synthesized speech quality of VOCODERs su�ersfrom buzziness induced by pulsive excitation evenwithout parameter manipulations. This quality isalso degraded when parameter manipulations arelarge. On the other hand, sophisticated methodsbased on iterative procedures that approximatedesired manipulated short term Fourier transfor-mations (STFTs) (Veldhuis and He, 1996) havesuperior reproduction quality with a small amountof manipulations. However, they deteriorate rap-idly when parameter manipulations increase. In-tricate relations between the manipulated spectralparameters and waveforms also make it di�cult toget insight from these representations. Simpleconcepts like the channel VOCODER may seemoutdated, but if the VOCODER allows for a highquality reproduction, the simpler the better.
There have been many e�ective proposals(Abrantes et al., 1991; Stylianou et al., 1995;Caspers and Atal, 1987; Gri�n and Lim, 1988) for
reducing the buzziness of VOCODER-type meth-ods by manipulating synthetic source signals. Wealso proposed a unique method for this problembased on a group delay manipulation of all-pass®lters in our previous reports (Kawahara, 1997;Abe et al., 1996). The method is already built intoour speech modi®cation system. This topic leads toan interesting discussion on temporal aspects ofhuman auditory perception. The detailed discus-sions will be given in the other paper, because itmakes this paper too complicated.
Then, the major remaining problem is elimi-nating errors in spectral estimation. It is necessaryto remove any periodicity interferences from thetime±frequency representation for the representa-tion to be usable in reproducing a spoken sound ina di�erent fundamental frequency (F0) or in adi�erent vocal tract length. Parametric models likeLPC are also susceptible to signal periodicity (El-Jaroudi and Makhoul, 1991) even though they canalleviate constraints posed by the uncertaintyprinciple. These interferences are observed as anapparent increase in random variations in spectralrepresentations. In a sense, it is contradictory andfrustrating that periodicity induces such di�cultyin speech analysis and manipulation becausevoiced sounds are perceived to be smoother andricher than unvoiced sounds, at least for humanlisteners. Speech representations must take ad-vantage of the periodic nature of voiced soundsinstead of treating it as a problem. In other words,we need a stable spectral representation that doesnot have any trace of periodicity.
A ¯exible speech manipulation also introducesa requirement for F0 trajectories. Conventional F0extraction methods based on interval measure-ments usually provide stepwise trajectories, espe-cially for low-pitched voices. This stepwisestructure is a trace of the source periodicity and isharmful to F0 modi®cations. Therefore, it is de-sirable to have a F0 extraction method that pro-vides a smooth trajectory.
The goal of this paper is to introduce the im-plementation of a very high quality speech analy-sis-modi®cation-synthesis method as a channelVOCODER based on the aforementioned condi-tions. Information reduction is not intended in thispaper since our primary interests are quality and
188 H. Kawahara et al. / Speech Communication 27 (1999) 187±207
¯exibility of manipulations. The paper consists offour sections. First, a pitch-adaptive spectralsmoothing to eliminate periodicity interference isdiscussed. Then, an instantaneous-frequency-based F0 extraction method is introduced to pro-vide reliable and smooth F0 trajectories. Next, asystem utilizing the proposed representations tomanipulate speech parameters is introduced. Fi-nally, we present examples of real speech analysisand manipulations.
2. Elimination of periodicity interference
In this section, a method for eliminating thespectral interference structure caused by signalperiodicity is systematically introduced. First, thebasic principle of the proposed method is intro-duced as an adaptive smoothing of a time±fre-quency representation. Then, a compensatory timewindow design is shown that reduces this time±frequency smoothing problem to a smoothingproblem in a frequency domain. Finally, a proce-dure that eliminates and compensate for the majorimplementational problem of this formulation,over-smoothing, is introduced.
2.1. Background
When the length of a time window for spectralanalysis is comparable to the fundamental periodof the signal repetition, the resultant power spec-trum shows periodic variation in the time domain.When the length of a time window spans severalrepetitions, the resultant power spectrum showsperiodic variation in the frequency domain. If thesignal is purely periodic and the period is an in-teger multiple of the sampling period, a pitch-synchronous analysis can perfectly eliminatetemporal variations by using a rectangular win-dow, whose length is an integer multiple of thefundamental period in samples. If the size of therectangular window is set equal to the fundamen-tal period, variations in the time domain and thefrequency domain can be eliminated.
However, this approach is not practical foranalyzing natural speech signals, because the fun-damental frequencies of such signals change all the
time, and each repetition is not the same as theprevious period due to natural source related¯uctuations. The sharp discontinuities at bothends of the rectangular window makes the analysishighly sensitive to such minor ¯uctuations. Spec-tral smearing, which is caused by this discontinuityand ¯uctuations, is detectable due to the widespectral dynamic range of natural speech signals.It is also not practical to extract a portion repre-senting an impulse response, because responsescorresponding to formant peaks do not die outwithin a pitch period, unless the pitch is extremelylow.
The other approach to eliminate periodicity-related interferences introduces a spectrum modelthat embodies periodicity e�ects. This approachwas proposed for LPC parameter estimation (El-Jaroudi and Makhoul, 1991). The results that usedsynthetic speech signals indicated that interfer-ences due to the signal periodicity are well com-pensated. However, this approach does notprovide reliable estimates for natural speech, be-cause this method assumes that the auto-correla-tion function of the periodic source is a regularpulse train. This assumption does not hold fornatural speech when the spectrum model onlyrepresents the auto-regressive components of nat-ural speech. In general, the moving average com-ponents of a natural speech spectral envelope,which are not modeled in auto-regressive part,result in an unpredictable smearing of the auto-correlation function. In addition, the smearingintroduces a signi®cant bias in the periodicitycompensation process. In other words, this model-based approach is fragile for natural speech sig-nals.
These factors suggest that the elimination pro-cess of periodicity interferences should neither relyon strong spectrum models nor perfect periodicity.The desired method has to be robust for natural¯uctuations and F0 estimation errors.
2.2. Pitch-adaptive smoothing
The central idea of the proposed method con-siders the periodic excitation of voiced speech tobe a sampling operation of a surface S�x; t� in athree-dimensional space de®ned by the axes of
H. Kawahara et al. / Speech Communication 27 (1999) 187±207 189
time, frequency, and amplitude; these axes repre-sent the global source characteristics and theshapes and movements of articulation organs. Inthis interpretation, a periodic signal s�t� with afundamental period s0, is thought to provide in-formation about the surface for every s0 in thetime domain and every f0 � 1=s0 in the frequencydomain. In other words, voiced sounds are as-sumed to provide partial information about thesurface. The goal of spectral analysis that enables¯exible manipulation is to recover the surfaceS�x; t� using this partial information.
However, speech is neither purely periodic norstable. Furthermore, the estimation process of thefundamental frequency inevitably introduces esti-mation errors. The desired algorithm has to takethese factors into account. A more dependablerepresentation of this non-stationary repetitiveaspect of speech waveforms is as follows:
s�t� �Xk2N
ak�t� sin
Zt
t0
k�x�s�
0B@ � xk�s�� ds� /k
1CA;�1�
where ak�t� represents the time varying amplitudeof kth harmonic component, x�s� represents acommon time varying fundamental angular fre-quency, xk�s� represents a time varying ¯uctuationangular frequency of kth component and /k rep-resents the initial phase at time t0. This equationimplies that a speech waveform is a nearly har-monic sum of FM (frequency modulation: repre-sented by x�s� and xk�s�) sinusoids modulated byAM (amplitude modulation: represented by ak�t�)parameters. We assume that ak�t� represents asampled point of the surface S�x; t�. This equationalso suggests that a fundamental frequency derivedfrom a di�erent frequency range may have aslightly di�erent value. The form of this equationis very close to that of a sinusoidal representation(McAulay and Quatieri, 1986; Boashash, 1992a)but the procedure in using this formulation di�erssubstantially.
A short-term Fourier analysis of this signalyields a time±frequency representation of the sig-nal F �x; t�, known as a spectrogram (Cohen,1989). The spectrogram exhibits an almost regular
structure from the signal periodicity in both thetime and frequency domains. This representationis a result of smearing due to the time±frequencyrepresentation of the time windowing function.The uncertainty principle introduces a trade-o�relation between frequency resolution and tempo-ral resolution of the windowing function. There-fore, it is desirable to use a time windowingfunction, w�t�, which has equivalent relative reso-lution in both the time and frequency domains totake full advantage of the available partial infor-mation.
Let us assume that the time window functionw�t� has the following form:
w�t� � 1
s0
eÿp�t=s0�2 ; �2�
W �x� � s0������2pp eÿp�x=x0�2 ; �3�
where W �x� represents the Fourier transform ofw�t�, and x0 � 2pf0. Since the fundamental period(s0�t� � 2p=x0�t�) varies with time, the analysiswindow size also adaptively follows this change.
Our goal is to reconstruct a smooth time±fre-quency representation, S�x; t�, which has no traceof interference caused by the periodicity of thesignal based on the partial information given bythe adaptive window analysis. This is consideredto be a surface reconstruction problem based onpartial information. Thus, it is necessary to pro-vide constraints for the problem so that a uniquesolution can be obtained. One reasonable con-straint is to use only local information.
Let us consider a one-dimensional operation.The simplest reconstruction, which uses discretizedpartial information like amplitudes of harmoniccomponents of voiced sounds, connects harmonicpeaks with straight lines. In other words, it rep-resents the reconstructed surface as a piecewise®rst order polynomial. However, algorithms basedonly on knot points are numerically fragile for realspeech signals, because real speech signals are notprecisely periodic and consist of natural ¯uctua-tions and noises. They are also sensitive to smallerrors in fundamental frequency estimation. In-stead, we propose using a smoothing function thatprovides an equivalent piecewise linear represen-
190 H. Kawahara et al. / Speech Communication 27 (1999) 187±207
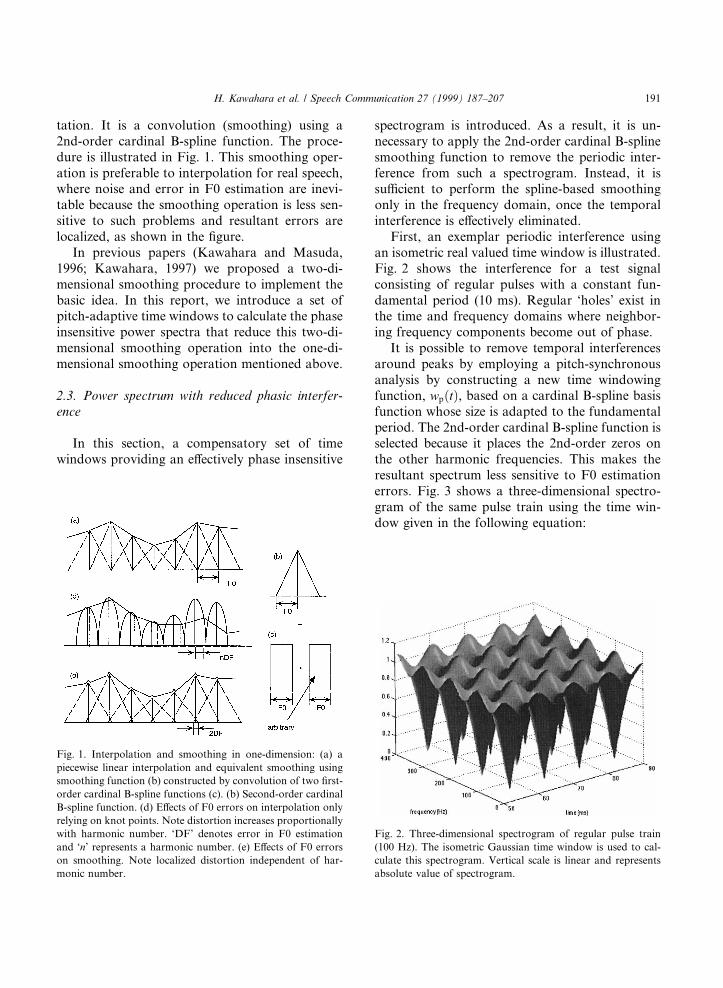
tation. It is a convolution (smoothing) using a2nd-order cardinal B-spline function. The proce-dure is illustrated in Fig. 1. This smoothing oper-ation is preferable to interpolation for real speech,where noise and error in F0 estimation are inevi-table because the smoothing operation is less sen-sitive to such problems and resultant errors arelocalized, as shown in the ®gure.
In previous papers (Kawahara and Masuda,1996; Kawahara, 1997) we proposed a two-di-mensional smoothing procedure to implement thebasic idea. In this report, we introduce a set ofpitch-adaptive time windows to calculate the phaseinsensitive power spectra that reduce this two-di-mensional smoothing operation into the one-di-mensional smoothing operation mentioned above.
2.3. Power spectrum with reduced phasic interfer-ence
In this section, a compensatory set of timewindows providing an e�ectively phase insensitive
spectrogram is introduced. As a result, it is un-necessary to apply the 2nd-order cardinal B-splinesmoothing function to remove the periodic inter-ference from such a spectrogram. Instead, it issu�cient to perform the spline-based smoothingonly in the frequency domain, once the temporalinterference is e�ectively eliminated.
First, an exemplar periodic interference usingan isometric real valued time window is illustrated.Fig. 2 shows the interference for a test signalconsisting of regular pulses with a constant fun-damental period (10 ms). Regular `holes' exist inthe time and frequency domains where neighbor-ing frequency components become out of phase.
It is possible to remove temporal interferencesaround peaks by employing a pitch-synchronousanalysis by constructing a new time windowingfunction, wp�t�, based on a cardinal B-spline basisfunction whose size is adapted to the fundamentalperiod. The 2nd-order cardinal B-spline function isselected because it places the 2nd-order zeros onthe other harmonic frequencies. This makes theresultant spectrum less sensitive to F0 estimationerrors. Fig. 3 shows a three-dimensional spectro-gram of the same pulse train using the time win-dow given in the following equation:
Fig. 1. Interpolation and smoothing in one-dimension: (a) a
piecewise linear interpolation and equivalent smoothing using
smoothing function (b) constructed by convolution of two ®rst-
order cardinal B-spline functions (c). (b) Second-order cardinal
B-spline function. (d) E�ects of F0 errors on interpolation only
relying on knot points. Note distortion increases proportionally
with harmonic number. `DF' denotes error in F0 estimation
and `n' represents a harmonic number. (e) E�ects of F0 errors
on smoothing. Note localized distortion independent of har-
monic number.
Fig. 2. Three-dimensional spectrogram of regular pulse train
(100 Hz). The isometric Gaussian time window is used to cal-
culate this spectrogram. Vertical scale is linear and represents
absolute value of spectrogram.
H. Kawahara et al. / Speech Communication 27 (1999) 187±207 191
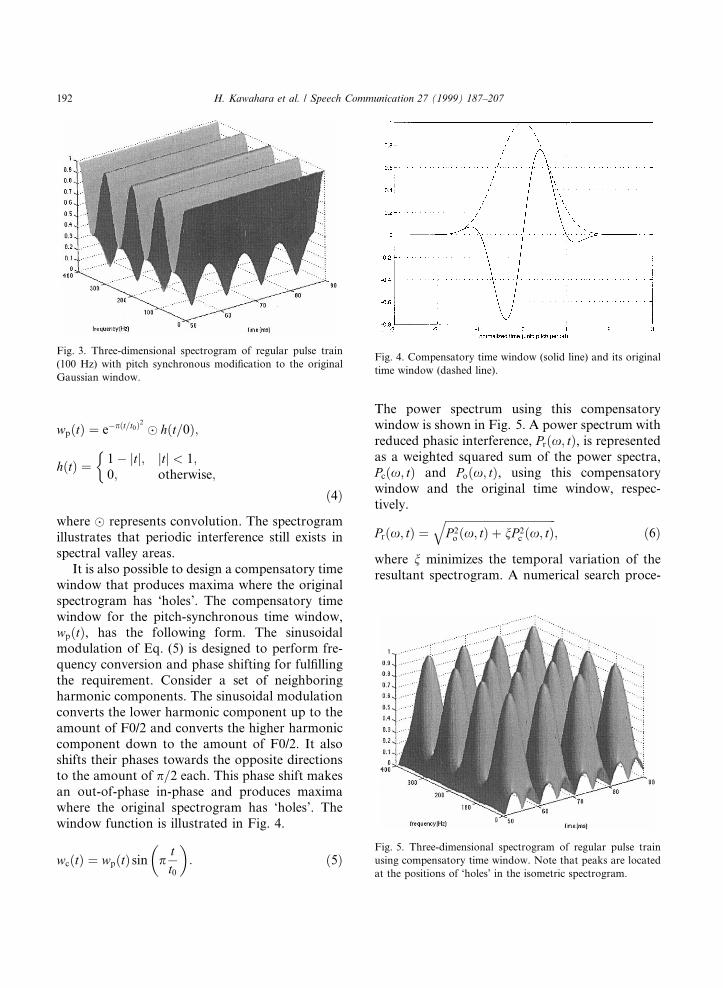
wp�t� � eÿp�t=t0�2 � h�t=0�;
h�t� � 1ÿ jtj; jtj < 1;0; otherwise;
��4�
where � represents convolution. The spectrogramillustrates that periodic interference still exists inspectral valley areas.
It is also possible to design a compensatory timewindow that produces maxima where the originalspectrogram has `holes'. The compensatory timewindow for the pitch-synchronous time window,wp�t�, has the following form. The sinusoidalmodulation of Eq. (5) is designed to perform fre-quency conversion and phase shifting for ful®llingthe requirement. Consider a set of neighboringharmonic components. The sinusoidal modulationconverts the lower harmonic component up to theamount of F0/2 and converts the higher harmoniccomponent down to the amount of F0/2. It alsoshifts their phases towards the opposite directionsto the amount of p=2 each. This phase shift makesan out-of-phase in-phase and produces maximawhere the original spectrogram has `holes'. Thewindow function is illustrated in Fig. 4.
wc�t� � wp�t� sin ptt0
� �: �5�
The power spectrum using this compensatorywindow is shown in Fig. 5. A power spectrum withreduced phasic interference, Pr�x; t�, is representedas a weighted squared sum of the power spectra,Pc�x; t� and Po�x; t�, using this compensatorywindow and the original time window, respec-tively.
Pr�x; t� �����������������������������������������P 2
o �x; t� � nP 2c �x; t�
q; �6�
where n minimizes the temporal variation of theresultant spectrogram. A numerical search proce-
Fig. 4. Compensatory time window (solid line) and its original
time window (dashed line).
Fig. 5. Three-dimensional spectrogram of regular pulse train
using compensatory time window. Note that peaks are located
at the positions of `holes' in the isometric spectrogram.
Fig. 3. Three-dimensional spectrogram of regular pulse train
(100 Hz) with pitch synchronous modi®cation to the original
Gaussian window.
192 H. Kawahara et al. / Speech Communication 27 (1999) 187±207
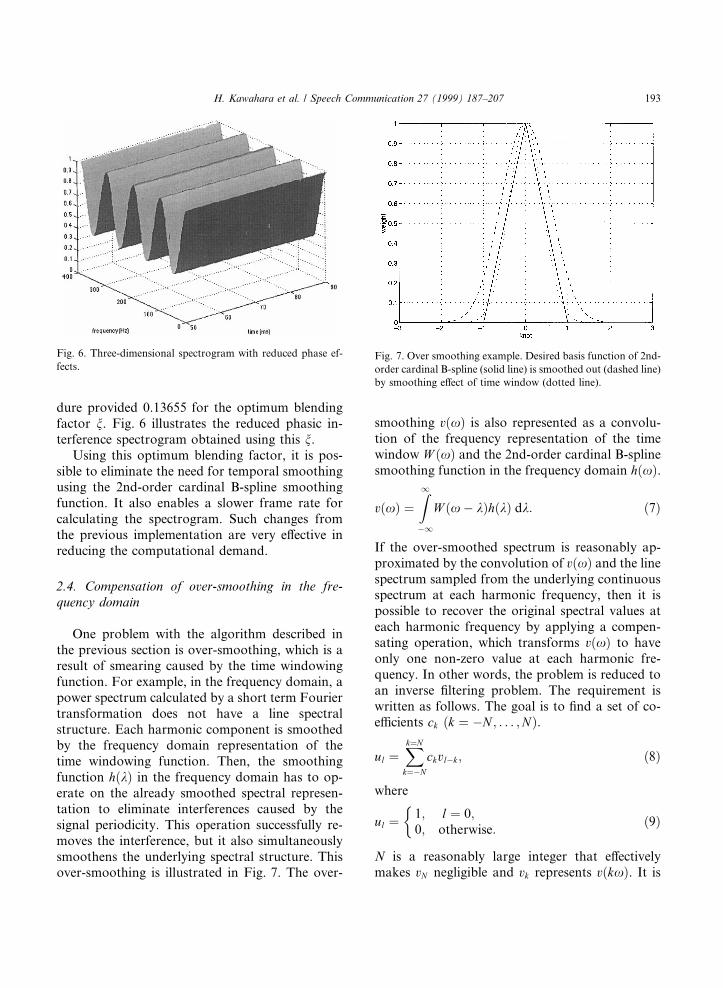
dure provided 0.13655 for the optimum blendingfactor n. Fig. 6 illustrates the reduced phasic in-terference spectrogram obtained using this n.
Using this optimum blending factor, it is pos-sible to eliminate the need for temporal smoothingusing the 2nd-order cardinal B-spline smoothingfunction. It also enables a slower frame rate forcalculating the spectrogram. Such changes fromthe previous implementation are very e�ective inreducing the computational demand.
2.4. Compensation of over-smoothing in the fre-quency domain
One problem with the algorithm described inthe previous section is over-smoothing, which is aresult of smearing caused by the time windowingfunction. For example, in the frequency domain, apower spectrum calculated by a short term Fouriertransformation does not have a line spectralstructure. Each harmonic component is smoothedby the frequency domain representation of thetime windowing function. Then, the smoothingfunction h�k� in the frequency domain has to op-erate on the already smoothed spectral represen-tation to eliminate interferences caused by thesignal periodicity. This operation successfully re-moves the interference, but it also simultaneouslysmoothens the underlying spectral structure. Thisover-smoothing is illustrated in Fig. 7. The over-
smoothing v�x� is also represented as a convolu-tion of the frequency representation of the timewindow W �x� and the 2nd-order cardinal B-splinesmoothing function in the frequency domain h�x�.
v�x� �Z1ÿ1
W �xÿ k�h�k� dk: �7�
If the over-smoothed spectrum is reasonably ap-proximated by the convolution of v�x� and the linespectrum sampled from the underlying continuousspectrum at each harmonic frequency, then it ispossible to recover the original spectral values ateach harmonic frequency by applying a compen-sating operation, which transforms v�x� to haveonly one non-zero value at each harmonic fre-quency. In other words, the problem is reduced toan inverse ®ltering problem. The requirement iswritten as follows. The goal is to ®nd a set of co-e�cients ck �k � ÿN ; . . . ;N�.
ul �Xk�N
k�ÿN
ckvlÿk; �8�
where
ul � 1; l � 0;0; otherwise:
��9�
N is a reasonably large integer that e�ectivelymakes vN negligible and vk represents v�kx�. It is
Fig. 6. Three-dimensional spectrogram with reduced phase ef-
fects.Fig. 7. Over smoothing example. Desired basis function of 2nd-
order cardinal B-spline (solid line) is smoothed out (dashed line)
by smoothing e�ect of time window (dotted line).
H. Kawahara et al. / Speech Communication 27 (1999) 187±207 193
necessary to use more than the 2N � 1 set of thisrelation to ®nd a unique solution. This yields thesimultaneous linear equations:
u � Hc;
u � �uÿM ; uÿM�1; . . . ; u0; . . . ; uMÿ1; uM �0;c � �cÿN ; cÿN�1; . . . ; c0; . . . ; cNÿ1; cN �0;
�10�
where � �0 represents the transpose of a matrix. Thesolution is represented as follows:
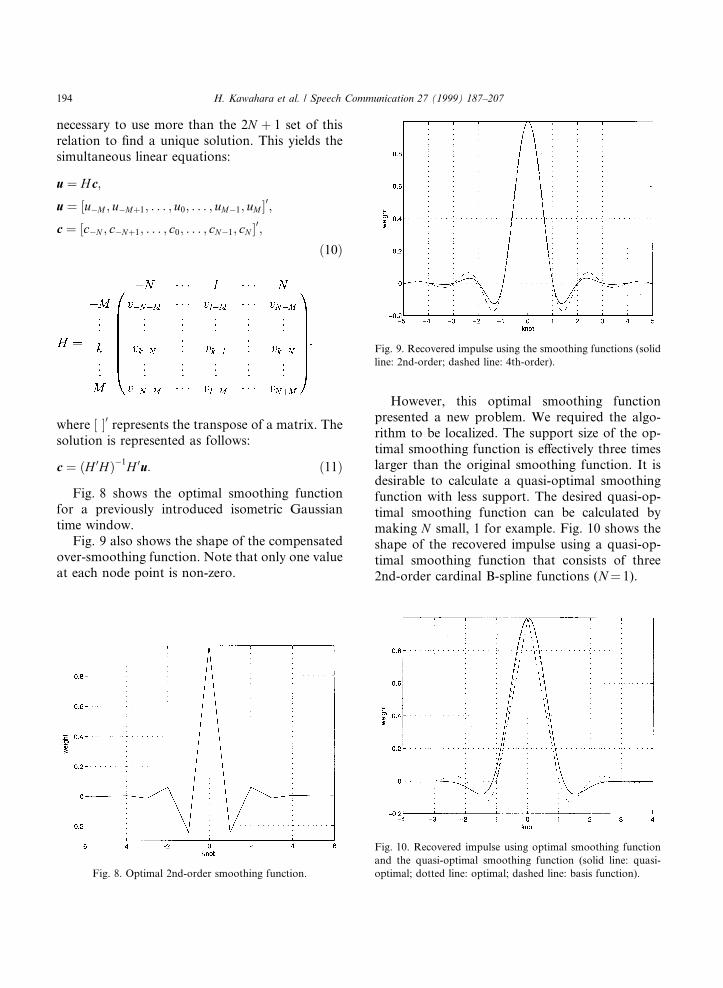
c � �H 0H�ÿ1H 0u: �11�Fig. 8 shows the optimal smoothing function
for a previously introduced isometric Gaussiantime window.
Fig. 9 also shows the shape of the compensatedover-smoothing function. Note that only one valueat each node point is non-zero.
However, this optimal smoothing functionpresented a new problem. We required the algo-rithm to be localized. The support size of the op-timal smoothing function is e�ectively three timeslarger than the original smoothing function. It isdesirable to calculate a quasi-optimal smoothingfunction with less support. The desired quasi-op-timal smoothing function can be calculated bymaking N small, 1 for example. Fig. 10 shows theshape of the recovered impulse using a quasi-op-timal smoothing function that consists of three2nd-order cardinal B-spline functions (N� 1).
Fig. 8. Optimal 2nd-order smoothing function.
Fig. 9. Recovered impulse using the smoothing functions (solid
line: 2nd-order; dashed line: 4th-order).
Fig. 10. Recovered impulse using optimal smoothing function
and the quasi-optimal smoothing function (solid line: quasi-
optimal; dotted line: optimal; dashed line: basis function).
194 H. Kawahara et al. / Speech Communication 27 (1999) 187±207
3. Extraction of smooth and reliable F0 trajectories
For ¯exible and high-quality modi®cation ofspeech parameters, it is important to extract F0trajectories without any trace of interferencescaused by phasic interaction between the analysistime window and the waveform of a signal. Pitchextraction algorithms based on the usual de®nitionof periodicity do not behave well for this purpose,because a natural speech signal is neither purelyperiodic nor stable. For example, nearly periodicsignals represented by Eq. (1) do not satisfy theusual de®nition of periodicity shown below.
s�t � T0� � s�t�; �12�where T0 is the period. Pitch extraction algorithmsbased on the usual de®nition of periodicity try to®nd T0 to minimize some distance measure be-tween s�t � T0� and s�t� for a certain duration.However, there is no reason for the 1=T0 extractedin that manner to agree with the instantaneousfrequency (Boashash, 1992a, b; Cooke, 1993; Abeet al., 1995, 1996) of the fundamental componentin Eq. (1). Therefore, extracting the instantaneousfrequency of the fundamental component directlyis better if we use the signal model represented byEq. (1).
3.1. Basic principle
The fundamental frequency is extracted as theinstantaneous frequency of the signal's funda-mental component in the proposed method. Thismay sound strange to some readers because se-lecting the fundamental component requires priorknowledge of the fundamental frequency.
This apparent contradiction is solved by intro-ducing a measure to represent the fundamental-ness without using a priori knowledge of thefundamental frequency. A fairly wide class of an-alyzing wavelets makes the output correspondingto the fundamental component have smaller FMand AM than other outputs. These analyzingwavelets correspond to a frequency response thatis designed to have a steeper cut-o� at the higherend and a slower cut-o� at the lower end. Let usde®ne the fundamentalness to have the maximumvalue when the FM and AM modulation magni-
tudes are minimum and to have a monotonic re-lation with the modulation magnitudes.
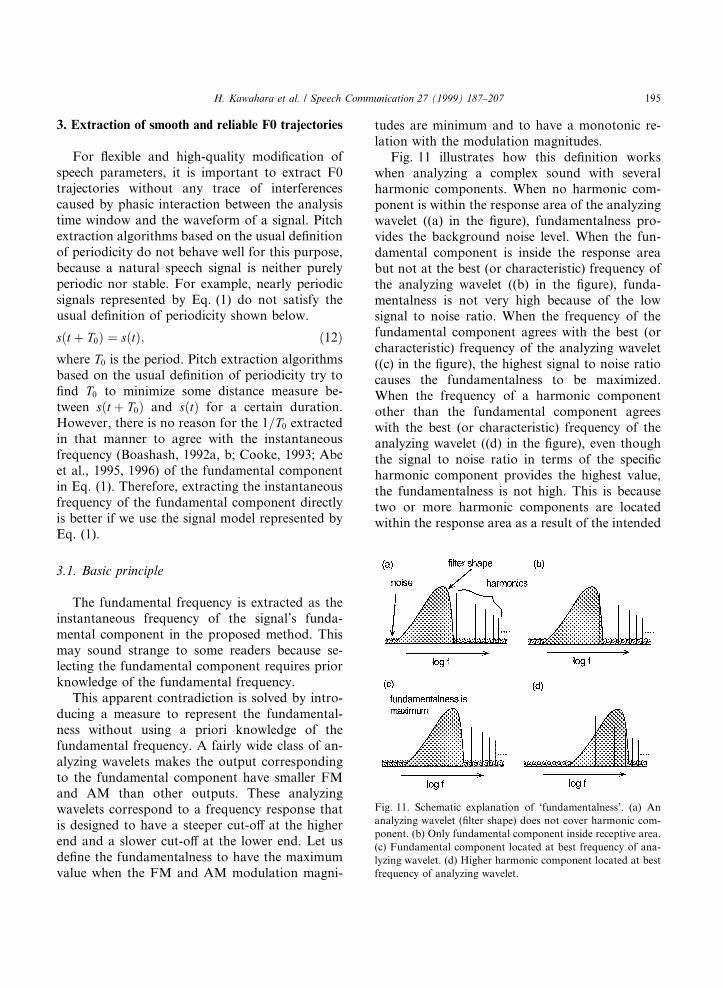
Fig. 11 illustrates how this de®nition workswhen analyzing a complex sound with severalharmonic components. When no harmonic com-ponent is within the response area of the analyzingwavelet ((a) in the ®gure), fundamentalness pro-vides the background noise level. When the fun-damental component is inside the response areabut not at the best (or characteristic) frequency ofthe analyzing wavelet ((b) in the ®gure), funda-mentalness is not very high because of the lowsignal to noise ratio. When the frequency of thefundamental component agrees with the best (orcharacteristic) frequency of the analyzing wavelet((c) in the ®gure), the highest signal to noise ratiocauses the fundamentalness to be maximized.When the frequency of a harmonic componentother than the fundamental component agreeswith the best (or characteristic) frequency of theanalyzing wavelet ((d) in the ®gure), even thoughthe signal to noise ratio in terms of the speci®charmonic component provides the highest value,the fundamentalness is not high. This is becausetwo or more harmonic components are locatedwithin the response area as a result of the intended
Fig. 11. Schematic explanation of `fundamentalness'. (a) An
analyzing wavelet (®lter shape) does not cover harmonic com-
ponent. (b) Only fundamental component inside receptive area.
(c) Fundamental component located at best frequency of ana-
lyzing wavelet. (d) Higher harmonic component located at best
frequency of analyzing wavelet.
H. Kawahara et al. / Speech Communication 27 (1999) 187±207 195
®lter shape design and these components producebeating that consists of AM and FM. The othercases also provide lower fundamentalness. Thus,maximum fundamentalness assures that the ®lteractually corresponds to the fundamental compo-nent in question.
There are many functions that have the re-quired ®lter shape. A Gabor function is one ex-ample. A factor-of-merit is introduced to representthis fundamentalness using the FM and AMmagnitudes as follows.
Using an analyzing wavelet, gAG�t�, made froma complex Gabor function with a slightly ®nerresolution in frequency (i.e. g > 1, g represents thetemporal stretching factor), the input signal can bedivided into a set of ®ltered complex signalsD�t; sc�.
D�t; sc� � js0jÿ1=2
Z1ÿ1
s�t�gAG
t ÿ usc
� �du; �13�
gAG�t� � g�t ÿ 1=4� ÿ g�t � 1=4�; �14�
g�t� � eÿp t=g� �2 eÿj2pt: �15�The characteristic period of the analyzing waveletsc is used to represent the corresponding ®lterchannel. The shift and subtraction in Eq. (14) putszeros at zero-frequency (DC component) and atharmonic frequencies of even order components.
The fundamentalness index M�t; sc�, is calcu-lated for each channel �sc� based on the output.The de®nition of the index is given as follows:
M � ÿ log
ZX
djDjdu
� �2
du
24 35� log
ZX
jDj2 du
24 35
ÿ log
ZX
d2 arg�D�du2
� �2
du
24 35� log X�sc�
�2 log sc; �16�where the integration interval X�sc� is set propor-tional to the size of the corresponding analyzingwavelet and is a function of sc. The ®rst termrepresents the magnitude of AM component. Themagnitude of AM is normalized by the secondterm which represents the total energy. The third
term represents the magnitude of FM component.The magnitude of FM is normalized by the ®fthterm which represents squared frequency. Thefourth term is the normalization factor of thetemporal integration interval. These normalizationfactors make the index M dimension-less number,meaning it is scalable to any F0s and samplingfrequencies.
In practice, it is better to use a slightly modi®edde®nition, because the F0 trajectory and ampli-tude envelope normally consist of rapid move-ments that carry prosodic information. Removingthe contribution of the monotonic F0 movementand amplitude change reduces artifacts on thefundamentalness evaluation caused by prosodiccomponents.
Mc � ÿ log
ZX
djDjdu
�24 ÿ lAM
�2
du
35
ÿ log
ZX
d2 arg�D�du2
�24 ÿ lFM
�2
du
35
� log
ZX
jDj2du
24 35� log X�sc�
�2 log sc; �17�
lAM �1
X
ZX
djDjdu
� �; �18�
lFM �1
X
ZX
d2 arg�D�du2
� �; �19�
where lFM and lAM represent monotonic FMchange and AM change, respectively. ExtractingF0 simply means ®nding the maximum index of Mc
in terms of sc and calculating the average (or morespeci®cally, interpolated) instantaneous frequencyusing the outputs of the channels neighboring sc.
The instantaneous frequency x�t� of one ®lteroutput signal D�t; sc� is calculated using the fol-lowing equation. This equation is derived to re-move unwrapping in the usual calculation ofinstantaneous frequency.
196 H. Kawahara et al. / Speech Communication 27 (1999) 187±207
x�t� � 2fs arcsinjyd�t�j
2; �20�
yd�t� � D�t � Dt=2; sc�jD�t � Dt=2; sc�j ÿ
D�t ÿ Dt=2; sc�jD�t ÿ Dt=2; sc�j :
3.2. Evaluation of F0 extraction performance
Details regarding the performance and proper-ties of the proposed F0 extraction method areimportant because they provides an interestinginsight into how to integrate the source charac-teristics and the spectral characteristics.
A preliminary test on the baseline performanceof the proposed fundamental frequency extractionmethod was conducted.
3.2.1. Pulse train and white noiseA preliminary test was conducted using white
noise and a pulse train. The average signal to noisepower ratio was manipulated from in®nity, 40 to0 dB in 10 dB steps. Only a 100 Hz pulse train wastested because the proposed procedure is scalableand independent of the sampling frequency andF0. Table 1 lists the results. The F0 search rangewas from 40 to 800 Hz, and no post-processingwas involved. The ratio between center frequenciesof adjacent channels was 21=12. The last line showsthe result obtained when an envelope signal wasused as the input instead of using the signalwaveform itself.
Note that the rms (root mean square) deviationfrom the true fundamental frequency of the pulsetrain is proportional to the relative noise amplitude.
When the S/N is 40 dB in the F0 frequency region, a0.13% rms deviation is possible. The method isrelatively robust. Even under a 0 dB signal to noiseratio, a 40% success rate for F0 extraction and adeviation of less than 6% rms are obtained. Thetolerance to noise is increased 6 dB by using theenvelope signal (calculated from the Hilbert trans-form of the original signal) as the input signal. Inthis case, an 86% success rate for F0 extraction anda deviation of less than 5% rms are obtained.
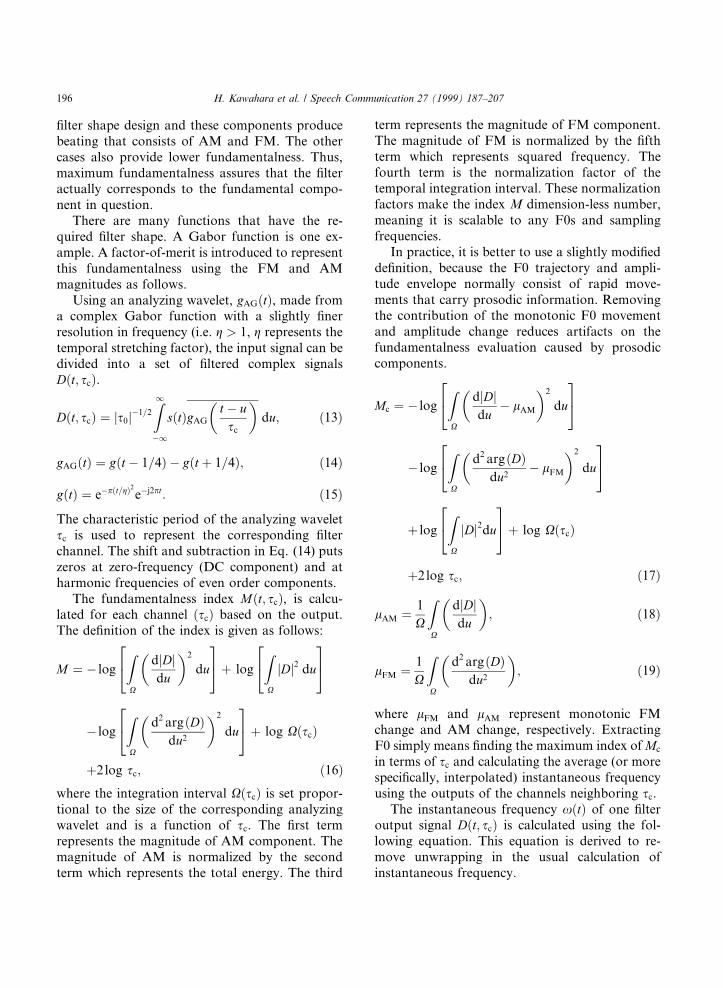
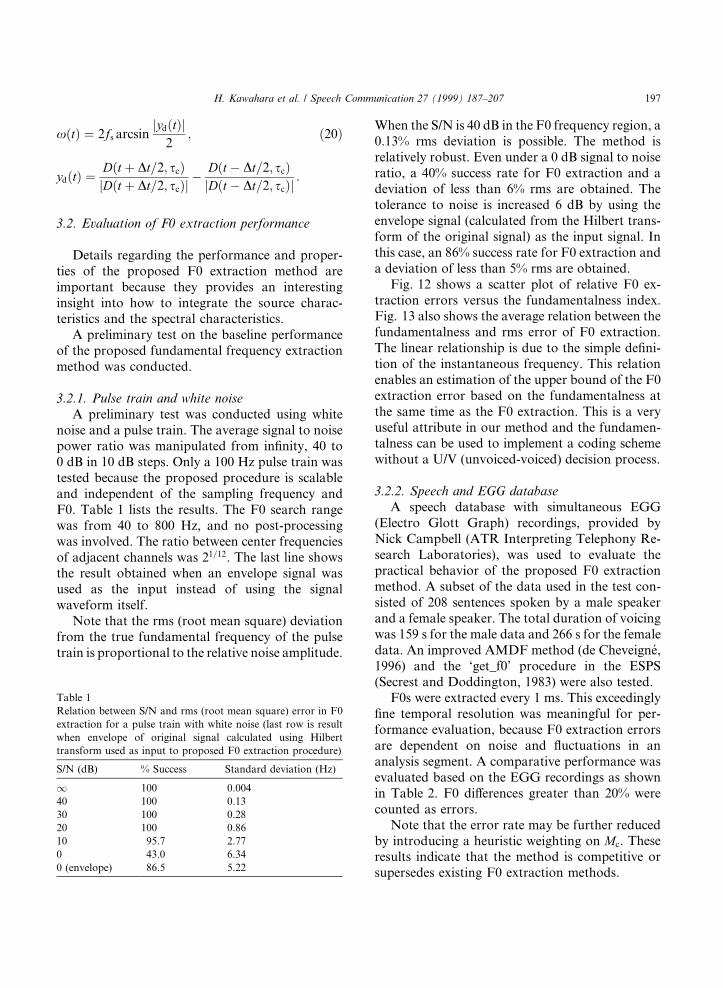
Fig. 12 shows a scatter plot of relative F0 ex-traction errors versus the fundamentalness index.Fig. 13 also shows the average relation between thefundamentalness and rms error of F0 extraction.The linear relationship is due to the simple de®ni-tion of the instantaneous frequency. This relationenables an estimation of the upper bound of the F0extraction error based on the fundamentalness atthe same time as the F0 extraction. This is a veryuseful attribute in our method and the fundamen-talness can be used to implement a coding schemewithout a U/V (unvoiced-voiced) decision process.
3.2.2. Speech and EGG databaseA speech database with simultaneous EGG
(Electro Glott Graph) recordings, provided byNick Campbell (ATR Interpreting Telephony Re-search Laboratories), was used to evaluate thepractical behavior of the proposed F0 extractionmethod. A subset of the data used in the test con-sisted of 208 sentences spoken by a male speakerand a female speaker. The total duration of voicingwas 159 s for the male data and 266 s for the femaledata. An improved AMDF method (de CheveigneÂ,1996) and the `get_f0' procedure in the ESPS(Secrest and Doddington, 1983) were also tested.
F0s were extracted every 1 ms. This exceedingly®ne temporal resolution was meaningful for per-formance evaluation, because F0 extraction errorsare dependent on noise and ¯uctuations in ananalysis segment. A comparative performance wasevaluated based on the EGG recordings as shownin Table 2. F0 di�erences greater than 20% werecounted as errors.
Note that the error rate may be further reducedby introducing a heuristic weighting on Mc. Theseresults indicate that the method is competitive orsupersedes existing F0 extraction methods.
Table 1
Relation between S/N and rms (root mean square) error in F0
extraction for a pulse train with white noise (last row is result
when envelope of original signal calculated using Hilbert
transform used as input to proposed F0 extraction procedure)
S/N (dB) % Success Standard deviation (Hz)
1 100 0.004
40 100 0.13
30 100 0.28
20 100 0.86
10 95.7 2.77
0 43.0 6.34
0 (envelope) 86.5 5.22
H. Kawahara et al. / Speech Communication 27 (1999) 187±207 197
Applying the proposed F0 extraction procedureto EGG data and to corresponding speech is in-teresting because the procedure only concentrateson the fundamental component while the
conventional EGG measurement determines theinterval between glottal closures, which are inevi-tably a�ected by components other than the fun-damental component.
Fig. 12. Scatter plot of `fundamentalness' and F0 errors.
Fig. 13. Relation between `fundamentalness' and rms F0 errors.
198 H. Kawahara et al. / Speech Communication 27 (1999) 187±207
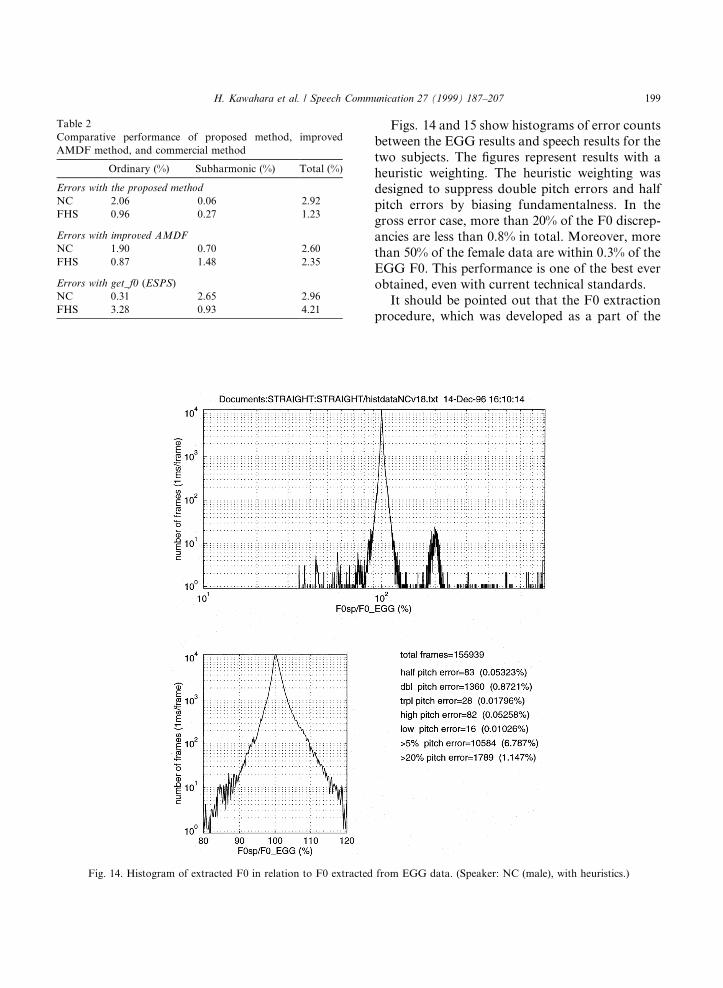
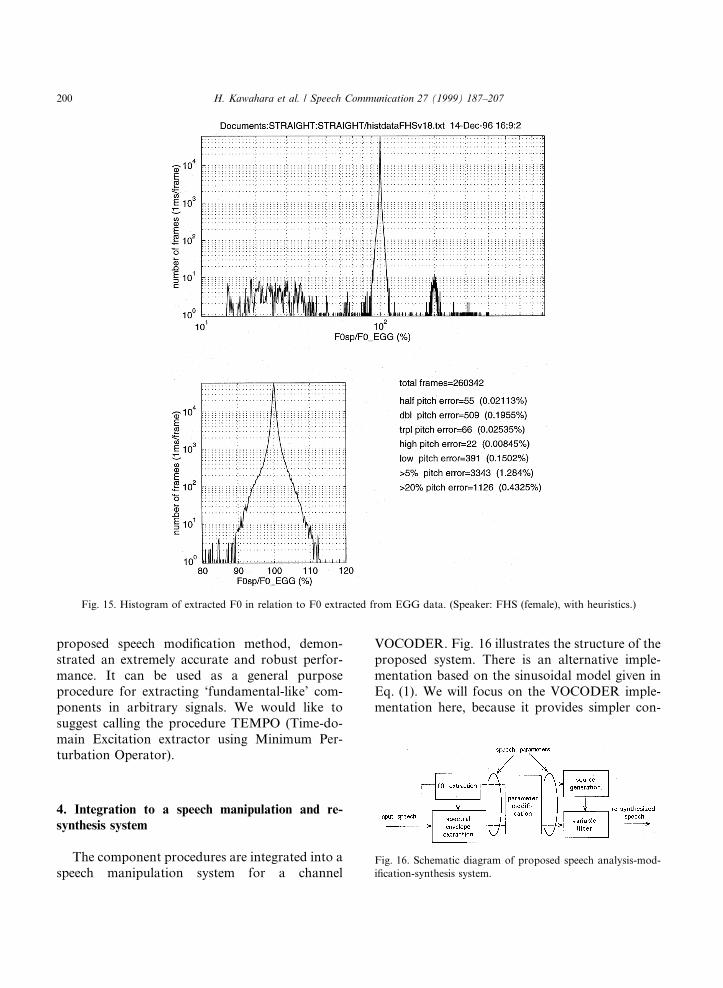
Figs. 14 and 15 show histograms of error countsbetween the EGG results and speech results for thetwo subjects. The ®gures represent results with aheuristic weighting. The heuristic weighting wasdesigned to suppress double pitch errors and halfpitch errors by biasing fundamentalness. In thegross error case, more than 20% of the F0 discrep-ancies are less than 0.8% in total. Moreover, morethan 50% of the female data are within 0.3% of theEGG F0. This performance is one of the best everobtained, even with current technical standards.
It should be pointed out that the F0 extractionprocedure, which was developed as a part of the
Fig. 14. Histogram of extracted F0 in relation to F0 extracted from EGG data. (Speaker: NC (male), with heuristics.)
Table 2
Comparative performance of proposed method, improved
AMDF method, and commercial method
Ordinary (%) Subharmonic (%) Total (%)
Errors with the proposed method
NC 2.06 0.06 2.92
FHS 0.96 0.27 1.23
Errors with improved AMDF
NC 1.90 0.70 2.60
FHS 0.87 1.48 2.35
Errors with get_f0 (ESPS)
NC 0.31 2.65 2.96
FHS 3.28 0.93 4.21
H. Kawahara et al. / Speech Communication 27 (1999) 187±207 199
proposed speech modi®cation method, demon-strated an extremely accurate and robust perfor-mance. It can be used as a general purposeprocedure for extracting `fundamental-like' com-ponents in arbitrary signals. We would like tosuggest calling the procedure TEMPO (Time-do-main Excitation extractor using Minimum Per-turbation Operator).
4. Integration to a speech manipulation and re-synthesis system
The component procedures are integrated into aspeech manipulation system for a channel
VOCODER. Fig. 16 illustrates the structure of theproposed system. There is an alternative imple-mentation based on the sinusoidal model given inEq. (1). We will focus on the VOCODER imple-mentation here, because it provides simpler con-
Fig. 16. Schematic diagram of proposed speech analysis-mod-
i®cation-synthesis system.
Fig. 15. Histogram of extracted F0 in relation to F0 extracted from EGG data. (Speaker: FHS (female), with heuristics.)
200 H. Kawahara et al. / Speech Communication 27 (1999) 187±207
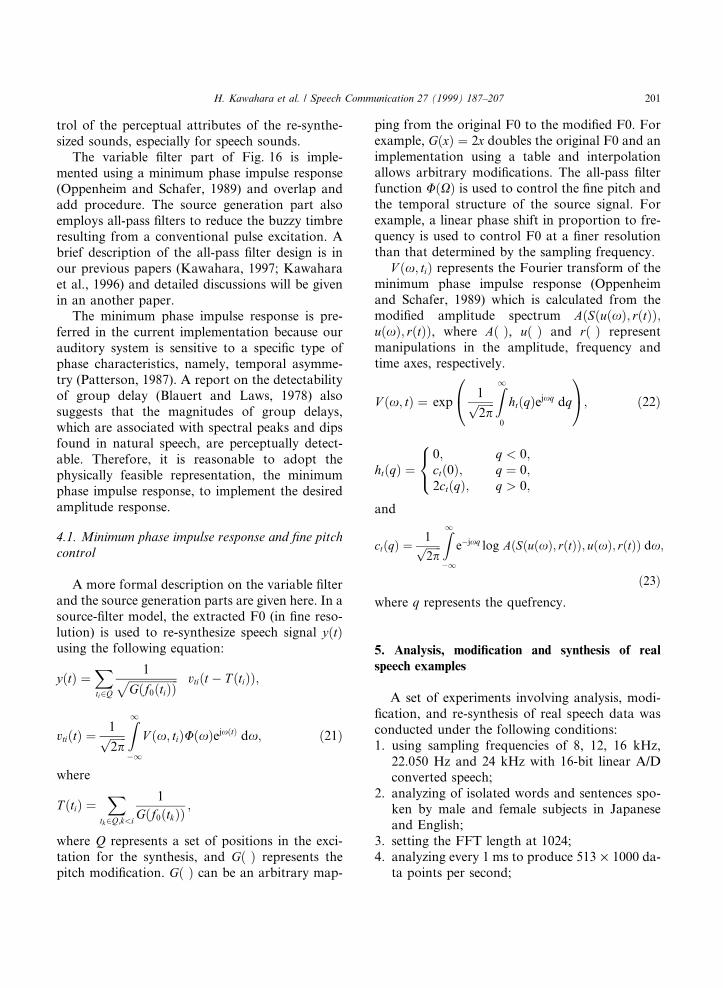
trol of the perceptual attributes of the re-synthe-sized sounds, especially for speech sounds.
The variable ®lter part of Fig. 16 is imple-mented using a minimum phase impulse response(Oppenheim and Schafer, 1989) and overlap andadd procedure. The source generation part alsoemploys all-pass ®lters to reduce the buzzy timbreresulting from a conventional pulse excitation. Abrief description of the all-pass ®lter design is inour previous papers (Kawahara, 1997; Kawaharaet al., 1996) and detailed discussions will be givenin an another paper.
The minimum phase impulse response is pre-ferred in the current implementation because ourauditory system is sensitive to a speci®c type ofphase characteristics, namely, temporal asymme-try (Patterson, 1987). A report on the detectabilityof group delay (Blauert and Laws, 1978) alsosuggests that the magnitudes of group delays,which are associated with spectral peaks and dipsfound in natural speech, are perceptually detect-able. Therefore, it is reasonable to adopt thephysically feasible representation, the minimumphase impulse response, to implement the desiredamplitude response.
4.1. Minimum phase impulse response and ®ne pitchcontrol
A more formal description on the variable ®lterand the source generation parts are given here. In asource-®lter model, the extracted F0 (in ®ne reso-lution) is used to re-synthesize speech signal y�t�using the following equation:
y�t� �Xti2Q
1������������������G�f0�ti��
p vti�t ÿ T �ti��;
vti�t� � 1������2pp
Z1ÿ1
V �x; ti�U�x�ejx�t� dx; �21�
where
T �ti� �X
tk2Q;k<i
1
G�f0�tk�� ;
where Q represents a set of positions in the exci-tation for the synthesis, and G� � represents thepitch modi®cation. G� � can be an arbitrary map-
ping from the original F0 to the modi®ed F0. Forexample, G�x� � 2x doubles the original F0 and animplementation using a table and interpolationallows arbitrary modi®cations. The all-pass ®lterfunction U�X� is used to control the ®ne pitch andthe temporal structure of the source signal. Forexample, a linear phase shift in proportion to fre-quency is used to control F0 at a ®ner resolutionthan that determined by the sampling frequency.
V �x; ti� represents the Fourier transform of theminimum phase impulse response (Oppenheimand Schafer, 1989) which is calculated from themodi®ed amplitude spectrum A�S�u�x�; r�t��;u�x�; r�t��, where A� �, u� � and r� � representmanipulations in the amplitude, frequency andtime axes, respectively.
V �x; t� � exp1������2pp
Z10
ht�q�ejxq dq
0@ 1A; �22�
ht�q� �0; q < 0;ct�0�; q � 0;2ct�q�; q > 0;
8<:and
ct�q� � 1������2pp
Z1ÿ1
eÿjxq log A�S�u�x�; r�t��; u�x�; r�t�� dx;
�23�where q represents the quefrency.
5. Analysis, modi®cation and synthesis of real
speech examples
A set of experiments involving analysis, modi-®cation, and re-synthesis of real speech data wasconducted under the following conditions:1. using sampling frequencies of 8, 12, 16 kHz,
22.050 Hz and 24 kHz with 16-bit linear A/Dconverted speech;
2. analyzing of isolated words and sentences spo-ken by male and female subjects in Japaneseand English;
3. setting the FFT length at 1024;4. analyzing every 1 ms to produce 513 ´ 1000 da-
ta points per second;
H. Kawahara et al. / Speech Communication 27 (1999) 187±207 201
5. extracting fundamental frequencies every 1 msin a search range from 40 to 800 Hz withoutany iterative post-processing.
Examples of real speech samples are shown to il-lustrate operations and various representations inthe proposed method.
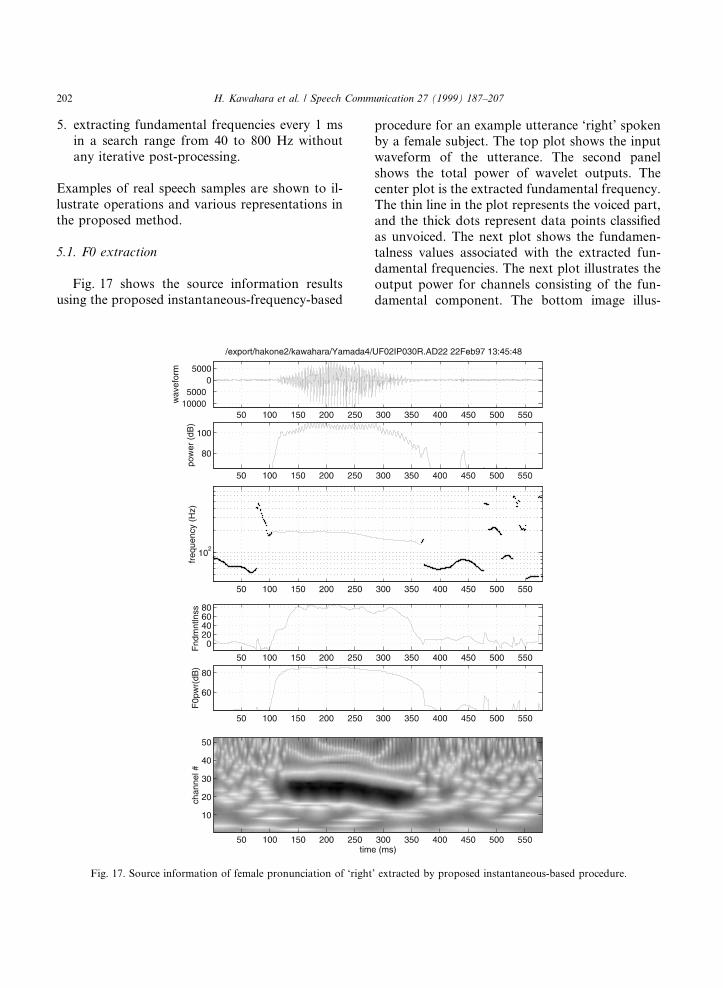
5.1. F0 extraction
Fig. 17 shows the source information resultsusing the proposed instantaneous-frequency-based
procedure for an example utterance `right' spokenby a female subject. The top plot shows the inputwaveform of the utterance. The second panelshows the total power of wavelet outputs. Thecenter plot is the extracted fundamental frequency.The thin line in the plot represents the voiced part,and the thick dots represent data points classi®edas unvoiced. The next plot shows the fundamen-talness values associated with the extracted fun-damental frequencies. The next plot illustrates theoutput power for channels consisting of the fun-damental component. The bottom image illus-
Fig. 17. Source information of female pronunciation of `right' extracted by proposed instantaneous-based procedure.
202 H. Kawahara et al. / Speech Communication 27 (1999) 187±207
trates a fundamentalness map for all channels.Note that the voiced part corresponds to the sa-lient dark blob in this map.
5.2. Spectral envelope extraction
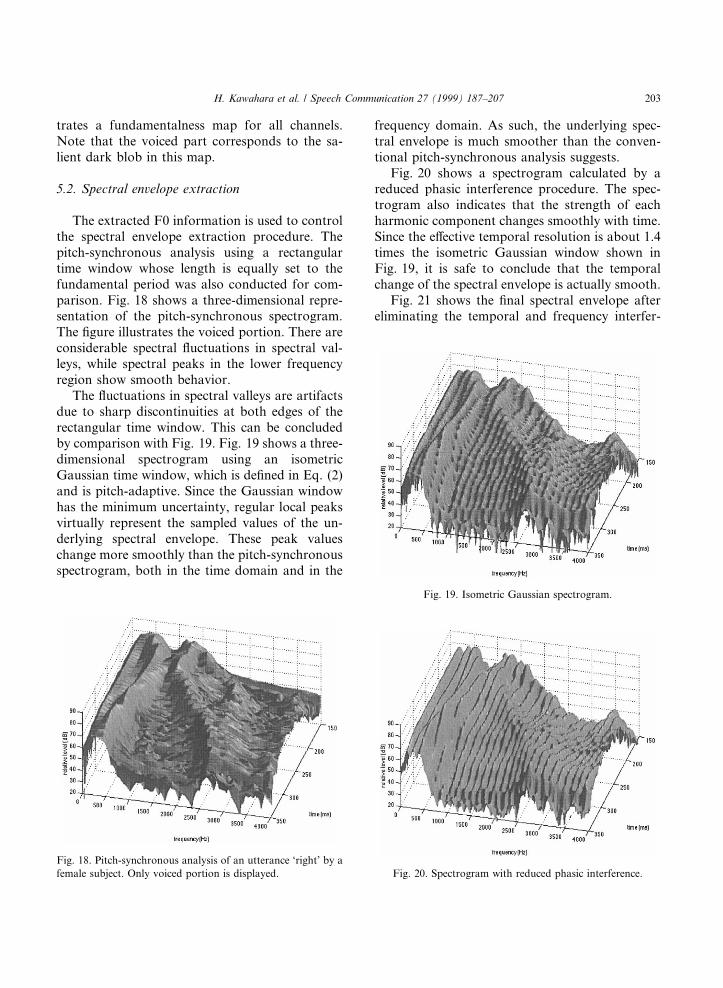
The extracted F0 information is used to controlthe spectral envelope extraction procedure. Thepitch-synchronous analysis using a rectangulartime window whose length is equally set to thefundamental period was also conducted for com-parison. Fig. 18 shows a three-dimensional repre-sentation of the pitch-synchronous spectrogram.The ®gure illustrates the voiced portion. There areconsiderable spectral ¯uctuations in spectral val-leys, while spectral peaks in the lower frequencyregion show smooth behavior.
The ¯uctuations in spectral valleys are artifactsdue to sharp discontinuities at both edges of therectangular time window. This can be concludedby comparison with Fig. 19. Fig. 19 shows a three-dimensional spectrogram using an isometricGaussian time window, which is de®ned in Eq. (2)and is pitch-adaptive. Since the Gaussian windowhas the minimum uncertainty, regular local peaksvirtually represent the sampled values of the un-derlying spectral envelope. These peak valueschange more smoothly than the pitch-synchronousspectrogram, both in the time domain and in the
frequency domain. As such, the underlying spec-tral envelope is much smoother than the conven-tional pitch-synchronous analysis suggests.
Fig. 20 shows a spectrogram calculated by areduced phasic interference procedure. The spec-trogram also indicates that the strength of eachharmonic component changes smoothly with time.Since the e�ective temporal resolution is about 1.4times the isometric Gaussian window shown inFig. 19, it is safe to conclude that the temporalchange of the spectral envelope is actually smooth.
Fig. 21 shows the ®nal spectral envelope aftereliminating the temporal and frequency interfer-
Fig. 18. Pitch-synchronous analysis of an utterance `right' by a
female subject. Only voiced portion is displayed.
Fig. 19. Isometric Gaussian spectrogram.
Fig. 20. Spectrogram with reduced phasic interference.
H. Kawahara et al. / Speech Communication 27 (1999) 187±207 203
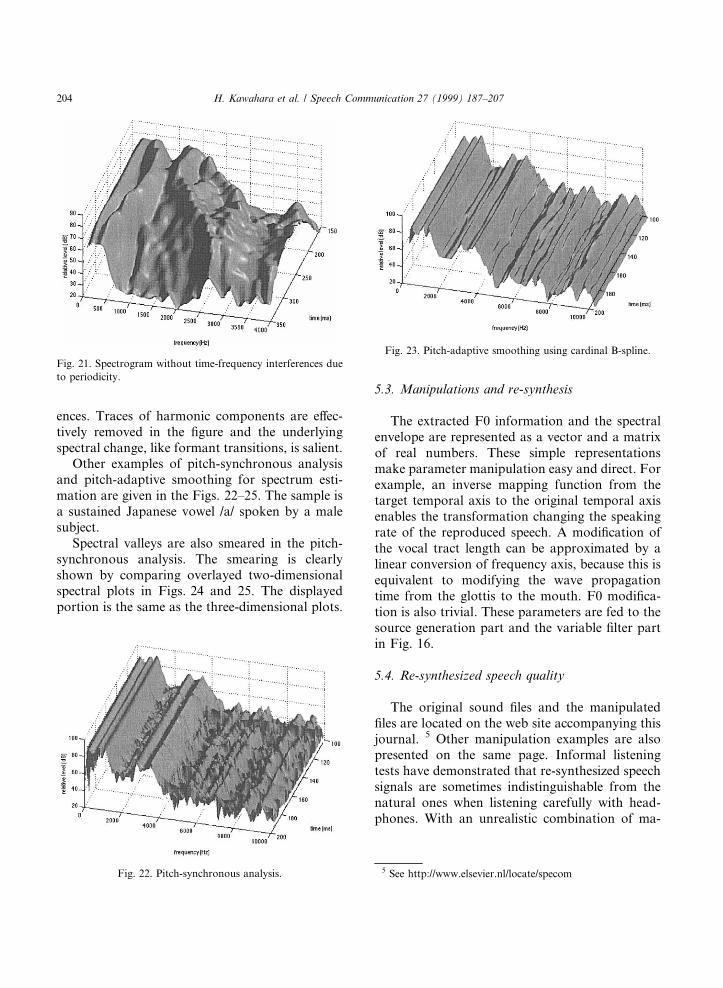
ences. Traces of harmonic components are e�ec-tively removed in the ®gure and the underlyingspectral change, like formant transitions, is salient.
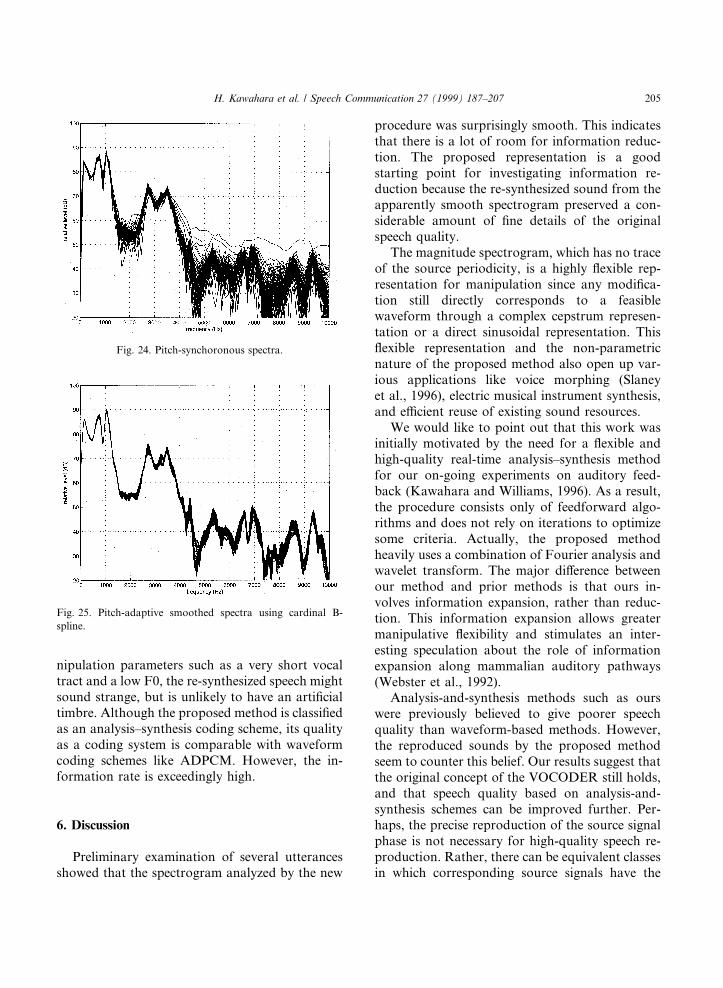
Other examples of pitch-synchronous analysisand pitch-adaptive smoothing for spectrum esti-mation are given in the Figs. 22±25. The sample isa sustained Japanese vowel /a/ spoken by a malesubject.
Spectral valleys are also smeared in the pitch-synchronous analysis. The smearing is clearlyshown by comparing overlayed two-dimensionalspectral plots in Figs. 24 and 25. The displayedportion is the same as the three-dimensional plots.
5.3. Manipulations and re-synthesis
The extracted F0 information and the spectralenvelope are represented as a vector and a matrixof real numbers. These simple representationsmake parameter manipulation easy and direct. Forexample, an inverse mapping function from thetarget temporal axis to the original temporal axisenables the transformation changing the speakingrate of the reproduced speech. A modi®cation ofthe vocal tract length can be approximated by alinear conversion of frequency axis, because this isequivalent to modifying the wave propagationtime from the glottis to the mouth. F0 modi®ca-tion is also trivial. These parameters are fed to thesource generation part and the variable ®lter partin Fig. 16.
5.4. Re-synthesized speech quality
The original sound ®les and the manipulated®les are located on the web site accompanying thisjournal. 5 Other manipulation examples are alsopresented on the same page. Informal listeningtests have demonstrated that re-synthesized speechsignals are sometimes indistinguishable from thenatural ones when listening carefully with head-phones. With an unrealistic combination of ma-
Fig. 22. Pitch-synchronous analysis.
Fig. 23. Pitch-adaptive smoothing using cardinal B-spline.
5 See http://www.elsevier.nl/locate/specom
Fig. 21. Spectrogram without time-frequency interferences due
to periodicity.
204 H. Kawahara et al. / Speech Communication 27 (1999) 187±207
nipulation parameters such as a very short vocaltract and a low F0, the re-synthesized speech mightsound strange, but is unlikely to have an arti®cialtimbre. Although the proposed method is classi®edas an analysis±synthesis coding scheme, its qualityas a coding system is comparable with waveformcoding schemes like ADPCM. However, the in-formation rate is exceedingly high.
6. Discussion
Preliminary examination of several utterancesshowed that the spectrogram analyzed by the new
procedure was surprisingly smooth. This indicatesthat there is a lot of room for information reduc-tion. The proposed representation is a goodstarting point for investigating information re-duction because the re-synthesized sound from theapparently smooth spectrogram preserved a con-siderable amount of ®ne details of the originalspeech quality.
The magnitude spectrogram, which has no traceof the source periodicity, is a highly ¯exible rep-resentation for manipulation since any modi®ca-tion still directly corresponds to a feasiblewaveform through a complex cepstrum represen-tation or a direct sinusoidal representation. This¯exible representation and the non-parametricnature of the proposed method also open up var-ious applications like voice morphing (Slaneyet al., 1996), electric musical instrument synthesis,and e�cient reuse of existing sound resources.
We would like to point out that this work wasinitially motivated by the need for a ¯exible andhigh-quality real-time analysis±synthesis methodfor our on-going experiments on auditory feed-back (Kawahara and Williams, 1996). As a result,the procedure consists only of feedforward algo-rithms and does not rely on iterations to optimizesome criteria. Actually, the proposed methodheavily uses a combination of Fourier analysis andwavelet transform. The major di�erence betweenour method and prior methods is that ours in-volves information expansion, rather than reduc-tion. This information expansion allows greatermanipulative ¯exibility and stimulates an inter-esting speculation about the role of informationexpansion along mammalian auditory pathways(Webster et al., 1992).
Analysis-and-synthesis methods such as ourswere previously believed to give poorer speechquality than waveform-based methods. However,the reproduced sounds by the proposed methodseem to counter this belief. Our results suggest thatthe original concept of the VOCODER still holds,and that speech quality based on analysis-and-synthesis schemes can be improved further. Per-haps, the precise reproduction of the source signalphase is not necessary for high-quality speech re-production. Rather, there can be equivalent classesin which corresponding source signals have the
Fig. 25. Pitch-adaptive smoothed spectra using cardinal B-
spline.
Fig. 24. Pitch-synchoronous spectra.
H. Kawahara et al. / Speech Communication 27 (1999) 187±207 205
same timbre while having di�erent waveforms. It ispractically as well as theoretically important tocharacterize these equivalent classes with somestatistical measures.
It should be noted that the proposed set ofprocedures is not yet an ideal method of soundcoding. The most elaborate part of our method ise�ective only for voiced speech and similar sig-nals. Currently, our method uses simple STFTsto estimate magnitude spectrum for unvoicedspeech. More sophisticated signal models likeMulti Band Excitation (MBE) (Gri�n and Lim,1988; Dutoit and Leich, 1993), multi-pulse (Cas-pers and Atal, 1987) and others (Abrantes et al.,1991) must be incorporated to appropriatelyrepresent wider range of sounds. However, evenwith these shortcomings at this level of imple-mentation, re-synthesized speech using currentsystem is almost equivalent to natural speech in`naturalness'. It also inherits conceptual simplic-ity and greater ¯exibility in speech parametercontrol from the channel VOCODER. These char-acteristics make the proposed method a usefultool for speech perception and production re-search.
The proposed method allows us to test per-ceptual contributions of various spectral/temporalmodi®cations in the vicinity of very natural ref-erence signals. In other words, it provides us witha means to test human speech perception mecha-nisms with ecologically valid stimuli. Preliminarytests with the proposed method have suggestedthat human auditory perception is highly special-ized for detecting changes that a�ect the interpr-etation of auditory scenes (Kawahara et al., 1996).The new concept fundamentalness also providesan interesting interpretation of the pitch percep-tion of inharmonic partials produced by AM(Schouten et al., 1962). Furthermore, it is inter-esting to observe that robustness of our method tonatural ¯uctuations and F0 estimation errors areresulted from a combination of the minimumuncertainty Gaussian time window and a cardinalB-spline smoothing that is a kind of harmoniccancellation (de CheveigneÂ, 1998). We believe ex-perimental results using ecologically valid stimuli,a new interpretation suggested by fundamental-ness, and underlying principles of the proposed
method will provide interesting hints for devel-oping a computational theory of Auditory SceneAnalysis.
7. Conclusion
New procedures that represent and manipulatespeech signals based on pitch-adaptive spectralsmoothing and instantaneous-frequency-based F0extraction have been presented. Elaborated pro-cedures were designed for eliminating any traces ofinterferences caused by the signal periodicity toenable ¯exible manipulations of speech parame-ters. These procedures are integrated to imple-ment a sophisticated channel VOCODER system.We would like to call this set of proceduresSTRAIGHT (Speech Transformation and Repre-sentation using Adaptive Interpolation ofweiGHTed spectrum).
The proposed method o�ers greater ¯exibilityfor parameter manipulations without introducingthe arti®cial timbre speci®c to synthetic speechsignals while maintaining a high reproductivequality. This may help promote research on therelation between physical parameters and percep-tual correlates. The fundamental frequency ex-traction procedure also provides a versatilemethod for investigating quasi-periodic structuresin arbitrary signals. These procedures may alsoprovide an alternative approach for establishing`the computational theory of Auditory SceneAnalysis'.
Acknowledgements
The authors would like to express their sincereappreciation to their colleagues at ATR, to DrRoy Patterson of CNBH Cambridge, and to DrToshio Irino of NTT (currently, at ATR). Theyalso wish to express special thanks to their col-laborator, J.C. Williams, for her discussions andencouragement. Finally, we would like to ac-knowledge that the comments from anonymousreviewers on the paper's early version were veryhelpful in making this paper more readable.
206 H. Kawahara et al. / Speech Communication 27 (1999) 187±207
References
Abe, T., Kobayashi, T., Imai, S., 1995. Harmonics estimation
based on instantaneous frequency and its application to
pitch determination. IEICE Trans. Information and Sys-
tems E78-D (9), 1188±1194.
Abe, T., Kobayashi, T., Imai, S., 1996. Robust pitch estimation
with harmonics enhancement in noisy environments based
on instantaneous frequency. In: Proc. ICSLP 96, Philadel-
phia, pp. 1277±1280.
Abrantes, A.J., Marques, J.S., Trancoso, I.M., 1991. Hybrid
sinusoidal modeling of speech without voicing decision. In:
Proc. Eurospeech 91, Paris, pp. 231±234.
Atal, B.S., Hanauer, S.L., 1971. Speech analysis and synthesis
by linear prediction of speech wave. J. Acoust. Soc. Amer.
50 (2 pt.2), 637±655.
Blauert, J., Laws, P., 1978. Group delay distortion in electro-
acoustical systems. J. Acoust. Soc. Amer. 63 (5), 1478±
1483.
Boashash, B., 1992a. Estimating and interpreting the instanta-
neous frequency of a signal ± part 1: Fundamentals. Proc.
IEEE 80 (4), 520±538.
Boashash, B., 1992b. Estimating and interpreting the instanta-
neous frequency of a signal ± part 2: Algorithms and
applications. Proc. IEEE 80 (4), 550±568.
Bregman, A.S., 1990. Auditory Scene Analysis. MIT Press,
Cambridge, MA.
Caspers, B., Atal, B., 1987. Role of multi-pulse excitation in
synthesis of natural-sounding voiced speech In: Proc. IEEE
Internat. Conf. Acoust. Speech and Signal Processing Vol.
4, pp. 2388±2391.
Cohen, L., 1989. Time-frequency distributions ± a review. Proc.
IEEE 77 (7), 941±981.
Cooke, M.P., 1993. Modelling Auditory Processing and Orga-
nisation. Cambridge University Press, London.
de Cheveign�e, A., 1996. Speech fundamental frequency estima-
tion. Technical Report TR-H-195, ATR-HIP.
de Cheveign�e, A., 1998. Cancellation model of pitch perception.
J. Acoust. Soc. Amer. 103 (3), 1261±1271.
Dudley, H., 1939. Remaking speech. J. Acoust. Soc. Amer. 11
(2), 169±177.
Dutoit, T., Leich, H., 1993. An analysis of the performance of
the MBE model when used in the context of a text-to-
speech system. In: Proc. Eurospeech 93, Berlin, pp. 531±
534.
El-Jaroudi, A., Makhoul, J., 1991. Discrete all-pole modeling.
IEEE Trans. SP 39, 411±423.
Gri�n, D.W., Lim, J.S., 1988. Multiband excitation vocoder.
IEEE Trans. on Acoustics Speech and Signal Processing 36
(8), 1223±1235.
Itakura, F., Saito, S., 1970. A statistical method for estimation
of speech spectral density and formant frequencies. Trans.
IECE Japan, 53-A, 36±43 (in Japanese).
Kawahara, H., 1997. Speech representation and transformation
using adaptive interpolation of weighted spectrum: Vocod-
er revisited. In: Proc. IEEE Internat. Conf. Acoust. Speech
and Signal Processing 2, M�unich, 1303±1306.
Kawahara, H., Masuda, I., 1996. Speech representation and
transformation based on adaptive time-frequency interpol-
ation. Technical Report of IEICE, EA96-28, pp. 9±16 (in
Japanese).
Kawahara, H., Williams, J.C., 1996. E�ects of auditory
feedback on voice pitch. In: Davis, P.J., Fletcher, N.H.
(Eds.), Vocal Fold Physiology. Singular, M�unich, Chapter
18, pp. 263±278.
Kawahara, H., Tsuzaki, M., Patterson, Roy D., 1996. A
method to shape a class of all-pass ®lters and their
perceptual correlates. Tech. Com. Psycho. Physio. the
Acoust. Soc. Jpn., H-96-79, 1±8 (in Japanese).
Marr, D., 1982. Vision: A Computational Investigation into
Human Representation and Processing of Visual Informa-
tion. Freeman, New York.
McAulay, R.J., Quatieri, T.F., 1986. Speech analysis/synthesis
based on a sinusoidal representation. IEEE Trans. ASSP
34, 744±754.
Narendranath, M., Murthy, H.A., Rajendran, S., Yenanaray-
ana, B., 1995. Transformation of formants for voice
conversion using arti®cial neural networks. Speech Com-
munication 16, 207±216.
Oppenheim, A., Schafer, R., 1989. Discrete-Time Signal Pro-
cessing. Prentice-Hall, Englewood Cli�s, NJ.
Patterson, R.D., 1987. A pulse ribbon model of monaural phase
perception. J. Acoust. Soc. Amer. 82 (5), 1560±1586.
Schouten, J.F., Ritsma, R.J., Cardozo, B.L., 1962. Pitch of the
residue. J. Acoust. Soc. Amer. 34, 1418±1424.
Secrest, B.G., Doddington, G.R., 1983. An integrated pitch
tracking algorithm for speech systems. In: Proc. IEEE
ICASSP83, pp. 1352±1355.
Slaney, M., Covell, M., Lassiter, B., 1996. Automatic audio
morphing. In: Proc. IEEE Internat. Conf. Acoust. Speech
and Signal Processing, Atlanta, pp. 1±4.
Stylianou, Y., Laroche, J., Moulines, E., 1995. High-quality
speech modi®cation based on a harmonic + noise model.
In: Proc. Eurospeech 95, Madrid, pp. 451±454.
Veldhuis, R., He, H., 1996. Time-scale and pitch modi®cations
of speech signals and resynthesis from the discrete short-
time Fourier transform. Speech Communication 18, 257±
279.
Webster, D.B., Popper, A.N., Fay, R.R., 1992. The Mammalian
Auditory Pathway: Neuroanatomy. Springer, Berlin, 1992.
H. Kawahara et al. / Speech Communication 27 (1999) 187±207 207


![Untitled-3 [content.alfred.com] · 2017-10-03 · LESSON I Pitch 2 Pitch 3 Pitch 4 Pitch 5 Pitch 6 Pitch 7 Pitch 8 Pitch 10 Pit h 11 Pitch 12 Pitch 13 Pitch 14 Pitch 15 Pitch 16 Pitch](https://img.pdfslide.us/doc/110x75/5f1f182654507e355339a7ee/untitled-3-2017-10-03-lesson-i-pitch-2-pitch-3-pitch-4-pitch-5-pitch-6-pitch.jpg)