Embed Size (px)
Citation preview
Restructuring in the Chemical Industry
– facts, figures and experiences from the European Perspective
Radosław OwczarzakResearch Manager
Employment and Competitiveness Unit
Content
• Eurofound and Chemical Industry– Sector study (2008) on the future skill needs– ERM, EIRO, EWCO observatories (cases)– EWCS, ECS Surveys (all manufacturing only) – Jobs Project
• Restructuring facts and figures - Sources:– ELFS, ERM (cases and the overview)– Employment shifts/Jobs Project (wages and skills)
0
2 000
4 000
6 000
8 000
10 000
12 000
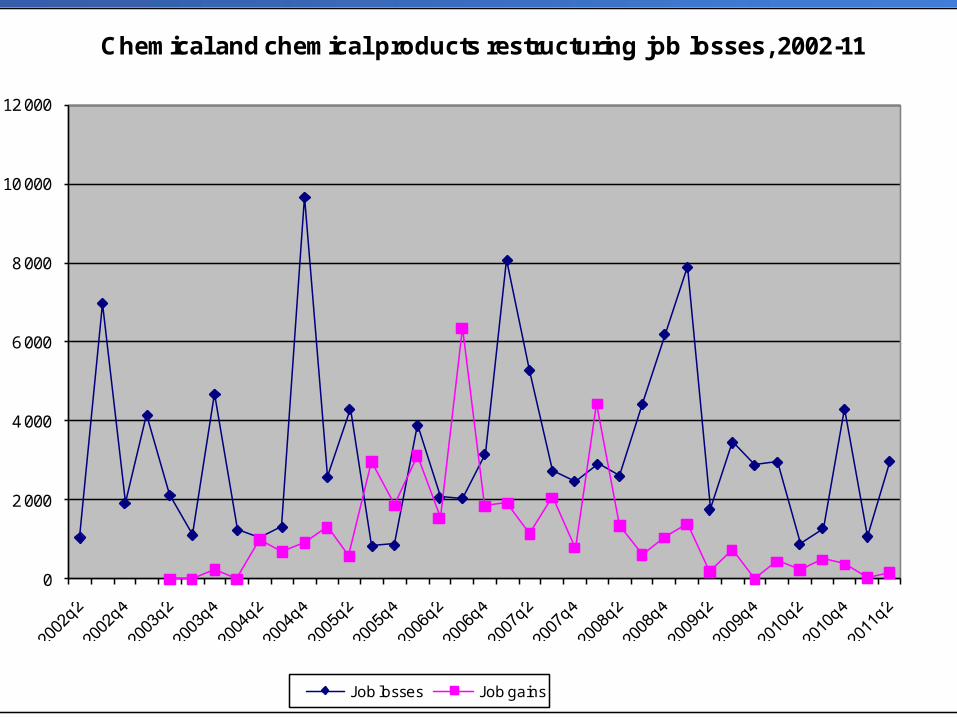
Chemical and chemical products restructuring job losses, 2002-11
Job losses Job gains
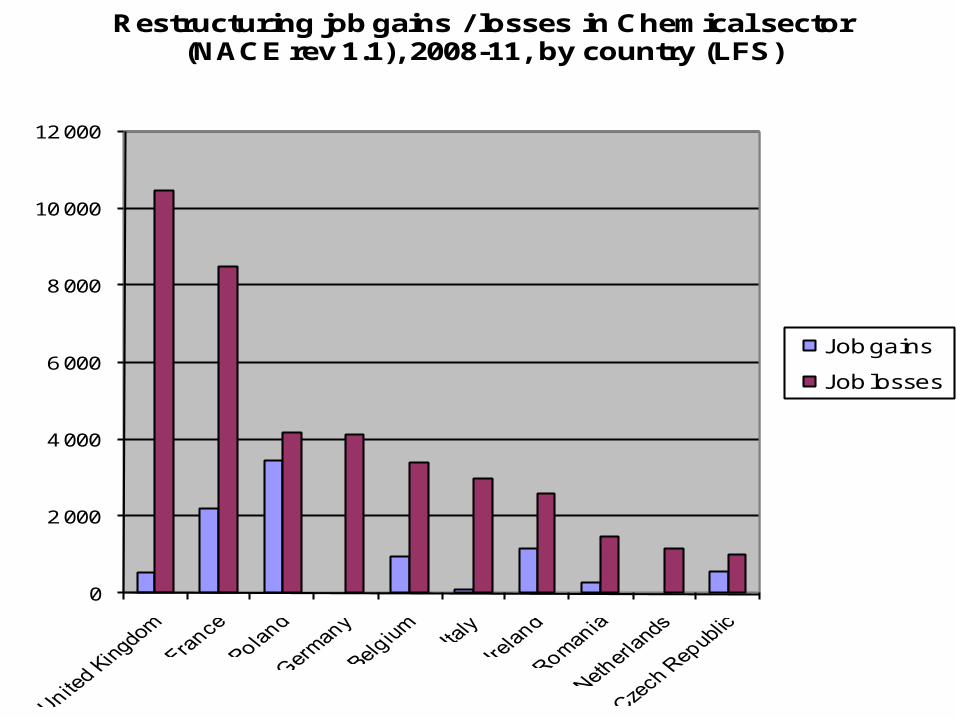
Source: ERM
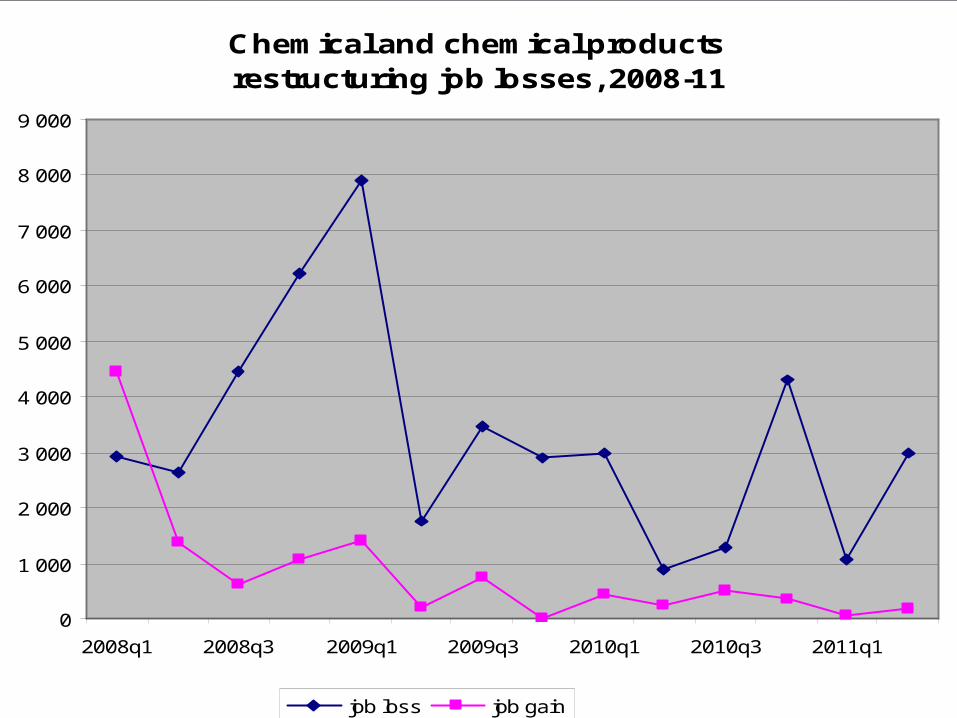
Chemical and chemical products restructuring job losses, 2008-11
0
1 000
2 000
3 000
4 000
5 000
6 000
7 000
8 000
9 000
2008q1 2008q3 2009q1 2009q3 2010q1 2010q3 2011q1
job loss job gain
Source: ERM
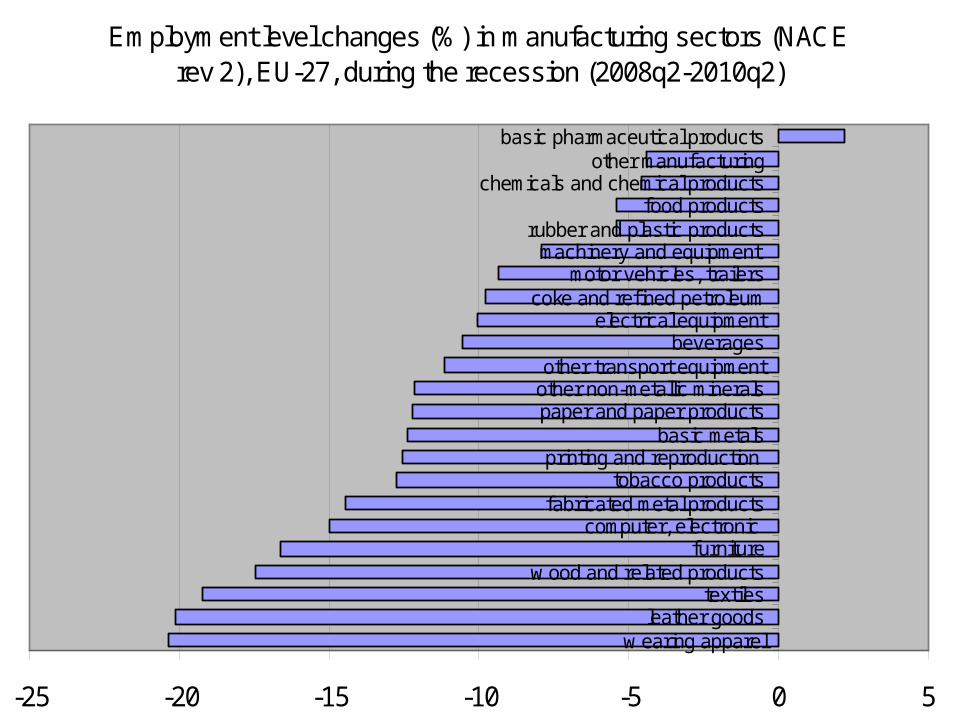
Employment level changes (%) in manufacturing sectors (NACE rev 2), EU-27, during the recession (2008q2-2010q2)
-25 -20 -15 -10 -5 0 5
w earing apparel leather goods
textiles w ood and related products
furniture computer, electronic
fabricated metal products tobacco products
printing and reproduction basic metals
paper and paper products other non-metallic minerals other transport equipment
beverages electrical equipment
coke and refined petroleum motor vehicles, trailers
machinery and equipment rubber and plastic products
food products chemicals and chemical products
other manufacturing basic pharmaceutical products
Source: LFS
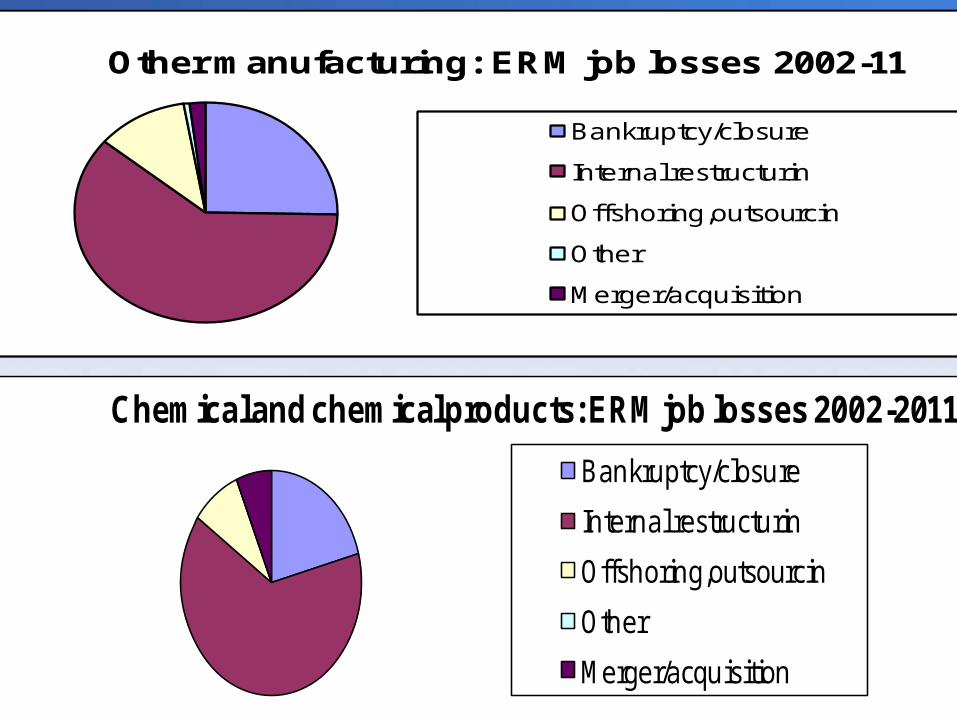
Chemical and chemical products: ERM job losses 2002-2011
Bankruptcy/closure
Internal restructurin
Offshoring,outsourcin
Other
Merger/acquisition
Other manufacturing: ERM job losses 2002-11
Bankruptcy/closure
Internal restructurin
Offshoring,outsourcin
Other
Merger/acquisition
0
2 000
4 000
6 000
8 000
10 000
12 000
Restructuring job gains / losses in Chemical sector (NACE rev 1.1), 2008-11, by country (LFS)
Job gains
Job losses
• Add a qualitative dimension to net employment change data (ELFS) using wage and skills
• Method first used by J. Stiglitz for the US
• First cross-national application in Europe (to 23 MSs) in ERM 2008
• A job is an occupation in a sector (ISCO-NACE)
The ‘jobs’ approach: overview
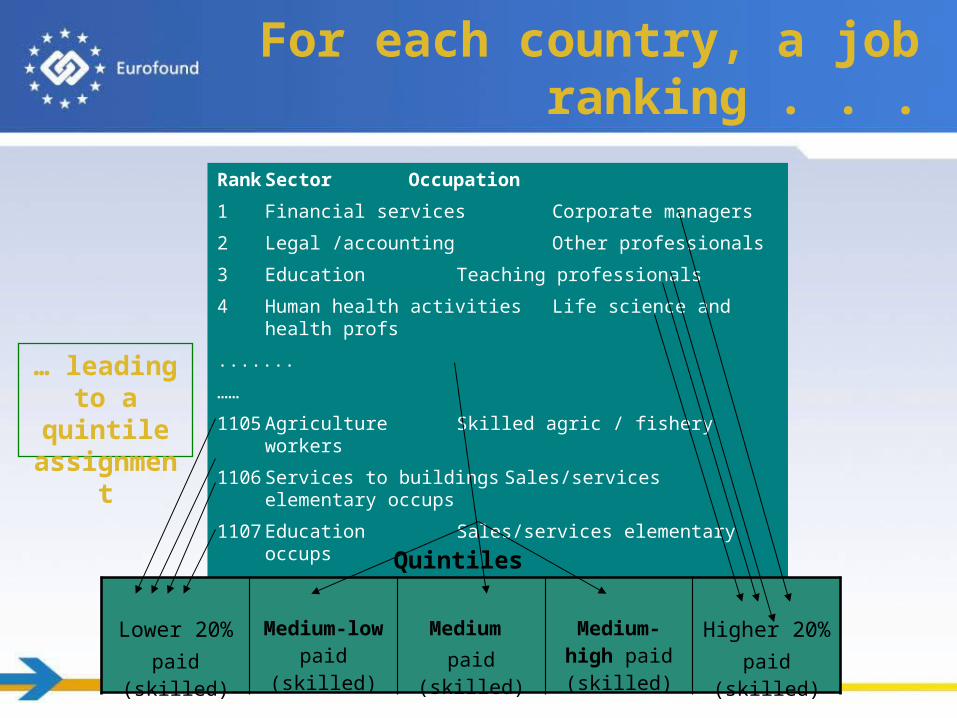
… leading to a quintile
assignment
Rank Sector Occupation
1 Financial services Corporate managers
2 Legal /accounting Other professionals
3 Education Teaching professionals
4 Human health activities Life science and health profs
.......
……
1105 Agriculture Skilled agric / fishery workers
1106 Services to buildings Sales/services elementary occups
1107 Education Sales/services elementary occups
1108 Food manufacture Craft workers
Lower 20%paid (skilled)
Medium-low paid (skilled)
Medium paid (skilled)
Medium-high paid (skilled)
Higher 20%paid (skilled)
Quintiles
For each country, a job ranking . . .
02,
000
4,00
06,
000
8,00
0
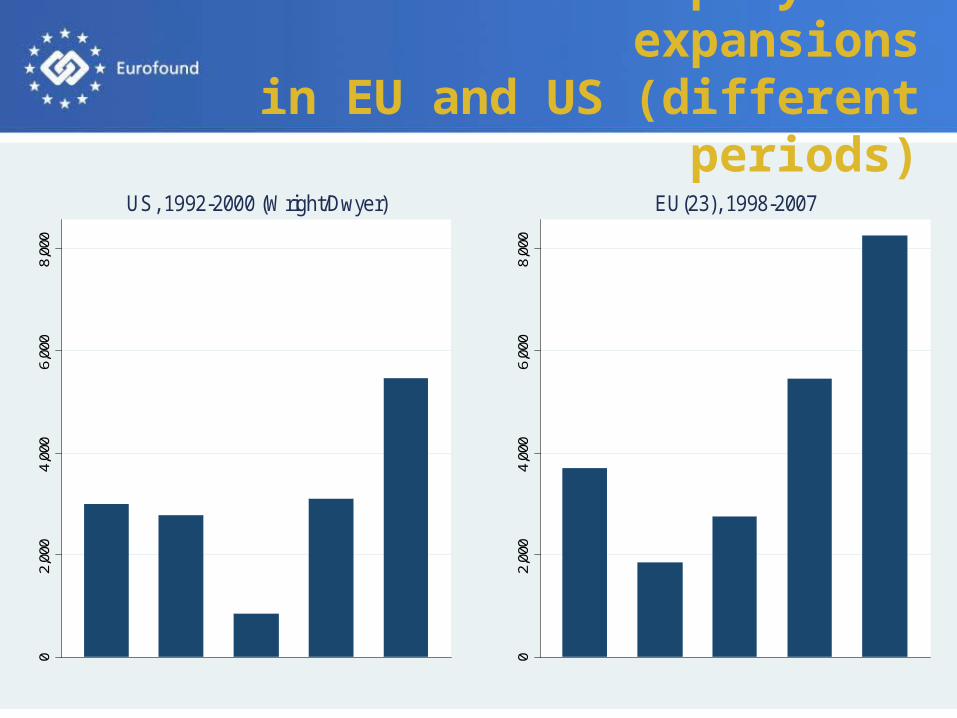
US, 1992-2000 (Wright/Dwyer)
02,
000
4,00
06,
000
8,00
0
EU(23), 1998-2007
Recent employment expansionsin EU and US (different periods)
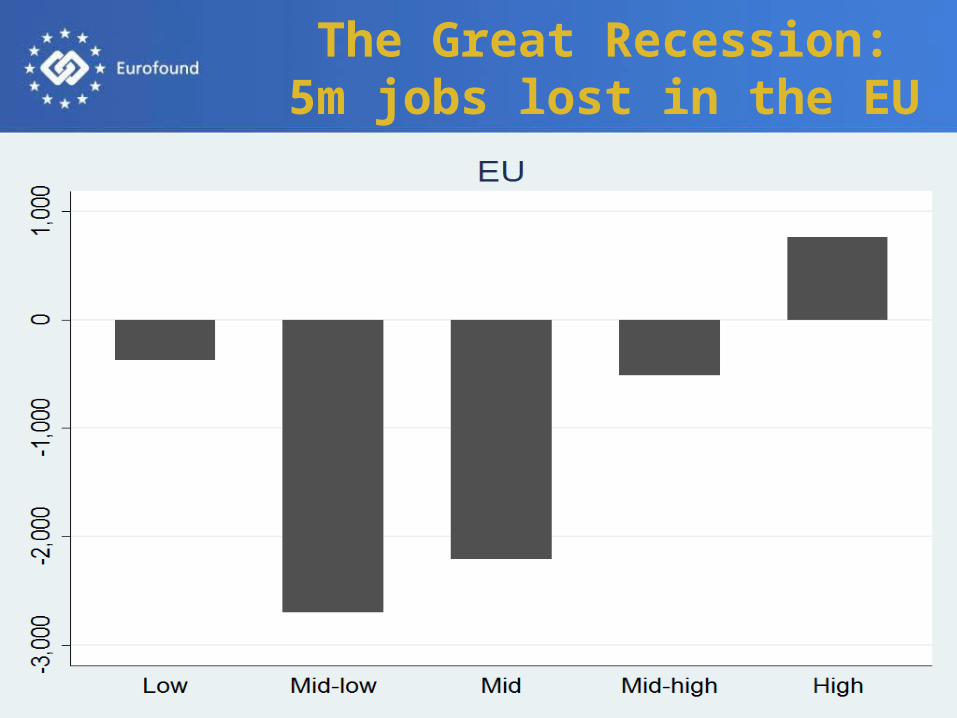
The Great Recession: 5m jobs lost in the EU
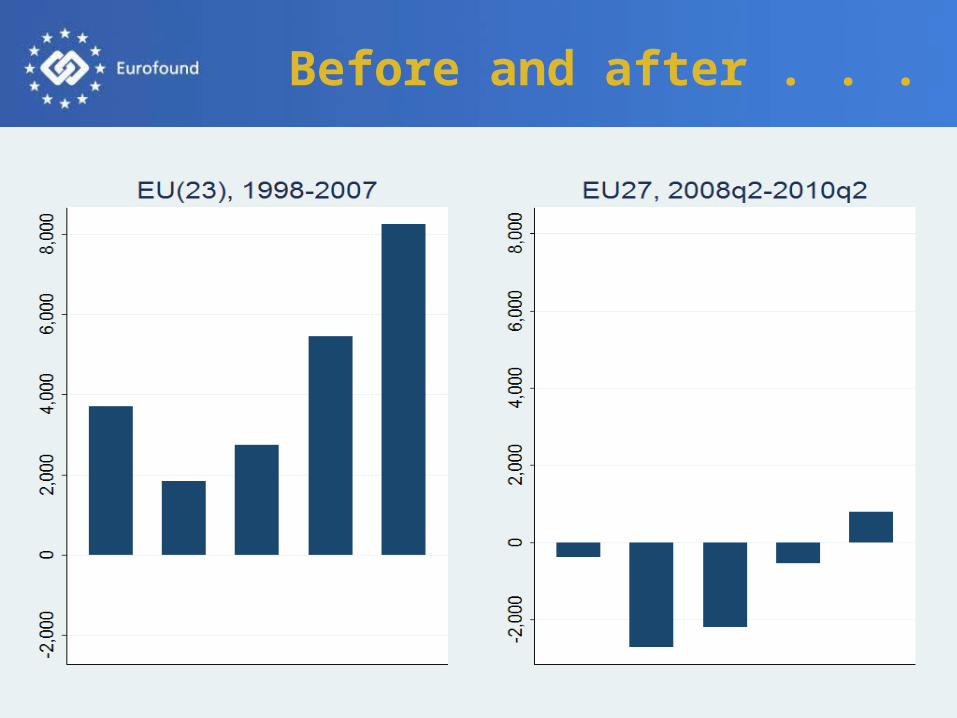
Before and after . . .
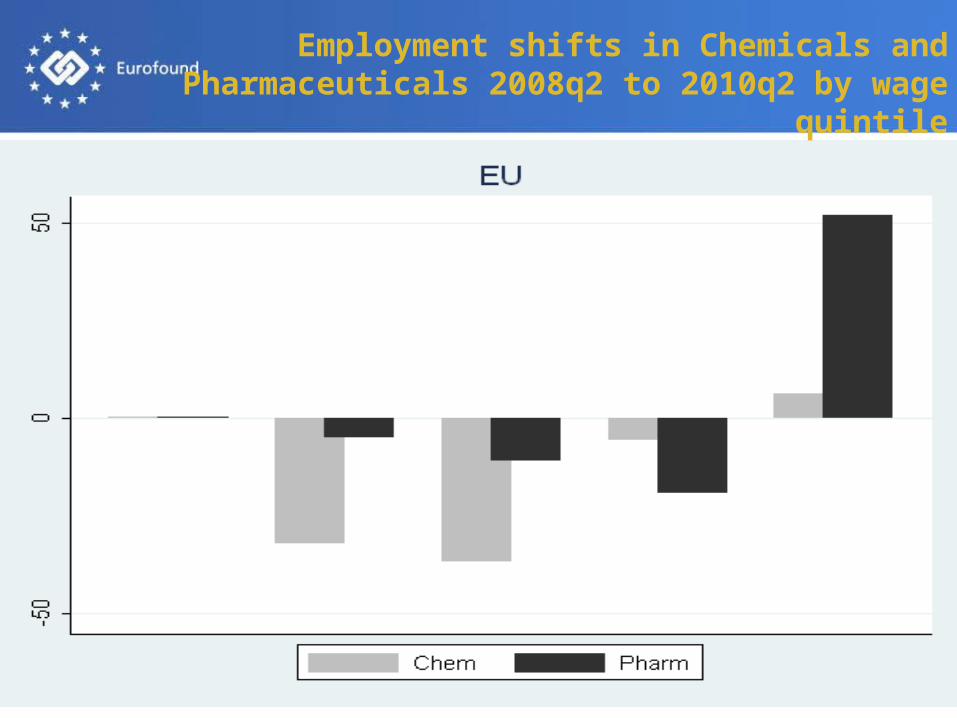
Employment shifts in Chemicals and Pharmaceuticals 2008q2 to 2010q2 by wage quintile
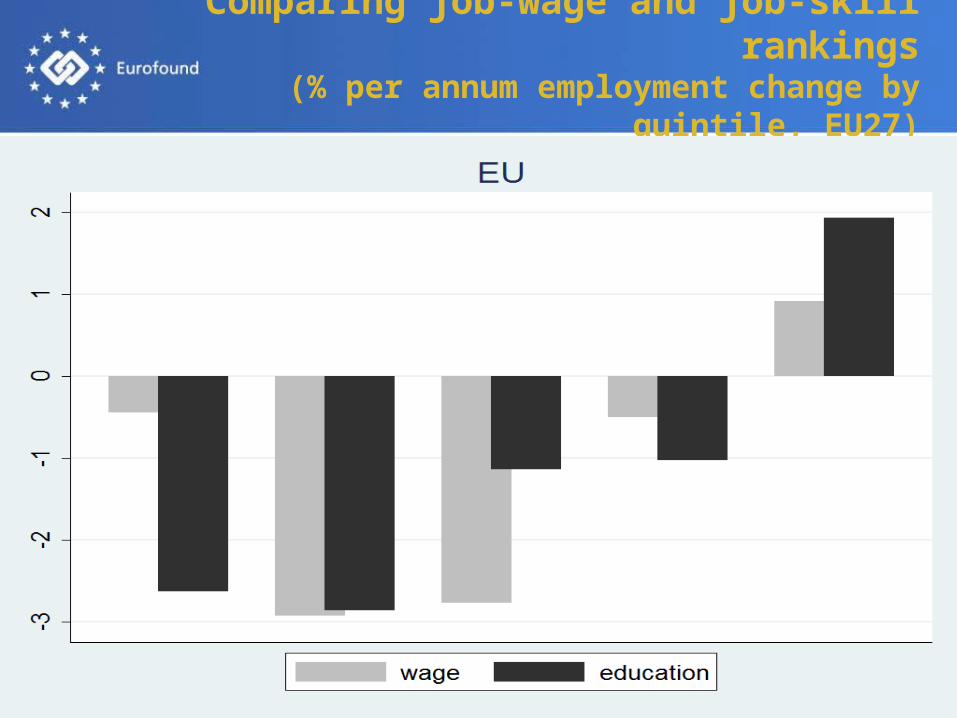
Comparing job-wage and job-skill rankings (% per annum employment change by quintile, EU27)
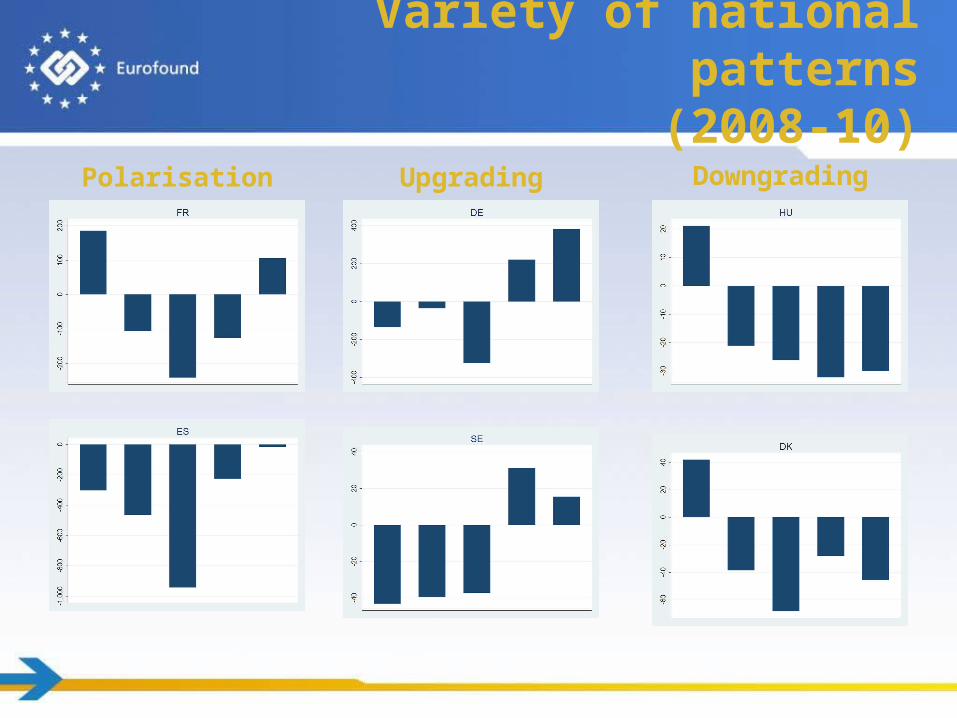
Polarisation Upgrading Downgrading
Variety of national patterns(2008-10)
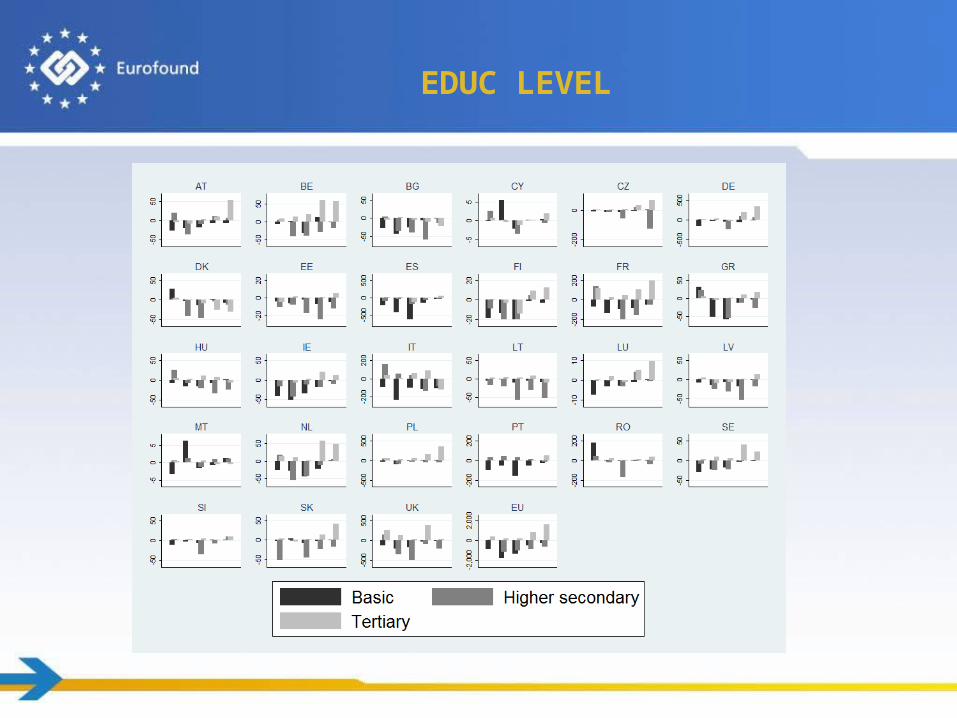
EDUC LEVEL
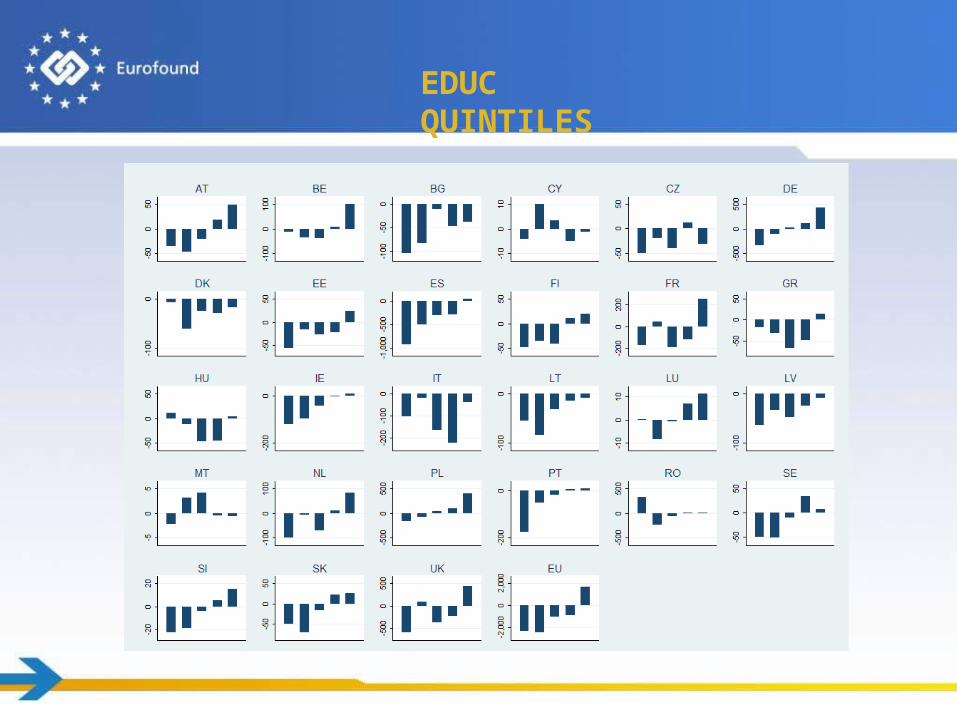
EDUC QUINTILES