Embed Size (px)
Citation preview
Article
Restricting Glycolysis Pre
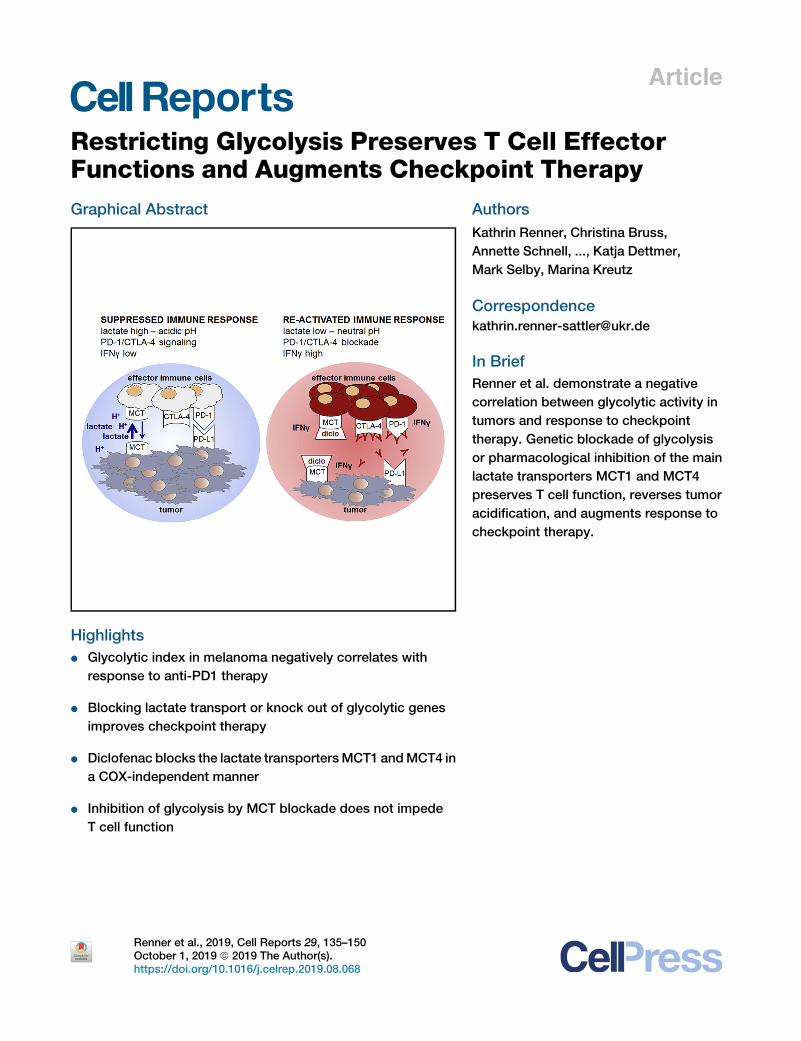
serves T Cell EffectorFunctions and Augments Checkpoint TherapyGraphical Abstract
Highlights
d Glycolytic index in melanoma negatively correlates with
response to anti-PD1 therapy
d Blocking lactate transport or knock out of glycolytic genes
improves checkpoint therapy
d Diclofenac blocks the lactate transportersMCT1 andMCT4 in
a COX-independent manner
d Inhibition of glycolysis by MCT blockade does not impede
T cell function
Renner et al., 2019, Cell Reports 29, 135–150October 1, 2019 ª 2019 The Author(s).https://doi.org/10.1016/j.celrep.2019.08.068
Authors
Kathrin Renner, Christina Bruss,
Annette Schnell, ..., Katja Dettmer,
Mark Selby, Marina Kreutz
In Brief
Renner et al. demonstrate a negative
correlation between glycolytic activity in
tumors and response to checkpoint
therapy. Genetic blockade of glycolysis
or pharmacological inhibition of the main
lactate transporters MCT1 and MCT4
preserves T cell function, reverses tumor
acidification, and augments response to
checkpoint therapy.
Cell Reports
Article
Restricting Glycolysis PreservesT Cell Effector Functionsand Augments Checkpoint TherapyKathrin Renner,1,2,21,24,* Christina Bruss,1,21 Annette Schnell,1,21 Gudrun Koehl,3 Holger M. Becker,4,22 Matthias Fante,1
Ayse-Nur Menevse,2 Nathalie Kauer,1 Raquel Blazquez,1 Lisa Hacker,1 Sonja-Maria Decking,1 Toszka Bohn,5
Stephanie Faerber,1 Katja Evert,6 Lisa Aigle,1 Sabine Amslinger,7 Maria Landa,7,23 Oscar Krijgsman,8 Elisa A. Rozeman,8
Christina Brummer,1 Peter J. Siska,1 Katrin Singer,1 Stefanie Pektor,9 Matthias Miederer,9 Katrin Peter,1 Eva Gottfried,1
Wolfgang Herr,1 Ibtisam Marchiq,10 Jacques Pouyssegur,10,11 William R. Roush,12 SuFey Ong,13 Sarah Warren,13
Tobias Pukrop,1 Philipp Beckhove,2 Sven A. Lang,14 Tobias Bopp,5,15,16,17 Christian U. Blank,8 John L. Cleveland,18
Peter J. Oefner,19 Katja Dettmer,19 Mark Selby,20 and Marina Kreutz1,21Department of Internal Medicine III, University Hospital Regensburg, Regensburg, Germany2Regensburg Center for Interventional Immunology, Regensburg, Germany3Department of Surgery, University Hospital Regensburg, Regensburg, Germany4Division of General Zoology, University of Kaiserslautern, Kaiserslautern, Germany5Institute for Immunology, University Medical Center Johannes Gutenberg University (UMC) Mainz, Mainz, Germany6Institute of Pathology, University of Regensburg, Regensburg, Germany7Institute of Organic Chemistry, University of Regensburg, Regensburg, Germany8Department Medical Oncology and Division of Molecular Oncology and Immunology, The Netherlands Cancer Institute, Amsterdam,
the Netherlands9Department of Nuclear Medicine, University Medical Center, Johannes Gutenberg University Mainz, Mainz, Germany10Institute of Research on Cancer and Aging (IRCAN), CNRS-INSERM-UNS UMR 7284, Nice, France11Department of Medical Biology, Scientific Centre of Monaco (CSM), Monaco12Department of Chemistry, The Scripps Research Institute, Scripps-Florida, Jupiter, FL, USA13NanoString Technologies, Seattle, WA, USA14Department of General and Visceral Surgery, Medical Center, Faculty of Medicine University of Freiburg, Freiburg, Germany15Research Center for Immunotherapy (FZI), UMC Mainz, Mainz, Germany16University Cancer Center Mainz, UMC Mainz, Mainz, Germany17German Cancer Consortium (DKTK), Heidelberg, Germany18Department of Tumor Biology, Moffitt Cancer Center and Research Institute, Tampa, FL, USA19Institute of Functional Genomics, University of Regensburg, Regensburg, Germany20Bristol-Myers Squibb, Redwood City, CA, USA21These authors contributed equally22Present address: Department of Physiological Chemistry, University of Veterinary Medicine Hannover, Hannover, Germany23Present address: Institute of Organic Chemistry, University of Stuttgart, Stuttgart, Germany24Lead Contact*Correspondence: [email protected]
https://doi.org/10.1016/j.celrep.2019.08.068
SUMMARY
Tumor-derived lactic acid inhibits T and natural killer(NK) cell function and, thereby, tumor immunosurveil-lance. Here, we report that melanoma patients withhigh expression of glycolysis-related genes show aworse progression free survival upon anti-PD1 treat-ment. The non-steroidal anti-inflammatory drug(NSAID) diclofenac lowers lactate secretion of tumorcells and improves anti-PD1-induced T cell killingin vitro. Surprisingly, diclofenac, but not otherNSAIDs, turnsout tobeapotent inhibitor of the lactatetransporters monocarboxylate transporter 1 and 4and diminishes lactate efflux. Notably, T cell activa-tion, viability, andeffector functionsarepreservedun-derdiclofenac treatmentand ina lowglucoseenviron-ment in vitro. Diclofenac, but not aspirin, delays tumor
CeThis is an open access article und
growth and improves the efficacy of checkpoint ther-apy in vivo. Moreover, genetic suppression of glycol-ysis in tumor cells strongly improves checkpoint ther-apy. These findings support the rationale for targetingglycolysis in patients with high glycolytic tumorstogether with checkpoint inhibitors in clinical trials.
INTRODUCTION
Immunotherapy with immune checkpoint inhibitors can over-
come T cell anergy and activate the anti-tumor immune
response, and yet, many patients still fail on such therapies (Ba-
lar and Weber, 2017; Migali et al., 2016; Sharma et al., 2017;
Zhao and Subramanian, 2017). The tumor microenvironment is
also characterized by nutrient competition and accumulation of
metabolites, which compromise T cell metabolism and function
and might contribute to the restricted response to checkpoint
ll Reports 29, 135–150, October 1, 2019 ª 2019 The Author(s). 135er the CC BY license (http://creativecommons.org/licenses/by/4.0/).

blockade (Anderson et al., 2017; Brand et al., 2016; Chang et al.,
2015; Colegio et al., 2014; Ho et al., 2015). Accordingly, combi-
nation strategies are being developed to target both metabolism
and immune checkpoints. Interestingly, the combination of im-
mune checkpoint inhibition with the non-steroidal anti-inflamma-
tory drug (NSAID) aspirin, which blocks cyclooxygenase (COX)
activity and prostaglandin E secretion (PGE2), has been shown
to augment the efficacy of checkpoint blockade (Zelenay et al.,
2015). However, in addition to elevated lipid metabolism and
COX expression, tumor cells are often characterized by
increased glycolytic activity that results in intratumoral lactate
accumulation and acidification. Furthermore, T and natural killer
(NK) cells take up lactic acid that impairs effector functions
(Fischer et al., 2007). Accordingly, strategies that impair tumor
cell glycolysis improve immunosurveillance and tumor growth
control (Brand et al., 2016; Long et al., 2018). In line with these
findings, tumor glucose fermentation inversely correlates with
T cell infiltration and overall survival (Ottensmeier et al., 2016;
Singer et al., 2011). Moreover, retrospective analyses have
shown that elevated lactate dehydrogenase (LDH) correlates
with poor prognosis and outcome in anti-PD1-treated patients
(Heppt et al., 2017; Kelderman et al., 2014; Wen et al., 2017).
Given these findings, there are efforts to develop effective
means to impair tumor glycolysis in order to improve the response
to checkpoint therapy. Targeting lactate transporters (monocar-
boxylate transporters [MCTs]) is a promising approach (Baek
et al., 2014; Doherty et al., 2014; Long et al., 2018; Marchiq
et al., 2015). Indeed, MCT1/2-selective inhibitors rapidly disable
glycolysis (Baek et al., 2014; Doherty et al., 2014; Marchiq et al.,
2015) and are currently tested in a phase 1 trial (https://www.
clinicaltrials.gov/ct2/show/NCT01791595). However, theefficacy
of such agents in reducing tumor cell lactate efflux can be limited
by co-expression of MCT4, which is frequently found on tumor
cells (Doherty et al., 2014; Le Floch et al., 2011; Marchiq et al.,
2015). Therefore, the simultaneous inhibition of MCT1/2 and
MCT4 transporters is likely required to significantly reduce lactic
acid secretion in the tumor milieu. Such agents could also target
immune cell metabolism and, thereby, impair their function, as in-
creases in glycolysis have been linked to the effector functions
e.g.of Tcells (Changet al., 2013; Freemermanetal., 2014;Gubser
et al., 2013; Kelly andO’Neill, 2015;Macintyre et al., 2014; van der
Windt andPearce, 2012).However, a recent study has shown that
the response to adoptiveT cell transfer canbe improvedbyglyco-
lytic inhibitors (Cascone et al., 2018) and genetic downregulation
of the lactate-generating enzyme LDHA improved the efficacy of
anti-PD-1 treatment (Daneshmandi et al., 2019).
Here, we tested the hypothesis whether pharmacological tar-
geting of tumor glycolysis could improve checkpoint blockade.
In support of this notion, a high glycolytic index negatively corre-
lated with progression-free survival in cancer patients treated
with anti-PD1 therapy. As diclofenac targets glucosemetabolism
not only in murine tumor models and cell lines but also in patients
with actinic keratosis (Gottfried et al., 2013; Singer et al., 2019),
we tested its impact on the efficacy of checkpoint therapy.
T-cell-mediated killing of tumor cells could be improved in an
in vitro coculture assay by pre-treating tumor cells with diclofe-
nac, which we identified as a potent inhibitor of MCT1 and
MCT4. Diclofenac spared the anti-tumor activity of effector
136 Cell Reports 29, 135–150, October 1, 2019
T cells in vitro and improved checkpoint therapy in two tumor
models. These findings support the concept of combining diclo-
fenac or other MCT inhibitors with immunotherapy.
RESULTS
Tumor Cell Glycolysis Limits the Response toCheckpoint InhibitionWe investigated whether local metabolic activity affects the
response to checkpoint therapy in biopsies of 47 melanoma pa-
tients prior to anti-PD-1 treatment (Table S1). A glycolytic index
based on the expression level of glycolysis-related genes was
calculated (Table S2) (https://meetinglibrary.asco.org/record/
156550/abstract). Patients with lower index levels had an
increased probability of longer progression-free survival times
(Figure 1A), even after adjustment for sex, age, pre-treatment,
stage, and location.
These patient data suggested that increased glycolytic activity
limits the efficacy of checkpoint therapy. Thus, targeting glucose
fermentation could improve response rates. As lactic acid in-
hibits T-cell-mediated killing (Brand et al., 2016), we investigated
whether reducing lactate secretion improves T-cell-mediated
killing of melanoma and pancreatic tumor cells in combination
with PD-L1 knockdown, resembling the application of anti-PD-
1 antibodies. As we have previously shown that diclofenac
impairs lactate efflux of tumor cells (Gottfried et al., 2013), mela-
noma (M579) and pancreatic cancer cells (PANC-1) were pre-
treated with diclofenac. Diclofenac diminished lactate secretion
in both tumor cell lines (Figure 1B) independent of any effect on
proliferation, as shown by normalization to cell number applying
the consumption and release profiling (CORE) method (Fig-
ure S1A; Jain et al., 2012). The viability of tumor cells and
T cells was not affected by 72 h of diclofenac treatment (Figures
S1B and S1C). More lactate was detected in supernatants of
melanoma cells compared to pancreatic cancer cells (Figure 1B).
T cells alone were not capable of killing tumor cells in both model
systems (Figure 1C). PD-L1 knockdownwas effective (Figure 1D)
but by itself insufficient to induce T-cell-mediated melanoma cell
killing (Figure 1C). High concentrations of lactic acid might sup-
press responses to checkpoint blockade. In line, reduction of
lactate secretion through diclofenac boosted T-cell-mediated
killing in PD-L1 knocked down melanoma cells (Figure 1C). In
contrast, aspirin, ketoprofen, or lumiracoxib had only a limited
effect on lactate secretion and killing (Figures 1E and 1F). In
contrast to melanoma cells, PD-L1 knockdown in pancreatic
cancer cells boosted T-cell-mediated killing (Figure 1C), which
was further enhanced by diclofenac. Adding lactic acid in tu-
mor-relevant concentrations reverted the positive effect of diclo-
fenac (Figure 1G). This effect can be explained by the fact that
T cells died under increasing lactic acid concentrations (Fig-
ure S1D), whereas pancreatic tumor cells tolerated the exoge-
nous addition of lactic acid in contrast toM579 cells (Figure S1C).
Taken together, reducing tumor efflux of lactate enhances the
immune response to checkpoint inhibition.
Diclofenac Directly Inhibits MCT1 and MCT4 ActivityAs some NSAIDs, including diclofenac, are monocarboxylates,
we hypothesized that diclofenac directly targets MCTs. We
A B C
D E F G
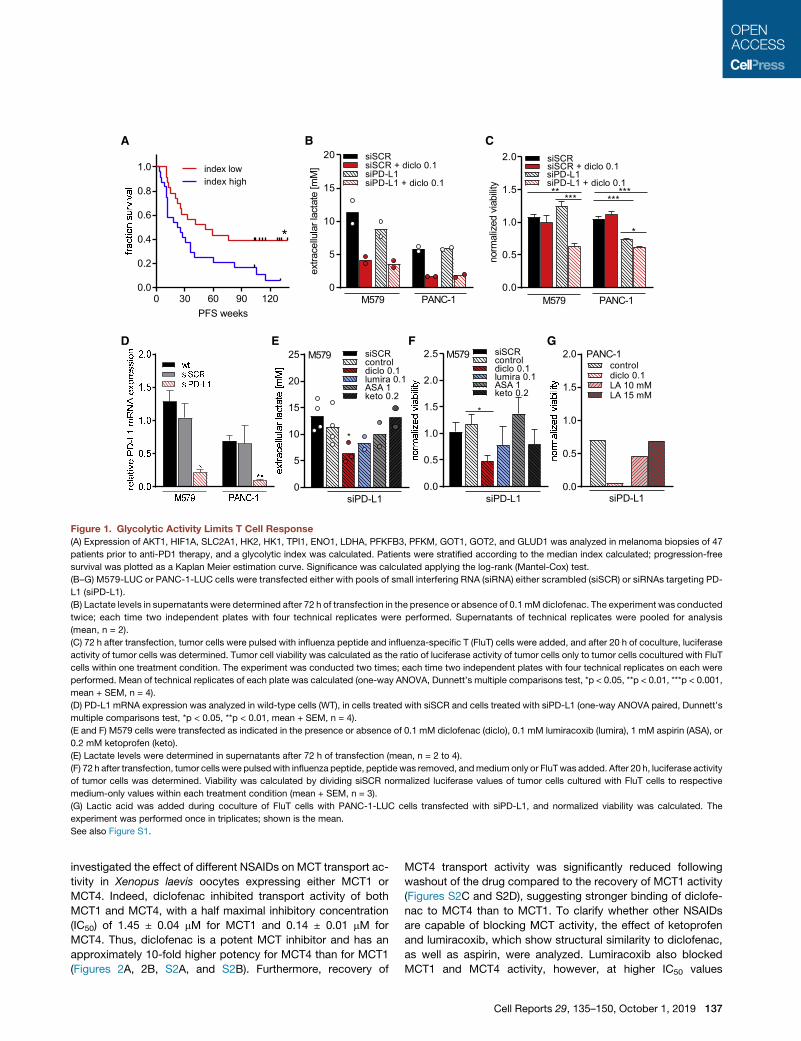
Figure 1. Glycolytic Activity Limits T Cell Response
(A) Expression of AKT1, HIF1A, SLC2A1, HK2, HK1, TPI1, ENO1, LDHA, PFKFB3, PFKM, GOT1, GOT2, and GLUD1 was analyzed in melanoma biopsies of 47
patients prior to anti-PD1 therapy, and a glycolytic index was calculated. Patients were stratified according to the median index calculated; progression-free
survival was plotted as a Kaplan Meier estimation curve. Significance was calculated applying the log-rank (Mantel-Cox) test.
(B–G) M579-LUC or PANC-1-LUC cells were transfected either with pools of small interfering RNA (siRNA) either scrambled (siSCR) or siRNAs targeting PD-
L1 (siPD-L1).
(B) Lactate levels in supernatants were determined after 72 h of transfection in the presence or absence of 0.1 mM diclofenac. The experiment was conducted
twice; each time two independent plates with four technical replicates were performed. Supernatants of technical replicates were pooled for analysis
(mean, n = 2).
(C) 72 h after transfection, tumor cells were pulsed with influenza peptide and influenza-specific T (FluT) cells were added, and after 20 h of coculture, luciferase
activity of tumor cells was determined. Tumor cell viability was calculated as the ratio of luciferase activity of tumor cells only to tumor cells cocultured with FluT
cells within one treatment condition. The experiment was conducted two times; each time two independent plates with four technical replicates on each were
performed. Mean of technical replicates of each plate was calculated (one-way ANOVA, Dunnett’s multiple comparisons test, *p < 0.05, **p < 0.01, ***p < 0.001,
mean + SEM, n = 4).
(D) PD-L1 mRNA expression was analyzed in wild-type cells (WT), in cells treated with siSCR and cells treated with siPD-L1 (one-way ANOVA paired, Dunnett’s
multiple comparisons test, *p < 0.05, **p < 0.01, mean + SEM, n = 4).
(E and F) M579 cells were transfected as indicated in the presence or absence of 0.1 mM diclofenac (diclo), 0.1 mM lumiracoxib (lumira), 1 mM aspirin (ASA), or
0.2 mM ketoprofen (keto).
(E) Lactate levels were determined in supernatants after 72 h of transfection (mean, n = 2 to 4).
(F) 72 h after transfection, tumor cells were pulsedwith influenza peptide, peptide was removed, andmedium only or FluTwas added. After 20 h, luciferase activity
of tumor cells was determined. Viability was calculated by dividing siSCR normalized luciferase values of tumor cells cultured with FluT cells to respective
medium-only values within each treatment condition (mean + SEM, n = 3).
(G) Lactic acid was added during coculture of FluT cells with PANC-1-LUC cells transfected with siPD-L1, and normalized viability was calculated. The
experiment was performed once in triplicates; shown is the mean.
See also Figure S1.
investigated the effect of different NSAIDs on MCT transport ac-
tivity in Xenopus laevis oocytes expressing either MCT1 or
MCT4. Indeed, diclofenac inhibited transport activity of both
MCT1 and MCT4, with a half maximal inhibitory concentration
(IC50) of 1.45 ± 0.04 mM for MCT1 and 0.14 ± 0.01 mM for
MCT4. Thus, diclofenac is a potent MCT inhibitor and has an
approximately 10-fold higher potency for MCT4 than for MCT1
(Figures 2A, 2B, S2A, and S2B). Furthermore, recovery of
MCT4 transport activity was significantly reduced following
washout of the drug compared to the recovery of MCT1 activity
(Figures S2C and S2D), suggesting stronger binding of diclofe-
nac to MCT4 than to MCT1. To clarify whether other NSAIDs
are capable of blocking MCT activity, the effect of ketoprofen
and lumiracoxib, which show structural similarity to diclofenac,
as well as aspirin, were analyzed. Lumiracoxib also blocked
MCT1 and MCT4 activity, however, at higher IC50 values
Cell Reports 29, 135–150, October 1, 2019 137
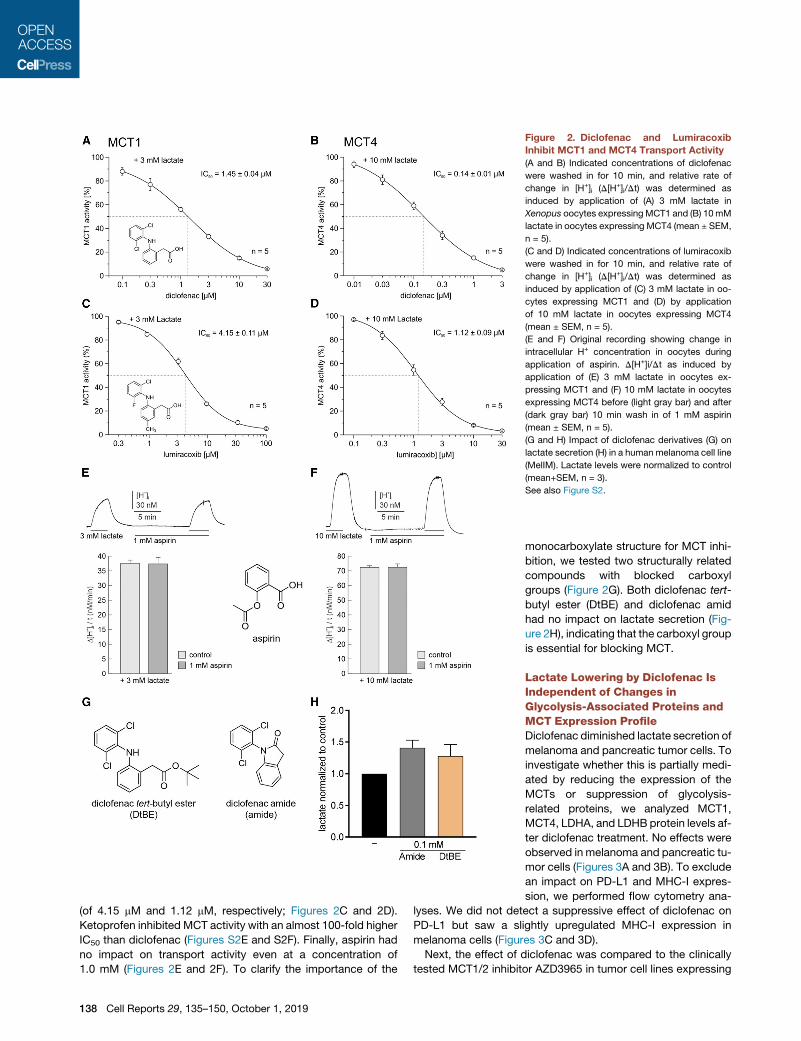
Figure 2. Diclofenac and Lumiracoxib
Inhibit MCT1 and MCT4 Transport Activity
(A and B) Indicated concentrations of diclofenac
were washed in for 10 min, and relative rate of
change in [H+]i (D[H+]i/Dt) was determined as
induced by application of (A) 3 mM lactate in
Xenopus oocytes expressingMCT1 and (B) 10mM
lactate in oocytes expressing MCT4 (mean ± SEM,
n = 5).
(C and D) Indicated concentrations of lumiracoxib
were washed in for 10 min, and relative rate of
change in [H+]i (D[H+]i/Dt) was determined as
induced by application of (C) 3 mM lactate in oo-
cytes expressing MCT1 and (D) by application
of 10 mM lactate in oocytes expressing MCT4
(mean ± SEM, n = 5).
(E and F) Original recording showing change in
intracellular H+ concentration in oocytes during
application of aspirin. D[H+]i/Dt as induced by
application of (E) 3 mM lactate in oocytes ex-
pressing MCT1 and (F) 10 mM lactate in oocytes
expressing MCT4 before (light gray bar) and after
(dark gray bar) 10 min wash in of 1 mM aspirin
(mean ± SEM, n = 5).
(G and H) Impact of diclofenac derivatives (G) on
lactate secretion (H) in a human melanoma cell line
(MelIM). Lactate levels were normalized to control
(mean+SEM, n = 3).
See also Figure S2.
(of 4.15 mM and 1.12 mM, respectively; Figures 2C and 2D).
Ketoprofen inhibited MCT activity with an almost 100-fold higher
IC50 than diclofenac (Figures S2E and S2F). Finally, aspirin had
no impact on transport activity even at a concentration of
1.0 mM (Figures 2E and 2F). To clarify the importance of the
138 Cell Reports 29, 135–150, October 1, 2019
monocarboxylate structure for MCT inhi-
bition, we tested two structurally related
compounds with blocked carboxyl
groups (Figure 2G). Both diclofenac tert-
butyl ester (DtBE) and diclofenac amid
had no impact on lactate secretion (Fig-
ure 2H), indicating that the carboxyl group
is essential for blocking MCT.
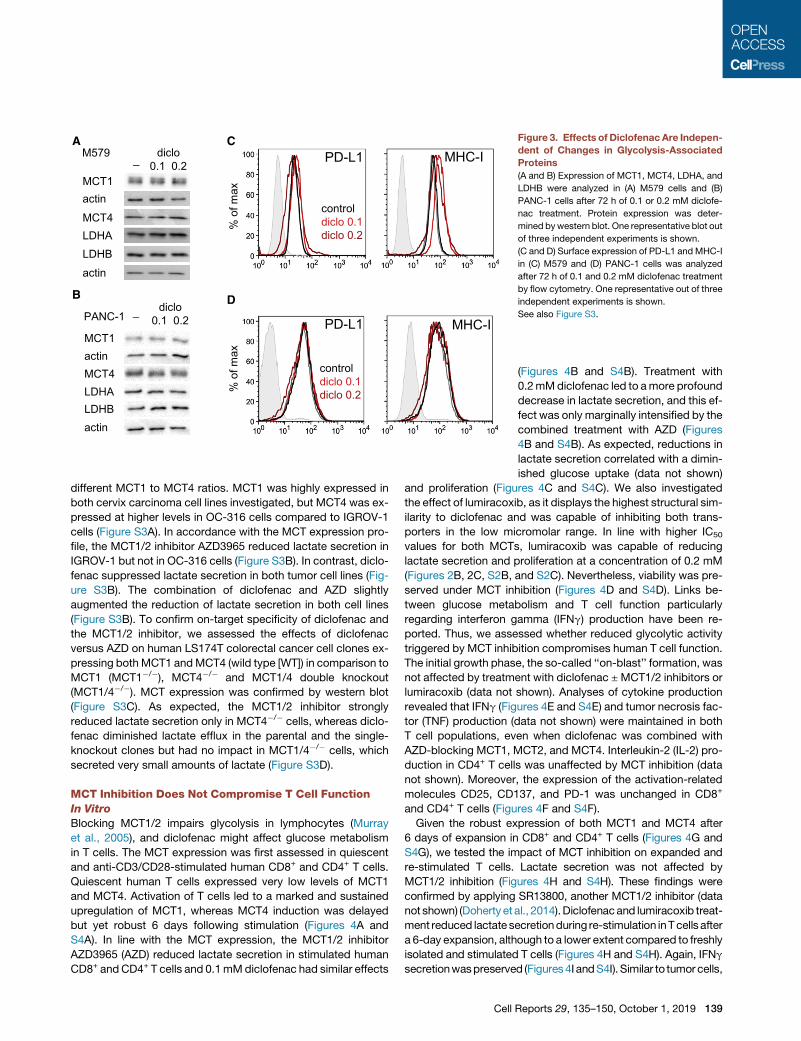
Lactate Lowering by Diclofenac IsIndependent of Changes inGlycolysis-Associated Proteins andMCT Expression ProfileDiclofenac diminished lactate secretion of
melanoma and pancreatic tumor cells. To
investigate whether this is partially medi-
ated by reducing the expression of the
MCTs or suppression of glycolysis-
related proteins, we analyzed MCT1,
MCT4, LDHA, and LDHB protein levels af-
ter diclofenac treatment. No effects were
observed in melanoma and pancreatic tu-
mor cells (Figures 3A and 3B). To exclude
an impact on PD-L1 and MHC-I expres-
sion, we performed flow cytometry ana-
lyses. We did not detect a suppressive effect of diclofenac on
PD-L1 but saw a slightly upregulated MHC-I expression in
melanoma cells (Figures 3C and 3D).
Next, the effect of diclofenac was compared to the clinically
tested MCT1/2 inhibitor AZD3965 in tumor cell lines expressing
A
B D
C Figure 3. Effects of Diclofenac Are Indepen-
dent of Changes in Glycolysis-Associated
Proteins
(A and B) Expression of MCT1, MCT4, LDHA, and
LDHB were analyzed in (A) M579 cells and (B)
PANC-1 cells after 72 h of 0.1 or 0.2 mM diclofe-
nac treatment. Protein expression was deter-
mined bywestern blot. One representative blot out
of three independent experiments is shown.
(C and D) Surface expression of PD-L1 andMHC-I
in (C) M579 and (D) PANC-1 cells was analyzed
after 72 h of 0.1 and 0.2 mM diclofenac treatment
by flow cytometry. One representative out of three
independent experiments is shown.
See also Figure S3.
different MCT1 to MCT4 ratios. MCT1 was highly expressed in
both cervix carcinoma cell lines investigated, but MCT4 was ex-
pressed at higher levels in OC-316 cells compared to IGROV-1
cells (Figure S3A). In accordance with the MCT expression pro-
file, the MCT1/2 inhibitor AZD3965 reduced lactate secretion in
IGROV-1 but not in OC-316 cells (Figure S3B). In contrast, diclo-
fenac suppressed lactate secretion in both tumor cell lines (Fig-
ure S3B). The combination of diclofenac and AZD slightly
augmented the reduction of lactate secretion in both cell lines
(Figure S3B). To confirm on-target specificity of diclofenac and
the MCT1/2 inhibitor, we assessed the effects of diclofenac
versus AZD on human LS174T colorectal cancer cell clones ex-
pressing both MCT1 andMCT4 (wild type [WT]) in comparison to
MCT1 (MCT1�/�), MCT4�/� and MCT1/4 double knockout
(MCT1/4�/�). MCT expression was confirmed by western blot
(Figure S3C). As expected, the MCT1/2 inhibitor strongly
reduced lactate secretion only in MCT4�/� cells, whereas diclo-
fenac diminished lactate efflux in the parental and the single-
knockout clones but had no impact in MCT1/4�/� cells, which
secreted very small amounts of lactate (Figure S3D).
MCT Inhibition Does Not Compromise T Cell FunctionIn Vitro
Blocking MCT1/2 impairs glycolysis in lymphocytes (Murray
et al., 2005), and diclofenac might affect glucose metabolism
in T cells. The MCT expression was first assessed in quiescent
and anti-CD3/CD28-stimulated human CD8+ and CD4+ T cells.
Quiescent human T cells expressed very low levels of MCT1
and MCT4. Activation of T cells led to a marked and sustained
upregulation of MCT1, whereas MCT4 induction was delayed
but yet robust 6 days following stimulation (Figures 4A and
S4A). In line with the MCT expression, the MCT1/2 inhibitor
AZD3965 (AZD) reduced lactate secretion in stimulated human
CD8+ andCD4+ T cells and 0.1mMdiclofenac had similar effects
Cell
(Figures 4B and S4B). Treatment with
0.2mMdiclofenac led to amore profound
decrease in lactate secretion, and this ef-
fect was only marginally intensified by the
combined treatment with AZD (Figures
4B and S4B). As expected, reductions in
lactate secretion correlated with a dimin-
ished glucose uptake (data not shown)
and proliferation (Figures 4C and S4C). We also investigated
the effect of lumiracoxib, as it displays the highest structural sim-
ilarity to diclofenac and was capable of inhibiting both trans-
porters in the low micromolar range. In line with higher IC50
values for both MCTs, lumiracoxib was capable of reducing
lactate secretion and proliferation at a concentration of 0.2 mM
(Figures 2B, 2C, S2B, and S2C). Nevertheless, viability was pre-
served under MCT inhibition (Figures 4D and S4D). Links be-
tween glucose metabolism and T cell function particularly
regarding interferon gamma (IFNg) production have been re-
ported. Thus, we assessed whether reduced glycolytic activity
triggered by MCT inhibition compromises human T cell function.
The initial growth phase, the so-called ‘‘on-blast’’ formation, was
not affected by treatment with diclofenac ±MCT1/2 inhibitors or
lumiracoxib (data not shown). Analyses of cytokine production
revealed that IFNg (Figures 4E and S4E) and tumor necrosis fac-
tor (TNF) production (data not shown) were maintained in both
T cell populations, even when diclofenac was combined with
AZD-blocking MCT1, MCT2, and MCT4. Interleukin-2 (IL-2) pro-
duction in CD4+ T cells was unaffected by MCT inhibition (data
not shown). Moreover, the expression of the activation-related
molecules CD25, CD137, and PD-1 was unchanged in CD8+
and CD4+ T cells (Figures 4F and S4F).
Given the robust expression of both MCT1 and MCT4 after
6 days of expansion in CD8+ and CD4+ T cells (Figures 4G and
S4G), we tested the impact of MCT inhibition on expanded and
re-stimulated T cells. Lactate secretion was not affected by
MCT1/2 inhibition (Figures 4H and S4H). These findings were
confirmed by applying SR13800, another MCT1/2 inhibitor (data
not shown) (Doherty et al., 2014).Diclofenacand lumiracoxib treat-
ment reduced lactate secretionduring re-stimulation inTcells after
a 6-day expansion, although to a lower extent compared to freshly
isolated and stimulated T cells (Figures 4H and S4H). Again, IFNg
secretionwaspreserved (Figures4I andS4I). Similar to tumorcells,
Reports 29, 135–150, October 1, 2019 139
A B C D
EF
G H
J K L
I
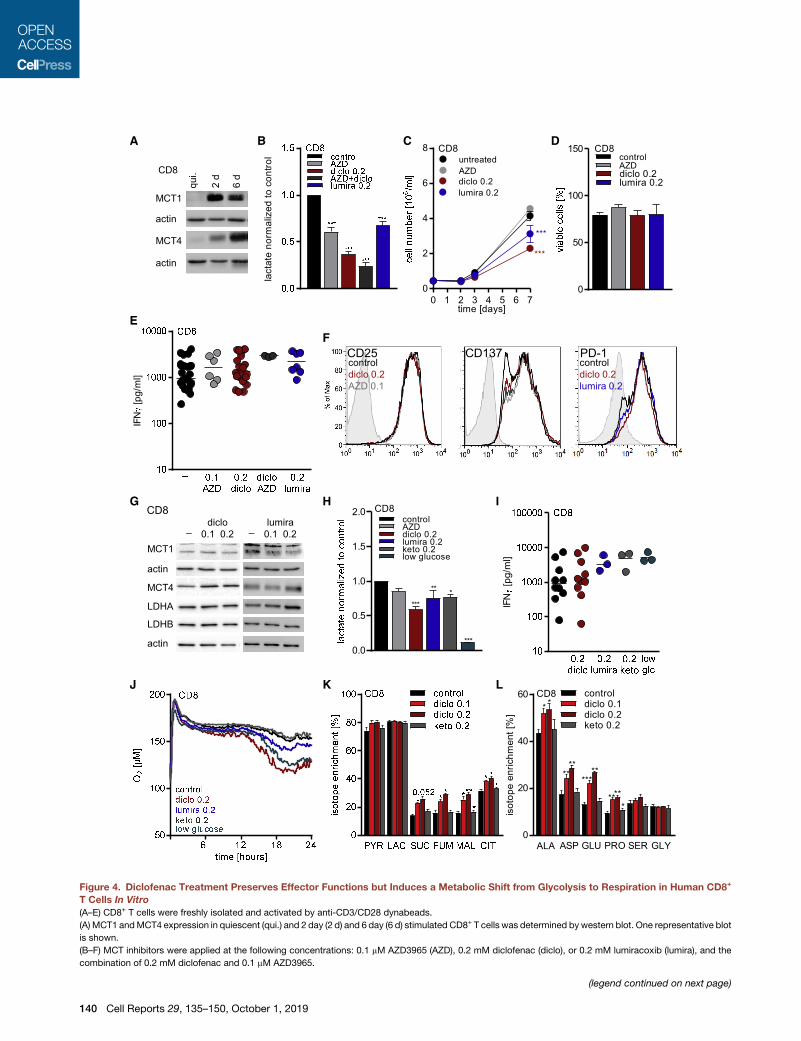
Figure 4. Diclofenac Treatment Preserves Effector Functions but Induces a Metabolic Shift from Glycolysis to Respiration in Human CD8+
T Cells In Vitro
(A–E) CD8+ T cells were freshly isolated and activated by anti-CD3/CD28 dynabeads.
(A) MCT1 andMCT4 expression in quiescent (qui.) and 2 day (2 d) and 6 day (6 d) stimulated CD8+ T cells was determined bywestern blot. One representative blot
is shown.
(B–F) MCT inhibitors were applied at the following concentrations: 0.1 mM AZD3965 (AZD), 0.2 mM diclofenac (diclo), or 0.2 mM lumiracoxib (lumira), and the
combination of 0.2 mM diclofenac and 0.1 mM AZD3965.
(legend continued on next page)
140 Cell Reports 29, 135–150, October 1, 2019
the expressionof glycolysis-relatedproteinswasnot affected (Fig-
ures 4G and S4G). The reduction in lactate secretion correlated
with a diminishedglucose uptake (data not shown), indicatingpro-
found changes inmetabolism. Therefore, the impact of diclofenac
on respiratory activity and glucose flux was analyzed in expanded
T cells. Diclofenac treatment resulted in elevated cellular oxygen
consumption (Figures 4J and S4J) and shifted glucose flux to
tricarboxylic acid cycle (TCA) metabolites (Figures 4K and S4K).
Moreover, glucose flux into amino acids related to TCA was
increased (Figures 4LandS4L). In comparison toblockingglucose
metabolism by MCT inhibition, we restricted the glucose level to
0.5mM, resulting fromserumaddition.Similar todiclofenacand lu-
miracoxib, low glucose conditions resulted in decreased extracel-
lular lactate levels (Figures 4H and S4H), preserved IFNg secretion
(Figures 4I and S4I), and elevated respiration (Figures 4J and S4J).
Finally, we applied ketoprofen to control for possible COX-medi-
ated effects. Ketoprofen exerted a slight impact on lactate secre-
tion inCD8+Tcellsbutnot inCD4+Tcells (Figures4HandS4H)and
did not affect IFNg secretion, respiration, or glucose flux (Figures
4I–4L and S4I–S4L).
Polyclonal activation of T cells by anti-CD3/CD28 stimulation
may not reflect responses observed following antigen presenta-
tion. Therefore, we assessed the effects of diclofenac on CD4+
T cells stimulated with allogeneic dendritic cells. Diclofenac
reduced glucosemetabolism and proliferation, but T cell effector
functions were preserved (Table S3).
As diclofenac might not completely block MCT1 and MCT4
activity in T cells, we assessed the impact of a complete inhibi-
tion of both transporters by using a MCT4�/� mouse model.
MCT4 loss was confirmed by western blot of splenic T cells (Fig-
ures 5A and 5B). T cell populations were stimulated with anti-
CD3/CD28 in the presence or absence of the MCT1/2 inhibitor
SR13800. MCT1/2 inhibition reduced lactate secretion by about
70% in WT T cells and by 90% in MCT4�/� T cells (Figures 5C
and 5D). MCT1/2 inhibition had no significant effect on IFNg
(B) Lactate levels were measured after 48 h in supernatants and normalized to con
differences between control and treated cells, ***p < 0.001; mean + SEM, n = 13 fo
lumiracoxib-treated CD8+ T cells).
(C) Proliferation of CD8+ T cells was monitored over 7 days. Cell number was mea
comparisons test, * shows significant differences between control and treated cel
for AZD3965, and n = 10 for lumiracoxib-treated CD8+ T cells).
(D) Viability of CD8+ T cells was determined after 7 days (mean + SEM, n = 17 for c
treated CD8+ T cells).
(E) IFNg levels secreted by CD8+ T cells were determined after 48 h in supernata
(F) Representative flow cytometry blots show expression of CD25 and CD137 in fr
in 6 day expanded and for 48 h re-stimulated T cells. The signal on quiescent T
(G–L) CD8+ T cells were isolated, activated with anti-CD3/CD28 dynabeads, an
Diclofenac was applied at 0.1 or 0.2 mM, AZD3965 at 0.1 mM, and lumiracoxib an
glucose-free medium supplemented with 10% human serum.
(G) MCT1, MCT4, LDHA, and LDHB protein expression was determined by west
(H) Lactate levels were measured in 48-h supernatants and normalized to contr
differences between control and treated cells, **p < 0.01, ***p < 0.001, mean + S
(I) IFNg levels in 48-h supernatants were determined by ELISA (median, each sy
(J) Oxygen consumption was measured by the PreSens technology (mean of thr
(K and L) Glucose flux into (K) intermediates of glycolysis and TCA cycle or (L) am
Dunnett’s multiple comparisons test, * shows significant differences between co
See also Figure S4.
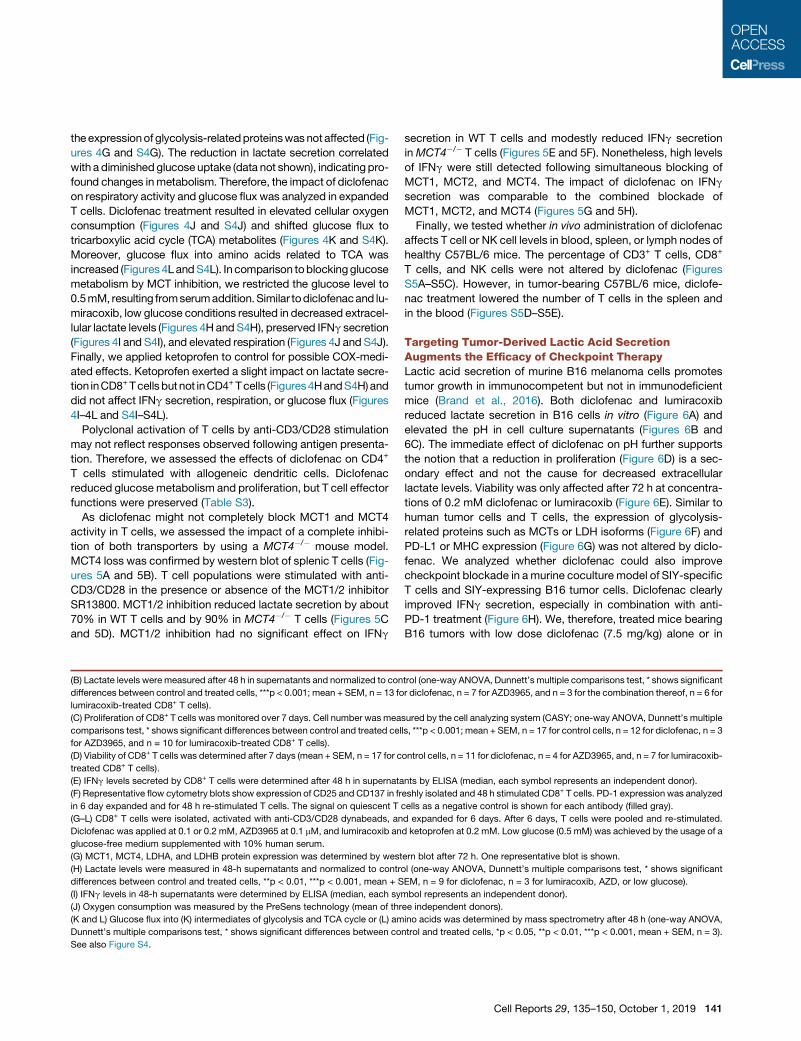
secretion in WT T cells and modestly reduced IFNg secretion
inMCT4�/� T cells (Figures 5E and 5F). Nonetheless, high levels
of IFNg were still detected following simultaneous blocking of
MCT1, MCT2, and MCT4. The impact of diclofenac on IFNg
secretion was comparable to the combined blockade of
MCT1, MCT2, and MCT4 (Figures 5G and 5H).
Finally, we tested whether in vivo administration of diclofenac
affects T cell or NK cell levels in blood, spleen, or lymph nodes of
healthy C57BL/6 mice. The percentage of CD3+ T cells, CD8+
T cells, and NK cells were not altered by diclofenac (Figures
S5A–S5C). However, in tumor-bearing C57BL/6 mice, diclofe-
nac treatment lowered the number of T cells in the spleen and
in the blood (Figures S5D–S5E).
Targeting Tumor-Derived Lactic Acid SecretionAugments the Efficacy of Checkpoint TherapyLactic acid secretion of murine B16 melanoma cells promotes
tumor growth in immunocompetent but not in immunodeficient
mice (Brand et al., 2016). Both diclofenac and lumiracoxib
reduced lactate secretion in B16 cells in vitro (Figure 6A) and
elevated the pH in cell culture supernatants (Figures 6B and
6C). The immediate effect of diclofenac on pH further supports
the notion that a reduction in proliferation (Figure 6D) is a sec-
ondary effect and not the cause for decreased extracellular
lactate levels. Viability was only affected after 72 h at concentra-
tions of 0.2 mM diclofenac or lumiracoxib (Figure 6E). Similar to
human tumor cells and T cells, the expression of glycolysis-
related proteins such as MCTs or LDH isoforms (Figure 6F) and
PD-L1 or MHC expression (Figure 6G) was not altered by diclo-
fenac. We analyzed whether diclofenac could also improve
checkpoint blockade in amurine coculture model of SIY-specific
T cells and SIY-expressing B16 tumor cells. Diclofenac clearly
improved IFNg secretion, especially in combination with anti-
PD-1 treatment (Figure 6H). We, therefore, treated mice bearing
B16 tumors with low dose diclofenac (7.5 mg/kg) alone or in
trol (one-way ANOVA, Dunnett’s multiple comparisons test, * shows significant
r diclofenac, n = 7 for AZD3965, and n = 3 for the combination thereof, n = 6 for
sured by the cell analyzing system (CASY; one-way ANOVA, Dunnett’s multiple
ls, ***p < 0.001; mean + SEM, n = 17 for control cells, n = 12 for diclofenac, n = 3
ontrol cells, n = 11 for diclofenac, n = 4 for AZD3965, and, n = 7 for lumiracoxib-
nts by ELISA (median, each symbol represents an independent donor).
eshly isolated and 48 h stimulated CD8+ T cells. PD-1 expression was analyzed
cells as a negative control is shown for each antibody (filled gray).
d expanded for 6 days. After 6 days, T cells were pooled and re-stimulated.
d ketoprofen at 0.2 mM. Low glucose (0.5 mM) was achieved by the usage of a
ern blot after 72 h. One representative blot is shown.
ol (one-way ANOVA, Dunnett’s multiple comparisons test, * shows significant
EM, n = 9 for diclofenac, n = 3 for lumiracoxib, AZD, or low glucose).
mbol represents an independent donor).
ee independent donors).
ino acids was determined by mass spectrometry after 48 h (one-way ANOVA,
ntrol and treated cells, *p < 0.05, **p < 0.01, ***p < 0.001, mean + SEM, n = 3).
Cell Reports 29, 135–150, October 1, 2019 141
A
C
B
D
FE
G H
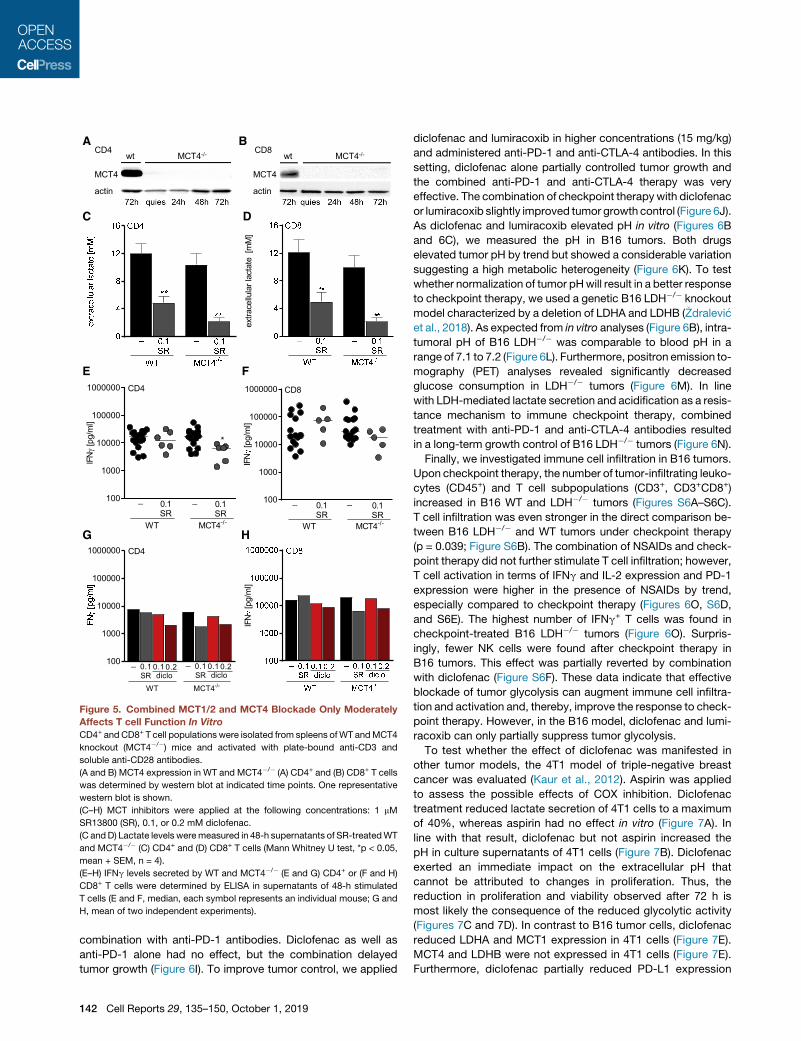
Figure 5. Combined MCT1/2 and MCT4 Blockade Only Moderately
Affects T cell Function In Vitro
CD4+ andCD8+ T cell populations were isolated from spleens ofWT andMCT4
knockout (MCT4�/�) mice and activated with plate-bound anti-CD3 and
soluble anti-CD28 antibodies.
(A and B) MCT4 expression in WT and MCT4�/� (A) CD4+ and (B) CD8+ T cells
was determined by western blot at indicated time points. One representative
western blot is shown.
(C–H) MCT inhibitors were applied at the following concentrations: 1 mM
SR13800 (SR), 0.1, or 0.2 mM diclofenac.
(C andD) Lactate levels weremeasured in 48-h supernatants of SR-treatedWT
and MCT4�/� (C) CD4+ and (D) CD8+ T cells (Mann Whitney U test, *p < 0.05,
mean + SEM, n = 4).
(E–H) IFNg levels secreted by WT and MCT4�/� (E and G) CD4+ or (F and H)
CD8+ T cells were determined by ELISA in supernatants of 48-h stimulated
T cells (E and F, median, each symbol represents an individual mouse; G and
H, mean of two independent experiments).
combination with anti-PD-1 antibodies. Diclofenac as well as
anti-PD-1 alone had no effect, but the combination delayed
tumor growth (Figure 6I). To improve tumor control, we applied
142 Cell Reports 29, 135–150, October 1, 2019
diclofenac and lumiracoxib in higher concentrations (15 mg/kg)
and administered anti-PD-1 and anti-CTLA-4 antibodies. In this
setting, diclofenac alone partially controlled tumor growth and
the combined anti-PD-1 and anti-CTLA-4 therapy was very
effective. The combination of checkpoint therapywith diclofenac
or lumiracoxib slightly improved tumor growth control (Figure 6J).
As diclofenac and lumiracoxib elevated pH in vitro (Figures 6B
and 6C), we measured the pH in B16 tumors. Both drugs
elevated tumor pH by trend but showed a considerable variation
suggesting a high metabolic heterogeneity (Figure 6K). To test
whether normalization of tumor pHwill result in a better response
to checkpoint therapy, we used a genetic B16 LDH�/� knockout
model characterized by a deletion of LDHA and LDHB (�Zdralevi�c
et al., 2018). As expected from in vitro analyses (Figure 6B), intra-
tumoral pH of B16 LDH�/� was comparable to blood pH in a
range of 7.1 to 7.2 (Figure 6L). Furthermore, positron emission to-
mography (PET) analyses revealed significantly decreased
glucose consumption in LDH�/� tumors (Figure 6M). In line
with LDH-mediated lactate secretion and acidification as a resis-
tance mechanism to immune checkpoint therapy, combined
treatment with anti-PD-1 and anti-CTLA-4 antibodies resulted
in a long-term growth control of B16 LDH�/� tumors (Figure 6N).
Finally, we investigated immune cell infiltration in B16 tumors.
Upon checkpoint therapy, the number of tumor-infiltrating leuko-
cytes (CD45+) and T cell subpopulations (CD3+, CD3+CD8+)
increased in B16 WT and LDH�/� tumors (Figures S6A–S6C).
T cell infiltration was even stronger in the direct comparison be-
tween B16 LDH�/� and WT tumors under checkpoint therapy
(p = 0.039; Figure S6B). The combination of NSAIDs and check-
point therapy did not further stimulate T cell infiltration; however,
T cell activation in terms of IFNg and IL-2 expression and PD-1
expression were higher in the presence of NSAIDs by trend,
especially compared to checkpoint therapy (Figures 6O, S6D,
and S6E). The highest number of IFNg+ T cells was found in
checkpoint-treated B16 LDH�/� tumors (Figure 6O). Surpris-
ingly, fewer NK cells were found after checkpoint therapy in
B16 tumors. This effect was partially reverted by combination
with diclofenac (Figure S6F). These data indicate that effective
blockade of tumor glycolysis can augment immune cell infiltra-
tion and activation and, thereby, improve the response to check-
point therapy. However, in the B16 model, diclofenac and lumi-
racoxib can only partially suppress tumor glycolysis.
To test whether the effect of diclofenac was manifested in
other tumor models, the 4T1 model of triple-negative breast
cancer was evaluated (Kaur et al., 2012). Aspirin was applied
to assess the possible effects of COX inhibition. Diclofenac
treatment reduced lactate secretion of 4T1 cells to a maximum
of 40%, whereas aspirin had no effect in vitro (Figure 7A). In
line with that result, diclofenac but not aspirin increased the
pH in culture supernatants of 4T1 cells (Figure 7B). Diclofenac
exerted an immediate impact on the extracellular pH that
cannot be attributed to changes in proliferation. Thus, the
reduction in proliferation and viability observed after 72 h is
most likely the consequence of the reduced glycolytic activity
(Figures 7C and 7D). In contrast to B16 tumor cells, diclofenac
reduced LDHA and MCT1 expression in 4T1 cells (Figure 7E).
MCT4 and LDHB were not expressed in 4T1 cells (Figure 7E).
Furthermore, diclofenac partially reduced PD-L1 expression
A B C D
FE
H I J
L M N O
G
K
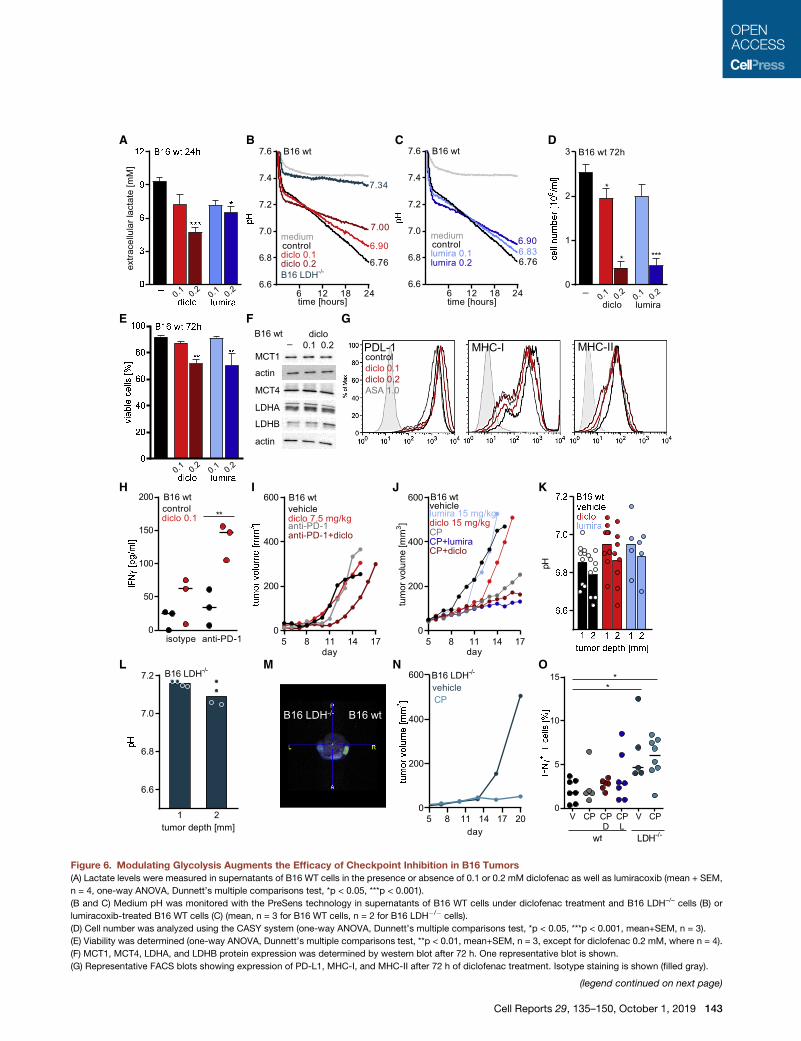
Figure 6. Modulating Glycolysis Augments the Efficacy of Checkpoint Inhibition in B16 Tumors
(A) Lactate levels were measured in supernatants of B16 WT cells in the presence or absence of 0.1 or 0.2 mM diclofenac as well as lumiracoxib (mean + SEM,
n = 4, one-way ANOVA, Dunnett’s multiple comparisons test, *p < 0.05, ***p < 0.001).
(B and C) Medium pH was monitored with the PreSens technology in supernatants of B16 WT cells under diclofenac treatment and B16 LDH–/– cells (B) or
lumiracoxib-treated B16 WT cells (C) (mean, n = 3 for B16 WT cells, n = 2 for B16 LDH�/� cells).
(D) Cell number was analyzed using the CASY system (one-way ANOVA, Dunnett’s multiple comparisons test, *p < 0.05, ***p < 0.001, mean+SEM, n = 3).
(E) Viability was determined (one-way ANOVA, Dunnett’s multiple comparisons test, **p < 0.01, mean+SEM, n = 3, except for diclofenac 0.2 mM, where n = 4).
(F) MCT1, MCT4, LDHA, and LDHB protein expression was determined by western blot after 72 h. One representative blot is shown.
(G) Representative FACS blots showing expression of PD-L1, MHC-I, and MHC-II after 72 h of diclofenac treatment. Isotype staining is shown (filled gray).
(legend continued on next page)
Cell Reports 29, 135–150, October 1, 2019 143
and increased MHC-I and MHC-II expression of 4T1 cells
(Figure 7F).
We injected 4T1 cells subcutaneously into BALB/c mice, and
at day 6, mice were treated with diclofenac or aspirin (Figure 7G).
Diclofenac delayed the growth of 4T1 tumors in vivo, whereas
aspirin had only a slight impact (Figure 7G). Diclofenac also
increased the intratumoral pH in this model (Figure 7H).
However, the measurement was difficult due to a dense tumor
structure. Therefore, these results have to be handled with
caution. In contrast to the B16 model in C57BL/6 mice, immune
cell infiltration (CD45+ cells) was improved by diclofenac in 4T1
tumors (p = 0.07; Figures S7A and S7B), although the portion
of CD8+ T cells among CD45+ cells was slightly decreased in
4T1 but not in B16 tumors (Figures S7C and S7D). Nevertheless,
the number of activated CD8+ T cells expressing CD25 was
elevated by trend under diclofenac treatment in both models
(Figures S7E and S7F). NK cell infiltration was consistently higher
after diclofenac treatment in both models (Figures 7G and 7H).
Furthermore, diclofenac elevated the number of IFNg+ NK cells
but had no effect on IL-2 expression in 4T1 tumors (Figures 7I
and 7J). Finally, among CD45+ leukocytes, CD11b+myeloid cells
represented themost frequent population and diclofenac had no
impact on CD11b+ cells (Figures S7I and S7J).
To investigate whether the observed changes in the immune
composition could be translated into a better response to check-
point therapy, we applied diclofenac or aspirin as a COX inhibitor
control in combination with checkpoint therapy also in the 4T1
model. Checkpoint inhibitors were administered every third
day for 1 week according to a previously developed protocol
(Selby et al., 2016), and NSAIDs were administered for
14 days. In mice receiving checkpoint inhibitors, tumor growth
was monitored for 30 days. Checkpoint blockade initially limited
tumor growth in 11 of 14 mice, and yet, tumor outgrowth was
observed after cessation of the drug in two more mice (Fig-
ure 7K). Aspirin had no positive impact on checkpoint blockade
in this model (Figure 7L). Notably, in the cohort receiving diclofe-
nac in combination with checkpoint blockade, tumor growth was
inhibited in all mice even after cessation of checkpoint blockade
as long as diclofenac was applied; only one tumor grew out after
termination of diclofenac treatment (Figure 7M). However, some
(H) B16.SIY WT cells and SIY-specific 2C CD8+ T cells were cocultured for 24 h
respective isotype control. IFNg levels were determined in supernatants by ELISA
symbol represents an independent experiment).
(I) 1.0 3 105 B16 WT cells were injected subcutaneously into the flank of C57BL
applied intraperitoneally (i.p.) daily (7.5 mg/kg); anti-PD-1 antibody (20 mg/kg bod
over time (median, n = 7 for vehicle and anti-PD-1, n = 8 for diclofenac and diclo
(J) 0.33 105 B16 WT cells were injected subcutaneously into the flank of C57BL/6
lumiracoxib were applied i.p. daily (both 15 mg/kg); anti-PD-1 and anti-CTLA-4
monitored over time (median, n = 9 for vehicle, n = 10 for checkpoint inhibitors c
(K and L) Tumor pH was measured using a pH meter either at 1 or 2 mm depth (
(K) pH of B16 WT tumors in vehicle-, diclofenac-, or lumiracoxib-treated mice wa
(L) pH in B16 LDH�/� tumors was measured.
(M) Glycolytic activity was determined in vivo by PET scan in B16 WT and LDH�/
image).
(N) 0.33 105 B16 LDH�/� cells were injected subcutaneously into the flank of C57
and anti-CTLA-4 antibodies (CP, 10 mg/kg body weight) were administered i.p.
(O) Percentage of CD3+IFNg+ T cells in B16 WT or LDH�/� tumors under indic
L, lumiracoxib) was measured by flow cytometry (median, each symbol represen
See also Figures S5, S6, and S7.
144 Cell Reports 29, 135–150, October 1, 2019
mice were found dead in the diclofenac treatment groups early
on, the basis of which is unknown as no necropsies were per-
formed in the first set of experiments. Due to these results, we
investigated toxicity in the B16 (C57BL/6) model from all treat-
ment groups. General histological analyses of lung, pancreas,
liver, kidney, bone marrow, and stomach were performed in 42
tumor-bearing animals from all treatment groups. Signs of
toxicity were detected in 2 out of 7 diclofenac-plus-check-
point-treated mice and 1 of these mice had to be terminated.
All other mice showed no signs of damage or inflammation in
the examined organs (Figures S7K and S7L). Furthermore, we
repeated the diclofenac treatment in the 4T1 model and no
mice had to be terminated in the new set of experiments. Taken
together, NSAIDs are known to induce gastrointestinal toxicity,
which is in line with the observed local bowel inflammation in
one mouse in the B16 model. This could be counteracted by
the administration of proton-pump inhibitors as pantoprazole.
DISCUSSION
Targeting the glycolytic phenotype of tumor cells represents a
promising approach from different perspectives. First, disabling
glucose catabolism can compromise tumor growth and survival
(Michelakis et al., 2008; Pedersen, 2012; Tennant et al., 2010).
Second, restricting glycolytic activity of tumor cells reduces
the secretion of lactate and acidification of the tumor milieu,
which impairs the anti-tumor immune response of T and NK cells
(Brand et al., 2016; Calcinotto et al., 2012; M€uller et al., 2000).
Accordingly, reducing intratumoral lactate levels and acidifica-
tion promotes immunosurveillance and augments the efficacy
of cancer immunotherapeutics (Brand et al., 2016; Calcinotto
et al., 2012; Cascone et al., 2018; Long et al., 2018; Pilon-
Thomas et al., 2016). In further support of this notion, Cascone
et al. (2018) showed improved efficacy of adoptive T cell transfer
in the presence of a glycolytic inhibitor. Our analyses of mela-
noma patients suggest a direct link between the response rate
to checkpoint therapy and the glycolytic activity of tumors. In
line with this, a negative correlation between overexpression of
metabolic genes and response to anti-PD-1 therapy has been re-
ported for renal cell carcinoma (Ascierto et al., 2016).
in the presence or absence of 0.1 mM diclofenac, anti-PD-1 antibody, or the
(one-way ANOVA, Tukey’s multiple comparisons test, **p < 0.01, median, each
/6 mice. Treatment was started when tumors were palpable. Diclofenac was
y weight) was administered i.p. every third day. Tumor volume was monitored
fenac + anti-PD-1).
mice, and treatment was started when tumors were palpable. Diclofenac and
(CP, both 10 mg/kg body weight) were administered i.p. Tumor volume was
ombined with NSAIDs, n = 4 for diclofenac, n = 5 for lumiracoxib).
median, each symbol represents one individual tumor).
s determined.
� tumors and injected into the right and left flank (shown is one representative
BL/6 mice, and treatment was started when tumors were palpable. Anti-PD-1
every third day (median, n = 10).
ated conditions (V, vehicle;, CP, anti-PD-1 and anti-CTLA-4; D, diclofenac;
ts one individual tumor).
A B C D
FE
G H I J
K L M
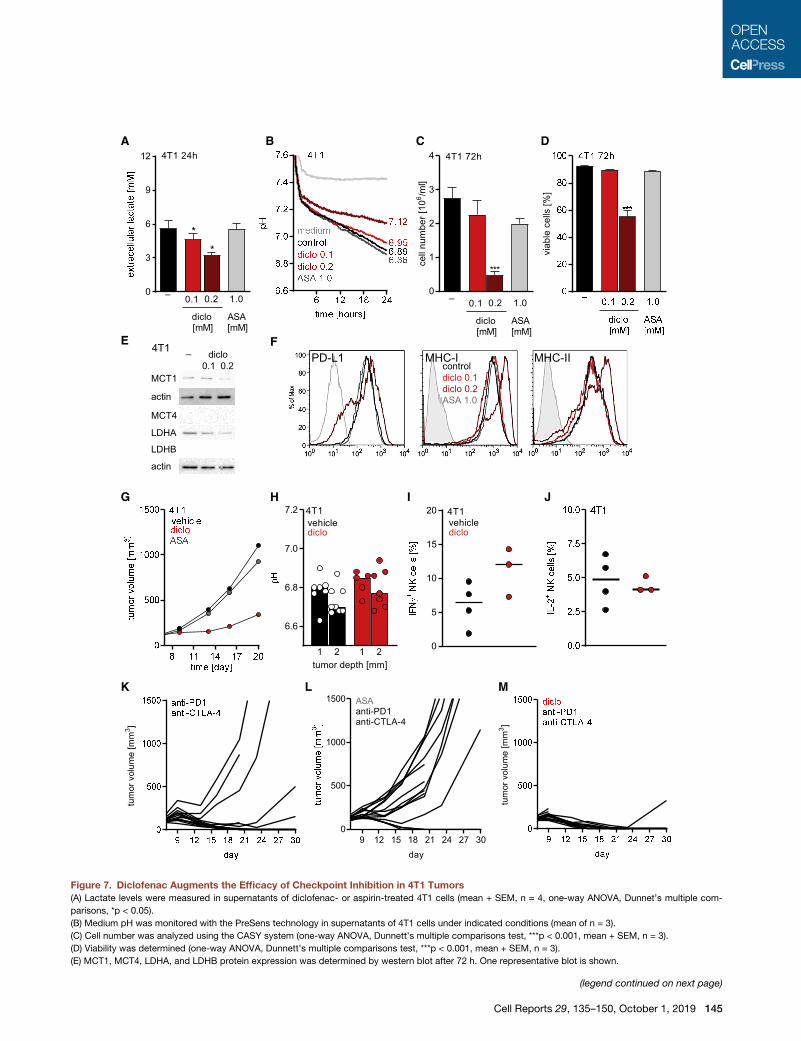
Figure 7. Diclofenac Augments the Efficacy of Checkpoint Inhibition in 4T1 Tumors
(A) Lactate levels were measured in supernatants of diclofenac- or aspirin-treated 4T1 cells (mean + SEM, n = 4, one-way ANOVA, Dunnet’s multiple com-
parisons, *p < 0.05).
(B) Medium pH was monitored with the PreSens technology in supernatants of 4T1 cells under indicated conditions (mean of n = 3).
(C) Cell number was analyzed using the CASY system (one-way ANOVA, Dunnett’s multiple comparisons test, ***p < 0.001, mean + SEM, n = 3).
(D) Viability was determined (one-way ANOVA, Dunnett’s multiple comparisons test, ***p < 0.001, mean + SEM, n = 3).
(E) MCT1, MCT4, LDHA, and LDHB protein expression was determined by western blot after 72 h. One representative blot is shown.
(legend continued on next page)
Cell Reports 29, 135–150, October 1, 2019 145
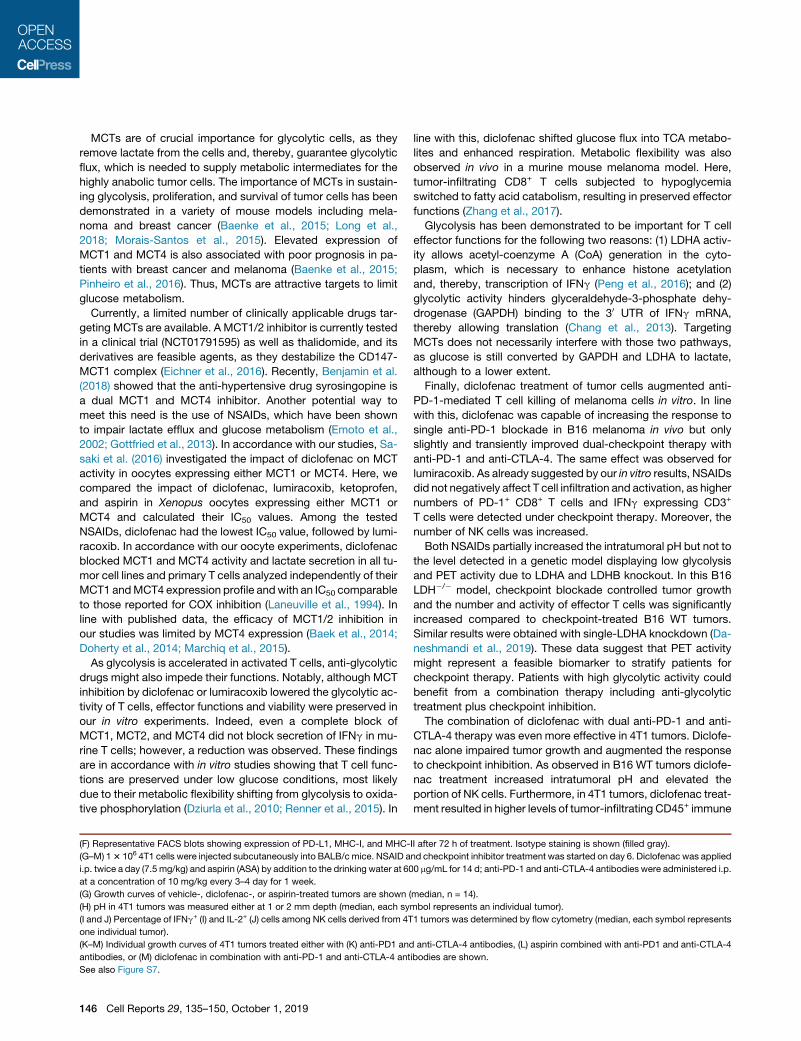
MCTs are of crucial importance for glycolytic cells, as they
remove lactate from the cells and, thereby, guarantee glycolytic
flux, which is needed to supply metabolic intermediates for the
highly anabolic tumor cells. The importance of MCTs in sustain-
ing glycolysis, proliferation, and survival of tumor cells has been
demonstrated in a variety of mouse models including mela-
noma and breast cancer (Baenke et al., 2015; Long et al.,
2018; Morais-Santos et al., 2015). Elevated expression of
MCT1 and MCT4 is also associated with poor prognosis in pa-
tients with breast cancer and melanoma (Baenke et al., 2015;
Pinheiro et al., 2016). Thus, MCTs are attractive targets to limit
glucose metabolism.
Currently, a limited number of clinically applicable drugs tar-
geting MCTs are available. A MCT1/2 inhibitor is currently tested
in a clinical trial (NCT01791595) as well as thalidomide, and its
derivatives are feasible agents, as they destabilize the CD147-
MCT1 complex (Eichner et al., 2016). Recently, Benjamin et al.
(2018) showed that the anti-hypertensive drug syrosingopine is
a dual MCT1 and MCT4 inhibitor. Another potential way to
meet this need is the use of NSAIDs, which have been shown
to impair lactate efflux and glucose metabolism (Emoto et al.,
2002; Gottfried et al., 2013). In accordance with our studies, Sa-
saki et al. (2016) investigated the impact of diclofenac on MCT
activity in oocytes expressing either MCT1 or MCT4. Here, we
compared the impact of diclofenac, lumiracoxib, ketoprofen,
and aspirin in Xenopus oocytes expressing either MCT1 or
MCT4 and calculated their IC50 values. Among the tested
NSAIDs, diclofenac had the lowest IC50 value, followed by lumi-
racoxib. In accordance with our oocyte experiments, diclofenac
blocked MCT1 and MCT4 activity and lactate secretion in all tu-
mor cell lines and primary T cells analyzed independently of their
MCT1 andMCT4 expression profile andwith an IC50 comparable
to those reported for COX inhibition (Laneuville et al., 1994). In
line with published data, the efficacy of MCT1/2 inhibition in
our studies was limited by MCT4 expression (Baek et al., 2014;
Doherty et al., 2014; Marchiq et al., 2015).
As glycolysis is accelerated in activated T cells, anti-glycolytic
drugs might also impede their functions. Notably, although MCT
inhibition by diclofenac or lumiracoxib lowered the glycolytic ac-
tivity of T cells, effector functions and viability were preserved in
our in vitro experiments. Indeed, even a complete block of
MCT1, MCT2, and MCT4 did not block secretion of IFNg in mu-
rine T cells; however, a reduction was observed. These findings
are in accordance with in vitro studies showing that T cell func-
tions are preserved under low glucose conditions, most likely
due to their metabolic flexibility shifting from glycolysis to oxida-
tive phosphorylation (Dziurla et al., 2010; Renner et al., 2015). In
(F) Representative FACS blots showing expression of PD-L1, MHC-I, and MHC-
(G–M) 13 106 4T1 cells were injected subcutaneously into BALB/c mice. NSAID a
i.p. twice a day (7.5 mg/kg) and aspirin (ASA) by addition to the drinking water at 60
at a concentration of 10 mg/kg every 3–4 day for 1 week.
(G) Growth curves of vehicle-, diclofenac-, or aspirin-treated tumors are shown (
(H) pH in 4T1 tumors was measured either at 1 or 2 mm depth (median, each sy
(I and J) Percentage of IFNg+ (I) and IL-2+ (J) cells among NK cells derived from 4T
one individual tumor).
(K–M) Individual growth curves of 4T1 tumors treated either with (K) anti-PD1 and
antibodies, or (M) diclofenac in combination with anti-PD-1 and anti-CTLA-4 ant
See also Figure S7.
146 Cell Reports 29, 135–150, October 1, 2019
line with this, diclofenac shifted glucose flux into TCA metabo-
lites and enhanced respiration. Metabolic flexibility was also
observed in vivo in a murine mouse melanoma model. Here,
tumor-infiltrating CD8+ T cells subjected to hypoglycemia
switched to fatty acid catabolism, resulting in preserved effector
functions (Zhang et al., 2017).
Glycolysis has been demonstrated to be important for T cell
effector functions for the following two reasons: (1) LDHA activ-
ity allows acetyl-coenzyme A (CoA) generation in the cyto-
plasm, which is necessary to enhance histone acetylation
and, thereby, transcription of IFNg (Peng et al., 2016); and (2)
glycolytic activity hinders glyceraldehyde-3-phosphate dehy-
drogenase (GAPDH) binding to the 30 UTR of IFNg mRNA,
thereby allowing translation (Chang et al., 2013). Targeting
MCTs does not necessarily interfere with those two pathways,
as glucose is still converted by GAPDH and LDHA to lactate,
although to a lower extent.
Finally, diclofenac treatment of tumor cells augmented anti-
PD-1-mediated T cell killing of melanoma cells in vitro. In line
with this, diclofenac was capable of increasing the response to
single anti-PD-1 blockade in B16 melanoma in vivo but only
slightly and transiently improved dual-checkpoint therapy with
anti-PD-1 and anti-CTLA-4. The same effect was observed for
lumiracoxib. As already suggested by our in vitro results, NSAIDs
did not negatively affect T cell infiltration and activation, as higher
numbers of PD-1+ CD8+ T cells and IFNg expressing CD3+
T cells were detected under checkpoint therapy. Moreover, the
number of NK cells was increased.
Both NSAIDs partially increased the intratumoral pH but not to
the level detected in a genetic model displaying low glycolysis
and PET activity due to LDHA and LDHB knockout. In this B16
LDH�/� model, checkpoint blockade controlled tumor growth
and the number and activity of effector T cells was significantly
increased compared to checkpoint-treated B16 WT tumors.
Similar results were obtained with single-LDHA knockdown (Da-
neshmandi et al., 2019). These data suggest that PET activity
might represent a feasible biomarker to stratify patients for
checkpoint therapy. Patients with high glycolytic activity could
benefit from a combination therapy including anti-glycolytic
treatment plus checkpoint inhibition.
The combination of diclofenac with dual anti-PD-1 and anti-
CTLA-4 therapy was even more effective in 4T1 tumors. Diclofe-
nac alone impaired tumor growth and augmented the response
to checkpoint inhibition. As observed in B16 WT tumors diclofe-
nac treatment increased intratumoral pH and elevated the
portion of NK cells. Furthermore, in 4T1 tumors, diclofenac treat-
ment resulted in higher levels of tumor-infiltrating CD45+ immune
II after 72 h of treatment. Isotype staining is shown (filled gray).
nd checkpoint inhibitor treatment was started on day 6. Diclofenac was applied
0 mg/mL for 14 d; anti-PD-1 and anti-CTLA-4 antibodies were administered i.p.
median, n = 14).
mbol represents an individual tumor).
1 tumors was determined by flow cytometry (median, each symbol represents
anti-CTLA-4 antibodies, (L) aspirin combined with anti-PD1 and anti-CTLA-4
ibodies are shown.
cells in vivo and reduced MCT1 and LDHA protein levels and
increased MHC-I and MHC-II surface expression in vitro. This
could probably contribute to the better response to checkpoint
therapy under diclofenac treatment. In contrast to a previous
study (Zelenay et al., 2015), single treatment with aspirin did
not alter tumor growth and failed to improve the efficacy of
checkpoint blockade. This could reflect the different tumor
models used, while NSAIDs might have tumor-specific effects,
or the differences in treatment regimens. In our study, aspirin
was administered after tumors were already established,
whereas Zelenay et al. (2015) administered aspirin prior to injec-
tion of the tumor cells. As aspirin administration did not improve
the efficacy of checkpoint therapy, COX inhibition might not be
the primary cause for the positive impact of diclofenac on anti-
PD1 and anti-CTLA-4 treatment.
Anti-tumor activity of diclofenac has been reported, and clin-
ical trials were claimed (Pantziarka et al., 2016). We recently
showed that topical administration of diclofenac in actinic kera-
tosis, a pre-cancerous skin lesion, reduced lactate levels and
increased IFNg expression in responders (Singer et al., 2019).
In line with this, the data of this study suggest that the main
impact of diclofenac on checkpoint therapy is the upregulated
IFNg expression in T and NK cells.
Taken together, our results suggest that diclofenac sup-
ports an immune-cell-mediated anti-tumor response by re-
programming tumor glycolysis. Drugs lowering glycolytic ac-
tivity by MCT or LDH inhibition represent a promising strategy
to improve the response to checkpoint therapy. Based on our
results, summarized in Table S4, diclofenac might be even
more potent in the human system. Murine tumor cells seem
to be less susceptible to lactate lowering by diclofenac, prob-
ably based on species-related structural differences in MCTs.
As diclofenac is well tolerated, especially when combined
with pantoprazole, our study provides a rationale for phase
1 trials combining diclofenac with immunotherapeutics
(patent pending).
STAR+METHODS
Detailed methods are provided in the online version of this paper
and include the following:
d KEY RESOURCES TABLE
d LEAD CONTACT AND MATERIALS AVAILABILITY
d EXPERIMENTAL MODEL AND SUBJECT DETAILS
B Mice
B Human Subjects
B Cell Lines and in Vitro Cultures
d METHOD DETAILS
B Analysis of Gene Expression in Human Melanoma
Samples
B Reverse siRNA Transfection of Tumor Cells
B Generation of Flu-Antigen Specific CD8+ T Cells (FluT)
B Luciferase-based Cytotoxicity Assay with Influenza-
specific CD8+ T cells
B Real-time Live Cell Imaging
B Determination of MCT Transport Activity
B T Cell Isolation, Stimulation and Culture
B In Vitro Analysis of CD8+ T Cells Cocultured with
B16.SIY Tumor Cells
B Determination of Cell Size and Cell Number
B Determination of Cytokines
B Determination of Glucose Metabolism
B13C6-Glucose Tracer Analysis
B Western Blot Analysis
B Monitoring of Oxygen Consumption and pH Develop-
ment in Vitro
B Determining Tumor pH
B18F-FDG micro-PET/magnetic Resonance Imaging
B Preparation of Mouse Tissue for Flow Cytometry
B Flow Cytometry
B Syngeneic Tumor Models
B Histology
B Synthesis of tert-butyl 2-(2-((2,6-dichlorophenyl)
amino)phenyl)acetate (Diclofenac tert-butyl ester,
DtBE)
B Chemicals
d QUANTIFICATION AND STATISTICAL ANALYSIS
d DATA AND CODE AVAILABILITY
SUPPLEMENTAL INFORMATION
Supplemental Information can be found online at https://doi.org/10.1016/j.
celrep.2019.08.068.
ACKNOWLEDGMENTS
We thank A. Peuker, G. Schoenhammer, M. Wehrstein, and E. Vollmer for their
excellent technical support.We are grateful to R.Meier (PreSens, Regensburg,
Germany) for intensive technical support. This study was supported by the
KFO262 (Deutsche Forschungsgemeinschaft, DFG); the Regensburg Center
of Interventional Immunology (RCI); II-ON Network; NIH/NCI R01 grant
CA175094; Moffitt Cancer Center support grant P30 CA076292; Cortner-
Couch Endowed Chair of Cancer Research; CRC1292 (Deutsche Forschungs-
gemeinschaft, DFG). The costs of publication of this article were defrayed in
part by the payment of page charges. This article must, therefore, be hereby
marked ‘‘advertisement’’ in accordance with 18 U.S.C. Section 1734 solely
to indicate this fact.
AUTHOR CONTRIBUTIONS
Conception and design, K.R. and M.K; Development of methodology, W.R.R.,
I.M., K.D., S.A., and M.L; Acquisition of data, K.R., H.M.B., G.K., M.F., L.H., C.
Bruss, A.-N.M., R.B., T. Bohn, S.P., M.M., K.E., S.A.L., O.K., E.A.R., S.F., L.A.,
C. Brummer, S.D., A.S., K.S., K.P., I.M., W.R.R., K.D., and M.S.; Analysis and
interpretation of data, K.R., A.S., H.M.B., S.A.L., O.K., G.K., E.A.R., S.O., S.W.,
M.F., E.G., T. Bohn, T. Bopp, K.E., S.A., C.U.B., J.P., J.L.C., P.J.O., K.D., P.B.,
M.S., and M.K.; Writing, review and/or revision of the manuscript, K.R.,
H.M.B., E.G., T. Bopp, T.P., S.A., C.U.B., A.S., P.J.S., O.K., E.A.R., C. Bruss,
S.O., W.H., J.P., J.L.C., M.S., P.B., and M.K.; Administrative, technical or ma-
terial support, R.B., T. Bohn, M.K., K.R., W.R.R., J.L.C., I.M., and J.P.
DECLARATION OF INTERESTS
K.R., M.K., C.U.B., and E.A.R. report research grants from BMS.
Received: October 27, 2018
Revised: August 5, 2019
Accepted: August 22, 2019
Published: October 1, 2019
Cell Reports 29, 135–150, October 1, 2019 147

REFERENCES
Anderson, K.G., Stromnes, I.M., and Greenberg, P.D. (2017). Obstacles Posed
by the Tumor Microenvironment to T cell Activity: A Case for Synergistic Ther-
apies. Cancer Cell 31, 311–325.
Andreesen, R., Scheibenbogen, C., Brugger, W., Krause, S., Meerpohl, H.G.,
Leser, H.G., Engler, H., and Lohr, G.W. (1990). Adoptive transfer of tumor cyto-
toxicmacrophages generated in vitro from circulating bloodmonocytes: a new
approach to cancer immunotherapy. Cancer Res. 50, 7450–7456.
Ascierto, M.L., McMiller, T.L., Berger, A.E., Danilova, L., Anders, R.A., Netto,
G.J., Xu, H., Pritchard, T.S., Fan, J., Cheadle, C., et al. (2016). The Intratumoral
Balance between Metabolic and Immunologic Gene Expression Is Associated
with Anti-PD-1 Response in Patients with Renal Cell Carcinoma. Cancer Im-
munol. Res. 4, 726–733.
Baek, G., Tse, Y.F., Hu, Z., Cox, D., Buboltz, N., McCue, P., Yeo, C.J., White,
M.A., DeBerardinis, R.J., Knudsen, E.S., and Witkiewicz, A.K. (2014). MCT4
defines a glycolytic subtype of pancreatic cancer with poor prognosis and
unique metabolic dependencies. Cell Rep. 9, 2233–2249.
Baenke, F., Dubuis, S., Brault, C., Weigelt, B., Dankworth, B., Griffiths, B.,
Jiang, M., Mackay, A., Saunders, B., Spencer-Dene, B., et al. (2015). Func-
tional screening identifies MCT4 as a key regulator of breast cancer cell meta-
bolism and survival. J. Pathol. 237, 152–165.
Balar, A.V., andWeber, J.S. (2017). PD-1 and PD-L1 antibodies in cancer: cur-
rent status and future directions. Cancer Immunol. Immunother. 66, 551–564.
Becker, H.M. (2014). Transport of lactate: characterization of the transporters
involved in transport at the plasmamembrane by heterologous protein expres-
sion on Xenopus oocytes. In Neuromethods, J. Hirrlinger and H.S. Waagepe-
tersen, eds. (Brain Energy Metabolism), pp. 25–43.
Becker, H.M., Broer, S., and Deitmer, J.W. (2004). Facilitated lactate transport
byMCT1when coexpressed with the sodium bicarbonate cotransporter (NBC)
in Xenopus oocytes. Biophys. J. 86, 235–247.
Becker, H.M., Klier, M., and Deitmer, J.W. (2014). Carbonic anhydrases and
their interplay with acid/base-coupled membrane transporters. Subcell. Bio-
chem. 75, 105–134.
Benjamin, D., Robay, D., Hindupur, S.K., Pohlmann, J., Colombi, M., El-Shem-
erly, M.Y., Maira, S.M., Moroni, C., Lane, H.A., and Hall, M.N. (2018). Dual In-
hibition of the Lactate Transporters MCT1 and MCT4 Is Synthetic Lethal with
Metformin due to NAD+ Depletion in Cancer Cells. Cell Rep. 25, 3047–
3058.e3044.
Bohn, T., Rapp, S., Luther, N., Klein, M., Bruehl, T.J., Kojima, N., Aranda Lo-
pez, P., Hahlbrock, J., Muth, S., Endo, S., et al. (2018). Tumor immunoevasion
via acidosis-dependent induction of regulatory tumor-associated macro-
phages. Nat. Immunol. 19, 1319–1329.
Brand, A., Singer, K., Koehl, G.E., Kolitzus, M., Schoenhammer, G., Thiel, A.,
Matos, C., Bruss, C., Klobuch, S., Peter, K., et al. (2016). LDHA-Associated
Lactic Acid Production Blunts Tumor Immunosurveillance by T and NK Cells.
Cell Metab. 24, 657–671.
Broer, S., Broer, A., Schneider, H.P., Stegen, C., Halestrap, A.P., and Deitmer,
J.W. (1999). Characterization of the high-affinity monocarboxylate transporter
MCT2 in Xenopus laevis oocytes. Biochem. J. 341, 529–535.
Calcinotto, A., Filipazzi, P., Grioni, M., Iero,M., DeMilito, A., Ricupito, A., Cova,
A., Canese, R., Jachetti, E., Rossetti, M., et al. (2012). Modulation of microen-
vironment acidity reverses anergy in human and murine tumor-infiltrating T
lymphocytes. Cancer Res. 72, 2746–2756.
Cascone, T., McKenzie, J.A., Mbofung, R.M., Punt, S., Wang, Z., Xu, C., Wil-
liams, L.J., Wang, Z., Bristow, C.A., Carugo, A., et al. (2018). Increased Tumor
Glycolysis Characterizes Immune Resistance to Adoptive T Cell Therapy. Cell
Metab. 27, 977–987.e974.
Chang, C.H., Curtis, J.D., Maggi, L.B., Jr., Faubert, B., Villarino, A.V., O’Sulli-
van, D., Huang, S.C., van der Windt, G.J., Blagih, J., Qiu, J., et al. (2013). Post-
transcriptional control of T cell effector function by aerobic glycolysis. Cell 153,
1239–1251.
148 Cell Reports 29, 135–150, October 1, 2019
Chang, C.H., Qiu, J., O’Sullivan, D., Buck, M.D., Noguchi, T., Curtis, J.D.,
Chen, Q., Gindin, M., Gubin, M.M., van der Windt, G.J., et al. (2015). Metabolic
Competition in the TumorMicroenvironment Is a Driver of Cancer Progression.
Cell 162, 1229–1241.
Colegio, O.R., Chu, N.Q., Szabo, A.L., Chu, T., Rhebergen, A.M., Jairam, V.,
Cyrus, N., Brokowski, C.E., Eisenbarth, S.C., Phillips, G.M., et al. (2014). Func-
tional polarization of tumour-associated macrophages by tumour-derived lac-
tic acid. Nature 513, 559–563.
Daneshmandi, S., Wegiel, B., and Seth, P. (2019). Blockade of Lactate Dehy-
drogenase-A (LDH-A) Improves Efficacy of Anti-Programmed Cell Death-1
(PD-1) Therapy in Melanoma. Cancers (Basel) 11, E450.
Deitmer, J.W. (1991). Electrogenic sodium-dependent bicarbonate secretion
by glial cells of the leech central nervous system. J. Gen. Physiol. 98, 637–655.
Dimmer, K.S., Friedrich, B., Lang, F., Deitmer, J.W., and Broer, S. (2000). The
low-affinity monocarboxylate transporter MCT4 is adapted to the export of
lactate in highly glycolytic cells. Biochem. J. 350, 219–227.
Doherty, J.R., Yang, C., Scott, K.E., Cameron, M.D., Fallahi, M., Li, W., Hall,
M.A., Amelio, A.L., Mishra, J.K., Li, F., et al. (2014). Blocking lactate export
by inhibiting the Myc target MCT1 Disables glycolysis and glutathione synthe-
sis. Cancer Res. 74, 908–920.
Dziurla, R., Gaber, T., Fangradt, M., Hahne, M., Tripmacher, R., Kolar, P.,
Spies, C.M., Burmester, G.R., and Buttgereit, F. (2010). Effects of hypoxia
and/or lack of glucose on cellular energy metabolism and cytokine production
in stimulated human CD4+ T lymphocytes. Immunol. Lett. 131, 97–105.
Eichner, R., Heider, M., Fernandez-Saiz, V., van Bebber, F., Garz, A.K., Le-
meer, S., Rudelius, M., Targosz, B.S., Jacobs, L., Knorn, A.M., et al. (2016).
Immunomodulatory drugs disrupt the cereblon-CD147-MCT1 axis to exert
antitumor activity and teratogenicity. Nat. Med. 22, 735–743.
Emoto, A., Ushigome, F., Koyabu, N., Kajiya, H., Okabe, K., Satoh, S., Tsuki-
mori, K., Nakano, H., Ohtani, H., and Sawada, Y. (2002). H(+)-linked transport
of salicylic acid, an NSAID, in the human trophoblast cell line BeWo. Am. J.
Physiol. Cell Physiol. 282, C1064–C1075.
Feist, M., Schwarzfischer, P., Heinrich, P., Sun, X., Kemper, J., von Bonin, F.,
Perez-Rubio, P., Taruttis, F., Rehberg, T., Dettmer, K., et al. (2018). Coopera-
tive STAT/NF-kB signaling regulates lymphomametabolic reprogramming and
aberrant GOT2 expression. Nat. Commun. 9, 1514.
Fischer, K., Hoffmann, P., Voelkl, S., Meidenbauer, N., Ammer, J., Edinger, M.,
Gottfried, E., Schwarz, S., Rothe, G., Hoves, S., et al. (2007). Inhibitory effect of
tumor cell-derived lactic acid on human T cells. Blood 109, 3812–3819.
Freemerman, A.J., Johnson, A.R., Sacks, G.N., Milner, J.J., Kirk, E.L.,
Troester, M.A., Macintyre, A.N., Goraksha-Hicks, P., Rathmell, J.C., and Ma-
kowski, L. (2014). Metabolic reprogramming of macrophages: glucose trans-
porter 1 (GLUT1)-mediated glucose metabolism drives a proinflammatory
phenotype. J. Biol. Chem. 289, 7884–7896.
Gottfried, E., Lang, S.A., Renner, K., Bosserhoff, A., Gronwald, W., Rehli, M.,
Einhell, S., Gedig, I., Singer, K., Seilbeck, A., et al. (2013). New aspects of an
old drug–diclofenac targets MYC and glucose metabolism in tumor cells.
PLoS One 8, e66987.
Gubser, P.M., Bantug, G.R., Razik, L., Fischer, M., Dimeloe, S., Hoenger, G.,
Durovic, B., Jauch, A., and Hess, C. (2013). Rapid effector function of memory
CD8+ T cells requires an immediate-early glycolytic switch. Nat. Immunol. 14,
1064–1072.
Heinrich, P., Kohler, C., Ellmann, L., Kuerner, P., Spang, R., Oefner, P.J., and
Dettmer, K. (2018). Correcting for natural isotope abundance and tracer impu-
rity in MS-, MS/MS- and high-resolution-multiple-tracer-data from stable
isotope labeling experiments with IsoCorrectoR. Sci. Rep. 8, 17910.
Heppt, M.V., Heinzerling, L., Kahler, K.C., Forschner, A., Kirchberger, M.C.,
Loquai, C., Meissner, M., Meier, F., Terheyden, P., Schell, B., et al. (2017).
Prognostic factors and outcomes in metastatic uveal melanoma treated with
programmed cell death-1 or combined PD-1/cytotoxic T-lymphocyte anti-
gen-4 inhibition. Eur. J. Cancer 82, 56–65.
Ho, P.C., Bihuniak, J.D., Macintyre, A.N., Staron, M., Liu, X., Amezquita, R.,
Tsui, Y.C., Cui, G., Micevic, G., Perales, J.C., et al. (2015).

Phosphoenolpyruvate Is a Metabolic Checkpoint of Anti-tumor T Cell Re-
sponses. Cell 162, 1217–1228.
Jain, M., Nilsson, R., Sharma, S., Madhusudhan, N., Kitami, T., Souza, A.L.,
Kafri, R., Kirschner, M.W., Clish, C.B., and Mootha, V.K. (2012). Metabolite
profiling identifies a key role for glycine in rapid cancer cell proliferation. Sci-
ence 336, 1040–1044.
Kaur, P., Nagaraja, G.M., Zheng, H., Gizachew, D., Galukande, M., Krishnan,
S., and Asea, A. (2012). A mouse model for triple-negative breast cancer tu-
mor-initiating cells (TNBC-TICs) exhibits similar aggressive phenotype to the
human disease. BMC Cancer 12, 120.
Kelderman, S., Heemskerk, B., van Tinteren, H., van den Brom, R.R., Hospers,
G.A., van den Eertwegh, A.J., Kapiteijn, E.W., de Groot, J.W., Soetekouw, P.,
Jansen, R.L., et al. (2014). Lactate dehydrogenase as a selection criterion for
ipilimumab treatment in metastatic melanoma. Cancer Immunol. Immunother.
63, 449–458.
Kelly, B., and O’Neill, L.A. (2015). Metabolic reprogramming in macrophages
and dendritic cells in innate immunity. Cell Res. 25, 771–784.
Laneuville, O., Breuer, D.K., Dewitt, D.L., Hla, T., Funk, C.D., and Smith, W.L.
(1994). Differential inhibition of human prostaglandin endoperoxide H syn-
thases-1 and -2 by nonsteroidal anti-inflammatory drugs. J. Pharmacol. Exp.
Ther. 271, 927–934.
Le Floch, R., Chiche, J., Marchiq, I., Naiken, T., Ilc, K., Murray, C.M., Critchlow,
S.E., Roux, D., Simon, M.P., and Pouyssegur, J. (2011). CD147 subunit of
lactate/H+ symporters MCT1 and hypoxia-inducible MCT4 is critical for ener-
getics and growth of glycolytic tumors. Proc. Natl. Acad. Sci. USA 108, 16663–
16668.
Loftus, R.M., Assmann, N., Kedia-Mehta, N., O’Brien, K.L., Garcia, A., Gilles-
pie, C., Hukelmann, J.L., Oefner, P.J., Lamond, A.I., Gardiner, C.M., et al.
(2018). Amino acid-dependent cMyc expression is essential for NK cell meta-
bolic and functional responses in mice. Nat. Commun. 9, 2341.
Long, Y., Gao, Z., Hu, X., Xiang, F., Wu, Z., Zhang, J., Han, X., Yin, L., Qin, J.,
Lan, L., et al. (2018). Downregulation of MCT4 for lactate exchange promotes
the cytotoxicity of NK cells in breast carcinoma. Cancer Med. 7, 4690–4700.
Machlenkin, A., Uzana, R., Frankenburg, S., Eisenberg, G., Eisenbach, L., Pit-
covski, J., Gorodetsky, R., Nissan, A., Peretz, T., and Lotem, M. (2008). Cap-
ture of tumor cell membranes by trogocytosis facilitates detection and isola-
tion of tumor-specific functional CTLs. Cancer Res. 68, 2006–2013.
Macintyre, A.N., Gerriets, V.A., Nichols, A.G., Michalek, R.D., Rudolph, M.C.,
Deoliveira, D., Anderson, S.M., Abel, E.D., Chen, B.J., Hale, L.P., and Rath-
mell, J.C. (2014). The glucose transporter Glut1 is selectively essential for
CD4 T cell activation and effector function. Cell Metab. 20, 61–72.
Marchiq, I., Le Floch, R., Roux, D., Simon, M.P., and Pouyssegur, J. (2015).
Genetic disruption of lactate/H+ symporters (MCTs) and their subunit
CD147/BASIGIN sensitizes glycolytic tumor cells to phenformin. Cancer
Res. 75, 171–180.
Michelakis, E.D., Webster, L., and Mackey, J.R. (2008). Dichloroacetate (DCA)
as a potential metabolic-targeting therapy for cancer. Br. J. Cancer 99,
989–994.
Migali, C., Milano, M., Trapani, D., Criscitiello, C., Esposito, A., Locatelli, M.,
Minchella, I., and Curigliano, G. (2016). Strategies to modulate the immune
system in breast cancer: checkpoint inhibitors and beyond. Ther. Adv. Med.
Oncol. 8, 360–374.
Morais-Santos, F., Granja, S., Miranda-Goncalves, V., Moreira, A.H., Queiros,
S., Vilaca, J.L., Schmitt, F.C., Longatto-Filho, A., Paredes, J., Baltazar, F., and
Pinheiro, C. (2015). Targeting lactate transport suppresses in vivo breast
tumour growth. Oncotarget 6, 19177–19189.
M€uller, B., Fischer, B., and Kreutz, W. (2000). An acidic microenvironment im-
pairs the generation of non-major histocompatibility complex-restricted killer
cells. Immunology 99, 375–384.
Murray, C.M., Hutchinson, R., Bantick, J.R., Belfield, G.P., Benjamin, A.D.,
Brazma, D., Bundick, R.V., Cook, I.D., Craggs, R.I., Edwards, S., et al.
(2005). Monocarboxylate transporter MCT1 is a target for immunosuppres-
sion. Nat. Chem. Biol. 1, 371–376.
Ottensmeier, C.H., Perry, K.L., Harden, E.L., Stasakova, J., Jenei, V., Fleming,
J., Wood, O., Woo, J., Woelk, C.H., Thomas, G.J., and Thirdborough, S.M.
(2016). Upregulated Glucose Metabolism Correlates Inversely with CD8+ T-
cell Infiltration and Survival in Squamous Cell Carcinoma. Cancer Res. 76,
4136–4148.
Pantziarka, P., Sukhatme, V., Bouche, G., Meheus, L., and Sukhatme, V.P.
(2016). Repurposing Drugs in Oncology (ReDO)-diclofenac as an anti-cancer
agent. Ecancermedicalscience 10, 610.
Pedersen, P.L. (2012). 3-Bromopyruvate (3BP) a fast acting, promising,
powerful, specific, and effective ‘‘small molecule’’ anti-cancer agent taken
from labside to bedside: introduction to a special issue. J. Bioenerg. Bio-
membr. 44, 1–6.
Peng, M., Yin, N., Chhangawala, S., Xu, K., Leslie, C.S., and Li, M.O. (2016).
Aerobic glycolysis promotes T helper 1 cell differentiation through an epige-
netic mechanism. Science 354, 481–484.
Pilon-Thomas, S., Kodumudi, K.N., El-Kenawi, A.E., Russell, S., Weber, A.M.,
Luddy, K., Damaghi, M.,Wojtkowiak, J.W., Mule, J.J., Ibrahim-Hashim, A., and
Gillies, R.J. (2016). Neutralization of Tumor Acidity Improves Antitumor Re-
sponses to Immunotherapy. Cancer Res. 76, 1381–1390.
Pinheiro, C., Miranda-Goncalves, V., Longatto-Filho, A., Vicente, A.L., Be-
rardinelli, G.N., Scapulatempo-Neto, C., Costa, R.F., Viana, C.R., Reis,
R.M., Baltazar, F., and Vazquez, V.L. (2016). The metabolic microenviron-
ment of melanomas: Prognostic value of MCT1 and MCT4. Cell Cycle 15,
1462–1470.
Qin, C., and Davies, H.M. (2013). Rh2(R-TPCP)4-catalyzed enantioselective
[3+2]-cycloaddition between nitrones and vinyldiazoacetates. J. Am. Chem.
Soc. 135, 14516–14519.
Renner, K., Geiselhoringer, A.L., Fante, M., Bruss, C., Farber, S., Schonham-
mer, G., Peter, K., Singer, K., Andreesen, R., Hoffmann, P., et al. (2015). Meta-
bolic plasticity of human T cells: Preserved cytokine production under glucose
deprivation or mitochondrial restriction, but 2-deoxy-glucose affects effector
functions. Eur. J. Immunol. 45, 2504–2516.
Sasaki, S., Futagi, Y., Ideno, M., Kobayashi, M., Narumi, K., Furugen, A., and
Iseki, K. (2016). Effect of diclofenac on SLC16A3/MCT4 by the Caco-2 cell line.
Drug Metab. Pharmacokinet. 31, 218–223.
Schroder, M.S., Culhane, A.C., Quackenbush, J., and Haibe-Kains, B. (2011).
survcomp: an R/Bioconductor package for performance assessment and
comparison of survival models. Bioinformatics 27, 3206–3208.
Selby, M.J., Engelhardt, J.J., Johnston, R.J., Lu, L.S., Han, M., Thudium, K.,
Yao, D., Quigley, M., Valle, J., Wang, C., et al. (2016). Preclinical Development
of Ipilimumab and Nivolumab Combination Immunotherapy: Mouse Tumor
Models, In Vitro Functional Studies, and Cynomolgus Macaque Toxicology.
PLoS One 11, e0161779.
Sharma, P., Hu-Lieskovan, S., Wargo, J.A., and Ribas, A. (2017). Primary,
Adaptive, and Acquired Resistance to Cancer Immunotherapy. Cell 168,
707–723.
Singer, K., Kastenberger, M., Gottfried, E., Hammerschmied, C.G., B€uttner,
M., Aigner, M., Seliger, B., Walter, B., Schlosser, H., Hartmann, A., et al.
(2011). Warburg phenotype in renal cell carcinoma: high expression of
glucose-transporter 1 (GLUT-1) correlates with low CD8(+) T-cell infiltration
in the tumor. Int. J. Cancer 128, 2085–2095.
Singer, K., Dettmer, K., Unger, P., Schonhammer, G., Renner, K., Peter, K.,
Siska, P.J., Berneburg, M., Herr, W., Oefner, P.J., et al. (2019). Topical Diclo-
fenac Reprograms Metabolism and Immune Cell Infiltration in Actinic Kera-
tosis. Front. Oncol. 9, 605.
Tennant, D.A., Duran, R.V., and Gottlieb, E. (2010). Targeting metabolic trans-
formation for cancer therapy. Nat. Rev. Cancer 10, 267–277.
van der Windt, G.J., and Pearce, E.L. (2012). Metabolic switching and fuel
choice during T-cell differentiation and memory development. Immunol. Rev.
249, 27–42.
Wen, X., Ding, Y., Li, J., Zhao, J., Peng, R., Li, D., Zhu, B., Wang, Y., Zhang, X.,
and Zhang, X. (2017). The experience of immune checkpoint inhibitors in
Cell Reports 29, 135–150, October 1, 2019 149
Chinese patients with metastatic melanoma: a retrospective case series. Can-
cer Immunol. Immunother. 66, 1153–1162.
�Zdralevi�c, M., Brand, A., Di Ianni, L., Dettmer, K., Reinders, J., Singer, K., Pe-
ter, K., Schnell, A., Bruss, C., Decking, S.M., et al. (2018). Double genetic
disruption of lactate dehydrogenases A and B is required to ablate the ‘‘War-
burg effect’’ restricting tumor growth to oxidative metabolism. J. Biol. Chem.
293, 15947–15961.
Zelenay, S., van der Veen, A.G., Bottcher, J.P., Snelgrove, K.J., Rogers, N.,
Acton, S.E., Chakravarty, P., Girotti, M.R., Marais, R., Quezada, S.A., et al.
150 Cell Reports 29, 135–150, October 1, 2019
(2015). Cyclooxygenase-Dependent Tumor Growth through Evasion of Immu-
nity. Cell 162, 1257–1270.
Zhang, Y., Kurupati, R., Liu, L., Zhou, X.Y., Zhang, G., Hudaihed, A., Filisio, F.,
Giles-Davis, W., Xu, X., Karakousis, G.C., et al. (2017). Enhancing CD8(+) T Cell
Fatty Acid Catabolismwithin aMetabolically Challenging TumorMicroenviron-
ment Increases the Efficacy of Melanoma Immunotherapy. Cancer Cell 32,
377–391.e379.
Zhao, X., and Subramanian, S. (2017). Intrinsic Resistance of Solid Tumors to
Immune Checkpoint Blockade Therapy. Cancer Res. 77, 817–822.

STAR+METHODS
KEY RESOURCES TABLE
REAGENT or RESOURCE SOURCE IDENTIFIER
Antibodies
Anti-Human CD4 (clone RPA-T4) BD Biosciences Cat# 561844, RRID:AB_11153855
Anti-Human CD8 (clone SK1) BioLegend Cat# 344712, RRID:AB_2044008
Anti-Human CD25 (clone M-A251) BD Biosciences Cat# 557741, RRID:AB_396847
Anti-Human CD137 (clone 4B4-1) Thermo Fisher Scientific Cat# 12-1379-42, RRID:AB_127208
Anti-Human CD152 (CTLA-4, clone BNI3) BD Biosciences Cat# 560939, RRID:AB_10563068
Anti-Human CD279 (PD-1, clone EH12.2H7) BioLegend Cat# 329908, RRID:AB_940475
Anti-Human CD274 (PD-L1, clone 29E.2A3) BioLegend Cat# 329708, RRID:AB_940360
Anti-Human HLA-ABC (clone G46-2.6) BD Biosciences Cat# 555554, RRID:AB_395937
Annexin-V BD Biosciences Cat# 556419, RRID:AB_2665412
7-AAD BD Biosciences Cat# 559925
Anti-Mouse CD3e (Clone 145-2C11) Thermo Fisher Scientific Cat# 11-0031-85, RRID:AB_464883
Anti-Mouse CD3e (clone 145-2C11) BD Biosciences Cat# 566494, RRID:AB_2744393
Anti-Mouse CD4 (clone RM4-5) Thermo Fisher Scientific Cat# 17-0042-82, RRID:AB_469323
Anti-Mouse CD4 (clone RM4-5) BioLegend Cat# 100528, RRID:AB_312729
Anti-Mouse CD4 (clone RM4-5) BioLegend Cat# 100559, RRID:AB_2562608
Anti-Mouse CD8a (clone 53-6.7) BD Biosciences Cat# 553036, RRID:AB_394573
Anti-Mouse CD8a (clone REA601) Miltenyi Biotec Cat# 130-109-247, RRID:AB_2659492
Anti-Mouse CD45 (clone 30-F11) BD Biosciences Cat# 553081, RRID:AB_394611
Anti-Mouse CD45 (clone REA737) Miltenyi Biotec Cat# 130-110-658, RRID:AB_2658217
Anti-Mouse CD274 (PD-L1, clone 10F.9G2) BioLegend Cat# 124311, RRID:AB_10612935
Anti-Mouse CD335 (NKp46, clone 29A1.4) BioLegend Cat# 137608, RRID:AB_10612758
Anti-Mouse NK1.1 (clone PK136) BioLegend Cat# 108741, RRID:AB_2562561
Anti-Mouse NK1.1 (clone PK136) Thermo Fisher Scientific Cat# 17-5941-82, RRID:AB_469479
Anti-Mouse IFNg (clone XMG1.2) BioLegend Cat# 505810, RRID:AB_315404
Anti-Mouse I-Ab (clone AF6-120.1) BioLegend Cat# 116405, RRID:AB_313724
Anti-Mouse I-A/I-E (clone M5/114.15.2) BioLegend Cat# 107607, RRID:AB_313322
Anti-Mouse H-2Kb (clone AF6-88.5) BD Biosciences Cat# 553570, RRID:AB_394928
Anti-Mouse H-2Dd (clone 34-2-12) BioLegend Cat# 110607, RRID:AB_313488
Anti-MCT1 Monoclonal Antibody (P14612) Thermo Fisher Scientific Cat# MA5-18288, RRID:AB_2539662
Anti-MCT1 Monoclonal Antibody (H-1) Santa Cruz Biotechnology Cat# sc-365501, RRID:AB_10841766
Anti-MCT4 Polyclonal Antibody (H-90) Santa Cruz Biotechnology Cat# sc-50329, RRID:AB_2189333
Anti-GLUT1 Polyclonal Antibody Abcam Cat# ab652, RRID:AB_305540
Anti-LDHA Polyclonal Antibody Cell Signaling Technology Cat# 2012, RRID:AB_2137173
Anti-LDHB Monoclonal Antibody (431.1) Santa Cruz Biotechnology Cat# sc-100775, RRID:AB_1124720
Anti-Actin Polyclonal Antibody Sigma-Aldrich Cat# A2066, RRID:AB_476693
Goat Anti- Rabbit Immunoglobulins antibody
(polyclonal)
Agilent (former Dako) Cat# P0448, RRID:AB_2617138
Goat Anti- Mouse Immunoglobulins antibody
(polyclonal)
Agilent (former Dako) Cat# P0447, RRID:AB_2617137
Anti-CD3e (unconjugated, clone 145-2C11) BD Biosciences Cat# 553057, RRID:AB_394590
Anti-CD28 (unconjugated, clone 37.51) BD Biosciences Cat# 553294, RRID:AB_394763
(Continued on next page)
Cell Reports 29, 135–150.e1–e9, October 1, 2019 e1

Continued
REAGENT or RESOURCE SOURCE IDENTIFIER
LEAF Purified Rat IgG2b, kappa Isotype
Ctrl antibody (coculture, clone RTK4530)
BioLegend Cat# 400622, RRID:AB_326564
LEAF Purified anti-Mouse CD279 (PD-1)
antibody (coculture, clone 29F.1A12)
BioLegend Cat# 135204, RRID:AB_1877087
anti-PD-1 antibody (in vivo, clone RMP1-14) Leinco Technologies, Inc. Cat# P372, RRID:AB_2749820
anti-PD-1 antibody (in vivo, clone 29F.1A12) Bio X Cell Cat# BE0273 RRID:AB_2687796
anti-PD-1 antibody (in vivo, clone 4H2) BMS N/A
anti-CTLA-4 (CD152) antibody
(in vivo, clone 9D9)
Bio X Cell Cat# BE0164, RRID:AB_10949609
anti-CTLA-4 (CD152) antibody
(in vivo, clone 9D9)
BMS N/A
Bacterial and Virus Strains
Biological Samples
Melanoma patient material the Netherlands Cancer Institute
Chemicals, Peptides, and Recombinant Proteins
FcR Blocking Reagent, mouse Miltenyi Biotec Cat# 130-092-575
Zombie NIR Fixable Viability Kit BioLegend Cat# 423106
Lipofectamine RNAiMAX Transfection Reagent Thermo Fisher Scientific Cat# 13778030
Dynabeads Human T-Activator CD3/CD28 Thermo Fisher Scientific Cat# 11132D
Recombinant Murine IFNg PeproTech Cat# 315-05
Recombinant Human IL-2 PeproTech 200-02
Recombinant Human IL-4 PeproTech 200-04
Recombinant Human IL-15 R&D systems 247-ILB-005/CF
Recombinant Human GM-CSF PeproTech 300-03
Protein Transport Inhibitor
(Containing Monensin)
BD Biosciences Cat# 554724
Intracellular Fixation and Permeabilization
Buffer Set
Thermo Fisher Scientific Cat# 88-8824-00
RIPA Buffer Sigma-Aldrich Cat# R0278
Diclofenac Sigma-Aldrich Cat# D6899
Lumiracoxib Selleckchem Cat# S2903
Acetyl salicylic acid Fagron Cat# 701627-0003
Ketoprofen Sigma-Aldrich Cat# 471909
AZD3965 Tocris Cat# 4960
SR13800 gift from Prof. Cleveland N/A
LPS ENZO Cat# ALX-581-009-L00213C Glucose (U-13C6) Cambridge Isotope Laboratories Cat# 110187-42-3
Flu peptide (GILGFVFTL) ProImmune P007-0A-E
Critical Commercial Assays
RNeasy Mini Kit QUIAGEN Cat# 74104
AllPrep DNA/RNA Mini Kit QUIAGEN Cat# 80204
CD4+ isolation kit, human Miltenyi Biotec Cat# 130-045-101
CD8+ isolation kit, human Miltenyi Biotec Cat# 130-045-201
CD4+ isolation kit, murine Miltenyi Biotec Cat# 130-049-201
CD8+ isolation kit, murine Miltenyi Biotec Cat# 130-104-075
Glucose (HK) Assay Kit Sigma-Aldrich Cat# GAHK20-1KT
Human IFNg DuoSet ELISA R&D Systems Cat# DY285
Human TNF DuoSet ELISA R&D Systems Cat# DY210
(Continued on next page)
e2 Cell Reports 29, 135–150.e1–e9, October 1, 2019
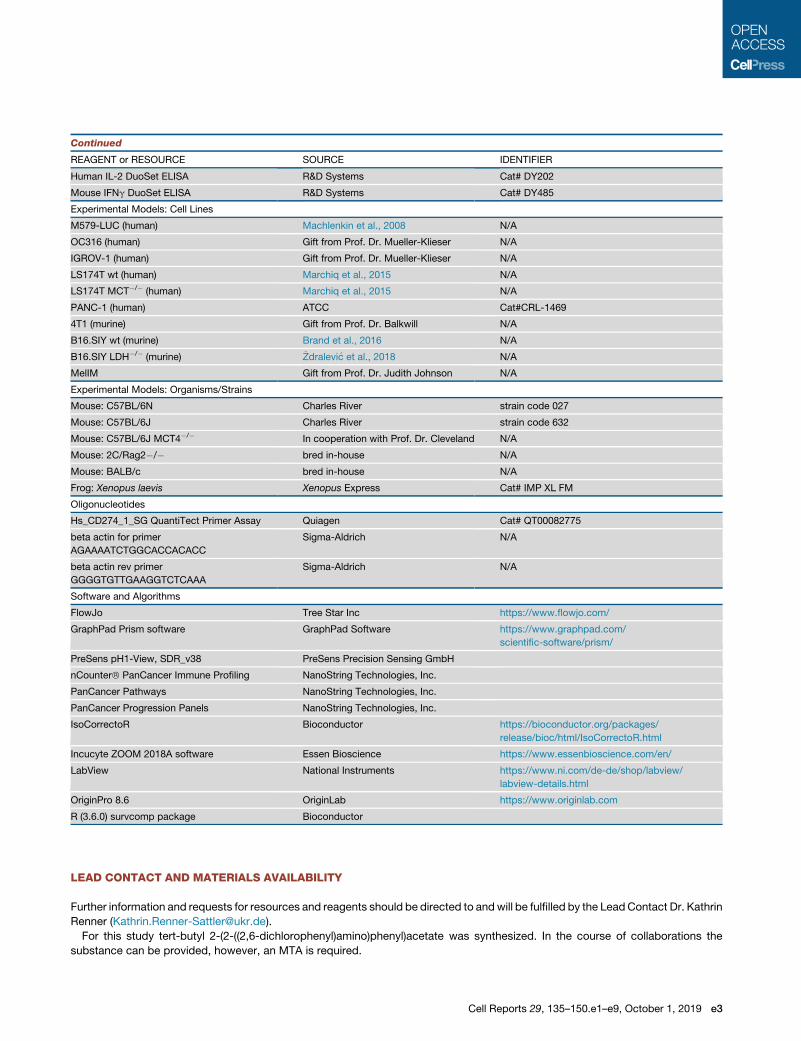
Continued
REAGENT or RESOURCE SOURCE IDENTIFIER
Human IL-2 DuoSet ELISA R&D Systems Cat# DY202
Mouse IFNg DuoSet ELISA R&D Systems Cat# DY485
Experimental Models: Cell Lines
M579-LUC (human) Machlenkin et al., 2008 N/A
OC316 (human) Gift from Prof. Dr. Mueller-Klieser N/A
IGROV-1 (human) Gift from Prof. Dr. Mueller-Klieser N/A
LS174T wt (human) Marchiq et al., 2015 N/A
LS174T MCT�/� (human) Marchiq et al., 2015 N/A
PANC-1 (human) ATCC Cat#CRL-1469
4T1 (murine) Gift from Prof. Dr. Balkwill N/A
B16.SIY wt (murine) Brand et al., 2016 N/A
B16.SIY LDH�/� (murine) �Zdralevi�c et al., 2018 N/A
MelIM Gift from Prof. Dr. Judith Johnson N/A
Experimental Models: Organisms/Strains
Mouse: C57BL/6N Charles River strain code 027
Mouse: C57BL/6J Charles River strain code 632
Mouse: C57BL/6J MCT4�/� In cooperation with Prof. Dr. Cleveland N/A
Mouse: 2C/Rag2�/� bred in-house N/A
Mouse: BALB/c bred in-house N/A
Frog: Xenopus laevis Xenopus Express Cat# IMP XL FM
Oligonucleotides
Hs_CD274_1_SG QuantiTect Primer Assay Quiagen Cat# QT00082775
beta actin for primer
AGAAAATCTGGCACCACACC
Sigma-Aldrich N/A
beta actin rev primer
GGGGTGTTGAAGGTCTCAAA
Sigma-Aldrich N/A
Software and Algorithms
FlowJo Tree Star Inc https://www.flowjo.com/
GraphPad Prism software GraphPad Software https://www.graphpad.com/
scientific-software/prism/
PreSens pH1-View, SDR_v38 PreSens Precision Sensing GmbH
nCounter� PanCancer Immune Profiling NanoString Technologies, Inc.
PanCancer Pathways NanoString Technologies, Inc.
PanCancer Progression Panels NanoString Technologies, Inc.
IsoCorrectoR Bioconductor https://bioconductor.org/packages/
release/bioc/html/IsoCorrectoR.html
Incucyte ZOOM 2018A software Essen Bioscience https://www.essenbioscience.com/en/
LabView National Instruments https://www.ni.com/de-de/shop/labview/
labview-details.html
OriginPro 8.6 OriginLab https://www.originlab.com
R (3.6.0) survcomp package Bioconductor
LEAD CONTACT AND MATERIALS AVAILABILITY
Further information and requests for resources and reagents should be directed to andwill be fulfilled by the LeadContact Dr. Kathrin
Renner ([email protected]).
For this study tert-butyl 2-(2-((2,6-dichlorophenyl)amino)phenyl)acetate was synthesized. In the course of collaborations the
substance can be provided, however, an MTA is required.
Cell Reports 29, 135–150.e1–e9, October 1, 2019 e3

EXPERIMENTAL MODEL AND SUBJECT DETAILS
MiceAnimal experiments on tumors were performed according to the regulations of the local government of W€urzburg, Germany and
permission was obtained from the Landesuntersuchungsamt Koblenz. C57BL/6J or C57BL/6N mice were purchased from Charles
River. For positron emission tomography (PET) and experiments analyzing the impact of drugs on healthy mice or on the growth of
B16.SIY wt and B16.SIY LDH�/� tumors, male and female, age-matched (10 – 18weeks) and sex-matchedC57BL/6micewere used.
To analyze MCT4 deficiency in immune cells in vitro, a MCT4�/� mouse model with a C57/BL6J background was used, kindly
provided by Prof. Dr. John L. Cleveland (Moffitt Cancer Center and Research Institute, Tampa, FL, USA). Experiments used age-
matched and sex-matched littermates.
Experiments analyzing the impact of drugs on tumor growth of 4T1 breast cancer cells were performed with female, 6 - 7 weeks old
BALB/c mice (Mark Selby, BMS).
Human SubjectsFor analyzing human T cells, the study was approved by the local ethics committee and all human participants gave written informed
consent (vote number 13-101-0240; 13-101-0238). Peripheral blood was collected from healthy donors (male and female, 18 to 60
years old) by leukapheresis or directly from leukocyte reduction system cones. For gene expression analysis in human melanoma
samples, the study (N03LAM) was approved by the Institutional Ethics Committee (the Netherlands Cancer Institute) and designed
and conducted in accordance with the Declaration of Helsinki. All patients gave written informed consent.
Cell Lines and in Vitro CulturesThe human cancer cell lines OC316 and IGROV-1 (gifts from Prof. Mueller-Kliesser, Medical University Mainz, Germany), LS174T wt,
LS174T MCT knockout clones (Marchiq et al., 2015), and the murine 4T1, B16.SIY wt and LDH�/� cells were cultured in RPMI 1640
(GIBCO, 31870-025), 10% fetal calf serum (Sigma, F7524), 2 mM glutamine (PAN Biotech, P04-80100) in a humidified atmosphere
(5% CO2, 95% air) at 37�C (Heraeus Incubator). The mouse 4T1 tumor cell line was a gift from Prof. F. Balkwill (Barts Cancer Institute,
Queen Mary University of London, UK). The B16.SIY LDH�/� was generated as previously described (�Zdralevi�c et al., 2018). The
PANC-1cell linewasacquired fromATCC.PANC-1-luc cellsweregeneratedafter transfectionwithaplasmidencoding for theGFP-lucif-
erase fusion protein (pEGFP-Luc plasmid) and for the G418-resistance gene. The M579-luc melanoma cells were provided by Prof.
Michal Lotem (Hadassah Hebrew University Medical Center, Israel) and generated as described (Machlenkin et al., 2008). The
PANC-1 and M579-luc cells were cultured in DMEM (high glucose, Sigma-Aldrich, D6429) supplemented with 10% FCS. For experi-
ments,cellswereseeded inmediumcontaining60%DMEM,30%RPMI1640, 10%destilledwaterwith10%FCS.Thehumanmelanoma
cell line MelIm was a gift from Prof. Dr. Judith Johnson, Institute for Immunology, Munich, Germany in 1993 and was cultured in RPMI.
METHOD DETAILS
Analysis of Gene Expression in Human Melanoma SamplesFor this analysis, patients treated with anti-PD-1 as first line checkpoint inhibition and of which pre-treatment tumor material was
available were included. All patients gave written informed consent for participation in a biobank study (longitudinal analysis of mel-
anoma-specific immunity in stage III and IVmelanoma patients) which was approved by the Institutional Ethics Committee (N03LAM,
the Netherlands Cancer Institute) and designed and conducted in accordance with the Declaration of Helsinki. Progression free sur-
vival was calculated from date of treatment start to the date of progression or death whichever occurred first. Progression was
defined as radiological progression according to immune related response criteria or clinical progression as defined by treating
physician when no radiographic imaging was performed before switch off therapy. RNA was isolated from formalin fixed, paraffin
embedded pre-treatment tumor samples using the QIAgen AllPrep DNA/RNA kit on the QIAcube according using standard manu-
facturer’s protocol. RNA expression profiling analysis was conducted with the nCounter� PanCancer Immune Profiling, PanCancer
Pathways, and PanCancer Progression Panels (Research Use Only. Not for use in Diagnostic Procedures) with custom 30 genes
spike-ins for each by NanoString Technologies (Seattle, WA, USA). A glycolytic index was calculated based on co-expression of
genes known to be involved in glycolytic metabolism as described in (https://meetinglibrary.asco.org/record/156550/abstract).
The numerical index score was calculated from log2 weighted expression of AKT1, HIF1A, SLC2A1, HK1, HK2, TPI1, ENO1,
LDHA, PFKFB3, PFKM, GOT1, GOT2, and GLUD1. After calculating the glycolytic/metabolic index, the median expression level
was calculated and patients divided into two groups, patients displaying an index below median level and index above median level
(n = 23 below; n = 24 above). Kaplan Meier estimation curve was plotted against progression free survival. A multi-variate Cox pro-
portional hazard model was fitted to glycolytic score correcting for sex, age, pre-treatment, stage, and location. All analyses were
performed in R (3.6.0) using the survcomp package (Schroder et al., 2011).
Reverse siRNA Transfection of Tumor CellsStably luciferase expressing PANC-1-LUC and M579-LUC cells were reverse transfected either with control siRNA (SCR) or siRNAs
targeting PD-L1 (siTOOLs Biotech). For siRNA transfection, RNAiMAX (Thermo Fisher Scientific) was used. 10 mL of 50 nM siRNA
e4 Cell Reports 29, 135–150.e1–e9, October 1, 2019

solution was added to each well of a 96-well plate. 0.1 mL of RNAiMAX transfection reagent was diluted in 9.9 mL of RPMI (Merck
Millipore) and incubated for 10 min at RT. 20 mL of RPMI was added and 30 mL of RNAiMAX mix was given to the wells coated
with siRNA and incubated for 30 min at RT. 2x10³ PANC-1-LUC cells or 1 3 104 M579-LUC cells were resuspended in 60 mL
DMEM medium containing 10% FCS, seeded in the siRNA-RNAiMAX containing wells and incubated for 72 h at 37�C, 5%CO2. 0.1 mM diclofenac was added to the corresponding wells 4 h after transfection. RNA was isolated using the RNeasy Mini Kit
(QIAGEN). Expression of PD-L1 was determined 72 h after transfection by RT-PCR using commercial primers (QIAGEN) and normal-
ized to beta actin (Sigma-Aldrich).
Generation of Flu-Antigen Specific CD8+ T Cells (FluT)For the generation of influenza (Flu)-specific CD8+ T (FluT) cells, PBMCs from HLA-A*02+ healthy donors were isolated. Total CD8+
T cells were sorted from PBMCs by magnetic separation and expanded in the presence of A2-matched Flu peptide (GILGFVFTL,
ProImmune, Oxford, UK) for 14 d. The autologous CD8+ negative fraction was irradiated and used for 1 week as feeder cells which
were then substituted by irradiated T2 cells. On day 1 and day 8, 100 U/mL IL-2 and 5 ng/mL IL-15 (R&D systems) were added. The
percentage of Flu-antigen specific T cells were determined by pentamer staining on day 7 and 14. After antigen-specific expansion,
FluT cells were sorted by FACS and expanded further for 14 d by using a rapid expansion protocol (https://insights.ovid.com/
pubmed?pmid=22421946).
Luciferase-based Cytotoxicity Assay with Influenza-specific CD8+ T cellsAfter 72 h of transfection with siRNA, PANC-1-LUC andM579-LUC cells were pulsedwith 0.01 mg/mLHLA-A*02matched Flu peptide
(GILGFVFTL, ProImmune, Oxford, UK) for 1 h at 37�C, 5% CO2. After pulsing, peptide-containing media was removed. For cytotox-
icity setting transfected cells were cocultured with influenza (Flu)-specific CD8+ T (FluT) cells. For the viability setting T cells or T cell
medium alone was added to transfected cells. After 21 h of coculture, supernatant was removed and remaining tumor cells were
lysed using 40 mL/well of cell lysis buffer for 15 min. After lysis, 60 mL per well of luciferase assay buffer was added and immediately
the luciferase intensity was measured by using a microplate reader (TECAN). Luciferase activity (relative light units = RLUs) was
normalized to scramble control. Next, tumor cell viability was calculated as the ratio of luciferase activity of tumor cells only to tumor
cells cocultured with FluT cells within one treatment condition.
Real-time Live Cell Imaging13 105 FluT cells were seeded per well in a 96-well flat-bottom plate and kept in 100 mL RPMI medium supplemented with Penicillin/
Streptomycin, HEPES, b-mercapthoethanol (all GIBCO) and 10% AB serum (Valley Biomedical) containing the YOYO-1 Iodide dye
(491/509, 1:10000, Thermo Fisher Scientific). After seeding, cells were treated either with 0.1 mM diclofenac or with indicated con-
centrations of lactic acid. Plates were incubated in the Incucyte ZOOM live-cell imager (Essen Bioscience, Welwyn Garden City, UK)
at 37�C and 5% CO2 and images were acquired at the indicated time points. Data were analyzed with the Incucyte ZOOM 2018A
software (Essen Bioscience) by generating a top-hat filter-based mask for the calculation the area of YOYO-1 incorporated dead
cells.
Determination of MCT Transport ActivitycDNA encoding for rat MCT1 and rat MCT4, respectively, was cloned into the oocyte expression vector pGEM-He-Juel andwas tran-
scribed in vitrowith T7 RNA-Polymerase (Invitrogen Ambion mMessage mMachine, Fisher Scientific, AM1344) as described (Becker
et al., 2004, 2014). Xenopus laevis females were purchased from Xenopus Express (IMP XL FM). Segments of ovarian lobules were
surgically removed under sterile conditions from frogs anaesthetized with 1 g/l of 3-amino-benzoic acid ethylester (MS-222, Sigma-
Aldrich, E10521), and rendered hypothermic. The procedure was approved by the Landesuntersuchungsamt Rheinland-Pfalz,
Koblenz (23 177-07/A07-2-003 x6). As described earlier (Becker et al., 2004, 2014), oocytes were singularized by collagenase
(Collagenase A, Roche, 10103586001) treatment in Ca2+-free oocyte saline (pH 7.8) at 28�C for 2 h. The singularized oocytes
were left overnight in an incubator at 18�C in Ca2+-containing oocyte saline (pH 7.8) to recover. Oocytes of the stages V and VI
were injected with 5 ng of cRNA coding for MCT1 or MCT4. Measurements were carried out 3 to 6 days after injection of cRNA.
The oocyte saline had the following composition: 82.5 mM NaCl (Carl Roth, 3957.2), 2.5 mM KCl (Sigma Aldrich, 60130), 1 mM
CaCl2 (Merck, A935182), 1 mM MgCl2 (Merck, A748033), 1 mM Na2HPO4 (Sigma Aldrich, 30427), 5 mM HEPES (Carl Roth,
9105.3); titrated with NaOH (Carl Roth, 9356.1) to pH 7.0. In lactate-containing saline, NaCl was substituted by Na-L-lactate (Sigma
Aldrich, 71718) in equimolar amounts. NSAIDs were dissolved in ddH2O and added to the saline shortly before the experiment. MCT
transport activity in oocytes was determined by measuring changes in intracellular H+ concentration with ion-sensitive microelec-
trodes under voltage-clamp conditions, using single-barreled microelectrodes (Becker et al., 2004, 2014; Broer et al., 1999; Deitmer,
1991; Dimmer et al., 2000). The manufacture and application have been described in detail previously (Becker, 2014; Deitmer, 1991).
As described (Broer et al., 1999), optimal pH changes were detected when the electrode was located near the inner surface of the
plasmamembrane. During all measurements, oocytes were clamped to a holding potential of�40mV using an additional microelec-
trode, filled with 3 M KCl and connected to an Axoclamp 2B amplifier (Axon Instruments). All experiments were carried out at room
temperature. The measurements were stored digitally using custom-made PC software based on the program LabView (National
Instruments). The rate of change of themeasured [H+]i (D[H+]/Dt) was analyzed by determining the slope of a linear regression fit using
Cell Reports 29, 135–150.e1–e9, October 1, 2019 e5
OriginPro 8.6 (OriginLab). Conversion and analysis of the data have been described in detail previously (Becker, 2014). For determi-
nation of IC50 values transport activity of MCT1 and MCT4 was first determined by measuring D[H+]/Dt during application of 3 and
10mM lactate, respectively. The two concentrations were chosen according to the transporters Km values (Dimmer et al., 2000). After
washout of lactate theNSAIDwas applied for 10min before application of lactate in the presence of NSAID. To determine the effect of
a given NSAID concertation on MCT activity, D[H+]/Dt, induced by the lactate pulse in the presence of NSAID was calculated as% of
theD[H+]/Dt induced by the lactate pulse in the absence of NSAID in the same cell. This procedure was carried out five times for every
NSAID concentration. The resulting data points were fitted with a Hill equation using OriginPro 8.6.
T Cell Isolation, Stimulation and CultureHuman T cells: Peripheral bloodmononuclear cells were isolated by density gradient centrifugation over Ficoll/Hypaque as described
(Andreesen et al., 1990) and T cells were isolated by magnetic bead separation. T cell purity was ˃98% determined by CD4 (BD
Bioscience) and CD8 (BioLegend) expression by flow cytometry. T cells were cultured in RPMI 1640 (GIBCO, 31870-025) or RPMI
1640 without glucose (Sigma-Aldrich, R1383-1L) supplemented with 10% human AB serum (BRK, Bavarian Red Cross), 2 mM
L-glutamine (PAN-Biotech, P04-80100), essential vitamins (GIBCO, 1112037) and non-essential amino acids (GIBCO, 11140035),
1 mM pyruvate (GIBCO, 11360039), b-mercapthoethanol (GIBCO, 31350010), penicillin and streptomycin (both GIBCO,
15140122) and 25 IU/mL rhIL-2 (PeproTech, 200-02) in a humidified atmosphere (5% CO2, 95% air) at 37�C in a Heraeus incubator.
0.13 106 cells T cells were seeded in 96-well U-bottom plates and either stimulated with anti-CD3/CD28 dynabeads (Thermo Fisher
Scientific) at a cell to bead ratio of 1:1 or in amixed lymphocyte reaction (MLR) with 0.013 106 allogeneicmature dendritic cells (DCs).
Bead stimulated T cells were fed at day 3. For re-stimulation T cell population beads were removed after 6 d of stimulation, T cells
were washed and re-stimulated following the same protocol as during stimulation. Immature DCs were differentiated from mono-
cytes, isolated from PBMCs of healthy donors after leukapheresis followed by density gradient centrifugation over Ficoll/Hypaque.
Monocyte purity was ˃85% determined by CD14 expression. 0.7 3 106/mL monocytes were cultured in RPMI 1640 supplemented
with 50 U/mL penicillin, 50 mg/mL streptomycin, 2 mM L-glutamine, 10% FCS (Sigma, F7524), 144 U/mL IL-4 (Peprotech, 200-04,)
and 225 U/mL GM-CSF (Peprotech, 300-03). On day 5, 100 ng/mL LPS (Enzo, ALX-581-009-L002) were added to induce maturation
of DCs. NSAIDs and MCT inhibitors were added to T cell cultures simultaneously with stimulus, and the drug concentrations were
kept constant when fresh medium was added.
Murine T cells: Spleens of WT and MCT4�/� mice were scratched out to gain splenocytes in a single-cell suspension and eryth-
rocytes were removed with ACK lysis buffer (0.155 M NH4Cl, 0.1 M KHCO3 and 0.1 mM EDTA, diluted 1:6 with H2O). Splenocytes
were stored for at least 2 h in a humidified atmosphere (5% CO2 at 37�C). Murine T cell populations were isolated by magnetic
bead separation (Miltenyi Biotec) and cultured in RPMI composed similar to the RPMI for human T cells (with the exception that
10% FCS were used instead of AB serum).
0.2 3 106 T cells were stimulated with anti-CD3e (coated, 5 mg/mL, BD Biosciences) in combination with anti-CD28 antibody
(soluble, 1 mg/mL, BD Biosciences). T cells were cultured with rhIL-2 (end concentration of 10 U/mL, PeproTech) in 200 mL medium
in a 96-well flat bottom plate resulting in a cell concentration of 1.0 3 106 cells per mL and incubated in a humidified atmosphere
(5% CO2) at 37�C. Diclofenac and SR13800 were added to T cell cultures simultaneously with stimulus.
In Vitro Analysis of CD8+ T Cells Cocultured with B16.SIY Tumor CellsThe effect of diclofenac on checkpoint inhibition in vitrowas analyzed using 2C TCR transgenic CD8+ T cells recognizing the SIY pep-
tide in association with H2Kb. For coculture experiments, CD8+ T cells were isolated from spleens of 2C/Rag2�/�mice by magnetic
bead separation (Miltenyi Biotec). Purified 2C CD8+ T cells (1 3 105) were stimulated twice with irradiated (20 Gy) P815.B7-1 mas-
tocytoma cells (5 3 105) in RPMI with IL-2 (10 U/mL). After 11 d stimulated CD8+ T cells were collected and purified by density
gradient centrifugation.
0.253 105 B16.SIY cells were cultured with or without 20 ng/mL murine IFNg (Pepro Tech) in 96-well plates for 24 h to induce an
upregulation of SIY/H2Kb with and without 0.1 mM diclofenac. After washing the wells with medium (3x), supernatants from cells
cultured without IFNg in the presence of diclofenac were transferred to the IFNg treated B16.SIY cells together with 0.53 105 stim-
ulated 2C CD8+ T cells in the presence of anti-PD-1 (10 mg/mL, BioLegend) or isotype control (10 mg/mL, BioLegend). Supernatants
were harvested to analyze IFNg levels after 24 h.
Determination of Cell Size and Cell NumberCell number and size were determined using the CASY system (Omni Life Science).
Determination of CytokinesCytokine secretion was determined in 48 h culture supernatants by commercially available enzyme-linked immunosorbent assays
(R&D Systems) according to the manufacturer’s protocol.
Determination of Glucose MetabolismFor determining glucose uptake and lactate secretion of tumor cell lines, 0.0253 106 cells were seeded in 200 mL medium in 96-well
plates in the presence or absence of NSAIDs and MCT inhibitors and supernatants were taken after overnight cultures. Glucose
e6 Cell Reports 29, 135–150.e1–e9, October 1, 2019
metabolism of human andmurine T cells was analyzed in culture supernatants after 48 h of activation, as after 24 h lactate secretion is
not detectable. Medium glucose and lactate levels were measured enzymatically and concentration calculated by standard curves.
Glucose concentration was measured by a commercially available kit (Sigma-Aldrich), lactate concentration was determined using a
Dimension Vista (Siemens,) and specific reagents (Roche Innovatis) at the Department of Clinical Chemistry, University Clinic,
Regensburg, Germany. All values were corrected for lactate concentration of the culture medium.
13C6-Glucose Tracer AnalysisTo perform 13C6-Glucose tracing in T cell activation, human CD4+ and CD8+ T cells were stimulated with anti-CD3/CD28 dynabeads
for 6 d. At day 6, T cells were pooled, washed with glucose-free medium and re-stimulated with anti-CD3/CD28 dynabeads in the
presence of 0.1 and 0.2mMdiclofenac or 0.2mMketoprofen and 10mM 13C6 glucose (Cambridge Isotope Labs). Cells were cultured
for 48 h in the presence of the indicated compounds, washed 2x in PBS, and immediately frozen. Cell pellets were kept at�80�C until
further analysis. Experiments were performed with cells from 3 different donors. Metabolite extraction was performed with 80%
methanol. Amino acids isotopologues were analyzed by high performance liquid chromatography (HPLC)–electrospray ionization
(ESI)–tandem MS (MS/MS) after propyl chloroformate derivatization and intermediates of glycolysis and TCA cycle by GC-MS after
derivatization using methoximation and silylation (Feist et al., 2018; Loftus et al., 2018). All raw data were corrected for natural stable
isotope abundance and tracer impurity using IsoCorrectoR (Heinrich et al., 2018). Data are presented as mean isotopic enrichment.
Western Blot AnalysisCell samples were lysed in RIPA-buffer (Sigma-Aldrich), separated by 12% SDS-PAGE and transferred to PVDF membranes,
blocked with 5%milk (Sucofin) in TBS buffer with 0.1% Tween for 1 h, and incubated with primary antibodies overnight. Primary an-
tibodies: MCT1 (Thermo Fisher Scientific, Santa Cruz Biotechnologies), MCT4 (Santa Cruz Biotechnologies), GLUT1 (Abcam), LDHA
(Cell Signaling), LDHB (Santa Cruz Biotechnologies), b-Actin (Sigma-Aldrich). Membranes were incubated with the following second-
ary antibodies for 1 h at RT: Goat anti-rabbit HRP (Agilent), Goat anti-mouse HRP (Agilent). Detection was performed by chemilumi-
nescence (ECL, Amersham Bioscience, RPN2232) and analyzed using the chemiluminescence system Fusion Pulse 6 (Vilber
Lourmat). For detection of multiple antigens, antibodies were removed from the membrane by incubation with ReBlot Plus Strong
Stripping Solution (Merck, 2504) for 15 min.
Monitoring of Oxygen Consumption and pH Development in Vitro
Cellular oxygen consumption and pH changes in culture medium were determined non-invasively by the PreSens technology
(PreSens Precision Sensing GmbH). 0.2 3 106 tumor cells or 0.8 3 106 T cells with anti-CD3/CD28 dynabeads (with a cell to
bead ratio of 1:1, Thermo Fisher Scientific) were seeded in 24-well Oxodish� OD24 or Hydrodish� HD24 plates without fixation
in 1 mL medium under cell culture conditions for the indicated period of time.
Determining Tumor pHTumor pHwas determined in sizematched tumors by amicro fiber optic pHmeter with needle-type housed pHmicrosensors (20/0.4)
using a manual micromanipulator (PreSens Precision Sensing GmbH). Vehicle, diclofenac or lumiracoxib were administered 2 h prior
to pH measurement. Microsensors were calibrated for at least 30 min, tumors were dissected and pHmicrosensor was inserted 1 or
2 mm into the tumor and pH was reported in between one to three min with the software pH1-View.
18F-FDG micro-PET/magnetic Resonance ImagingPET imaging was performed according to Bohn et al. (2018). All mice used for this study were bred and housed at the animal facility of
Johannes Gutenberg University using institutionally approved protocols (permission was obtained from the Landesuntersuchung-
samt Koblenz). In short, tumor-bearing mice were injected intravenously with 6.3 ± 0.5 MBq 18F-FDG followed by a 60 min uptake
period. Mice were anesthetized with isoflurane and measurements were performed followed by a 15 min static PET scan.
Preparation of Mouse Tissue for Flow CytometrySpleen was minced in RPMI 1640 supplemented with 10% FCS and 2 mM glutamine and was centrifuged after filtration through a
100 mmcell strainer. Tumors wereminced and incubated with Deoxyribonuclease I and Collagenase IA (Sigma-Aldrich) in RPMI 1640
supplemented with 10% FCS for 1 h at 37�C, passed through a 70 mm cell strainer and centrifuged. Erythrocytes in single cell sus-
pensions of tumors and spleens were lysed with ACK lysis buffer 1X (6X: 0.155 M NH4Cl, 0.01 M KHCO3 and 0.1 mM EDTA) for 3 min
at RT. For blood samples lysis with ACK lysis buffer was performed for 5 min at RT after a washing step with flow cytometry buffer
(PBS containing 2% FCS). All samples were then washed with flow cytometry buffer and cells were further passed through a 100 mm
cell strainer. 1 - 3 3 106 cells were used for flow cytometry staining.
Flow CytometryHuman T cell populations were stained with anti-CD4 (BD Biosciences), anti-CD8 (BioLegend), anti-CD25 (BD Biosciences), anti-
CD137 (Thermo Fisher Scientific) and anti-PD-1 (BioLegend). Quiescent T cells or isotype control were used as negative controls.
Cell Reports 29, 135–150.e1–e9, October 1, 2019 e7
For analyzing surface markers on tumor cells, human and murine tumor cells were seeded into 6-well plates (0.15 3 106 cells per
well in 5 mL) for 72 h. Murine tumor cells were stimulated with 20 ng/mL IFNg (PeproTech) and cells were stained with anti-I-Ab
(for B16.SIY, BioLegend), anti-I-A/E (for 4T1, BioLegend), anti-H-2Kb (for B16.SIY, BD Biosciences), anti-H-2Dd (4T1, BioLegend)
and anti-PD-L1 (BioLegend). Human tumor cells were stained using anti-HLA-ABC (MHC I, BD Biosciences) and anti-PD-L1
(BioLegend). Apoptosis was determined by Annexin-V/ 7-AAD staining (BD Biosciences).
Single cell suspension was generated from tumor, blood, spleen, and lymph nodes of C57/BL6 and BALB/c mice. After
manufacturing single cell suspensions, cells were treated with FcR-blocking reagent (Miltenyi Biotec) for 10 min at 4�C after washing
with flow cytometry buffer. To exclude dead cells, samples were washed twice with PBS and incubated with 70 mL Zombie NIR dye
(solved in 100 mL DMSO and diluted 1:650 with PBS, BioLegend) for 10 min at RT in the dark. Next, cells were stained with anti-CD3e
(Thermo Fisher Scientific or BD Biosciences), anti-CD4 (Thermo Fisher Scientific or BioLegend), anti-CD8a (BD Biosciences or
Miltenyi Biotec), anti-CD45 (BD PharMingen or Miltenyi Biotec), anti-NK1.1 (Biolegend or Thermo Fisher Scientific), and anti-IFNg
(BioLegend). Intracellular staining of IFNg was performed after incubation of single cell suspensions with BD GolgiStop (BD Biosci-
ences) in medium for 2 h at 37�C using the Intracellular Fixation and Permeabilization Buffer Set (Thermo Fisher Scientific)
according to the manufacturer’s protocol. Flow cytometry was performed using a BD FACS Calibur, LSR Fortessa or LSR II instru-
ment (BD Biosciences). Data were analyzed with the FlowJo software (Tree Star Inc, version 9.9.6 or 10.4.1).
Syngeneic Tumor ModelsTo generate B16 tumors in mice, B16.SIY wt or B16.SIY LDH�/� cells were harvested, washed and 1.0 or 0.33 105 tumor cells were
injected in 50 mL RPMImedium or in RPMI with ECM (1:2) subcutaneously in the dorsal region of mice. Diclofenac was solved in 0.9%
NaCl, lumiracoxib in DMSO and diluted with medium (1:20). NSAIDs were administered intraperitoneally (i. p.) every day, anti-PD1
(Leinco or Bio X Cell) and anti-CTLA-4 (Bio X Cell) antibodies were administered at a concentration of 10 mg/kg every 3rd day begin-
ning at day 4 to 6.
For PET analysis 2.03 105 B16.SIY wt or B16.SIY LDH�/� cells (in 100 mL PBS) were injected subcuteanously into the right (wt) or
left (LDH�/�) flank of C57BL/6J mice. 16 d after tumor cell inoculation glucose uptake of B16.SIY wt and B16.SIY LDH�/� tumors was
measured by PET.
4T1 breast tumor cells were harvested from subconfluent monolayers, washed and 13 106 cells were injected in 100 mL of PBS or
50 mL RPMI mediumwith ECM subcutaneously into syngeneic BALB/cmice. Diclofenac was injected i. p. twice daily at 7.5 mg/kg for
14 d and started on day 6. Aspirin dosing was performed by addition to the drinking water at 600 mg/mL, beginning on day 6 and was
replenished every 3 d. Anti-PD1 (clone 4H2) and anti-CTLA-4 (clone 9D9) antibodies were administered at a concentration of 10 mg/
kg every 3-4 day for one week started on day 6.
Tumor volumes were estimated bymeasurements of the short (a) and long (b) axis of themass and the following formula: V =p/63
0.5 x a x b. Animals were monitored daily for tumor size and their general condition. At indicated time points mice were killed and
blood, spleens, and tumors of mice bearing tumors with a max. size of 1000 mm3 were prepared for analysis.
HistologyGeneral histological analyses were performed of different treatedmice (n = 29, B16.SIY wt: control n = 6, checkpoint n = 6, diclofenac
n = 3, diclofenac + checkpoint n = 7, lumiracoxib n = 2, lumiracoxib + checkpoint n = 5; n = 13 B16.SIY LDH�/�: control n = 5, check-
point n = 8). Stomach, liver, kidneys, lung, ovaries, heart, pancreas, small and large bowel, bone marrowand lymph nodes (lymph
nodes only if macroscopical suspicious) were analyzed histologically. After fixation in buffered formalin the samples were dehydrated
by standard techniques and embedded in paraffin. Slides of 3 - 5 mm were cut with a microtome and hematoxylin and eosin (HE)
staining was performed following general protocols.
Synthesis of tert-butyl 2-(2-((2,6-dichlorophenyl)amino)phenyl)acetate (Diclofenac tert-butyl ester, DtBE)The synthesis was done by an esterification method using sulfuric acid/MgSO4 (Qin and Davies, 2013). Anhydrous MgSO4 (289 mg,
2.40mmol, 4.0 eq, VWR, 33337.A3) and dry CH2Cl2 (MERCK, 1060502500) were placed in a 100mL round-bottom flask. Sulfuric acid
(31.9 mL, 58.8 mg, 0.600 mmol, 1.0 eq, MERCK,1007312500) was added, and the mixture stirred for 30 min at room temperature.
Subsequently, diclofenac sodium salt (191.0 mg, 0.600 mmol, 1.0 eq) and tBuOH (281 mL, 222 mg, 3.00 mmol, 5.0 eq, CARL
ROTH, AE16.2) were added. The reaction mixture was refluxed (45�C) overnight, before after 20 h another 289 mg (2.40 mmol,
4.0 eq) of MgSO4 and tBuOH (281 mL, 222 mg, 3.00 mmol, 5.0 eq) were added and the mixture refluxed for further 7 h. The resulting
mixture was cooled, then filtered and neutralized with saturated aqueous NaCO3 (MERCK, 1063920500) solution. After separation of
the layers, the organic layer was washed with brine (3 3 30 mL) and dried over MgSO4. Finally, the solvent was removed under
reduced pressure, the residue taken up in MeOH (MERCK, 1060092511) and purified by preparative TLC (SiO2, PE/EA 9:1 (v/v))
to yield Diclofenac tert-butyl ester (DtBE) (21.1 mg, 0.0600 mmol, 10%) as colorless oil. Rf = 0.89 (SiO2, PE/EA 3:2 (v/v)); 1H-NMR
(400 MHz, Methanol-d4): d = 7.40 (d, J = 8.1 Hz, 2H, CHarom), 7.19 (d, J = 7.4 Hz, 1H, CHarom), 7.07 (t, J = 8.1 Hz, 2H, CHarom),
6,91 (t, J = 7.5, 1H, CHarom), 6.42 (d, J = 8.0 Hz, 1H, CHarom), 3.70 (s, 2H, CH2), 1.47 (s, 9H, CH(CH3)3);13C-NMR (101 MHz, Meth-
anol-d4, DEUTERO GMBH, 01105): d = 173.5, 144.2, 144.1, 139.3, 131.9, 131.1, 130.1, 128.8, 126.3, 125.7, 122.9, 118.8, 82.6,
40.5, 28.3; LR-MS (APCI-MS) m/z (%): 352.1 [MH+]; HR-MS (ESI-MS): calcd for C18H20Cl2NO2 [MH+] 352.0866, found 352.0875.1H NMR spectra were recorded on a Bruker (Billerica, Massachusetts, USA) spectrometer Avance 400 (400 MHz). Chemical shifts
e8 Cell Reports 29, 135–150.e1–e9, October 1, 2019
d are referenced to methanol-d4 (3.31 ppm, DEUTERO GMBH, 01105-10ml) and reported in ppm, coupling constants in Hz. Multi-
plets are abbreviated as: s = singlet, d = doublet, t = triplet. 13C NMR spectra were recorded on Avance 400 (101 MHz) spectrometer
with chemical shifts d in ppm that are referenced to methanol-d4 (49.0 ppm). Mass data were obtained on Agilent Technologies
6540 UHD (Santa Clara, USA), Finnigan MAT 95 or Thermo Quest Finnigan TSQ 7000 instruments (Bremen, Germany). All reagents
were purchased from commercial sources and were used without further purification. Solvents were distilled before use. Reactions
were carried out under nitrogen gas and the glassware was heated at 110�C before use when dry conditions were necessary. The
reactions were monitored by TLC on silica gel plates 60 F254 by MERCK (Darmstadt, Germany). Spots were detected under UV light
(l = 254 and 366 nm). Preparative TLC plates were set up using silica gel 60 GF254 by MERCK (Darmstadt, Germany).
ChemicalsUnless noted otherwise all chemicals were dissolved in water. Diclofenac was dissolved in RPMI 1640 (Sigma-Aldrich, D6899, stock
concentration 8 mM, final concentration 0.1 or 0.2 mM), ketoprofen in ethanol (Sigma-Aldrich, 471909, stock concentration 10 mM,
final concentration 0.1 or 0.2 mM), the MCT1/2 inhibitors AZD3965 in DMSO (Tocris, 4960, stock concentration 10mM, final concen-
tration 0.1 mM) and SR13800 (stock concentration 10 mM, final concentration 0.1 mM, gift from Prof. Cleveland) in DMSO (Honeywell
Research Chemicals, 34869), acetyl salicylic acid in RPMI 1640 (Fagron, 701627-0003, stock concentration 20 mM, final concentra-
tion 1 mM). DMSO was applied as carrier control when appropriate.
QUANTIFICATION AND STATISTICAL ANALYSIS
Statistical parameters including the exact value of n, the definition of the center, dispersion, and precision and statistical significance
are reported in the figures and the figure legends. Statistical analysis was performed with the GraphPad Prism software (version 7 or
8). Data are judged to be statistically significant when p < 0.05 by one-way ANOVA and Tukey’s or Dunnett’s multiple comparisons
test for comparison of more than two groups as well as paired or unpaired/two-tailed Mann-Whitney U test for comparison of two
groups. Significance between the melanoma patient groups with a low or high glycolytic index was calculated applying the Log-
rank (Mantel-Cox) test. In figures asterisks denote statistical significance (* p < 0.05, ** p < 0.01, *** p < 0.001). Multifactorial analyses
of patient data including sex, age, location, and stage were performed with the software package R (3.6.0) survcomp package
DATA AND CODE AVAILABILITY
There are restrictions to the availability of the human dataset on the correlation of anti-PD-1 treatment response and glycolytic index
as these are patient data and thus are subject to data protection.
Cell Reports 29, 135–150.e1–e9, October 1, 2019 e9