Embed Size (px)
Citation preview

Annual Report on the
Use of Physical Restraint and Seclusion
in Connecticut
School Year 2015-16

Note to the Reader
Connecticut’s restraint and seclusion (R/S) data collection is unique in its transparency and detail; therefore,
comparison with other states is not recommended. Regardless of duration or injury, all incidents of emergency
restraint, emergency seclusion and seclusion via an individualized education program (IEP) are reported for
students with disabilities. Collecting this incident level data allows the Connecticut State Department of
Education (CSDE) to obtain an accurate picture of the incidence of R/S among Connecticut’s population of
students with disabilities.
Inquiries were made to examine the policies, procedures and practices of organizations reporting low numbers
(including no reports) of R/S incidents and organizations where data differed substantially from what was
reported in 2014-2015. Appendix B summarizes the feedback collected from 93 organizations. Districts
identified as potential under-reporters received targeted in-district technical assistance regarding the definitions
of restraint and seclusion and reporting requirements.
The examination and analysis of the R/S data has also informed guidance and professional development
associated with best practices to reduce the use of restraint and seclusion. The revised Guidelines to Identify and
Educate Students with Emotional Disturbance promote the use of positive behavior supports and prevention and
intervention strategies within a tiered, scientific research-based intervention framework (SRBI). These
guidelines also address the appropriate conduct of functional behavioral assessments (FBAs) and the
development of behavior intervention plans (BIPs). The State Personnel Development Grant (SPDG), which
also supports SRBI, has been implemented in over 77 schools (K-12), across the state. Professional
development opportunities related to the regulations around the use of restraint and seclusion in schools and
interventions impacting the reduction of restraint and seclusion remain available to schools and programs. The
CSDE continues to engage with other state agencies through the Restraint and Seclusion Prevention Interagency
Partnership, which provides information and resources and highlights best practices to reduce restraint and
seclusion through conferences and other targeted trainings.
Connecticut General Statutes (C.G.S.) Section 10-236b, as amended, went into effect on July 1, 2015, and is
reflected in the data captured in this report. Updated (2015) guidance and forms reflecting the laws governing
the use of restraint and seclusion in schools are available on the CSDE website. “Recommended Procedures and
Practices to Reduce the Use of Restraint and Seclusion in Schools” is also provided as resource for districts and
programs. All guidance and professional development promote the use of evidence-based practices in
addressing students’ social, emotional and behavioral needs.
When examining organization level data (Appendix A), consideration must be given to the fact that some local
education agencies (LEAs) operate in-district alternative programs and/or self-contained special education
programs. These programs are designed for students with significant special needs. Incidents of R/S occurring
in these settings are reported by the LEA. Conversely, other LEAs may not have the capacity to address a
student’s severe emotional/behavioral needs in district and the student may be placed in an approved private
special education program (APSEP) or regional educational service center (RESC) special education programs.
Incidents occurring in these settings are reported directly by the APSEP or RESC and are included in the
APSEP or RESC incident count. However, if a student is placed by the LEA in an out-of-state facility and is
restrained or secluded, this R/S incident is reported by the LEA and is included in the LEA’s incident count.
Individual LEA policies, procedures and practices may result in differences in in-district program availability,
out-of-district placements and out-of-state placements and must be recognized when examining the organization
level data.

Annual Report on the Use of Physical Restraint and Seclusion in Connecticut, 2015-16 Page 2
Background and Overview
Connecticut General Statutes (C.G.S.) Section 10-236b, as amended, requires the Connecticut
State Department of Education (CSDE) to produce an annual summary report to the Connecticut
General Assembly that:
identifies the frequency of use of physical restraint and seclusion (R/S); and
specifies whether the use of such seclusion was in accordance with an individualized
education program (IEP) or whether the use of physical restraint or seclusion was an
emergency.
R/S incidents were reported for two types of students: students with an IEP and students for
whom parental consent to evaluate for special education had been obtained. General education
students were not reported in these data, unless they were in the evaluation process for special
education services at the time of the restraint or seclusion. Additionally, the C.G.S. requires the
CSDE to report on R/S incidents that result in physical injury to the student.
Data regarding restraints and seclusions for 2015-16 were collected from:
local education agencies (LEAs) including regional school districts, Unified School
District (USD) #2 and the Connecticut Technical High School System (CTHSS);
endowed and incorporated academies (Academies);
public charter schools;
regional educational service centers (RESCs); and
approved private special education programs (APSEPs).
Table 1 below is provided in an effort to contextualize the results and discussion section of the
report. It is important to consider both the proportion of students with disabilities attending
various facility types as well as the purpose of the facility. For example, many students are
placed in APSEPs and RESC special education programs when a planning and placement team
(PPT) determines that their behavior requires an environment with greater supports than can be
provided within the LEA.
Table 1
Number of Organizations and October 1, 2015 Count of Students with IEPs by Facility Type
Facility Type Organizations
Students
N %
Academies 3 384 0.5%
APSEPs 83 2,876 3.9%
Charter Schools 24 884 1.2%
LEAs 170 68,787 92.4%
RESCs 6 1,546 2.1%
TOTAL 286 74,477 100.0%
Note: Students attending other non-public or out-of-state schools are included in the LEA count.
The results and discussion section focuses on state level data. Organization-level data for the
2015-16 school year are presented in Appendix A.

Annual Report on the Use of Physical Restraint and Seclusion in Connecticut, 2015-16 Page 3
Definitions and Concepts
Major Categories of R/S
1. Emergency Restraint means any mechanical or personal restriction that immobilizes or
reduces the free movement of a child’s arms, legs or head.1
Restraint does not include:
briefly holding a child in order to calm or comfort the child;
actions involving the minimum contact necessary to safely escort a child from one
area to another;
medication devices, including supports prescribed by a health care provider to
achieve proper body position or balance;
helmets or other protective gear used to protect a child from injuries due to a fall; or
helmets, mitts and similar devices used to prevent self-injury when the device is part
of a documented treatment plan or IEP and is the least restrictive means to prevent
self-injury.
2. Emergency Seclusion means the confinement of a child in a room, whether alone or with
staff supervision, in a manner that prevents the child from leaving.
Seclusion does not include:
time outs in the back of the classroom or in the hallway, meant to allow the student to
pull him or herself together; or
in-school suspensions.
3. Seclusion via an IEP means seclusion as a behavior intervention that is documented in the
IEP. Seclusion as an intervention can only be developed by the PPT to address a child’s
behavior when other, less restrictive, positive behavior interventions were tried, found to be
ineffective and are well documented. Appropriate assessment data (i.e., a Functional
Behavioral Assessment (FBA)) and other relevant information supporting the use of
seclusion as a behavior intervention must be well documented and included in the child’s IEP
under “Present Levels of Academic Achievement and Functional Performance.” In addition,
the findings of the FBA must be documented and utilized to inform the development of a
Behavior Intervention Plan (BIP) which becomes part of the IEP, by attachment.
Subcategories of Injuries
1. Nonserious Injuries include red marks, bruises or scrapes requiring application of basic first
aid, for example a Band-Aid or ice pack.
2. Serious Injuries include any injury requiring medical attention beyond basic first aid.
Examples of such medical attention include emergency room visits, doctor visits, sutures,
diagnostic x-rays to determine fractures, placement in casts, etc.
1 It is important to note that all restraints are reported regardless of duration.

Annual Report on the Use of Physical Restraint and Seclusion in Connecticut, 2015-16 Page 4
Methodology
For the 2015-16 school year, the CSDE Performance Office collected and analyzed data at the
incident level for each student with an IEP or for whom parental consent to evaluate for special
education had been obtained. This incident-level collection allowed for a count of incidents, as
well as an unduplicated count of students with disabilities who were restrained and/or secluded.
Collecting incident level data is vital to obtaining an accurate picture of the incidence of R/S
among Connecticut’s population of students with disabilities.
Instances of R/S for 2015-16 school year were collected at the incident level from all institutions
and facilities (henceforth referred to as “Organizations”) that provide direct care, education or
supervision to students with disabilities. Organizations were asked to report incident level
information on all restraints and seclusions that occurred within their buildings and programs or
during transportation provided by their organization. Additionally, organizations were instructed
to include any restraints or seclusions of their students that occurred in out-of-state facilities,
nonpublic transition programs, and other nonpublic schools or during an extended day program
offered by their organization. LEAs did not report incidents of restraint and seclusion of their
students attending RESCs, charter schools, academies or APSEPs because each of these facilities
was responsible for separately reporting their R/S data.
The mechanism for collection in 2015-16 was comparable to that of 2014-15. Data were
collected from all LEAs, RESCs, charter schools, academies, and APSEPs via an online
application. This application provided cross checks with other CSDE databases and included edit
checks to ensure data accuracy.
Data elements collected for each incident of restraint or seclusion included the student’s state
assigned student identifier (SASID), date of birth, date of incident, incident start and end times,
circumstance (imminent risk of injury to self, others, or self and others, or seclusion via the IEP),
special education status (IEP or signed consent to evaluate), nature of incident (restraint or
seclusion), primary disability and, where applicable, injury type and details.
The CSDE provided support to organizations through targeted technical assistance. Such
technical assistance included the creation of a help desk for all organizations and provision of
additional supports to all new reporting organizations. The data collection system was also
enhanced with multiple edit checks to ensure data integrity. Instances where data quality
indicated concern were reviewed with the organization contact. Comparison reports were sent to
organizations where data reported for 2015-16 indicated a substantial departure from those in
2014-15. Organizations whose data changed substantially across the two years provided written
feedback explaining the contributing factors. A summary of those responses is included in
Appendix B. Additionally, all organizations were required to have a certified administrator attest
to the accuracy of their data through completion of an online certification process. Each of these
attestations regarding the accuracy of 2015-16 R/S data is on file with the CSDE.

Annual Report on the Use of Physical Restraint and Seclusion in Connecticut, 2015-16 Page 5
Results and Discussion
In total, 36,032 incidents of restraint and seclusion were reported to the CSDE in 2015-16. This
represents a decrease of 4,010 incidents (10.0%) from 2014-15.
A total of 2,912 students (unduplicated count) accounted for the 36,032 R/S incidents in 2015-
16. This represents an increase of 194 students from 2014-15. The percentage of all students with
disabilities restrained and/or secluded increased slightly in 2015-16 (3.7% in 2014-15; 3.9 % in
2015-16).
Of the 36,032 R/S incidents, 95.8 percent (34,504) were in response to emergency situations
(imminent risk of injury to self, others or self and others) and 4.2 percent (1,528) were seclusions
in accordance with an IEP. The gender, grade and race/ethnicity of students restrained and/or
secluded in 2015-16 are examined in Tables 2 and 3 and Figure 1 below. All tables in this
section represent 2015-16 data unless otherwise noted. Statewide counts and percentages for all
students with IEPs are included to allow for comparison. In accordance with the Family
Educational Rights and Protection Act (FERPA), some data have been suppressed to protect the
identities of individual students. Suppressed values are marked with an asterisk.
The gender of students restrained and/or secluded in 2015-16 differed significantly from the
gender of all students with IEPs (χ2 (1, N = 2,912) = 297.7, p < .0001). Effect size, a statistical
measure of practical significance, indicated a moderate association (=0.32) between gender and
being restrained and/or secluded. Further examination indicated that male students were
overrepresented in the population of students restrained and/or secluded while female students
were underrepresented.
Table 2
Gender of Students Restrained and/or Secluded (unduplicated count)
Students Restrained
and/or Secluded
All Students with
IEPs
Row % Gender N Column % N Column %
Female 508 17.4% 24,141 32.4% 2.1%
Male 2,404 82.6% 50,336 67.6% 4.8%
TOTAL 2,912 100.0% 74,477 100.0% 3.9%
Figure 1 provides the proportion of students who were restrained and/or secluded by grade.
While there was support for differences in grade distribution from 2014-15 and 2015-16 (χ2 (13,
N = 2,912) = 33.2, p < .01), effect size, a statistical measure of practical significance, indicated
only a weak association (=0.11). Grades kindergarten, second grade and eighth grade
contributed to this result.

Annual Report on the Use of Physical Restraint and Seclusion in Connecticut, 2015-16 Page 6
Figure 1. Bar chart illustrating grades of students restrained and/or secluded for 2013-14 and
2015-16 (proportions based on unduplicated count).
The race/ethnicity of students restrained and/or secluded in 2015-16 differed significantly from
the race/ethnicity of all students with IEPs (χ2 (6, N = 2,912) = 254.0, p < .0001). Effect size, a
statistical measure of practical significance, indicated a moderate association (=0.30) between
race/ethnicity and being restrained and/or secluded. Further examination indicated that Black or
African American students and students identifying as two or more races were overrepresented
in the population of students restrained and/or secluded while White students were
underrepresented.
Table 3
Race/Ethnicity of Students Restrained and/or Secluded (unduplicated count)
Race/Ethnicity
Students Restrained
and/or Secluded
All Students with
IEPs Row %
N Column % N Column %
American Indian or Alaska Native * * 236 0.3% 3.8%
Asian 30 1.0% 1,787 2.4% 1.7%
Black or African American 678 23.3% 11,959 16.1% 5.7%
Hispanic/Latino of any race 846 29.1% 20,450 27.5% 4.1%
Native Hawaiian or Other Pacific
Islander * * 51 0.1% 3.9%
Two or More Races 155 5.3% 1,994 2.7% 7.8%
White 1,192 40.9% 38,000 51.0% 3.1%
TOTAL 2,912 100.0% 74,477 100.0% 3.9%
It is extremely important to note that use of the unduplicated student count for any type of
incidence rate calculation must be avoided. Many R/S incidents are for students with significant
self-injurious and aggressive behaviors. These students often have multiple incidents and in
many cases account for the majority of incidents reported by an organization. If the total R/S
0.0%
2.0%
4.0%
6.0%
8.0%
10.0%
PK K 01 02 03 04 05 06 07 08 09 10 11 12
Pe
rce
nt
of
Stu
de
nts
Students Restrained and/or Secluded by Grade
2013-14 to 2015-16
2013-14 2014-15 2015-16

Annual Report on the Use of Physical Restraint and Seclusion in Connecticut, 2015-16 Page 7
incident and student count for this LEA were used to calculate a rate, it would result in
significant misrepresentation of the use of R/S by this organization. Table 4 examines the range
in the number of incidents reported for students at the state level. While nearly three quarters
(74.8%) of students had 10 or fewer R/S incidents during the 2015-16 school year, there were 46
students with greater than 100 R/S incidents, and fewer than six of those were restrained and/or
secluded more than 300 times.
Table 4
Count of Students by Total Number of R/S Incidents
Emergency
Restraint
Emergency
Seclusion
Seclusion
via an IEP
All Incident
Types
Number of Incidents N % N % N % N %
1 831 34.6% 455 27.4% 52 45.2% 758 26.0%
2-5 873 36.3% 577 34.8% 28 24.3% 1,006 34.5%
6-10 314 13.1% 251 15.1% 11 9.6% 415 14.3%
11-50 318 13.2% 333 20.1% 16 13.9% 565 19.4%
51-100 51 2.1% 34 2.0% * * 122 4.2%
Over 100 16 0.7% 10 0.6% * * 46 1.6%
TOTAL 2,403 100.0% 1,660 100.0% 115 100.0% 2,912 100.0%
Note: If a student had more than one type of incident he/she is counted in each applicable column, but is
counted only once in the TOTAL R/S Incidents column. A student with one emergency restraint, one
emergency seclusion, and no seclusions via an IEP would be counted in the “2-5” row under TOTAL R/S
Incidents.
R/S Incidents Resulting in Injury
There were a total of 270 incidents resulting in injuries, non-serious and serious, during the
2015-16 school year. Tables 5 and 6 include counts of total injuries.
Of the 270 incidents resulting in injury, ten met the criteria for serious injury. A serious injury is
defined as any injury requiring medical attention beyond basic first aid, while a nonserious injury
is defined as an injury such as a red mark, bruise or scrape requiring application of basic first aid.
No serious injuries occurred during seclusion via an IEP. Injuries occurring as a result of
emergency R/S appear in Table 5, while injuries occurring as a result of seclusion via an IEP are
reflected in Table 6. All incidents in 2015-16 that resulted in serious injury were reported to the
director of the Office of Protection and Advocacy for Persons with Disabilities. This reporting is
consistent with the requirements of C.G.S. Section 46a‐153.
Emergency R/S Incidents
A breakdown of all R/S incidents in response to emergency situations (imminent risk of injury to
self, others, or self and others) is provided in Table 5. The table provides a total incident count
and student count. Throughout the school year, a student could have attended multiple facilities.
In these cases, the student will appear in the student count for each applicable facility type, but
only once in the statewide student count. Therefore, the statewide student count may be less than
the sum of the student counts for all facility types.

Annual Report on the Use of Physical Restraint and Seclusion in Connecticut, 2015-16 Page 8
Table 5
All Emergency R/S Incidents by Facility Type
Emergency Restraints Emergency Seclusions
Facility Type
Incident
Count
Student
Count
Total
Injuries
Incident
Count
Student
Count
Total
Injuries
Academies 0 0 0 0 0 0
APSEPs 10,154 851 99 6,932 662 10
Charter Schools 25 17 0 0 0 0
LEAs 6,580 1,282 77 5,215 747 36
RESCs 2,438 340 35 3,160 286 9
STATEWIDE 19,197 2,403 211 15,307 1,660 55
Note: If a student had an incident in more than one facility type, he/she is only counted once in the
statewide student count. Therefore, the statewide student count may be less than the sum of the
student counts for all facility types.
Seclusions via an IEP
Seclusions via an IEP occurred far less than the previously discussed emergency responses.
Again, seclusion is only written into an IEP when all other less restrictive interventions have
been exhausted, a functional behavior assessment (FBA) has been conducted, and the PPT has
determined that the use of seclusion is an appropriate intervention. Table 6 examines all
seclusions via an IEP that occurred during the 2015-16 school year, again providing a total
incident count as well as an unduplicated student count and injury count.
Table 6
All Seclusions via an IEP by Facility Type
Facility Type
Incident
Count
Student
Count
Total
Injuries
Academies 0 0 0
APSEPs 1,297 60 *
Charter Schools 0 0 0
LEAs 231 55 0
RESCs 0 0 0
STATEWIDE 1,528 115 *
Note: If a student had an incident in more than one facility type, he/she is only counted once in the
statewide student count. Therefore, the statewide student count may be less than the sum of the
student counts for all facility types.

Annual Report on the Use of Physical Restraint and Seclusion in Connecticut, 2015-16 Page 9
Duration of R/S Incidents
The duration of R/S incidents was examined. Tables 7, 8 and 9 provide data on the duration of
emergency restraints, emergency seclusions and seclusions via an IEP respectively.
Table 7 shows that the vast majority of emergency restraints (93.4%) lasted 20 minutes or less,
with over half (54.1%) lasting five minutes or less. Under one percent (0.6%) of emergency
restraints lasted over one hour, and 14 emergency restraints lasted over two hours (down from 43
in 2014-15).
Table 7
Duration of Emergency Restraints by Facility Type
Facility Type
0-2
Minutes
3-5
Minutes
6-20
Minutes
21-40
Minutes
41-60
Minutes
Over 60
Minutes
TOTAL
Emergency
Restraints
Academies 0 0 0 0 0 0 0
APSEPs 1,939 3,075 4,384 579 101 76 10,154
Charter Schools 12 7 6 0 0 0 25
LEAs 1,826 2,011 2,327 312 * * 6,580
RESCs 659 861 816 81 * * 2,438
STATEWIDE N 4,436 5,954 7,533 972 182 120 19,197
% 23.1% 31.0% 39.2% 5.1% 0.9% 0.6% 100.0%
Table 8 shows that over three quarters of emergency seclusions (79.1%) lasted 20 minutes or
less, with 30.8 percent lasting five minutes or less. Slightly over three percent (3.3%) of
emergency seclusions lasted over an hour, down from 4.6% in 2014-15.
Table 8
Duration of Emergency Seclusions by Facility Type
Facility Type
0-2
Minutes
3-5
Minutes
6-20
Minutes
21-40
Minutes
41-60
Minutes
Over 60
Minutes
TOTAL
Emergency
Seclusions
Academies 0 0 0 0 0 0 0
APSEPs 751 1,253 3,111 1,145 371 301 6,932
Charter Schools 0 0 0 0 0 0 0
LEAs 443 990 2,658 698 240 186 5,215
RESCs 558 726 1,624 190 49 13 3,160
STATEWIDE N 1,752 2,969 7,393 2,033 660 500 15,307
% 11.4% 19.4% 48.3% 13.3% 4.3% 3.3% 100.0%
Table 9 shows that 81.8 percent of seclusions via an IEP lasted 20 minutes or less, with over 35
percent (36.1%) lasting five minutes or less. Slightly over two percent (2.1%) of seclusions via
an IEP lasted over an hour.

Annual Report on the Use of Physical Restraint and Seclusion in Connecticut, 2015-16 Page 10
Table 9
Duration of Seclusions via an IEP by Facility Type
Facility Type
0-2
Minutes
3-5
Minutes
6-20
Minutes
21-40
Minutes
41-60
Minutes
Over 60
Minutes
TOTAL
Seclusions
via an IEP
Academies 0 0 0 0 0 0 0
APSEPs * 456 581 138 32 * 1,297
Charter Schools 0 0 0 0 0 0 0
LEAs * 25 118 64 12 * 231
RESCs 0 0 0 0 0 0 0
STATEWIDE N 70 481 699 202 44 32 1,528
% 4.6% 31.5% 45.7% 13.2% 2.9% 2.1% 100.0%
Circumstances Necessitating the Use of R/S
The circumstances necessitating use of emergency R/S were investigated. Below, Figure 2
compares circumstances necessitating the use of emergency restraint and the use of emergency
seclusion. Slightly more emergency restraints occurred due to risk of injury to self, than
emergency seclusions. Emergency seclusions were more likely to occur due to incidents where
there was a risk of injury to others. When combined, 8.7 percent of emergency responses
occurred solely as a result of risk of injury to self and slightly over 40 percent (43.2%) occurred
solely as a result of risk of injury to others. Slightly under half of emergency responses occurred
as a result of risk of injury to self and others (48.1%).
Figure 2. Pie charts comparing the circumstances necessitating the use of emergency restraint
and emergency seclusion by risk type: risk of injury to self, others, or self and others (2015-16
school year).
Primary Disability
Organizations were required to report a student’s primary disability at the time of each R/S
incident. The primary disabilities of autism, emotional disturbance, and other health impairment
(including attention deficit disorder/attention deficit hyperactivity disorder; ADD/ADHD)
accounted for over 80% of the incidents in each incident type. Figure 3 shows a breakdown of

Annual Report on the Use of Physical Restraint and Seclusion in Connecticut, 2015-16 Page 11
incidents by primary disability. The primary disability category of other includes hearing
impairment, visual impairment, orthopedic impairment, deaf/blindness, multiple disabilities and
traumatic brain injury.
Figure 3. Pie charts comparing emergency R/S incidents and Seclusions via an IEP by Primary
Disability (2015-16 school year).
Year-to-Year Comparison
The total number of R/S incidents in 2015-16 demonstrates a decrease of 4,010 or 10.0 percent
from 2014-15 (40,042 in 2014-15 and 36,032 in 2015-16). When examining the four-year trend,
the total number of incidents in 2015-16 is an increase of 6.8 percent from 2012-13.
It is also important to examine the differences by incident type (emergency restraint, emergency
seclusion, and seclusion via an IEP). Figure 4 presents a four-year comparison of total incidents
by incident type. While the overall number of emergency restraints has increased over the past
four years by 22.2 percent, there was a slight decrease in these incidents from 2014-15 to 2015-
16. Emergency seclusions have increased by 48.7 percent from 2012-13. However, the increase
in these incidents from 2014-15 to 2015-16 was much smaller than in previous years (7.4 %).
Contrasting the trends seen for both emergency restraints and seclusions, the number of
seclusions via an IEP has decreased by 80.3 percent over the past four years with a decrease of
76.1 percent from 2014-15 to 2015-16.

Annual Report on the Use of Physical Restraint and Seclusion in Connecticut, 2015-16 Page 12
Figure 4. Bar graph comparing incidents reported from 2012-13 through 2015-16 by incident
type.
Summary of Key Findings
The total number of R/S incidents reflects a decrease of 10.0 percent from 2014-15, but
an increase of 6.8 percent from 2012-13 (33,743 in 2012-13; 35,892 in 2013-14; 40,042
in 2014-15; 36,032 in 2015-16).
R/S incidents lasting five minutes or less accounted for 45.8 percent of reported R/S
incidents in 2013-14, 40.7 percent in 2014-15 and 43.5 percent in 2015-16.
A total of 2,912 students (unduplicated count) were restrained and/or secluded in 2015-
16. This represents an increase of 194 students from 2014-15. The percentage of all
students with disabilities restrained and/or secluded increased slightly in 2015-16 (3.7%
in 2014-15; 3.9% in 2015-16).
The number of injuries reported decreased from 366 in 2014-15 to 270 in 2015-16.
While nearly three quarters (74.8%) of students had 10 or fewer R/S incidents during the
2014-15 school year, there were 46 students with greater than 100 R/S incidents, and
fewer than six of those were restrained and/or secluded more than 300 times.
Over 90 percent (93.4%) of emergency restraints lasted less than 20 minutes; however,
14 emergency restraints lasted over two hours (down from 54 in 2013-14 and 43 in 2014-
15).
Over three quarters of emergency seclusions (79.1%) lasted 20 minutes or less, with 30.8
percent lasting five minutes or less. Slightly over three percent (3.3%) of emergency
seclusions lasted over an hour.
Over 80 percent of seclusions via an IEP (81.8%) lasted 20 minutes or less, with a little
over 36.1 percent lasting five minutes or less. Approximately two percent (2.1%) of
seclusions via an IEP lasted over an hour.
0
5,000
10,000
15,000
20,000
25,000
30,000
35,000
40,000
12-13
13-14
14-15
15-16
12-13
13-14
14-15
15-16
12-13
13-14
14-15
15-16
12-13
13-14
14-15
15-16
Total R/S Incidents Emergency Restraints Emergency Seclusions Seclusions via an IEP
R/S Incidents
2012-13 through 2015-16

Annual Report on the Use of Physical Restraint and Seclusion in Connecticut, 2015-16 Page 13
For all emergency R/S incidents as well as seclusions via an IEP, students with Autism
and Emotional Disturbance represented the largest proportion of incidents.
Statistical analysis indicated that Black or African American students and students
identifying as two or more races were overrepresented in the population of students
restrained and/or secluded while White students were underrepresented.
The number of seclusions via an IEP has decreased by 80.3 percent over the past four
years with a decrease of 76.1 percent from 2014-15 to 2015-16.

Annual Report on the Use of Physical Restraint and Seclusion in Connecticut, 2015-16 Page 14
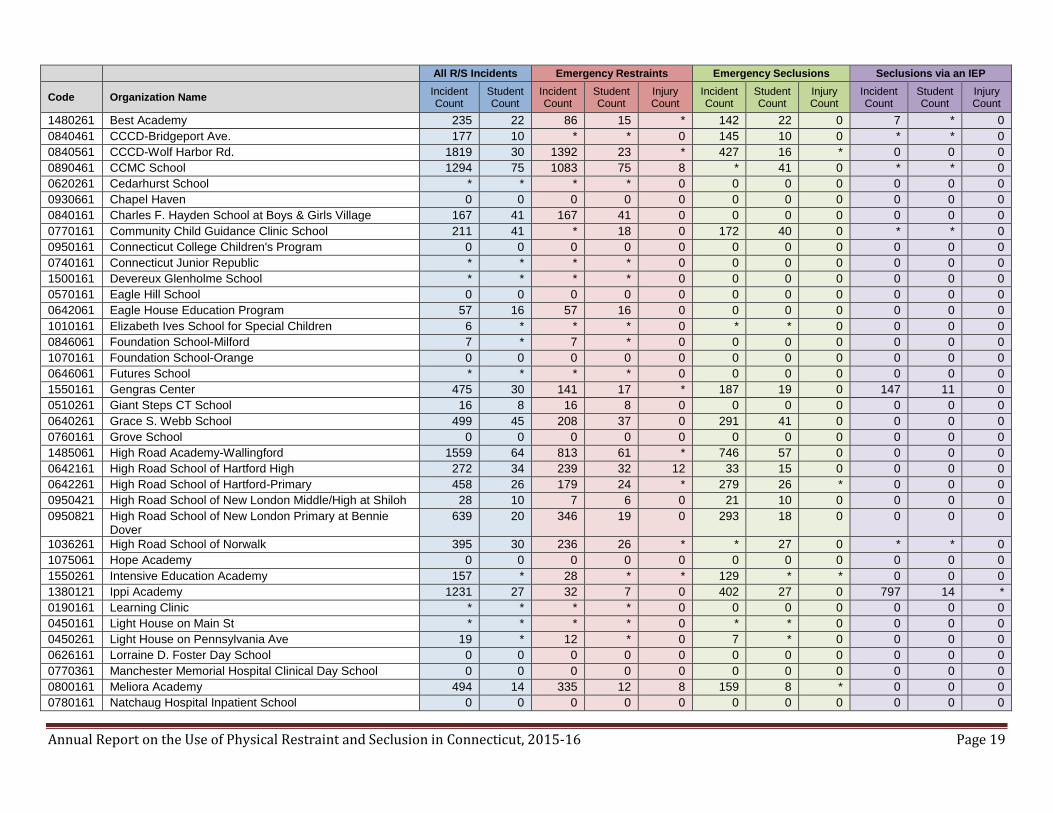
Appendix A
All R/S Incidents Emergency Restraints Emergency Seclusions Seclusions via an IEP
Code Organization Name Incident Count
Student Count
Incident Count
Student Count
Injury Count
Incident Count
Student Count
Injury Count
Incident Count
Student Count
Injury Count
0010011 Andover School District 0 0 0 0 0 0 0 0 0 0 0
0020011 Ansonia School District * * * * 0 0 0 0 0 0 0
0030011 Ashford School District 0 0 0 0 0 0 0 0 0 0 0
0040011 Avon School District 46 9 24 6 0 22 7 0 0 0 0
0050011 Barkhamsted School District 0 0 0 0 0 0 0 0 0 0 0
0070011 Berlin School District 102 7 50 7 0 52 * 0 0 0 0
0080011 Bethany School District 136 * * * 0 * * 0 0 0 0
0090011 Bethel School District 29 7 12 * * 17 7 0 0 0 0
0110011 Bloomfield School District 111 12 42 7 0 69 11 0 0 0 0
0120011 Bolton School District 49 * * * 0 * * 0 0 0 0
0130011 Bozrah School District 42 * 7 * 0 35 * 0 0 0 0
0140011 Branford School District 25 * * * 0 * * 0 0 0 0
0150011 Bridgeport School District 47 20 0 0 0 47 20 0 0 0 0
0170011 Bristol School District 309 46 181 39 0 128 20 0 0 0 0
0180011 Brookfield School District 10 * 7 * 0 * * 0 * * 0
0190011 Brooklyn School District 26 * 26 * 0 0 0 0 0 0 0
0210011 Canaan School District 0 0 0 0 0 0 0 0 0 0 0
0220011 Canterbury School District 39 * 0 0 0 39 * 0 0 0 0
0230011 Canton School District 9 * * * 0 * * 0 0 0 0
0240011 Chaplin School District * * * * 0 0 0 0 0 0 0
0250011 Cheshire School District 180 8 158 8 0 22 * 0 0 0 0
0260011 Chester School District 0 0 0 0 0 0 0 0 0 0 0
0270011 Clinton School District 104 7 * * * * * 0 0 0 0
0280011 Colchester School District 24 6 0 0 0 24 6 0 0 0 0
0290011 Colebrook School District 0 0 0 0 0 0 0 0 0 0 0
0300011 Columbia School District 0 0 0 0 0 0 0 0 0 0 0
0310011 Cornwall School District 0 0 0 0 0 0 0 0 0 0 0
0320011 Coventry School District * * * * 0 * * 0 0 0 0
0330011 Cromwell School District 23 6 12 * 0 11 * 0 0 0 0
0340011 Danbury School District 106 20 75 16 0 31 8 0 0 0 0
0350011 Darien School District 6 * * * 0 * * 0 0 0 0
0360011 Deep River School District * * * * 0 0 0 0 0 0 0
0370011 Derby School District 84 9 * * 0 73 9 0 * * 0
0390011 Eastford School District * * 0 0 0 * * * 0 0 0
0400011 East Granby School District 0 0 0 0 0 0 0 0 0 0 0
0410011 East Haddam School District * * * * 0 0 0 0 0 0 0

Annual Report on the Use of Physical Restraint and Seclusion in Connecticut, 2015-16 Page 15
All R/S Incidents Emergency Restraints Emergency Seclusions Seclusions via an IEP
Code Organization Name Incident Count
Student Count
Incident Count
Student Count
Injury Count
Incident Count
Student Count
Injury Count
Incident Count
Student Count
Injury Count
0420011 East Hampton School District 24 * * * 0 * * 0 0 0 0
0430011 East Hartford School District 185 44 141 44 0 * * 0 * 20 0
0440011 East Haven School District 22 * 12 * 0 10 * 0 0 0 0
0450011 East Lyme School District 268 7 96 7 0 172 6 * 0 0 0
0460011 Easton School District 17 * * * 0 * * * 0 0 0
0470011 East Windsor School District 90 12 90 12 0 0 0 0 0 0 0
0480011 Ellington School District 17 7 * * 0 * * 0 0 0 0
0490011 Enfield School District 249 30 131 30 * 118 17 * 0 0 0
0500011 Essex School District 0 0 0 0 0 0 0 0 0 0 0
0510011 Fairfield School District 77 13 57 13 0 20 * * 0 0 0
0520011 Farmington School District 111 11 37 7 0 74 7 * 0 0 0
0530011 Franklin School District 0 0 0 0 0 0 0 0 0 0 0
0540011 Glastonbury School District 19 7 * * 0 * * 0 0 0 0
0560011 Granby School District * * * * 0 0 0 0 0 0 0
0570011 Greenwich School District 62 17 52 15 * 10 * 0 0 0 0
0580011 Griswold School District 28 9 22 7 * 6 * 0 0 0 0
0590011 Groton School District 303 34 272 31 0 31 7 0 0 0 0
0600011 Guilford School District 95 10 42 9 0 53 * 0 0 0 0
0620011 Hamden School District 192 24 109 19 * 62 14 0 21 * 0
0630011 Hampton School District 0 0 0 0 0 0 0 0 0 0 0
0640011 Hartford School District 172 41 172 41 0 0 0 0 0 0 0
0650011 Hartland School District 0 0 0 0 0 0 0 0 0 0 0
0670011 Hebron School District 48 7 26 6 0 22 6 0 0 0 0
0680011 Kent School District 0 0 0 0 0 0 0 0 0 0 0
0690011 Killingly School District 108 16 32 12 0 76 9 0 0 0 0
0710011 Lebanon School District 0 0 0 0 0 0 0 0 0 0 0
0720011 Ledyard School District 77 14 53 13 * * * 0 * * 0
0730011 Lisbon School District * * * * 0 0 0 0 0 0 0
0740011 Litchfield School District * * * * 0 0 0 0 0 0 0
0760011 Madison School District 18 6 11 * 0 7 * 0 0 0 0
0770011 Manchester School District 384 65 * 55 0 198 39 0 * * 0
0780011 Mansfield School District 20 7 20 7 0 0 0 0 0 0 0
0790011 Marlborough School District 38 * * * * * * 0 0 0 0
0800011 Meriden School District 1046 74 * 69 * 646 44 * * * 0
0830011 Middletown School District 213 20 70 14 6 143 16 * 0 0 0
0840011 Milford School District 275 23 109 19 * 166 13 * 0 0 0
0850011 Monroe School District 17 * 10 * 0 7 * 0 0 0 0
0860011 Montville School District 353 23 189 17 * 116 15 * 48 * 0

Annual Report on the Use of Physical Restraint and Seclusion in Connecticut, 2015-16 Page 16
All R/S Incidents Emergency Restraints Emergency Seclusions Seclusions via an IEP
Code Organization Name Incident Count
Student Count
Incident Count
Student Count
Injury Count
Incident Count
Student Count
Injury Count
Incident Count
Student Count
Injury Count
0880011 Naugatuck School District 92 27 60 25 0 32 8 0 0 0 0
0890011 New Britain School District 538 89 295 76 8 * 42 * * * 0
0900011 New Canaan School District * * * * 0 0 0 0 0 0 0
0910011 New Fairfield School District 18 * * * 0 * * 0 0 0 0
0920011 New Hartford School District 0 0 0 0 0 0 0 0 0 0 0
0930011 New Haven School District 13 8 13 8 0 0 0 0 0 0 0
0940011 Newington School District 42 11 32 11 * 10 * 0 0 0 0
0950011 New London School District 216 26 149 25 0 67 14 0 0 0 0
0960011 New Milford School District 424 22 163 15 15 261 17 * 0 0 0
0970011 Newtown School District 217 18 87 16 0 130 13 0 0 0 0
0980011 Norfolk School District 0 0 0 0 0 0 0 0 0 0 0
0990011 North Branford School District 49 8 24 8 0 25 * 0 0 0 0
1000011 North Canaan School District * * * * 0 0 0 0 0 0 0
1010011 North Haven School District 51 9 24 9 0 27 * 0 0 0 0
1020011 North Stonington School District * * * * 0 0 0 0 0 0 0
1030011 Norwalk School District 17 6 * * 0 * * 0 0 0 0
1040011 Norwich School District 291 37 229 35 * 62 8 * 0 0 0
1060011 Old Saybrook School District 27 * 12 * 0 15 * 0 0 0 0
1070011 Orange School District * * * * 0 * * * 0 0 0
1080011 Oxford School District 11 * * * 0 * * 0 0 0 0
1090011 Plainfield School District 34 7 34 7 * 0 0 0 0 0 0
1100011 Plainville School District 15 * * * 0 * * 0 0 0 0
1110011 Plymouth School District 82 10 33 7 0 49 9 0 0 0 0
1120011 Pomfret School District 0 0 0 0 0 0 0 0 0 0 0
1130011 Portland School District 0 0 0 0 0 0 0 0 0 0 0
1140011 Preston School District 0 0 0 0 0 0 0 0 0 0 0
1160011 Putnam School District 10 * * * 0 * * 0 0 0 0
1170011 Redding School District * * 0 0 0 * * 0 0 0 0
1180011 Ridgefield School District 18 * 11 * 0 7 * 0 0 0 0
1190011 Rocky Hill School District 0 0 0 0 0 0 0 0 0 0 0
1210011 Salem School District 8 * * * 0 * * 0 0 0 0
1220011 Salisbury School District 0 0 0 0 0 0 0 0 0 0 0
1230011 Scotland School District 0 0 0 0 0 0 0 0 0 0 0
1240011 Seymour School District 117 9 100 9 0 17 * 0 0 0 0
1250011 Sharon School District 0 0 0 0 0 0 0 0 0 0 0
1260011 Shelton School District 194 23 126 21 7 68 9 * 0 0 0
1270011 Sherman School District 0 0 0 0 0 0 0 0 0 0 0
1280011 Simsbury School District 85 8 60 8 0 25 * 0 0 0 0

Annual Report on the Use of Physical Restraint and Seclusion in Connecticut, 2015-16 Page 17
All R/S Incidents Emergency Restraints Emergency Seclusions Seclusions via an IEP
Code Organization Name Incident Count
Student Count
Incident Count
Student Count
Injury Count
Incident Count
Student Count
Injury Count
Incident Count
Student Count
Injury Count
1290011 Somers School District * * * * 0 0 0 0 0 0 0
1310011 Southington School District 89 16 43 13 0 30 9 0 16 * 0
1320011 South Windsor School District 50 10 * 10 * * * 0 0 0 0
1330011 Sprague School District 44 6 11 * 0 33 * 0 0 0 0
1340011 Stafford School District 93 14 18 8 0 75 11 * 0 0 0
1350011 Stamford School District 46 12 27 10 0 19 8 0 0 0 0
1360011 Sterling School District * * * * 0 * * 0 0 0 0
1370011 Stonington School District 197 17 105 11 * * 12 * * * 0
1380011 Stratford School District 445 31 91 22 0 281 21 * 73 6 0
1390011 Suffield School District 57 6 25 * * 32 * * 0 0 0
1400011 Thomaston School District * * * * * 0 0 0 0 0 0
1410011 Thompson School District 116 * 71 * 0 45 * 0 0 0 0
1420011 Tolland School District 155 14 * 9 * 119 12 * * * 0
1430011 Torrington School District 127 9 82 7 0 45 8 0 0 0 0
1440011 Trumbull School District 41 9 23 9 0 18 * 0 0 0 0
1450011 Union School District 0 0 0 0 0 0 0 0 0 0 0
1460011 Vernon School District 219 27 100 20 * 119 19 0 0 0 0
1470011 Voluntown School District 0 0 0 0 0 0 0 0 0 0 0
1480011 Wallingford School District 72 12 59 10 * 13 6 0 0 0 0
1510011 Waterbury School District 317 61 167 47 * * 25 0 * * 0
1520011 Waterford School District 7 * 7 * 0 0 0 0 0 0 0
1530011 Watertown School District 45 7 26 * 0 19 * 0 0 0 0
1540011 Westbrook School District 24 6 16 6 * 8 * * 0 0 0
1550011 West Hartford School District 170 25 151 23 0 * 10 0 * * 0
1560011 West Haven School District 185 20 185 20 0 0 0 0 0 0 0
1570011 Weston School District 0 0 0 0 0 0 0 0 0 0 0
1580011 Westport School District 16 7 16 7 0 0 0 0 0 0 0
1590011 Wethersfield School District 41 7 23 6 0 18 * 0 0 0 0
1600011 Willington School District 7 * * * 0 * * 0 * * 0
1610011 Wilton School District * * * * * * * 0 0 0 0
1620011 Winchester School District 0 0 0 0 0 0 0 0 0 0 0
1630011 Windham School District 345 45 272 41 * 66 22 0 7 * 0
1640011 Windsor School District 199 22 58 16 0 141 20 0 0 0 0
1650011 Windsor Locks School District 6 * * * 0 * * 0 0 0 0
1660011 Wolcott School District 20 * 8 * 0 12 * 0 0 0 0
1670011 Woodbridge School District 12 * * * 0 * * 0 0 0 0
1690011 Woodstock School District 0 0 0 0 0 0 0 0 0 0 0
2010012 Regional School District 01 * * * * 0 0 0 0 0 0 0

Annual Report on the Use of Physical Restraint and Seclusion in Connecticut, 2015-16 Page 18
All R/S Incidents Emergency Restraints Emergency Seclusions Seclusions via an IEP
Code Organization Name Incident Count
Student Count
Incident Count
Student Count
Injury Count
Incident Count
Student Count
Injury Count
Incident Count
Student Count
Injury Count
2040012 Regional School District 04 0 0 0 0 0 0 0 0 0 0 0
2050012 Regional School District 05 9 * 9 * 0 0 0 0 0 0 0
2060012 Regional School District 06 0 0 0 0 0 0 0 0 0 0 0
2070012 Regional School District 07 0 0 0 0 0 0 0 0 0 0 0
2080012 Regional School District 08 15 * 0 0 0 15 * 0 0 0 0
2090012 Regional School District 09 0 0 0 0 0 0 0 0 0 0 0
2100012 Regional School District 10 12 * * * 0 * * 0 0 0 0
2110012 Regional School District 11 0 0 0 0 0 0 0 0 0 0 0
2120012 Regional School District 12 6 * * * 0 * * 0 0 0 0
2130012 Regional School District 13 * * * * 0 0 0 0 0 0 0
2140012 Regional School District 14 87 * 19 * 0 68 * * 0 0 0
2150012 Regional School District 15 13 * 13 * 0 0 0 0 0 0 0
2160012 Regional School District 16 11 * * * 0 * * 0 0 0 0
2170012 Regional School District 17 21 * * * 0 * * * 0 0 0
2180012 Regional School District 18 0 0 0 0 0 0 0 0 0 0 0
2190012 Regional School District 19 0 0 0 0 0 0 0 0 0 0 0
3370015 Department of Mental Health and Addiction Services 0 0 0 0 0 0 0 0 0 0 0
3470015 Unified School District #2 50 32 50 32 * 0 0 0 0 0 0
9000016 Connecticut Technical High School System 0 0 0 0 0 0 0 0 0 0 0
LEA TOTAL 12,026 1,541 6,580 1,282 77 5,215 747 36 231 55 0
2410014 Capitol Region Education Council 2099 133 785 102 * 1314 72 0 0 0 0
2420014 EdAdvance 65 8 65 8 * 0 0 0 0 0 0
2430014 Cooperative Educational Services 1359 103 596 79 * 763 67 0 0 0 0
2440014 Area Cooperative Educational Services 805 139 281 90 26 524 97 7 0 0 0
2450014 Learn 623 25 528 22 0 95 14 0 0 0 0
2530014 Eastern Connecticut Regional Educational Service Center (EASTCONN)
647 53 183 40 * 464 36 * 0 0 0
RESC TOTAL 5,598 460 2,438 340 35 3,160 286 9 0 0 0
0360161 Academy at Mount Saint John 0 0 0 0 0 0 0 0 0 0 0
0830561 Academy of Wheeler Clinic 0 0 0 0 0 0 0 0 0 0 0
0330161 Adelbrook-The Learning Center of Cromwell 2349 62 1535 52 11 814 50 * 0 0 0
0430121 Adelbrook-The Learning Center of East Hartford 25 7 * * 0 * * 0 0 0 0
0770221 Adelbrook-The Learning Center of Manchester 786 19 635 19 * 151 14 0 0 0 0
1550361 American School for the Deaf 11 * * * 0 * * 0 0 0 0
0100161 Arch Bridge School 56 6 * 6 0 * * 0 0 0 0
1550561 Ben Bronz Academy 0 0 0 0 0 0 0 0 0 0 0
1480461 Benhaven Academy * * * * 0 * * 0 0 0 0
1480161 Benhaven School 872 34 387 30 * 147 23 * 338 25 *
Annual Report on the Use of Physical Restraint and Seclusion in Connecticut, 2015-16 Page 19
All R/S Incidents Emergency Restraints Emergency Seclusions Seclusions via an IEP
Code Organization Name Incident Count
Student Count
Incident Count
Student Count
Injury Count
Incident Count
Student Count
Injury Count
Incident Count
Student Count
Injury Count
1480261 Best Academy 235 22 86 15 * 142 22 0 7 * 0
0840461 CCCD-Bridgeport Ave. 177 10 * * 0 145 10 0 * * 0
0840561 CCCD-Wolf Harbor Rd. 1819 30 1392 23 * 427 16 * 0 0 0
0890461 CCMC School 1294 75 1083 75 8 * 41 0 * * 0
0620261 Cedarhurst School * * * * 0 0 0 0 0 0 0
0930661 Chapel Haven 0 0 0 0 0 0 0 0 0 0 0
0840161 Charles F. Hayden School at Boys & Girls Village 167 41 167 41 0 0 0 0 0 0 0
0770161 Community Child Guidance Clinic School 211 41 * 18 0 172 40 0 * * 0
0950161 Connecticut College Children's Program 0 0 0 0 0 0 0 0 0 0 0
0740161 Connecticut Junior Republic * * * * 0 0 0 0 0 0 0
1500161 Devereux Glenholme School * * * * 0 0 0 0 0 0 0
0570161 Eagle Hill School 0 0 0 0 0 0 0 0 0 0 0
0642061 Eagle House Education Program 57 16 57 16 0 0 0 0 0 0 0
1010161 Elizabeth Ives School for Special Children 6 * * * 0 * * 0 0 0 0
0846061 Foundation School-Milford 7 * 7 * 0 0 0 0 0 0 0
1070161 Foundation School-Orange 0 0 0 0 0 0 0 0 0 0 0
0646061 Futures School * * * * 0 0 0 0 0 0 0
1550161 Gengras Center 475 30 141 17 * 187 19 0 147 11 0
0510261 Giant Steps CT School 16 8 16 8 0 0 0 0 0 0 0
0640261 Grace S. Webb School 499 45 208 37 0 291 41 0 0 0 0
0760161 Grove School 0 0 0 0 0 0 0 0 0 0 0
1485061 High Road Academy-Wallingford 1559 64 813 61 * 746 57 0 0 0 0
0642161 High Road School of Hartford High 272 34 239 32 12 33 15 0 0 0 0
0642261 High Road School of Hartford-Primary 458 26 179 24 * 279 26 * 0 0 0
0950421 High Road School of New London Middle/High at Shiloh 28 10 7 6 0 21 10 0 0 0 0
0950821 High Road School of New London Primary at Bennie Dover
639 20 346 19 0 293 18 0 0 0 0
1036261 High Road School of Norwalk 395 30 236 26 * * 27 0 * * 0
1075061 Hope Academy 0 0 0 0 0 0 0 0 0 0 0
1550261 Intensive Education Academy 157 * 28 * * 129 * * 0 0 0
1380121 Ippi Academy 1231 27 32 7 0 402 27 0 797 14 *
0190161 Learning Clinic * * * * 0 0 0 0 0 0 0
0450161 Light House on Main St * * * * 0 * * 0 0 0 0
0450261 Light House on Pennsylvania Ave 19 * 12 * 0 7 * 0 0 0 0
0626161 Lorraine D. Foster Day School 0 0 0 0 0 0 0 0 0 0 0
0770361 Manchester Memorial Hospital Clinical Day School 0 0 0 0 0 0 0 0 0 0 0
0800161 Meliora Academy 494 14 335 12 8 159 8 * 0 0 0
0780161 Natchaug Hospital Inpatient School 0 0 0 0 0 0 0 0 0 0 0

Annual Report on the Use of Physical Restraint and Seclusion in Connecticut, 2015-16 Page 20
All R/S Incidents Emergency Restraints Emergency Seclusions Seclusions via an IEP
Code Organization Name Incident Count
Student Count
Incident Count
Student Count
Injury Count
Incident Count
Student Count
Injury Count
Incident Count
Student Count
Injury Count
0780361 Natchaug Hospital Journey School * * * * * * * 0 0 0 0
0780261 Natchaug Hospital School CDT-Mansfield 25 7 25 7 * 0 0 0 0 0 0
1060161 Natchaug Hospital School CDT-Shoreline 0 0 0 0 0 0 0 0 0 0 0
1630661 Natchaug Hospital School CDT-Willimantic 0 0 0 0 0 0 0 0 0 0 0
0690161 Natchaug Hospital School Joshua Center NE-Danielson 0 0 0 0 0 0 0 0 0 0 0
1040721 Natchaug Hospital School Joshua Center Thames Valley CDT
* * * * 0 0 0 0 0 0 0
0490161 Natchaug Hospital School Joshua Center-Enfield 0 0 0 0 0 0 0 0 0 0 0
1100261 Northwest Village School/Wheeler Clinic 1758 117 867 101 14 891 93 * 0 0 0
0920161 Oak Hill School at Ann Antolini School 0 0 0 0 0 0 0 0 0 0 0
0170221 Oak Hill School at Bristol North 11 * 11 * * 0 0 0 0 0 0
0170561 Oak Hill School at Bristol South 12 * 12 * * 0 0 0 0 0 0
0046921 Oak Hill School at Farmington Valley Montessori 0 0 0 0 0 0 0 0 0 0 0
1106161 Oak Hill School at Haddam-Killingworth High School * * * * 0 0 0 0 0 0 0
0895161 Oak Hill School at Hartford 12 * 12 * 0 0 0 0 0 0 0
1105261 Oak Hill School at Middle School of Plainville 30 6 30 6 0 0 0 0 0 0 0
0890261 Oak Hill School at New Britain 69 * 69 * * 0 0 0 0 0 0
1100361 Oak Hill School at Toffolon 0 0 0 0 0 0 0 0 0 0 0
0646161 Options Educational Services 0 0 0 0 0 0 0 0 0 0 0
1550861 PACES 16 * 16 * 0 0 0 0 0 0 0
0440221 Pathways 0 0 0 0 0 0 0 0 0 0 0
1356721 Pinnacle School * * * * 0 * * 0 0 0 0
0890361 Raymond Hill School 1050 76 558 61 0 492 65 0 0 0 0
0380261 Rushford Academy 0 0 0 0 0 0 0 0 0 0 0
0516061 Saint Catherine Academy 0 0 0 0 0 0 0 0 0 0 0
0460161 Speech Academy 0 0 0 0 0 0 0 0 0 0 0
1356621 Spire School 0 0 0 0 0 0 0 0 0 0 0
1440161 St. Vincent's Special Needs School Program * * * * 0 0 0 0 0 0 0
1410161 Susan Wayne Center of Excellence 50 22 * 21 0 * * 0 0 0 0
0740461 Touchstone School * * * * 0 0 0 0 0 0 0
1350161 Villa Maria Education Center 0 0 0 0 0 0 0 0 0 0 0
1520161 Waterford Country School 29 14 29 14 * 0 0 0 0 0 0
0250161 Webb School at Cheshire 630 22 151 16 0 479 20 0 0 0 0
0046821 Webb School in the Valley 266 7 127 7 0 139 7 0 0 0 0
0620361 Whitney Hall School 78 35 78 35 17 0 0 0 0 0 0
0846161 Woodhouse Academy 0 0 0 0 0 0 0 0 0 0 0
0931461 Yale Child Study Center School 0 0 0 0 0 0 0 0 0 0 0
APSEP TOTAL 18,383 1,008 10,154 851 99 6,932 662 10 1,297 60 *
Annual Report on the Use of Physical Restraint and Seclusion in Connecticut, 2015-16 Page 21
All R/S Incidents Emergency Restraints Emergency Seclusions Seclusions via an IEP
Code Organization Name Incident Count
Student Count
Incident Count
Student Count
Injury Count
Incident Count
Student Count
Injury Count
Incident Count
Student Count
Injury Count
9010022 Norwich Free Academy District 0 0 0 0 0 0 0 0 0 0 0
9020022 Gilbert School District 0 0 0 0 0 0 0 0 0 0 0
9030022 Woodstock Academy District 0 0 0 0 0 0 0 0 0 0 0
ACADEMY TOTAL 0 0 0 0 0 0 0 0 0 0 0
2610013 Jumoke Academy District 0 0 0 0 0 0 0 0 0 0 0
2630013 Odyssey Community School District 0 0 0 0 0 0 0 0 0 0 0
2640013 Integrated Day Charter School District 0 0 0 0 0 0 0 0 0 0 0
2650013 Interdistrict School for Arts and Comm District 0 0 0 0 0 0 0 0 0 0 0
2680013 Common Ground High School District 0 0 0 0 0 0 0 0 0 0 0
2690013 Bridge Academy District 0 0 0 0 0 0 0 0 0 0 0
2700013 Side By Side Charter School District 0 0 0 0 0 0 0 0 0 0 0
2720013 Explorations District 0 0 0 0 0 0 0 0 0 0 0
2780013 Trailblazers Academy District 0 0 0 0 0 0 0 0 0 0 0
2790013 Amistad Academy District 13 9 13 9 0 0 0 0 0 0 0
2800013 New Beginnings Inc., Family Academy District 0 0 0 0 0 0 0 0 0 0 0
2820013 Stamford Academy District 0 0 0 0 0 0 0 0 0 0 0
2830013 Park City Prep Charter School District 0 0 0 0 0 0 0 0 0 0 0
2850013 Bridgeport Achievement First District * * * * 0 0 0 0 0 0 0
2860013 Highville Charter School District 0 0 0 0 0 0 0 0 0 0 0
2880013 Achievement First Hartford Academy Inc. District * * * * 0 0 0 0 0 0 0
2890013 Elm City College Preparatory School District * * * * 0 0 0 0 0 0 0
2900013 Brass City Charter School District 0 0 0 0 0 0 0 0 0 0 0
2910013 Elm City Montessori School District 0 0 0 0 0 0 0 0 0 0 0
2930013 Path Academy District 0 0 0 0 0 0 0 0 0 0 0
2940013 Great Oaks Charter School District * * * * 0 0 0 0 0 0 0
2950013 Booker T. Washington Academy District 0 0 0 0 0 0 0 0 0 0 0
2960013 Stamford Charter School for Excellence District 0 0 0 0 0 0 0 0 0 0 0
2970013 Capital Preparatory Harbor School Inc. District 0 0 0 0 0 0 0 0 0 0 0
CHARTER SCHOOL TOTAL 25 25 17 25 17 0 0 0 0 0 0
STATEWIDE 36,032 2912 19,197 2,403 211 15,307 1,660 55 1,528 115 *

Annual Report on the Use of Physical Restraint and Seclusion in Connecticut, 2015-16 Page 22
Appendix B
Comparison reports were presented through the online application to all organizations showing
change in reported data from 2014-15 to 2015-16. For 93 organizations, data reported in 2015-16
indicated a substantial departure from those reported in 2014-15 (44 reported a reduction in R/S
incidents and 49 reported an increase). These 93 organizations provided written feedback
explaining factors contributing to the change. Below is a summary of those responses.
Reasons Stated by Organizations that Evidenced Reduction in Reported R/S Incidents
(1) Implementation of monthly cross program leadership meetings to review data and
target strategies and training of staff.
(2) Development and implementation of a school-wide goal to prevent
seclusion/restraint. (3) Implementation of daily reflection and planning meetings
(4) Closer monitoring of incidents of restraint and seclusion at the building level resulted
in more frequent Planning and Placement Team meetings which supported increased
communication among staff and parents and successful problem solving.
(5) Some organizations identified the implementation of data driven decision making and
detailed analysis of students whose behavior required removal from the classroom as
having a significant impact on the reduction of the use of restraint and seclusion.
(6) Some organizations reported that increased collaboration between school staff and the
clinical team as well as professional development focused on the law and its
requirements and de-escalation strategies provided to all staff resulted in a decrease in
the use restraint and seclusion.
(7) Greater administrative oversight and monitoring regarding the use of restraint and
seclusion produced increased fidelity in the use of de-escalation strategies.
(8) Organizations have expanded training of staff to include guidance related to the Six
Core Strategies for Reducing Seclusion and Restraint Use, district-wide training on
effective classroom management, implementation of prevention and intervention
strategies (SRBI), and the implementation of de-escalation procedures with fidelity.
(9) Organizations report positive impact of the integration of quality trauma informed
care and restorative justice practices, as well as building healthy relationships and
positive behavior supports into a multi-tiered model of supports.
(10) Provision of additional sensory environments and availability of sensory supports and
interventions was also noted as contributing to reductions specific to students with
Autism.
(11) LEAs reported that many incidents of R/S reported in the previous year were for
students with significant self-injurious and aggressive behaviors. These students each
had multiple restraints or seclusions within a single incident and in many cases
accounted for the majority of reported incidents. PPT decisions have since resulted in
these students being placed in more restrictive settings outside the LEA to better
accommodate their specific behavioral and educational needs. LEAs reported that
some students representing frequent R/S were placed in alternative settings. (Partial
Hospital Programs (PHPs), APSEPs, Clinical Day settings, RESC programs, out of
state residential facilities, etc.)

Annual Report on the Use of Physical Restraint and Seclusion in Connecticut, 2015-16 Page 23
(12) The use or expanded use of Board Certified Behavior Analysts (BCBAs) to design
student-specific targeted interventions and provide staff support and training as well
as support and training to families was identified by multiple LEAs.
(13) Redeployment of staff or the addition of related service staff or mental health
professionals was also identified. Reduction in class size of self-contained classrooms
and in a number of situations, increased supervision and support (i.e., 2 or 3 staff to 1
student) was also noted.
(14) LEAs attested to change in LEA policy and procedures regarding de-escalation of
aggressive student behaviors as well as a LEA commitment to redesign supports for
students within the general education setting through the implementation of Positive
Behavioral Interventions and Supports (PBIS) as reason for significant reductions in
the use of R/S.
(15) Several LEAs have reported that students continue to benefit from the introduction of
or the expansion of specialized programs now available in the LEA.
(16) LEAs have also partnered with outside public and private agencies and are utilizing
resources available through consultation with specialized programs in order to build
the capacity of the LEA to develop intensive programming to address the needs of
students and better serve students in the LEA.
(17) Some organizations reported that a contributing factor to reduction has been a strict
adherence to admissions criteria or limiting the enrollment of students with
significant aggressive behaviors, leading to enrollment of students in specialized
settings whose needs are appropriate to the design, scope and support services
available through the program.
(18) An overall decline in enrollment in some programs was also noted.
(19) Some organizations indicated that the substantial decrease in incidents was in part due
to expanded training to include para professionals, general educators, principals,
behavior techs and school security or resource officers.
(20) A few organizations reported that reductions are impacted by previous year
inaccuracies in appropriately defining a restraint or seclusion.
Reasons Stated by Organizations that Evidenced Increases in Reported R/S Incidents
(1) Organizations saw dramatic increases in their reported R/S incidents due to one or a
limited number of students that either entered their program or school for the first
time or had returned after being previously enrolled in a more restrictive setting.
Students were described as demonstrating significant self-injurious and aggressive
behaviors through the transition process. These students had multiple incidents each
of which were typically of short duration and due primarily to a student’s self-
injurious behavior.
(2) Some organizations continue to report that increases were the result of more
appropriate reporting related to multiple events in a sequence. For example, a student
demonstrates a behavior that results in a five minute restraint; as the staff member
begins to release the student, the student immediately resumes the prior aggressive
behavior and is restrained once again by staff. Under R/S reporting guidance, each
restraint/release is considered a new incident. Some organizations report that this has
resulted in the appearance of an increase of R/S incidents, when in fact, it is the result
of more appropriate reporting.

Annual Report on the Use of Physical Restraint and Seclusion in Connecticut, 2015-16 Page 24
(3) Districts established in-district programs initiated to address the needs of students
previously placed in more restrictive settings such as RESCs, APSEPs or out of state
facilities. Some organizations reported that they are now servicing and supporting
students demonstrating significant behavioral issues that may require emergency
procedures to ensure the safety of the student and/or others and allow the LEA to
meet the requirement to maintain a safe school.
(4) Some organizations, primarily specialized settings, which reported a substantial
increase from the previous year, indicated that the increases aligned with an overall
increase in enrollment and that the trend in student behavior is characterized as more
dysregulated.
(5) A few organizations continue to report that increases are impacted by previous year
inaccuracies in defining a restraint or seclusion as outlined in the regulations.