Embed Size (px)
Citation preview

Rv
SNa
b
c
a
ARR1AA
KMNMUCRp
1
w2f2lniG
U3
0h
Agriculture, Ecosystems and Environment 185 (2014) 133–143
Contents lists available at ScienceDirect
Agriculture, Ecosystems and Environment
j ourna l h om epage: www.elsev ier .com/ locate /agee
estoration of upland heath from a graminoid- to a Callunaulgaris-dominated community provides a carbon benefit
amuel L.O. Quina,b,∗, Rebekka R.E. Artzb, Andrew M. Couparc,ick A. Littlewoodb, Sarah J. Woodina
Institute of Biological and Environmental Sciences, University of Aberdeen, Cruickshank Building, St. Machar Drive, Aberdeen AB24 3UU, UKThe James Hutton Institute, Ecological Sciences Group, Craigiebuckler, Aberdeen AB15 8QH, UKScottish Natural Heritage, The Links, Golspie Business Park, Golspie, Sutherland KW10 6UB, UK
r t i c l e i n f o
rticle history:eceived 21 May 2013eceived in revised form7 December 2013ccepted 22 December 2013vailable online 20 January 2014
eywords:olinia caeruleaardus strictaoorlandplandsarbon sequestrationestorationH
a b s t r a c t
Restoration of degraded upland habitats has the potential to improve carbon (C) sequestration, thushelping offset national greenhouse gas emissions. Here we test the hypotheses (1) that degraded uplandheath, dominated by graminoids, will have higher rates of soil respiration and smaller C pools than longestablished, Calluna vulgaris (Calluna) dominated upland heath, and (2) that restoration of degraded heathwill increase carbon pools and decrease soil respiration towards that of “target” Calluna heath.
Soil respiration and total and recalcitrant C stocks in above- and below-ground vegetation and in thetopsoil (to a depth of 15 cm) were estimated at seven upland sites in Northern England and Scotland.Three vegetation types were present at each site; graminoid-dominated upland heath that had formerlybeen Calluna-dominated upland heath (“degraded”); restored upland heath, converted from graminoidto dwarf shrub dominance (“restored”) and long-established, Calluna-dominated (“target”) upland heath.
Soil respiration did not differ between the three vegetation types. Degraded areas contained a largerC pool in the vegetation but a lower soil C pool and total C stock than target areas. Restored areas heldsimilar vegetation, soil and total C stocks to those of target areas. All areas had similar pools of recalcitrantC in their vegetation, but both target and restored areas contained more recalcitrant C in the soil, and in
total, than degraded areas.The C benefit of restoration varied between sites, partly due to the abundance of Molinia caerulea indegraded vegetation at some sites, but the overall C benefit of restoring Calluna-dominated upland heathwas 0.60 ± 0.70 t C ha−1 yr−1 since restoration. Restoration also increased the size of the recalcitrant C pool,which will increase C residence time and hence soil C accumulation in the longer term. Thus restorationof degraded areas is a valid option for promoting C sequestration within upland heath.
. Introduction
UK soils represent a pool of 6–7 billion tonnes of carbon (C), ofhich a large majority resides in organic upland soils (Emmett et al.,
010; Schils et al., 2008). The UK uplands are under great pressurerom many different land uses and land use changes (Holden et al.,007; Ostle et al., 2009). It is increasingly being recognised that
and management and land use change have the potential to sig-
ificantly alter C cycling and provide important mitigation againstncreasing greenhouse gas emissions (Dawson and Smith, 2007;uo and Gifford, 2002; Ostle et al., 2009; Post and Kwon, 2000). In
∗ Corresponding author at: Institute of Biological and Environmental Sciences,niversity of Aberdeen, Cruickshank Building, St. Machar Drive, Aberdeen AB24UU, UK. Tel.: +44 1224 272688.
E-mail address: [email protected] (S.L.O. Quin).
167-8809/$ – see front matter © 2014 Elsevier B.V. All rights reserved.ttp://dx.doi.org/10.1016/j.agee.2013.12.022
© 2014 Elsevier B.V. All rights reserved.
order for the UK to achieve an 80% reduction in greenhouse gasemissions by 2050 (UK Climate Change Bill, 2008) more under-standing of the effects of upland land use on soil C dynamics isneeded. Upland dwarf shrub heath (upland heath) is a UK habi-tat with the potential to provide substantial C sequestration andhence contribute to national greenhouse gas emissions abatement.Upland heath soil has a high C concentration (284.9 g C kg−1) anddensity (89.9 t C ha−1) in the top 15 cm of the soil profile and hashistorically undergone dramatic shifts in vegetation composition(Emmett et al., 2010). Thus, restoration of this habitat could presenta positive opportunity for C management.
There are a globally important 1.2 million hectares of uplandheath within the UK (Carey et al., 2008). It is dominated by the ever-
green dwarf shrub Calluna vulgaris (Calluna) and typically occurson soil with a shallow organic layer (<50 cm). Due to its range ofplant and invertebrate communities and unique bird assemblage,upland heath is designated a UK Priority Habitat (Thompson et al.,
1 ems a
1tsua2
tb(seaw1CpreJeg(2foie2tcs
eoeThsltMsslsgtiref
(
TU
34 S.L.O. Quin et al. / Agriculture, Ecosyst
995; UK BAP, 2008). Upland heaths are often managed by rota-ional burning for sporting interests (red grouse Lagopus lagopushooting); they also provide grazing for domestic livestock, partic-larly sheep and have long been valued for aesthetic, recreationalnd rural economic reasons (Gimingham, 1995; Holden et al.,007).
During the second half of the last century, through a combina-ion of historically high stocking densities of sheep and intensiveurning regimes, upland heath suffered a dramatic decline in extentHolden et al., 2007). In recent years the area of upland heath hastabilised but the condition of the habitat remains variable (Careyt al., 2008; Williams, 2006). Areas previously dominated by Callunare now in a degraded state, dominated by single graminoid specieshich reduce biodiversity as well as grazing quality (Gimingham,
975) and affect other upland heath ecosystem services, such as storage. Calluna is a relatively slow-growing species, with lowrimary productivity and respiration, and produces poor quality,ecalcitrant litter which is resistant to decomposition (De Deynt al., 2008; Grime and Hunt, 1975; Heim and Schmidt, 2006;alal et al., 1982). Graminoids exhibit contrasting traits (De Deynt al., 2008) and thus a shift from evergreen shrubs to deciduousraminoid species has the potential to alter key C cycling processesChapin, 2003; De Deyn et al., 2008, 2009; McLaren and Turkington,010; Quin et al., 2013; Ward et al., 2007, 2009). This is evidentrom many occurrences of where woody shrub encroachment hasccurred in graminoid-dominated systems, generally resulting inncreased soil and vegetation C pools, although there are obviouslyxceptions (Barger et al., 2011; Bradley et al., 2006; Eldridge et al.,011; Knapp et al., 2008; Montané et al., 2010). Therefore restora-ion of areas now dominated by graminoids, enabling vegetationommunity reversion towards dwarf shrub cover, could increase Ctocks of upland heath in the UK.
Investigation of the impact of upland habitat restoration on veg-tation recovery and associated C cycling has focused on the highlyrganic soils of peatland ecosystems (Artz et al., 2008a,b; Luccheset al., 2010; Waddington and Day, 2007; Waddington et al., 2003).he restoration of Calluna on graminoid-dominated upland heathas not been aimed at C sequestration, but rather at restoring targetpecies. Most studies focused on investigating which high and/orow intensity methods (e.g. graminoid specific herbicide, rotova-ion, grazer exclusion) have the most success (Britton et al., 2000;
itchell et al., 2008a,b; Pakeman et al., 2003). However, a recenttudy by Medina-Roldán et al. (2012) investigated the impact ofeven years of grazer removal on soil C stocks in upland grass-and. They found the ratio of dwarf shrub to graminoid increasedignificantly but, despite the contrast between dwarf shrub andraminoid vegetation, which produced significant differences in lit-er accumulation and microbial activity, no change was detectedn the soil C stock. More research is needed to investigate howestoration of graminoid-dominated areas of upland heath influ-
nces C dynamics and whether it is a viable management optionor improving C gain accumulation.This study compares graminoid-dominated upland heath“degraded”), restored heath dominated by Calluna (“restored”),
able 1pland heath restoration projects surveyed.
Site Code Lat/long Degraded sta
Ben Lawers bl 4◦15.6′ W, 56◦30.8′ N Nardus strictaBowland bo 2◦34.7′ W, 53◦56.7′ N Molinia caeruCarlecotes ca 1◦44.6′ W, 53◦31.4′ N Molinia caeruDerwent 1 d1 1◦44.6′ W, 53◦25.5′ N Molinia caeruDerwent 2 d2 1◦44.6′ W, 53◦26.5′ N Nardus strictaGeltsdale ge 2◦33.7′ W, 54◦54.9′ N Molinia caeruHigh Moor hm 2◦03.6 W, 53◦13.1′ N Molinia caeru
nd Environment 185 (2014) 133–143
and long-established, Calluna-dominated heath (“target”) at sevenupland sites across the UK in terms of: (1) C stocks in the vegeta-tion, litter and upper soil horizon; (2) the proportion of C held inrecalcitrant forms; and (3) the rate of respiratory CO2 efflux fromthe soil. The hypotheses are that target heath contains larger totaland recalcitrant carbon pools, and has lower rates of soil CO2 efflux,than degraded heath, and that restoration of degraded heath willincrease carbon pools and decrease soil respiration towards thoseof target heath. Should this prove to be the case, it would provide areason to restore upland heath additional to that of habitat restora-tion.
2. Materials and methods
2.1. Field sites
This study utilised a very valuable resource of existing long-term, large scale upland management projects which had beenimplemented by land owners over the previous 14–20 years,hence enabling us to investigate the consequences of “real world”management practices. Field work was carried out during Juneand July 2010 at seven upland heath restoration project sitesin England and Scotland, at each of which degraded vegetation,restored areas and long-established in-tact heath occur in closeproximity (Table 1, Table S1, Fig. 1). All sites were traditionallymanaged as grazing land. Plots had been established at each sitein 2003 by Littlewood et al. (2006a); six plots in each of degraded,restored and target vegetation. Degraded areas were dominatedby either Molinia caerulea (Molinia) or Nardus stricta (Nardus)(Table 1, Table S1); Calluna was present at very low abundancein some of the degraded areas. Restored areas were previouslysimilar to the degraded areas but due to restoration manage-ment are now dominated by Calluna. Restoration was by eithergrazer exclusion or mechanical restoration (a combination of herbi-cide application, scarification and reseeding). Target areas are longestablished Calluna-dominated upland heath. All Calluna sampledwas in the building phase of its life-cycle, between 6 and 15 yearsold (Gimingham, 1975). At the time of sampling all vegetation typesat all sites were open to low intensity grazing (with the exception ofthe restored area at Ben Lawers which still had intact sheep exclo-sures). Soils at all sites were acidic (pH 2.9–5.0) (Littlewood, 2005)and highly organic, with differing depth of the organic layer (TableS1).
2.2. Vegetation biomass sampling and analysis
We determined the total C content and proportion of recalci-trant C in aboveground parts of Calluna and other species groupedby functional type, and in roots of all species combined. Ateach plot the total aboveground vegetation was harvested down
to the top of the litter layer (the layer of detached, relativelyundecomposed plant debris) within a 0.5 m × 0.5 m quadrat. Eachquadrat was chosen to represent the vegetation composition ofthe immediate area. Where Molinia was dominant, forming large,te Start of restoration Restoration method
1990 Grazing controllea/Nardus stricta 1996/1997 Grazing controllea 1992 Mechanicallea/Nardus stricta 1994 Mechanical
1994 Mechanicallea 1995 Grazing controllea 1995 Mechanical

S.L.O. Quin et al. / Agriculture, Ecosystems a
FD
dttmaohlnAsNPrSisf
tCa
The C values calculated were for bulk soil, including roots. For
ig. 1. Location of the seven field sites. Derwents includes Derwent 1 anderwent 2.
ense tussocks, the Molinia leaves were harvested down to theop of the shoot bases. The total area of tussock (formed byightly packed shoot bases) within the quadrat was then esti-
ated and a 10 × 10 cm sub-sample of shoot bases taken fornalysis (to reduce the quantity of plant material to be carriedut of remote field sites). Plots with sparser Molinia cover werearvested fully. Vegetation was air dried and sorted into the fol-
owing plant categories: Calluna; other dwarf-shrubs (Empetrumigrum, Vaccinium myrtillus and V. vitis-idaea); graminoids (e.g.grostis sp., Anthoxanthum odoratum, Deschampsia flexuosa, Carexp., Eriophorum spp., Festuca spp., Juncus spp., Molinia caerulea andardusstricta); herbs (e.g. Galium saxatile, Polygala vulgaris andotentilla erecta); and moss (e.g. Hypnum cupressiforme agg., Pleu-ozium schreberi, Polytrichum commune, Rhytidiadelphus spp. andphagnum spp.). Material was dried at 80 ◦C for 48 h before weigh-ng. Three composite samples of each plant category, includingubsamples from all sites and vegetation types, were ball-milledor analysis.
For root analysis, one soil core was taken from each of three ofhe six plots at random within each vegetation type at each site.ores were split into the layers detailed below (Soil sampling andnalysis) and the volume of each layer was recorded. Root material
nd Environment 185 (2014) 133–143 135
was extracted by washing the soil over a 0.5 mm sieve and dried(80 ◦C for 48 h) before weighing. For each vegetation type, threecomposite samples of roots, each including pooled material fromall sites, were ball-milled for analysis.
For all plant material, total % carbon (C) was analysed using anelemental analyser (Carlo Erba NA 1500). To determine the amountof recalcitrant C, the acid soluble fractions of plant C were removed,leaving behind the acid insoluble fraction comprising lignin andlignin-like compounds. The protocol was based on the methodsof Ryan et al. (1990) and Woodin et al. (2009), with the inclu-sion of centrifugation. A 0.1 g subsample of each milled vegetationsample was used. Each subsample was weighed directly into a pre-weighed 50 ml centrifuge tube with 1.5 ml of 72% H2SO4, mixedand placed in a sonicating water bath at 30 ◦C for 30 min. Approx-imately 42 ml of deionised water was added, mixed and the tubeplaced in a water bath at 100 ◦C for 1 h. After cooling, the tube wascentrifuged at 10,000 rpm for 1 min and the supernatant decanted,avoiding disruption of the pellet. The pellet was shaken with 40 mldeionised water and re-centrifuged. After decanting the super-natant, the sample was dried in the tube at 100 ◦C for 24 h, weighedand analysed for % C. This recalcitrant C was calculated as a propor-tion of total C, which was then used to calculate the total amountof recalcitrant C in the vegetation.
2.3. Soil respiration
To compare CO2 efflux from the soil between vegetation types,soil respiration was determined before vegetation harvest. A 10 cmdiameter soil collar was inserted up to 5 cm into the soil profile ineach plot and left for 2–3 weeks equilibration. Aboveground vege-tation was removed down to the litter layer prior to collar insertion.In July 2010 soil respiration was measured twice (and averaged) ateach plot using a Li-8100 closed dynamic infra-red gas analyser(Licor, USA) attached to a 10 cm diameter dark survey chamber,with a closure time of 90 s. Soil temperature and moisture werealso recorded.
2.4. Soil sampling and analysis
In order to determine the C stocks of the soil layers, three soilcores (4.2 cm diameter × 15 cm deep) were taken adjacent to eachplot. The cores were placed in sealed plastic bags in a cool-boxfor transport to the laboratory and stored at 5 ◦C until processed.Cores were split into layers: fermentation (older litter in vari-ous stages of decomposition but with some plant structures stillidentifiable); organic (decomposed organic matter with no plantparts identifiable macroscopically and no mineral fragments); andorgano-mineral (a mixture of organic soil and visible mineral frag-ments). A sample of litter was also taken from an undisturbed areaadjacent to each plot. The depth, volume, dry weight (80 ◦C for48 h) and bulk density of each layer (including the litter) was deter-mined. For each soil layer, one sample from each of three randomlyselected plots within each site and vegetation type were bulked andhomogenised, with a subsample finely ball-milled and analysed fortotal % C and recalcitrant C, as detailed above. The average C values,bulk density estimates and soil layer depths were used to calcu-late amounts of total and recalcitrant soil C. It should be noted thatin sites/vegetation types with deep fermentation and organic lay-ers, the organo-mineral layer was not sampled by 15 cm soil corer;hence the number of replicates for organo-mineral soil is reduced.
each soil layer, C values for roots, obtained separately (see above),were then subtracted from the bulk soil C values to provide C valuesfor soil only, and these are the soil C data presented.
1 ems and Environment 185 (2014) 133–143
2
gcspahppfldobf
2
fCwrsatsvteseaapmbf
C
a1
3
3
atrtiioFtlv
6, 23term (F12, 23 = 19.9, P < 0.001). Overall, the degraded areas heldmore total C in the vegetation (14.3 ± 1.5 t C ha−1) compared tothe target (12.0 ± 0.6 t C ha−1, LSD, P = 0.001) and restored areas
Table 2Total C concentration (%) and recalcitrant C as a proportion of total C, in above-ground parts of different plant categories and in roots of all species combined. Mean(n = 3 composite samples) ± 1 s.e. Aboveground material was pooled between sitesand vegetation types; root material was separated by treatment type and pooledbetween sites. Values with the same letter are not significantly different (LSD,P < 0.05).
Plant categories Total C (%) Recalcitrant C(proportion of total C)
Callunaa 50.57 ± 0.09A,B 0.58 ± 0.03A
Dwarf shruba 51.09 ± 0.23A,D 0.50 ± 0.05A,B
Graminoidb 48.55 ± 1.18B 0.41 ± 0.04B
Moss 45.85 ± 0.07C 0.25 ± 0.04C
Herb 45.66 ± 0.05C 0.28 ± 0.04C
Root-degraded 49.64 ± 0.33B,D 0.43 ± 0.03B,D
36 S.L.O. Quin et al. / Agriculture, Ecosyst
.5. Macrofossil analysis
To estimate the relative contribution of dwarf shrub andraminoid material to the organic layer, macrofossil analysis wasarried out on soil cores collected in June 2011 from two randomlyelected plots within each vegetation type, at each site. A sam-le (5 cm3) was taken from the top (2 cm) of the organic layernd heated to 50 ◦C with 10 ml of 5% KOH for 45 min to dissolveumic and fulvic acids (Mauquoy and Van Geel, 2006). The sam-le was then sieved (100 �m mesh), rinsed and transferred to aetridish with sufficient distilled water to allow the material tooat. Using a low power (×16) stereozoom microscope and a grid-ed graticule (10 × 10 grid), three subsample counts were madef graminoid and dwarf shrub fragments. Counts were averagedetween the subsamples and the ratio of dwarf-shrub:graminoidragments calculated.
.6. Calculations and statistical analysis
Data analysis was undertaken using linear mixed models. Dataor the majority of the parameters (pH, vegetation C, soil C and total) were structured with vegetation type and site as fixed variables,ith plot, nested within site, as a random factor in the analysis. Soil
espiration was analysed with the same structure as above but withampling date included as another fixed variable and soil moisturend soil temperature as covariates. Soil moisture was cubed prioro inclusion in the model. In the vegetation C concentration analy-is, plant category was the only fixed factor used with no randomariables. For the soil and total C analysis soil moisture and soilemperature were initially included as covariates but although theyxplained some variation, they did not influence the main effects;oil acidity was also explored as a covariate. Soil pH was alwaysxpressed as [H+] in analysis. Type 1 sum of squares was used inll models. The residuals of all linear mixed models were checkednd found to be normal. Post-hoc testing was performed using LSDairwise comparisons based on a significant main effect from theixed model. Pearson Correlation was used for correlations. The C
enefit of the two restoration techniques was calculated using theollowing calculation:
benefit
= total C stock of restored area − total C stock of degraded areayears since restoration initiated
The C benefit data were analysed by one-way analysis of vari-nce. All analyses were performed using IBM SPSS statistics (version9).
. Results
.1. Soil respiration
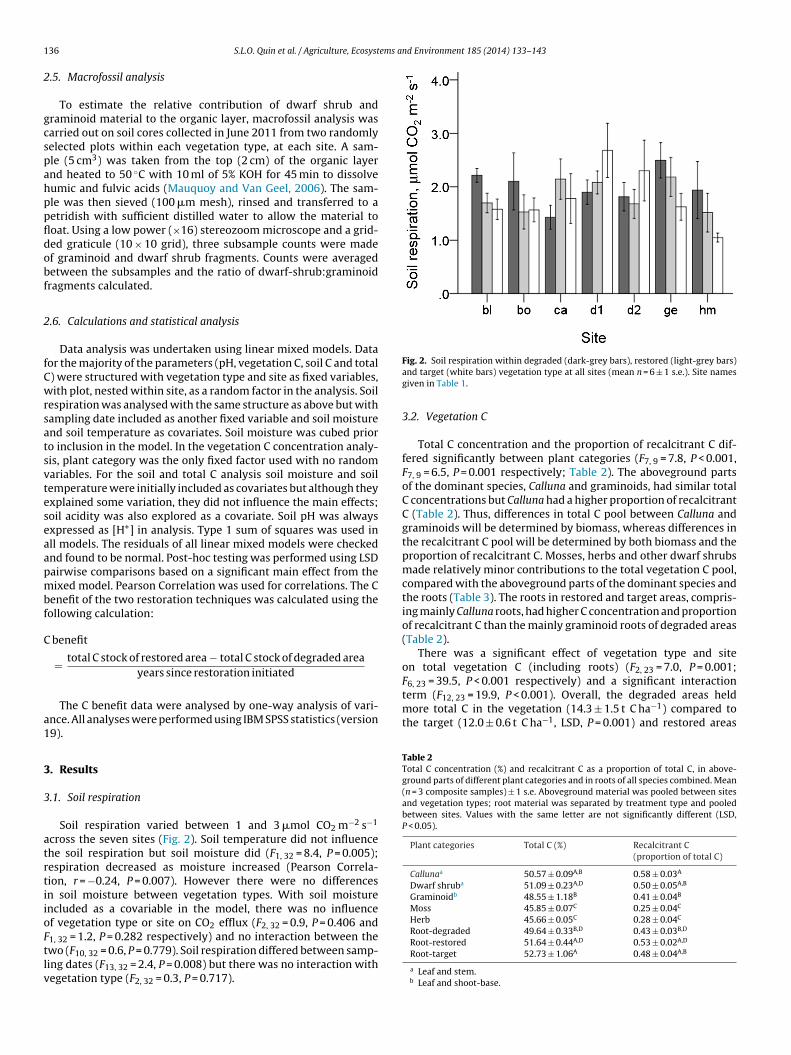
Soil respiration varied between 1 and 3 �mol CO2 m−2 s−1
cross the seven sites (Fig. 2). Soil temperature did not influencehe soil respiration but soil moisture did (F1, 32 = 8.4, P = 0.005);espiration decreased as moisture increased (Pearson Correla-ion, r = −0.24, P = 0.007). However there were no differencesn soil moisture between vegetation types. With soil moisturencluded as a covariable in the model, there was no influencef vegetation type or site on CO2 efflux (F2, 32 = 0.9, P = 0.406 and
1, 32 = 1.2, P = 0.282 respectively) and no interaction between thewo (F10, 32 = 0.6, P = 0.779). Soil respiration differed between samp-ing dates (F13, 32 = 2.4, P = 0.008) but there was no interaction withegetation type (F2, 32 = 0.3, P = 0.717).Fig. 2. Soil respiration within degraded (dark-grey bars), restored (light-grey bars)and target (white bars) vegetation type at all sites (mean n = 6 ± 1 s.e.). Site namesgiven in Table 1.
3.2. Vegetation C
Total C concentration and the proportion of recalcitrant C dif-fered significantly between plant categories (F7, 9 = 7.8, P < 0.001,F7, 9 = 6.5, P = 0.001 respectively; Table 2). The aboveground partsof the dominant species, Calluna and graminoids, had similar totalC concentrations but Calluna had a higher proportion of recalcitrantC (Table 2). Thus, differences in total C pool between Calluna andgraminoids will be determined by biomass, whereas differences inthe recalcitrant C pool will be determined by both biomass and theproportion of recalcitrant C. Mosses, herbs and other dwarf shrubsmade relatively minor contributions to the total vegetation C pool,compared with the aboveground parts of the dominant species andthe roots (Table 3). The roots in restored and target areas, compris-ing mainly Calluna roots, had higher C concentration and proportionof recalcitrant C than the mainly graminoid roots of degraded areas(Table 2).
There was a significant effect of vegetation type and siteon total vegetation C (including roots) (F2, 23 = 7.0, P = 0.001;F = 39.5, P < 0.001 respectively) and a significant interaction
Root-restored 51.64 ± 0.44A,D 0.53 ± 0.02A,D
Root-target 52.73 ± 1.06A 0.48 ± 0.04A,B
a Leaf and stem.b Leaf and shoot-base.

S.L.O. Quin et al. / Agriculture, Ecosystems and Environment 185 (2014) 133–143 137
Table 3Proportion of total vegetation C pool from each plant category; Calluna, dwarf shrubs,graminoids, herbs, moss and root material (to depth of 15 cm) for each vegetationtype. Mean (n = 7) ± 1 s.e.
Plant functional group Proportion of total vegetation C pool (%)
Degraded Restored Target
Calluna 2.6 ± 1.4 45.3 ± 5.1 45.3 ± 4.4Dwarf shrub 1.9 ± 0.8 3.3 ± 1.2 4.2 ± 0.9Graminoid 48.5 ± 7.6 1.3 ± 0.7 0.5 ± 0.2Moss 3.7 ± 1.2 2.9 ± 0.8 7.3 ± 3.2Herb 0.3 ± 0.1 0.1 ± 0.1 0.1 ± 0.1
(vphsvb
abaFTa
Fgga
Root 45.5 ± 6.6 48.6 ± 4.1 42.7 ± 4.2
12.1 ± 0.8 t C ha−1, LSD, P = 0.002) (Fig. 3a). However, the patternaried between sites; at three sites (those at which Molinia com-letely dominated the degraded area), the degraded vegetationeld more total C than that of target and restored areas, at twoites the target vegetation held the most C, at one site the restoredegetation held the most C and at one site there was no differenceetween types (Fig. 3a).
There was no overall difference between vegetation types in themount of recalcitrant C in the vegetation, averaging ∼ 6.0 t ha−1,ut there was an effect of site and an interaction between sitend vegetation type (vegetation type F2, 23 = 0.5, P = 0.599; site6, 23 = 34.5, P < 0.001; interaction F12, 23 = 18.8, P < 0.001) (Fig. 3b).he pattern of vegetation type differences across sites was the same
s for total C.ig. 3. (a) Total and (b) recalcitrant C within total vegetation (above- and below-round, roots to depth of 15 cm) within degraded (dark-grey bars), restored (light-rey bars) and target (white bars) vegetation type at all sites (mean n = 6 ± 1 s.e.)nd overall (mean n = 7 ± 1 s.e.).
Fig. 4. (a) Total and (b) recalcitrant C within soil (excluding roots) to a depth of 15 cmwithin degraded (dark-grey bars), restored (light-grey bars) and target (white bars)vegetation type at all sites (mean n = 6 ± 1 s.e.) and overall (mean n = 7 ± 1 s.e.).
3.3. Soil C
There were significant effects of vegetation type, site and theinteraction between them on the total C within the top 15 cm of thesoil, excluding roots (F2, 23 = 4.1, P = 0.019, F6, 23 = 10.5, P = 0.001 andF12, 23 = 3.3, P < 0.001 respectively) (Fig. 4a). Overall, soil in degradedareas contained less total C (88.21 ± 4.53 t C ha−1) than in restored(100.16 ± 5.66 t C ha−1; LSD, P = 0.025) and target (102.01 ± 4.10 tC ha−1; LSD, P = 0.010) areas, which did not differ (LSD, P = 0.725).However, this pattern varied greatly between sites. Degraded areascontained less soil C than target areas at three sites and a simi-lar amount at all others. Restored areas contained less soil C thandegraded areas at one site, a similar amount at three sites and moreat three sites. Comparing restored with target areas, the restoredareas contained less soil C at three sites, a similar amount at twosites and more soil C at two sites (Fig. 4a).
Similarly the amount of recalcitrant C in the soil was influ-enced by vegetation type, site and their interaction (F2, 23 = 7.4,P < 0.001, F6, 23 = 16.8, P < 0.001, F12, 23 = 4.5, P < 0.001 respectively)(Fig. 4b). Overall, the total pool of recalcitrant C in the soil was lowerin the degraded (56.00 ± 3.49 t C ha−1) compared to the restored(67.74 ± 4.03 t C ha−1; LSD, P = 0.002) and target (68.58 ± 3.72 tC ha−1; LSD, P = 0.003) areas, which did not differ (LSD, P = 0.954).The pattern of vegetation type differences between sites (Fig. 4b)was similar to that of the C content of the total soil, described above.
Vegetation type, site and the interaction between them alsoinfluenced soil pH (F2, 21 = 15.9, P < 0.001; F6, 21 = 21.8, P < 0.001;
F10, 21 = 8.8, P < 0.001 respectively), which in turn influenced soilC stocks. The soils in restored and target areas were of similaracidity (LSD, P = 0.275) but both were significantly more acidicthan the soils of degraded areas (LSD, both comparisons P < 0.001)
138 S.L.O. Quin et al. / Agriculture, Ecosystems and Environment 185 (2014) 133–143
Table 4Total C concentration and recalcitrant C as a proportion of total C in the differ-ent layers of the soil (excluding root material), in the three vegetation types. Mean(n = 7) ± 1 s.e. (organo-mineral mean n = 3–5). Within each row, in each C measure-ment, values with same letter are not significantly different (LSD, P < 0.05).
Degraded Restored Target
Mean s.e. Mean s.e. Mean s.e.
Total C concentration (%)Litter 50.88A 0.82 54.22B 0.56 55.17B 0.42Fermentation 44.82A 4.27 51.87A,B 0.79 53.03B 1.03Organic 44.78A 3.12 51.52A 1.19 50.78A 2.41Organo-mineral 13.54A 4.25 16.75A 3.57 21.16A 4.91
Recalcitrant C as a proportion of total C (g recalcitrant C g−1 total C)Litter 0.38A 0.02 0.52B 0.01 0.53B 0.02Fermentation 0.56A 0.02 0.63A 0.02 0.63A 0.04Organic 0.64A 0.03 0.68A 0.04 0.67A 0.03Organo-mineral 0.60A 0.03 0.59A 0.03 0.64A 0.08
wTpciv
tdtCTlp(sv
al((matteeCrP
lFPvtte
aipot
Fig. 5. Total C within the (a) litter, (b) fermentation, (c) organic and (d) organo-mineral layer of the soil, in degraded (dark grey), restored (light grey) and target
vegetation type (F2, 23 = 2.9, P = 0.06, F2, 23 = 7.4, P = 0.001 respec-tively) (Fig. 6). Overall, degraded areas contained significantly lesstotal C than target areas (102.48 ± 4.71 vs. 114.03 ± 3.97 t C ha−1
ith pH values of 3.35, 3.45 and 3.58 respectively (Table S1).otal and recalcitrant soil C within the top 15 cm of the soil wereositively correlated with soil acidity (Pearson correlation coeffi-ient, r = 0.284, P = 0.03 and r = 0.433, P < 0.001) and when acidity isncluded as a covariate in the analysis of soil C it accounts for theariation otherwise attributed to the vegetation type.
Consideration of the separate soil layers allows further elucida-ion of what is driving the overall difference in soil C pool betweenifferent vegetation types. The litter layer of the degraded vegeta-ion had lower C concentration and lower proportion of recalcitrant
than the litter layer of the restored and target vegetation (Table 4).he fermentation layer in the degraded areas had a significantlyower C concentration than that in target areas but a similar pro-ortion of recalcitrant C compared to restored and target areasTable 4). The organic and organo-mineral soil layers contained aimilar concentration of C and proportion of recalcitrant C in allegetation types.
The organic layer contained the majority of the soil C withinll three vegetation types, with the litter layer containing theeast (Fig. 5). Vegetation type had a significant effect on the totalF2, 23 = 16.8, P < 0.001; F2, 23 = 10.8, P < 0.001) and recalcitrant CF2, 23 = 38.0, P < 0.001; F2, 23 = 17.1, P < 0.001) in the litter and fer-
entation layers respectively. In degraded areas there was onverage 36% and 53% less total and recalcitrant C respectively inhe litter layer and 29% and 35% less total and recalcitrant C inhe fermentation layer compared to the restored and target veg-tation (Table 5). As for soil C, there was a significant interactiveffect of site and vegetation type on both the total and recalcitrant
content of the litter (F12, 23 = 2.7, P = 0.003; F12, 23 = 3.3, P < 0.001espectively) and fermentation (F12, 23 = 3.0, P = 0.001; F12, 23 = 3.8,
< 0.001) layers (Fig. 5a, b).There was no overall effect of vegetation type on the organic
ayer total C or recalcitrant C pool (F2, 23 = 0.803, P = 0.451,2, 23 = 1.4, P = 0.253 respectively). There was a site effect (F6, 23 = 3.6,
= 0.003, F6, 23 = 7.0, P < 0.001) and an interactive effect of site andegetation type (F12, 23 = 3.8, P < 0.001, F12, 23 = 4.6, P < 0.001) on theotal (Fig. 5c) and recalcitrant C pools respectively, with vegetationype differences varying between sites in a similar pattern to thatxhibited by the C content of the total soil layer.
Depending on the thickness of the organic layer, very differentmounts of the underlying organo-mineral layer soil were sampledn different 15 cm deep soil cores and this precludes direct com-arison between vegetation types or sites (Fig. 5d). Carbon in thergano-mineral layer was however included in calculation of theotal C in soil to a depth of 15 cm.
(white) vegetation type, at the different sites (mean n = 6 ± 1 s.e.). Note the differentscales on the y axes.
3.4. Total C stock
Both the total C stock and recalcitrant C stock of the combinedvegetation and top 15 cm of soil were significantly influenced by

S.L.O. Quin et al. / Agriculture, Ecosystems and Environment 185 (2014) 133–143 139
Table 5Total and recalcitrant C pools in the litter, fermentation and organic layers of the soil (excluding root material), in the three vegetation types. Mean (n = 7) ± 1 s.e. Within eachrow, values with the same letter are not significantly different (LSD, P < 0.001).
Stock of C (t ha−1)
Degraded Restored Target
Mean s.e. Mean s.e. Mean s.e.
Total C Litter 3.72A 0.28 5.79B 0.35 5.88B 0.34Fermentation 21.75A 1.84 31.34B 1.80 29.66B 2.34Organic 58.29A 5.40 65.59A 5.45 60.50A 4.00
A 0.13 3.03B 0.20 3.11B 0.191.31 20.32B 1.26 19.76B 1.604.08 46.34A 4.04 41.95A 3.22
raaatraTPnFtf
gcgu(
3
h
Fg(s
Table 6Dwarf-shrub to graminoid macrofossil ratio in the top of the soil organic layer indegraded, restored and target vegetation type at all sites. Due to limited replicates(n = 2) mean and error were not calculated. Higher values denote a higher abun-dance of dwarf shrub compared to graminoid, and lower values representing highergraminoid compared to dwarf shrub abundance. There were no data for Derwent 2target areas.
Site Degraded Restored Target
Min Max Min Max Min Max
Ben Lawers 0 0.25 1.03 2.33 3.34 3.37Bowland 0.34 0.36 0.19 0.30 3.73 4.46Carlecotes 0 0 0.49 0.85 0.19 4.23Derwent 1 0 0.22 0.50 0.73 0.91 0.91Derwent 2 0 0 0.16 0.83
Recalcitrant C Litter 1.45Fermentation 13.11A
Organic 39.51A
espectively, LSD, P = 0.029) and marginally less C than restoredreas, at 112.23 ± 5.08 t C ha−1 (LSD, P = 0.064; Fig. 6a). Restorednd target areas did not differ (LSD, P = 0.730). Similarly, degradedreas held 62.38 ± 3.50 t C ha−1 of recalcitrant C; significantly lesshan the 74.28 ± 3.75 and 74.76 ± 3.69 t C ha−1 of recalcitrant C inestored and target areas respectively (LSD, P = 0.001), with thesereas showing no difference between them (LSD, P = 0.896; Fig. 6b).here were also significant effects of site on both total (F6, 23 = 7.3,
< 0.001) and recalcitrant (F6, 23 = 14.3, P < 0.001) C stocks, and sig-ificant interactions between site and vegetation type (total C,12, 23 = 3.7, P < 0.001; recalcitrant C, F12, 23 = 4.7, P < 0.001). The pat-erns of the site × vegetation type interactions were similar to thoseor soil C stock above (Fig. 6).
Although this study was not specifically designed to investi-ate the influence of different restoration techniques on C stocks,omparison of three sites at which restoration was undertaken byrazing control with four sites which employed mechanical meas-res revealed there to be no significance difference in C benefitF1, 6 = 1.9, P = 0.227).
.5. Macrofossil analysis
Macrofossil analysis was carried out to investigate which speciesad contributed to formation of the upper part of the soil organic
ig. 6. (a) Total and (b) recalcitrant C within the total vegetation (above- and below-round) and soil (to a depth of 15 cm) within degraded (dark-grey bars), restoredlight-grey bars) and target (white bars) vegetation type at all sites (mean n = 6 ± 1.e.) and overall (mean n = 7 ± 1 s.e.).
Geltsdale 0 0 0.29 0.73 1.29 1.41High Moor 0.02 0.53 0.48 0.80 0.92 1.77
layer, by recording the relative number of shrub and graminoidfragments in the top of the organic layer in each vegetation type ateach site (Table 6). There was a considerable difference in the ratioof dwarf-shrub to graminoid fragments between the vegetationtypes (F2, 22 = 29.0, P < 0.001) with no differences between sites andno interaction (F6, 22 = 2.0, P = 0.112; F11, 22 = 1.7, P = 0.139 respec-tively). Mean dwarf-shrub:graminoid fragment ratio was lowestin degraded areas (0.12 ± 0.05), indicating the top section of theorganic layer to be comprised predominantly of graminoid mate-rial. The dwarf-shrub:graminoid ratio was intermediate in restoredareas (0.69 ± 0.15), and highest in target vegetation (2.2 ± 0.46)indicating a dominance of dwarf-shrub material in the top of theorganic layer.
4. Discussion
The restoration of areas of upland heath dominated by one ortwo species of graminoid to an area dominated by Calluna andassociated species, is a priority for biodiversity and rural economicpractices such as livestock grazing and game shooting. Recently,the importance of managing upland areas for C has been recognisedwithin the additional land-use mitigation options in the latest IPCCinclusions (IPCC, 2007), and hence there is a drive to investigate theeffects of upland restoration on soil C dynamics.
4.1. Soil respiration
Contrary to our initial hypothesis, target areas of upland heathdid not have a lower rate of soil respiration than degraded areasand restoration had no effect on soil respiration. Soil moisture wascorrelated with soil respiration but there were no differences in soilmoisture between vegetation types.
Similar graminoid-dominated communities have been foundto have greater ecosystem respiration (Bubier et al., 2003; Wardet al., 2009) or soil respiration (McCarron et al., 2003; Mills et al.,2011) than woody shrub-dominated communities, with this being
1 ems a
adampCv
CtatodwiHde
4
tavtv
dgtsdiboAett
gbtsmabt(ZbpTgitrd
rimbr
40 S.L.O. Quin et al. / Agriculture, Ecosyst
ttributed to greater metabolic activity and input of more easilyecomposable litter from graminoids (De Deyn et al., 2008; Grimend Hunt, 1975). At our sites, the majority of the Calluna was in theost productive, building phase of its life cycle, thus its root res-
iration may have contributed to soil respiration sufficiently thatO2 flux was comparable in Calluna- and graminoid-dominatedegetation (Gimingham, 1975; Milne et al., 2002).
However, although soil respiration is partly controlled by plant inputs and partly controls soil C accumulation, the soil respira-ion rates presented here represent only a brief snapshot in timend are highly variable, and so cannot be interpreted in relationo our measures of plant and soil C pools which are integrativever the longer term. Nevertheless, whilst we did not see anyifferences between vegetation types, the soil respiration ratesere of comparable magnitude to those reported in other stud-
es, e.g. in similar Calluna-dominated heath (Emmett et al., 2004;einemeyer et al., 2011; Sowerby et al., 2008) and in graminoid-ominated habitats with similar species (Bahn et al., 2008; Millst al., 2011).
.2. Total vegetation C
Overall, the degraded vegetation contained a larger C pool thanarget vegetation, contrary to our initial hypothesis, whilst restorednd target vegetation contained similar C pools, as hypothesised. Allegetation types contained similar pools of recalcitrant C, also con-rary to our initial hypothesis. However, the comparison betweenegetation types varied greatly between sites.
Previous studies show woody shrub encroachment into areasominated by graminoids to cause a dramatic increase in the aboveround C pool (Bradley et al., 2006; Eldridge et al., 2011). This ishe opposite of our overall finding, which was driven by larger Ctocks in graminoid than in Calluna communities at sites where theegraded vegetation was dominated entirely by Molinia. Molinia
s a tussock-forming grass with large above- and below-groundiomass and high annual productivity compared to Calluna andther upland grasses, such as Nardus or Agrostis spp., (Aerts, 1990;erts et al., 1992; Gimingham, 1972; Milne et al., 2002; Taylort al., 2001). At other sites, the target, Calluna dominated vegetationended to contain more C than the degraded vegetation, which wasypically dominated by Nardus.
Whilst differences in the total vegetation C pool betweenraminoid and Calluna communities were driven by difference iniomass rather than C concentration, the proportion of recalci-rant C was higher in Calluna, in both shoots and roots. Woodyhrubs, such as Calluna contain high amounts of lignin in stematerial (Heal et al., 1978; Jones and Gore, 1978; Rasse et al., 2005)
nd Calluna leaves contain high concentrations of recalcitrant Cased secondary metabolites and survive several years comparedo leaves of many upland grass species that senesce each autumnBhat et al., 1998; Gimingham, 1960; Grant et al., 1996; Hofland-ijlstra and Berendse, 2009). The recalcitrance of Calluna roots haseen demonstrated by the slower root turnover in Calluna com-ared to some upland grasses (Aerts et al., 1992; Carbone andrumbore, 2007; Van der Krift and Berendse, 2002). Despite thereater proportion of recalcitrant C in Calluna tissues, differencesn the total amount of recalcitrant C held in our different vegeta-ion types were driven by biomass. In comparison with target andestored vegetation, there was more recalcitrant C in total in Moliniaominated vegetation and less in Nardus dominated swards.
Thus, in terms of vegetation C stocks, the benefit of upland heathestoration depends on the identity of the grass species dominat-
ng the degraded heath. Molinia dominated vegetation may containore total and recalcitrant C than Calluna dominated vegetation,ut for other swards, dominated by graminoids of lower biomass,e-establishment of Calluna heath may increase these vegetation C
nd Environment 185 (2014) 133–143
pools (Quin et al., 2013). At each of the sites we sampled, restora-tion has shifted the vegetation C pools towards those of the targetheath.
4.3. Soil C
The mean soil C pool across all our sites and vegetation types(96.8 t total C ha−1) is very similar to that reported by the Coun-tryside Survey 2007 for dwarf shrub heath (89.9 t C ha−1), bothmeasured in the top 15 cm of soil (Emmett et al., 2010). As pre-dicted, target areas of upland heath contained more total andrecalcitrant C within the top 15 cm of the soil than degraded areas,whilst restored and target areas held similar amounts. The largerrecalcitrant C stock in the Calluna-dominated areas could lead toreduced C turnover in the soil, increasing the accumulation of C inthe long term.
An increase in soil C following woody shrub encroachment intograssland has also been reported from other ecosystems aroundthe world (Liao and Boutton, 2008; Liao et al., 2006; Montané et al.,2007, 2010; Neff et al., 2009). We measured a soil C gain of 12 tC ha−1; other studies have measured gains of up to 27 t C ha−1,although losses of up to 62 t C ha−1 have also been reported (Bargeret al., 2011).
In our system, the litter and fermentation layers drive thedifference in soil C between vegetation types. Degraded areasconsistently contained less total and recalcitrant C in their litterand fermentation layer than target and restored areas. Thus thebiomass-driven pattern seen in the vegetation, of more total Cand recalcitrant C in Molinia- than in Calluna-dominated vegeta-tion, and less in Nardus dominated vegetation, does not persistinto the litter and fermentation layers. Rather, their C pools reflectthe greater proportion of recalcitrant C in both the living Cal-luna and Calluna litter at target and restored sites, compared tothe lower proportion of recalcitrant C in graminoid biomass andlitter at degraded sites. The accumulation of Calluna litter overtime can be quite considerable in upland heath, with a reported1500–2800 g m−2 accrued after 17–20 years (Chapman et al., 1975;Chapman, 1967). While Molinia also produces a substantial amountof litter (Aerts, 1993), Calluna litter, notably the stem material, ismore resistant to microbial breakdown not only due to its highlignin and secondary compound content, but also to the acidityof the litter itself (Gimingham, 1960; Heal et al., 1978; Hopkinset al., 1988; Jones and Gore, 1978; Kerberg et al., 2008; Rasseet al., 2005; Van Vuuren and Van Der Eerden, 1992). The acidityof Calluna litter must account for the difference observed in soilpH between vegetation types, with more acid soil in target andrestored areas, and will reduce decomposer activity which resultsin the observed positive correlation between acidity and soil Cstocks. Thus the quality of Calluna litter, compared to graminoidlitter, leads to a larger accumulation of C in the litter layer and,subsequently, the fermentation layer in Calluna dominated areas.Montané et al. (2010) similarly attributed soil C increase afterwoody shrub encroachment into grassland to the higher recalci-trance of woody shrub litter relative to that of graminoids, reducingdecomposition.
We found no difference between vegetation types in totalor recalcitrant C content of the organic layer. This was despitethe lower ratio of dwarf-shrub to graminoid macrofossils in thetop of the organic layer of degraded areas than of target andrestored areas. The ratio of dwarf-shrub to graminoid macrofos-sils in restored areas was intermediate between that of degradedand target areas. This suggests that Calluna fragments have begun
to be incorporated into the organic layer during the last c. 20 yearssince restoration was initiated. A slow response of the organic layerof upland soils to vegetation change has been noted previouslyin grazing exclusion studies (Garnett et al., 2000; Medina-Roldán
ems a
etdonltl
4
fbtacsweCa1ie
toorubt0mSblalC
gbCai2iiesrib
5
ntlrgb
S.L.O. Quin et al. / Agriculture, Ecosyst
t al., 2012; Ward et al., 2007) and attributed to the charac-eristically slow C cycling of upland habitats. So overall, despiteifferences in the composition of macrofossils in the top of therganic layer of degraded, target and restored vegetation, there iso difference in the total C content of the organic layer and the
arger total soil (top 15 cm) C content of target and restored areashan of degraded areas results from greater C accumulation in theitter and fermentation layers.
.4. Total C stock
The total C benefit of restoring Calluna-dominated upland heathrom degraded, graminoid-dominated heath, across all sites, haseen 0.60 ± 0.70 t C ha−1 yr−1 since restoration. The high error inhis C accumulation rate arises due to one (Molinia-dominated) sitectually losing C following restoration. So whilst, overall, there islearly a potential C benefit from restoring upland heath, this is sitepecific. However, there are a range of other benefits of restorationhich may still justify its implementation, creating the potential for
cosystem C gain. These include better forage value for livestock ofalluna than Molinia, due to the shorter growing period of Moliniand its high litter accumulation which deters grazers (Gimingham,975; Taylor et al., 2001; Todd et al., 2000), benefits for character-
stic heathland biodiversity and for sporting interests (Littlewoodt al., 2006a,b; Thompson et al., 1995).
It has been noted that the soil organic layer is slow to respondo vegetation change, but patterns of C accumulation in therganic layer would be expected to eventually reflect those alreadybserved in the C pools which are most reflective of the cur-ent vegetation community, and hence most sensitive to landse change in the short term. So, considering the above- andelow-ground biomass, litter and fermentation layers, the restora-ion of degraded areas of upland heath provides a C benefit of.56 ± 0.29 t total C ha−1 yr−1. This change in C stock is similar inagnitude to other land use changes reported by Dawson and
mith (2007). For instance wetland restoration provides a soil Cenefit of 0.1–1.0 t C ha−1 yr−1, conversion of arable land to grass-
and or forestry provides a soil C benefit of 0.3–0.8 t C ha−1 yr−1
nd 0.5–1.4 t C ha−1 yr−1 respectively, while conversion from moor-and to improved grassland provides a loss of soil C of 0.9–1.1 t
ha−1 yr−1.The method of restoration employed, broadly categorised as
razing control vs. mechanical, did not appear to influence the Cenefit of restoration, suggesting that either can be appropriate for
management of upland heath. Low intensity techniques such as decrease in, or removal of, livestock grazing are most appropriaten areas where Calluna is suppressed but not absent (Hulme et al.,002; Pakeman et al., 2003). Where Calluna is no longer present
n an area and the seed bank is too low to enable recovery, morentensive interventions may be required (Britton et al., 2000; Marrst al., 2004; Pywell et al., 2011; Ross et al., 2003). However, thistudy includes too few replicates of management types to enableobust comparison and a quantification of the C costs of the actualntervention methods, in addition to the resulting benefits, woulde required for any recommendations to be made.
. Conclusion
Restoration of upland heath has traditionally focused on retur-ing the dominance of Calluna over graminoids and not consideredhe consequences for C. We have shown that, overall, areas of
ong established, Calluna dominated heath hold larger total C andecalcitrant C stocks than degraded areas of heath dominated byraminoids. The benefit of vegetation restoration for C stocks variedetween sites and this was partly influenced by the dominance ofnd Environment 185 (2014) 133–143 141
Molinia in the degraded areas, as this species holds large, althoughrelatively labile, C pools. However we demonstrated that, overall,the restoration of degraded upland heath does provide a benefitin both total and recalcitrant C. The total C gain is of comparablemagnitude to that resulting from other land use changes and theincrease in recalcitrant C stocks will potentially reduce the rate ofC turnover in the soil, increasing the accumulation of C in the longterm.
Acknowledgements
Thanks are due to the Moorland Research Forum and the BritishEcological Society who funded this fieldwork, to Scottish Natu-ral Heritage for a PhD studentship to Sam Quin and to RESAS forsupport to Nick Littlewood & Rebekka Artz. We also thank thelandowners and site managers who granted access permission fortheir sites and the UK Met Office for use of their data.
Appendix A. Supplementary data
Supplementary data associated with this article can be found, inthe online version, at http://dx.doi.org/10.1016/j.agee.2013.12.022.
References
Aerts, R., 1990. Nutrient use efficiency in evergreen and deciduous species fromheathlands. Oecologia 84, 391–397.
Aerts, R., 1993. Nutrient turnover in Dutch heathlands during sucession from erica-ceous to gramineous dominance. Scripta Geobot. 21, 7–15.
Aerts, R., Bakker, C., De Caluwe, H., 1992. Root turnover as determinant of the cyclingof C, N, and P in a dry heathland ecosystem. Biogeochemistry 15, 175–190.
Artz, R.R.E., Chapman, S.J., Siegenthaler, A., Mitchell, E.A.D., Buttler, A., Bortoluzzi, E.,Gilbert, D., Yli-Petays, M., Vasander, H., Francez, A-J., 2008a. Functional microbialdiversity in cutover peatlands responds to vegetation succession and is partlydirected by labile carbon. J. Appl. Ecol. 45, 1799–1809.
Artz, R.R.E., Chapman, S.J., Robertson, A.H.J., Potts, J.M., Laggoun-Defarge, F., Gogo,S., Comont, L., Disnar, J.-R., Francez, A.-J., 2008b. FTIR spectroscopy can predictorganic matter quality in regenerating cutover peatlands. Soil Biol. Biochem. 40,515–527.
Bahn, M., Rodeghiero, M., Anderson-Dunn, M., Dore, S., Gimeno, C., Drösler, M.,Williams, M., Ammann, C., Berninger, F., Flechard, C., Jones, S., Balzarolo,M., Kumar, S., Newesely, C., Priwitzer, T., Raschi, A., Siegwolf, R., Susiluoto,S., Tenhunen, J., Wohlfahrt, G., Cernusca, A., 2008. Soil respiration in Euro-pean grasslands in relation to climate and assimilate supply. Ecosystems 11,1352–1367.
Barger, N.N., Archer, S.R., Campbell, J.L., Huang, C., Morton, J.A., Knapp, A.K., 2011.Woody plant proliferation in North American drylands: a synthesis of impactson ecosystem carbon balance. J. Geophys. Res. 116, G00K07.
Bhat, T.K., Singh, B., Sharma, O.P., 1998. Microbial degradation of tannins – a currentperspective. Biodegradation 9, 343–357.
Bradley, B.A., Houghton, R.A., Mustard, J.F., Hamburg, S.P., 2006. Invasive grassreduces above ground carbon stocks in shrubland of Western US. Global ChangeBiol. 12, 1815–1822.
Britton, A.J., Marrs, R.H., Carey, P.D., Pakeman, R.J., 2000. Comparison of techniquesto increase Calluna vulgaris cover on heathland invaded by grasses in Breckland,south east England. Biol. Conserv. 95, 227–232.
Bubier, J., Crill, P., Mosedale, A., Frolking, S., Linder, E., 2003. Peatland responses tovarying interannual moisture conditions as measured by automatic CO2 cham-bers. Global Biogeochem. Cycles 17, 1066.
Carbone, M.S., Trumbore, S.E., 2007. Contribution of photosynthetic assimilates torespiration by perennial grasses and shrubs: residence times and allocationpatterns. New Phytol. 176, 124–135.
Carey, P.D., Wallis, S., Chamberlain, P.M., Cooper, A., Emmett, B.A., Maskell, L.C.,McCann, T., Murphy, J., Norton, L.R., Reynolds, B., Scott, W.A., Simpson, I.C., Smart,S.M., Ullyett, J.M., 2008. Countryside Survey: UK Results from 2007. NERC/Centrefor Ecology & Hydrology, pp. 105 (CEH Project Number: C03259).
Chapin, F.S., 2003. Effects of plant traits on ecosystem and regional processes: aconceptual framework for predicting the consequences of global change. Ann.Bot. Lond. 91, 455–463.
Chapman, S.B., 1967. Nutrient budgets for a dry heath ecosystem in the south ofEngland. J. Ecol. 55, 677–689.
Chapman, S.B., Hibble, J., Raferel, C.R., 1975. Litter accumulation under Calluna vul-
garis on a lowland heathland in Britain. J. Ecol. 63, 259–271.Dawson, J.J.C., Smith, P., 2007. Carbon losses from soil and its consequences for land-use management. Sci. Tot. Environ. 382, 165–190.
De Deyn, G.B., Cornelissen, H.C., Bardgett, R.D., 2008. Plant functional traits and soilC sequestration in contrasting biomes. Ecol. Lett. 11, 516–531.

1 ems a
D
E
E
E
G
G
GG
G
G
G
G
H
H
H
H
H
H
H
I
J
J
K
K
L
L
L
L
L
ts
42 S.L.O. Quin et al. / Agriculture, Ecosyst
e Deyn, G.B., Quirk, H., Yi, Z., Oakley, S., Ostle, N.J., Bardgett, R.D., 2009. Vegeta-tion composition promotes carbon and nitrogen storage in model grasslandcommunities of contrasting soil fertility. J. Ecol. 97, 864–875.
ldridge, D.J., Bowker, M.A., Maestre, F.T., Roger, E., Reynolds, J.F., Whitford, W.G.,2011. Impacts of scrub encroachment on ecosystem structure and functioning:towards a global synthesis. Ecol. Lett. 14, 709–722.
mmett, B.A., Reynolds, B., Reynolds, P.M., Rowe, E., Spurgeon, D., Brittain, S.A., Frog-brook, Z., Hughes, S., Lawlor, A.J., Poskitt, J., Potter, E., Robinson, D.A., Scott, A.,Wood, C., Woods, C., 2010. Countryside Survey: Soils Report from 2007. Techni-cal Report No. 9/07 NERC/Centre for Ecology & Hydrology, pp. 192 (CEH ProjectNumber: C03259).
mmett, B.A., Beier, C., Estiarte, M., Tietema, A., Kristensen, H.L., Williams, D.,Penuelas, J., Schmidt, I., Sowerby, A., 2004. The response of soil processes toclimate change: results from manipulation studies of shrublands across an envi-ronmental gradient. Ecosystems 7, 625–637.
arnett, M.H., Ineson, P., Stevenson, A.C., 2000. Effects of burning and grazing oncarbon sequestration in a Pennine blanket bog, UK. Holocene 10, 729–736.
imingham, C.H., 1960. Biological flora of the British Isles: Calluna Salisb. A mono-typic genus. J. Ecol. 48, 455–483.
imingham, C.H., 1972. Ecology of Heathlands. Chapman and Hall, London.imingham, C.H., 1975. An Introduction to Heathland Ecology. Oliver and Boyd,
Edinburgh.imingham, C.H., 1995. Heaths and moorland: an overview of ecological change.
In: Thompson, D.B.A., Hester, A.J., Usher, M.B. (Eds.), Heaths and Moorlands:Cultural Landscapes. HMSO, Edinburgh, pp. 1–19.
rant, S.A., Torvell, L., Sim, E.M., Small, J.L., Elston, D.A., 1996. Seasonal pattern of leafgrowth and senescence of Nardus stricta and responses of tussocks to differingseverity, timing and frequency of defoliation. J. Appl. Ecol. 33, 1145–1155.
rime, J.P., Hunt, R., 1975. Relative growth-rate: its range and adaptive significancein a local flora. J. Ecol. 63, 393–422.
uo, L.B., Gifford, R.M., 2002. Soil carbon stocks and land use change: a meta analysis.Global Change Biol. 8, 345–360.
eal, O.W., Latter, P.M., Howson, G., 1978. A study of rates of decomposition oforganic matter. In: Heal, O.W., Perkins, D.F. (Eds.), Production Ecology of BritishMoors and Montane Grasslands. Springer-Verlag, Berlin, Germany, pp. 136–159.
eim, A., Schmidt, M.W.I., 2006. Lignin turnover in arable soil and grassland analysedwith two different labelling approaches. Eur. J. Soil Sci. 58, 599–608.
einemeyer, A., Di Bene, C., Lloyd, A.R., Tortorella, D., Baxter, R., Huntley, B., Gel-somino, A., Ineson, P., 2011. Soil respiration: implications of the plant–soilcontinuum and respiration chamber collar-insertion depth on measurementand modelling of soil CO2 efflux rates in three ecosystems. Eur. J. Soil Sci. 62,82–94.
ofland-Zijlstra, J.D., Berendse, F., 2009. The effect of nutrient supply and light inten-sity on tannins and mycorrhizal colonisation in Dutch heathland ecosystems.Plant Ecol. 201, 661–675.
olden, J., Shotbolt, L., Bonn, A., Burt, T.P., Chapman, P.J., Dougill, A.J., Fraser, E.D.G.,Hubacek, K., Irvine, B., Kirkby, M.J., Reed, M.S., Prell, C., Stagl, S., Stringer, L.C.,Turner, A., Worrall, F., 2007. Environmental change in moorland landscapes.Earth-Sci. Rev. 82, 75–100.
opkins, D.W., Shiel, R.S., O‘Donnell, A.G., 1988. The influence of sward species com-position on the rate of organic matter decomposition in grassland soil. J. Soil Sci.39, 385–392.
ulme, P.D., Merrell, B.G., Torvell, L., Fisher, J.M., Small, J.L., Pakeman, R.J., 2002.Rehabilitation of degraded Calluna vulgaris (L.) Hull-dominated wet heath bycontrolled sheep grazing. Biol. Conserv. 107, 351–363.
PCC, 2007. Summary for policymakers. In: Solomon, S., Qin, D., Manning, M., Chen,Z., Marquis, M., Averyt, K.B., Tignor, M., Miller, H.L. (Eds.), Climate Change 2007:The Physical Science Basis, Contribution of Working Group I to the Fourth Assess-ment Report of the Intergovernmental Panel on Climate Change. CambridgeUniversity Press, Cambridge, UK.
alal, M.A.F., Read, D.J., Haslam, E., 1982. Phenolic composition and its seasonal vari-ation in Calluna vulgaris. Phytochemistry 21, 1397–1401.
ones, H.E., Gore, A.J.P., 1978. A simulation of production and decay in blanket bog. In:Heal, O.W., Perkins, D.F. (Eds.), Production Ecology of British Moors and MontaneGrasslands. Springer-Verlag, Berlin, Germany, pp. 160–186.
erberg, N.J., Scott, N.A., Giardina, C.P., 2008. Methods for estimating litter decompo-sition. In: Hoover, C.M. (Ed.), Field Measurements for Forest Carbon Monitoring:A Landscape Scale Approach. Springer, New York.
napp, A.K., Briggs, J.M., Collins, S.L., Archer, S.R., Bret- Harte, M.S.A., Ewersk, B.E.,Peters, D.P., Young, D.R., Shaver, G.R., Pendall, E., Cleary, M.B., 2008. Shrubencroachment in North American grasslands: shifts in growth form domi-nance rapidly alters control of ecosystem carbon inputs. Global Change Biol.14, 615–623.
iao, J.D., Boutton, T.W., Jastrow, J.D., 2006. Storage and dynamics of carbon andnitrogen in soil physical fractions following woody plant invasion of grassland.Soil Biol. Biochem. 38, 3184–3196.
iao, J.D., Boutton, T.W., 2008. Soil microbial biomass response to woody plant inva-sion of grassland. Soil Biol. Biochem. 40, 1207–1216.
ittlewood, N.A., 2005. The response of plant and insect assemblages to the restora-tion of heather moorland. University of Aberdeen, UK (PhD thesis).
ittlewood, N.A., Pakeman, R.J., Woodin, S.J., 2006a. A field assessment of the success
of moorland restoration in the rehabilitation of whole plant assemblages. Appl.Veg. Sci. 9, 295–306.ittlewood, N.A., Pakeman, R.J., Woodin, S.J., 2006b. The response of plant and insectassemblages to the loss of Calluna vulgaris from upland vegetation. Biol. Conserv.128, 335–345.
nd Environment 185 (2014) 133–143
Lucchese, M., Waddington, J.M., Poulin, M., Pouliot, R., Rochefort, L., Strack, M., 2010.Organic matter accumulation in a restored peatland: evaluating restoration suc-cess. Ecol. Eng. 36, 482–488.
Marrs, R.H., Phillips, J.D.P., Todd, P.A., Ghorbani, J., Le Duc, M.G., 2004. Control ofMolinia caerulea on upland moors. J. Appl. Ecol. 41, 398–411.
Mauquoy, D., Van Geel, B., 2006. Plant macrofossil methods and studies: Mire andPeat Macros. In: Elias, S.A., Wada, K., Hiraki, A. (Eds.), Encyclopedia of QuaternaryScience. Elsevier Science, Amsterdam, Netherlands, pp. 2315–2336.
McCarron, J.K., Knapp, A.K., Blair, J.M., 2003. Soil C and N responses to woody plantexpansion in a mesic grassland. Plant Soil 257, 183–192.
McLaren, J.R., Turkington, R., 2010. Plant functional group identity differentiallyaffects leaf and root decomposition. Global Change Biol. 16, 3075–3084.
Medina-Roldán, E., Paz-Ferreiro, J., Bardgett, R.D., 2012. Grazing exclusion affects soiland plant communities, but has no impact on soil carbon storage in an uplandgrassland. Agric. Ecosyst. Environ. 149, 118–123.
Mills, R., Glanville, H., McGovern, S., Emmett, B., Jones, D.L., 2011. Soil respirationacross three contrasting ecosystem types: comparison of two portable IRGAsystems. J. Plant Nutr. Soil Sci. 174, 532–535.
Milne, J.A., Pakeman, R.J., Kirkham, F.W., Jones, I.P., Hossell, J.E., 2002. Biomass pro-duction of upland vegetation types in England and Wales. Grass Forage Sci. 57,373–388.
Mitchell, R.J., Rose, R.J., Palmer, S.C.F., 2008a. Restoration of Calluna vulgaris on grass-dominated moorlands: the importance of disturbance, grazing and seeding. Biol.Conserv. 141, 2100–2111.
Mitchell, R.J., Rose, R.J., Palmer, S.C.F., 2008b. The effect of restoration techniqueson non-target species: case studies in moorland ecosystems. Appl. Veg. Sci. 12,81–91.
Montané, F., Romanyà, J., Rovira, P., Casals, P., 2010. Aboveground litter qualitychanges may drive soil organic carbon increase after shrub encroachment intomountain grasslands. Plant Soil 337, 151–165.
Montané, F., Rovira, P., Casals, P., 2007. Shrub encroachment into mesic mountaingrasslands in the Iberian Peninsula: effects of plant quality and temperature onsoil C and N stocks. Global Biogeochem. Cycles 21, GB4016.
Neff, J.C., Barger, N.N., Baisden, W.T., Fernandez, D.P., Asner, G.P., 2009. Soil carbonstorage responses to expanding pinyon-juniper populations in southern Utah.Ecol. Appl. 19, 1405–1416.
Ostle, N.J., Levy, P.E., Evans, C.D., Smith, P., 2009. UK land use and soil carbon seques-tration. Land Use Policy 26, 274–283.
Pakeman, R.J., Hulme, P.D., Torvell, L., Fisher, J.M., 2003. Rehabilitation of degradeddry heather [Calluna vulgaris (L.) Hull] moorland by controlled sheep grazing.Biol. Conserv. 114, 389–400.
Post, W.M., Kwon, K.C., 2000. Soil carbon sequestration and land-use change: pro-cesses and potential. Global Change Biol. 6, 317–328.
Pywell, R.F., Meek, W.R., Webb, N.R., Putwain, P.D., Bullock, J.M., 2011. Long-termheathland restoration on former grassland: the results of a 17-year experiment.Biol. Conserv. 144, 1602–1609.
Quin, S.L.O., Conolly, T.R.A., Artz, R.R.E., Coupar, A., Woodin, S.J., 2013. The Assim-ilation and retention of carbon in upland heath plant communities typical ofcontrasting management regimes: a 13C tracer study. J. Ecosyst. 209890, 1–10.
Rasse, D.P., Rumpel, C., Dignac, M-F., 2005. Is soil carbon mostly root carbon? Mech-anisms for a specific stabilisation. Plant Soil 269, 341–356.
Ross, S., Adamson, H., Moon, A., 2003. Evaluating management techniques for con-trolling Molinia caerulea and enhancing Calluna vulgaris on upland wet heathlandin northern England, UK. Agric. Ecosyst. Environ. 97, 39–49.
Ryan, M.G., Melillo, J.M., Ricca, A., 1990. A comparison of methods for determiningproximate carbon fraction of forest litter. Can. J. Forest Res. 20, 166–171.
Schils, R., Kuikman, P., Liski, J., van Oijen, M., Smith, P., Webb, J., Alm, J., Somogyi,Z., van den Akker, J., Billett, M., Emmett, B., Evans, C., Lindner, M., Palosuo, T.,Bellamy, P., Alm, J., Jandl, R., Hiederer, R., 2008. Review of existing informa-tion on the interrelations between soil and climate change. CLIMSOIL, EuropeanCommission (Technical report 048).
Sowerby, A., Emmett, B.A., Tietema, A., Beier, C., 2008. Contrasting effects of repeatedsummer drough on soil carbon efflux in hydric and mesic heathland soils. GlobalChange Biol. 14, 2388–2404.
Taylor, K., Rowlands, A.P., Jones, H.E., 2001. Biological flora of the British Isles: Moliniacaerulea (L.) Moench. J. Ecol. 89, 126–144.
Thompson, D.B.A., Macdonald, A.J., Marsden, J.H., Galbraith, C.A., 1995. Uplandheather moorland in Great-Britain – a review of international importance, veg-etation change and some objectives for nature conservation. Biol. Conserv. 71,163–178.
Todd, P.A., Phillips, J.D.O., Putwain, P.D., Marrs, R.H., 2000. Control of Molinia caeruleaon moorland. Grass Forage Sci. 55, 181–191.
UK BAP, 2008. UK Biodiversity Action Plan Priority Habitat Descriptions: UplandHeathland, http://jncc.defra.gov.uk/page-5706 Accessed Sept. 2012.
UK Climate Change Bill, 2008. http://www.legislation.gov.uk/ukpga/2008/27/contenAccessed Aug. 2012.
Van der Krift, T.A.J., Berendse, F., 2002. Root life spans of four grass species fromhabitats differing in nutrient availability. Funct. Ecol. 16, 198–203.
Van Vuuren, M.M.I., Van Der Eerden, L.J., 1992. Effects of three rates of atmosphericnitrogen desposition enriched with 15N on litter decomposition in a heathland.Soil Biol. Biochem. 24, 527–532.
Waddington, J.M., Day, S.M., 2007. Methane emissions from a peatland followingrestoration. J. Geophys. Res. 112, G03018.
Waddington, J.M., Greenwood, M.J., Petrone, R.M., Price, J.S., 2003. Mulch decompo-sition impedes recovery of net carbon sink function in a restored peatland. Ecol.Eng. 20, 199–210.

ems a
W
W
S.L.O. Quin et al. / Agriculture, Ecosyst
ard, S.E., Bardgett, R.D., McNamara, N.P., Adamson, J.K., Ostle, N.J., 2007. Long-term
consequences of grazing and burning on northern peatland carbon dynamics.Ecosystems 10, 1069–1083.ard, S.E., Bardgett, R.D., McNamara, N.P., Ostle, N.J., 2009. Plant functional groupidentity influences short-term peatland ecosystem carbon flux: Evidence froma plant removal experiment. Funct. Ecol. 23, 454–462.
nd Environment 185 (2014) 133–143 143
Williams, J.M., 2006. Common Standards Monitoring for Designated Sites: First Six
Year Report. JNCC, Peterborough.Woodin, S.J., van der Wal, R., Sommerkorn, M., Gornall, J.L., 2009. Differ-ential allocation of carbon in mosses and grasses governs ecosystemsequestration: A 13C tracer study in the high Arctic. New Phytol. 184,944–949.


![Evaluation of the Anti-Gout Potential of Calluna vulgaris ... 1/71-RNP-1803-253.pdfthe existing anti-gout drugs are oftenly accompanied by severe adverse reactions [6], thus the discovery](https://img.pdfslide.us/doc/110x75/5f22146df58b116ba53a6735/evaluation-of-the-anti-gout-potential-of-calluna-vulgaris-171-rnp-1803-253pdf.jpg)


![Pemphigus Vulgaris [Print] - eMedicine Dermatology Vulgaris .pdf · emedicine.medscape.com eMedicine Specialties > Dermatology > Bullous Diseases Pemphigus Vulgaris Bassam Zeina,](https://img.pdfslide.us/doc/110x75/5c984ab609d3f21c3a8b874e/pemphigus-vulgaris-print-emedicine-vulgaris-pdf-emedicinemedscapecom.jpg)