Embed Size (px)
Citation preview
House of Representatives Standing Committee on Economics, Finance and Public Administration Inquiry into the current and future directions of Australia's service industries
1
TABLE OF CONTENTS
Restaurant & Catering Australia............................................................................. 2
The Restaurant Industry ....................................................................................... 2
Restaurant Industry Employment........................................................................... 5
Projections for the Restaurant and Catering Industry ............................................... 7
Revenues ........................................................................................................ 7
Costs .............................................................................................................. 9
The Inquiry ........................................................................................................11
The tourism and education service sectors..........................................................11
The impact of the resources boom on the service sector.......................................13
Policies for realising these opportunities .............................................................13
Policies that Actively Discriminate Against the Services / Restaurant Industry......14
Policies that would advance the contribution of service businesses .....................15
SUBMISSION 23
House of Representatives Standing Committee on Economics, Finance and Public Administration Inquiry into the current and future directions of Australia's service industries
2
Restaurant & Catering Australia
Restaurant & Catering Australia (R&CA) is the peak national organisation representing the interests of restaurateurs and caterers. The Association is a federation of State Associations that work together on matters of national importance. The State Associations have a combined membership of over 6,000. There is an R&CA member restaurant and catering association in every State and the Australian Capital Territory.
The Restaurant Industry
The Australian Bureau of Statistics reports 37,699 restaurant, café and catering businesses that are registered for GST. Of these businesses, 89% employ 20 people or less. There are 124 businesses Australia wide that employ in excess of 200 people1.
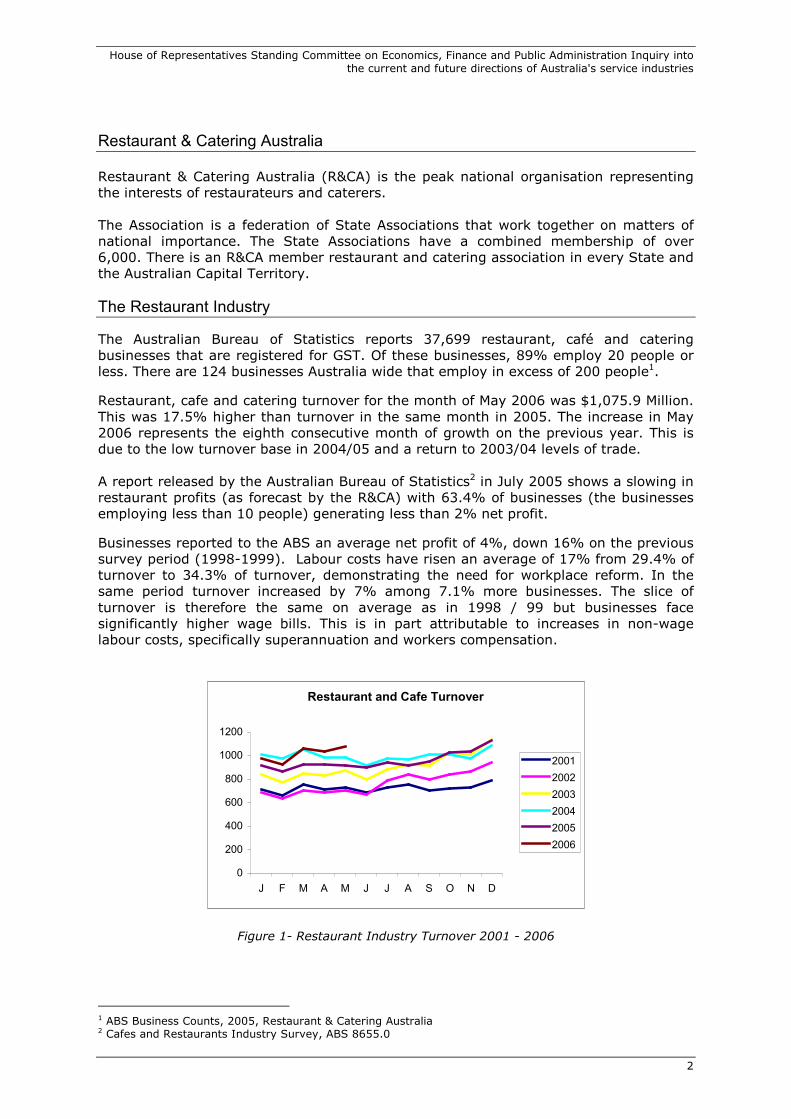
Restaurant, cafe and catering turnover for the month of May 2006 was $1,075.9 Million. This was 17.5% higher than turnover in the same month in 2005. The increase in May 2006 represents the eighth consecutive month of growth on the previous year. This is due to the low turnover base in 2004/05 and a return to 2003/04 levels of trade. A report released by the Australian Bureau of Statistics2 in July 2005 shows a slowing in restaurant profits (as forecast by the R&CA) with 63.4% of businesses (the businesses employing less than 10 people) generating less than 2% net profit.
Businesses reported to the ABS an average net profit of 4%, down 16% on the previous survey period (1998-1999). Labour costs have risen an average of 17% from 29.4% of turnover to 34.3% of turnover, demonstrating the need for workplace reform. In the same period turnover increased by 7% among 7.1% more businesses. The slice of turnover is therefore the same on average as in 1998 / 99 but businesses face significantly higher wage bills. This is in part attributable to increases in non-wage labour costs, specifically superannuation and workers compensation.
Restaurant and Cafe Turnover
0
200
400
600
800
1000
1200
J F M A M J J A S O N D
2001
2002
2003
2004
2005
2006
Figure 1- Restaurant Industry Turnover 2001 - 2006
1 ABS Business Counts, 2005, Restaurant & Catering Australia 2 Cafes and Restaurants Industry Survey, ABS 8655.0
House of Representatives Standing Committee on Economics, Finance and Public Administration Inquiry into the current and future directions of Australia's service industries
3
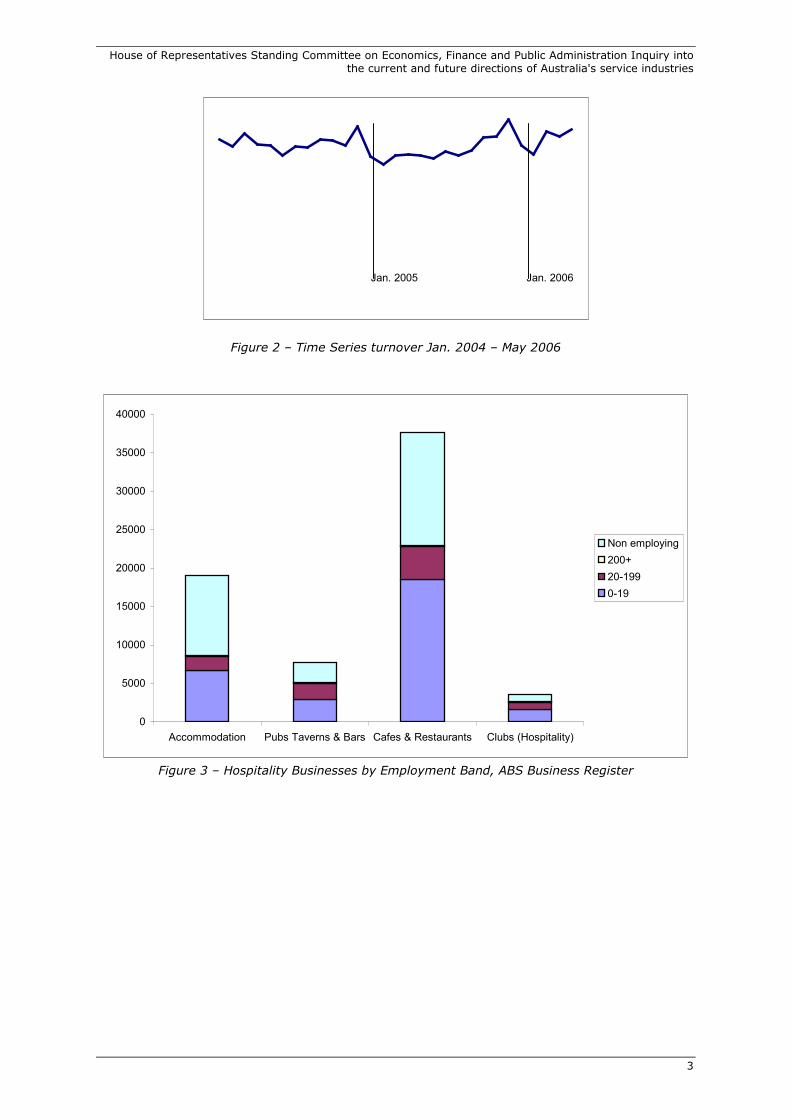
Figure 2 – Time Series turnover Jan. 2004 – May 2006
0
5000
10000
15000
20000
25000
30000
35000
40000
Accommodation Pubs Taverns & Bars Cafes & Restaurants Clubs (Hospitality)
Non employing
200+
20-199
0-19
Figure 3 – Hospitality Businesses by Employment Band, ABS Business Register
Jan. 2005 Jan. 2006
House of Representatives Standing Committee on Economics, Finance and Public Administration Inquiry into the current and future directions of Australia's service industries
4
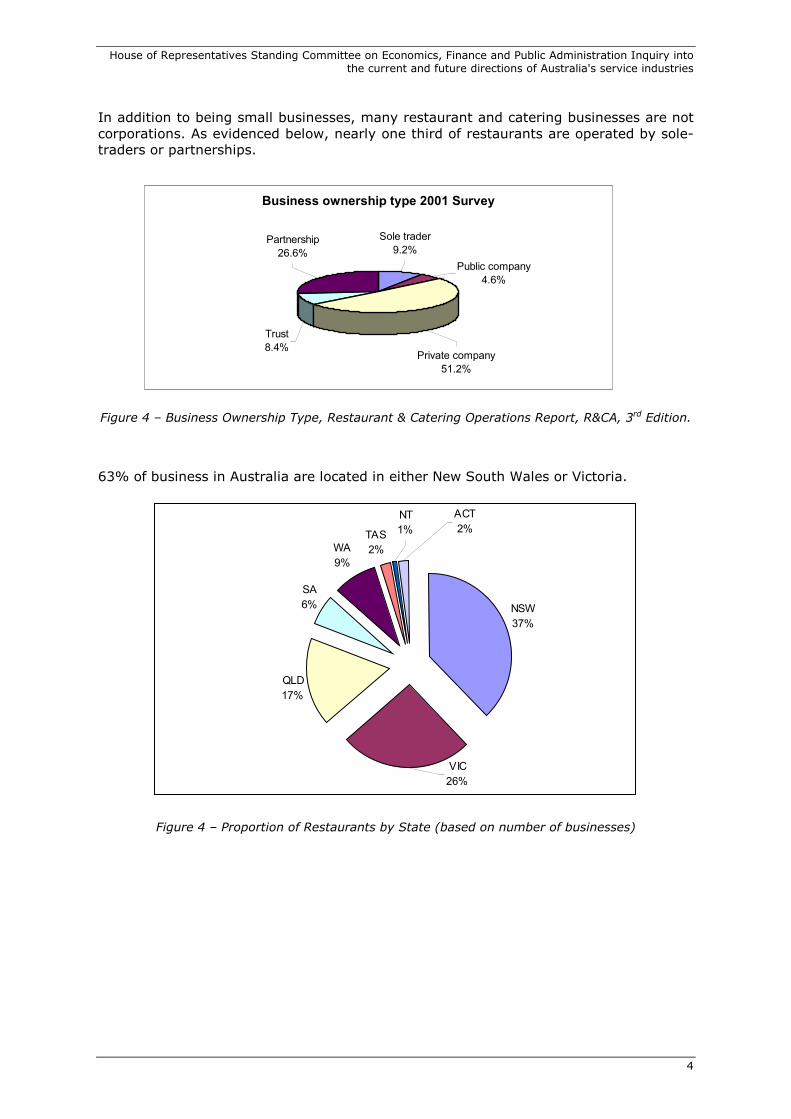
In addition to being small businesses, many restaurant and catering businesses are not corporations. As evidenced below, nearly one third of restaurants are operated by sole-traders or partnerships.
Figure 4 – Business Ownership Type, Restaurant & Catering Operations Report, R&CA, 3rd Edition.
63% of business in Australia are located in either New South Wales or Victoria.
NSW
37%
QLD
17%
SA
6%
WA
9%
TAS
2%
VIC
26%
NT
1%
ACT
2%
Figure 4 – Proportion of Restaurants by State (based on number of businesses)
Business ownership type 2001 Survey
Trust
8.4%Private company
51.2%
Public company
4.6%
Sole trader
9.2%Partnership
26.6%
House of Representatives Standing Committee on Economics, Finance and Public Administration Inquiry into the current and future directions of Australia's service industries
5
Restaurant Industry Employment
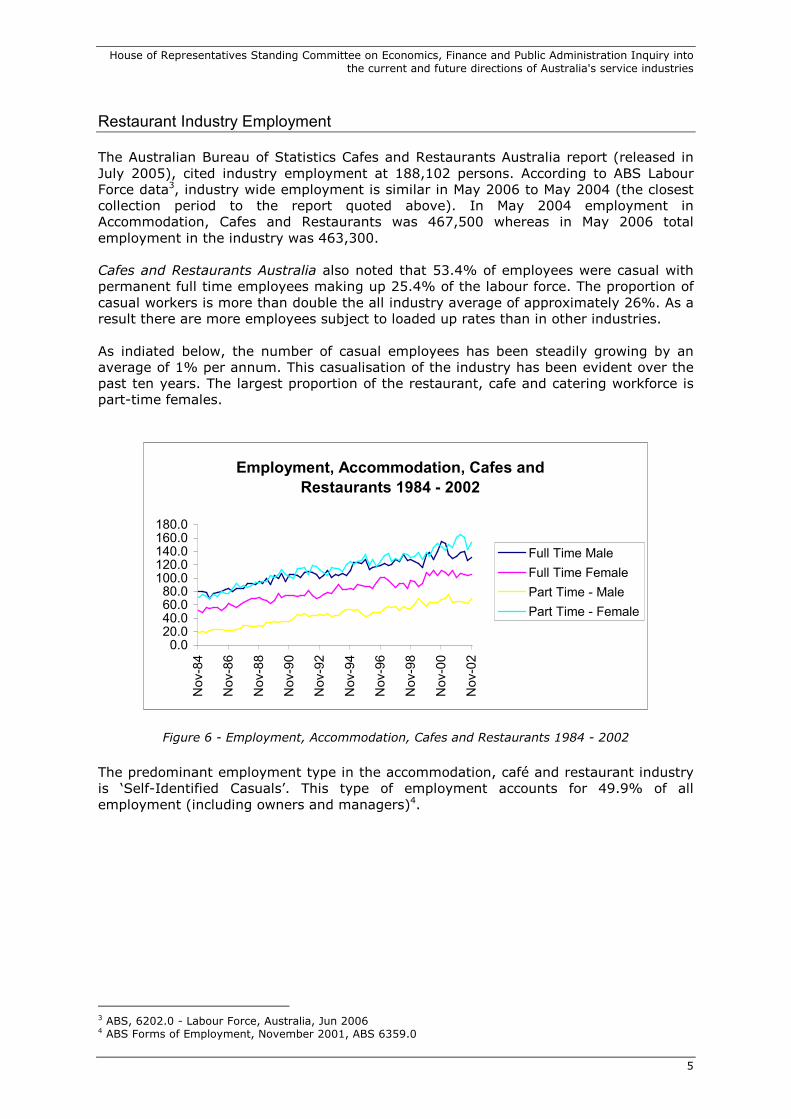
The Australian Bureau of Statistics Cafes and Restaurants Australia report (released in July 2005), cited industry employment at 188,102 persons. According to ABS Labour Force data3, industry wide employment is similar in May 2006 to May 2004 (the closest collection period to the report quoted above). In May 2004 employment in Accommodation, Cafes and Restaurants was 467,500 whereas in May 2006 total employment in the industry was 463,300. Cafes and Restaurants Australia also noted that 53.4% of employees were casual with permanent full time employees making up 25.4% of the labour force. The proportion of casual workers is more than double the all industry average of approximately 26%. As a result there are more employees subject to loaded up rates than in other industries. As indiated below, the number of casual employees has been steadily growing by an average of 1% per annum. This casualisation of the industry has been evident over the past ten years. The largest proportion of the restaurant, cafe and catering workforce is part-time females.
Employment, Accommodation, Cafes and
Restaurants 1984 - 2002
0.020.040.060.080.0100.0120.0140.0160.0180.0
Nov-84
Nov-86
Nov-88
Nov-90
Nov-92
Nov-94
Nov-96
Nov-98
Nov-00
Nov-02
Full Time Male
Full Time Female
Part Time - Male
Part Time - Female
Figure 6 - Employment, Accommodation, Cafes and Restaurants 1984 - 2002
The predominant employment type in the accommodation, café and restaurant industry is ‘Self-Identified Casuals’. This type of employment accounts for 49.9% of all employment (including owners and managers)4.
3 ABS, 6202.0 - Labour Force, Australia, Jun 2006 4 ABS Forms of Employment, November 2001, ABS 6359.0
House of Representatives Standing Committee on Economics, Finance and Public Administration Inquiry into the current and future directions of Australia's service industries
6
Forms of Employment, ABS 6359.0
0
0.1
0.2
0.3
0.4
0.5
0.6
0.7
Employees with
Paid Leave
Entitlements
Self-Identified
Casuals
Employees
without paid
leave
entitlements who
did not identify
as casual
Owner managers
of incorporated
entities
Owner managers
of
unincorporated
entities
Accommodation, Cafes and Restaurants All Industries
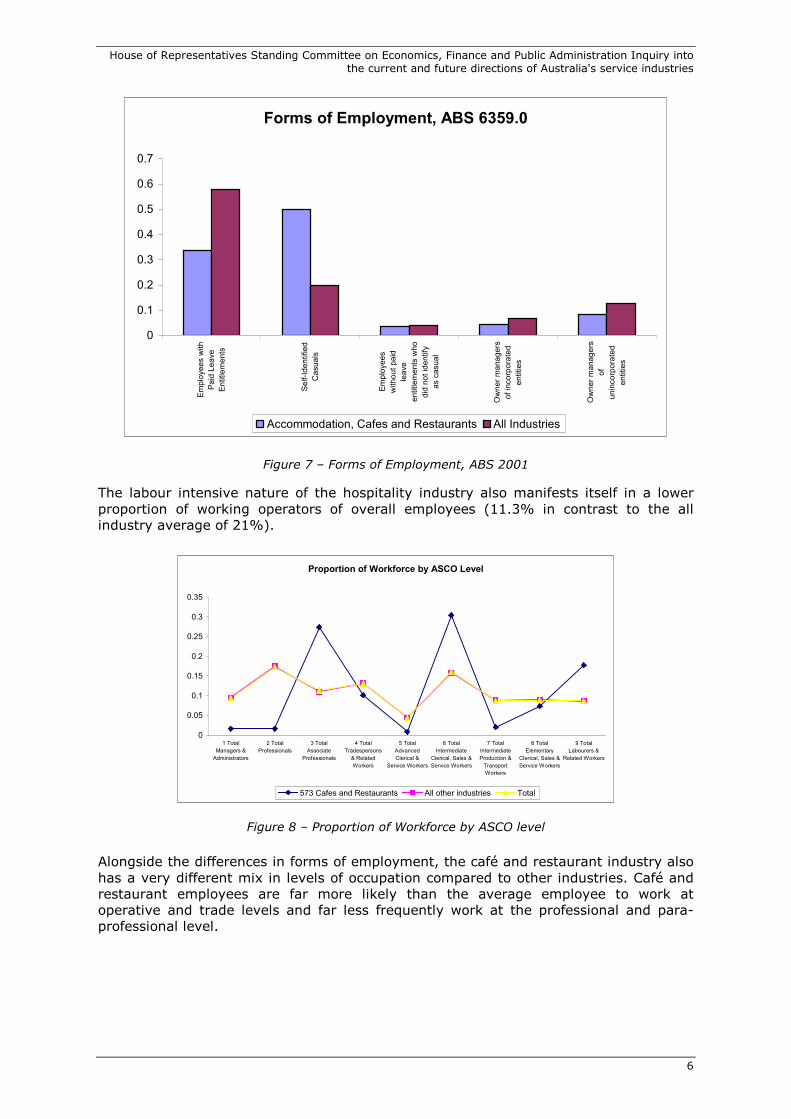
Figure 7 – Forms of Employment, ABS 2001
The labour intensive nature of the hospitality industry also manifests itself in a lower proportion of working operators of overall employees (11.3% in contrast to the all industry average of 21%).
Proportion of Workforce by ASCO Level
0
0.05
0.1
0.15
0.2
0.25
0.3
0.35
1 Total
Managers &
Administrators
2 Total
Professionals
3 Total
Associate
Professionals
4 Total
Tradespersons
& Related
Workers
5 Total
Advanced
Clerical &
Service Workers
6 Total
Intermediate
Clerical, Sales &
Service Workers
7 Total
Intermediate
Production &
Transport
Workers
8 Total
Elementary
Clerical, Sales &
Service Workers
9 Total
Labourers &
Related Workers
573 Cafes and Restaurants All other industries Total
Figure 8 – Proportion of Workforce by ASCO level
Alongside the differences in forms of employment, the café and restaurant industry also has a very different mix in levels of occupation compared to other industries. Café and restaurant employees are far more likely than the average employee to work at operative and trade levels and far less frequently work at the professional and para-professional level.
House of Representatives Standing Committee on Economics, Finance and Public Administration Inquiry into the current and future directions of Australia's service industries
7
Projections for the Restaurant and Catering Industry
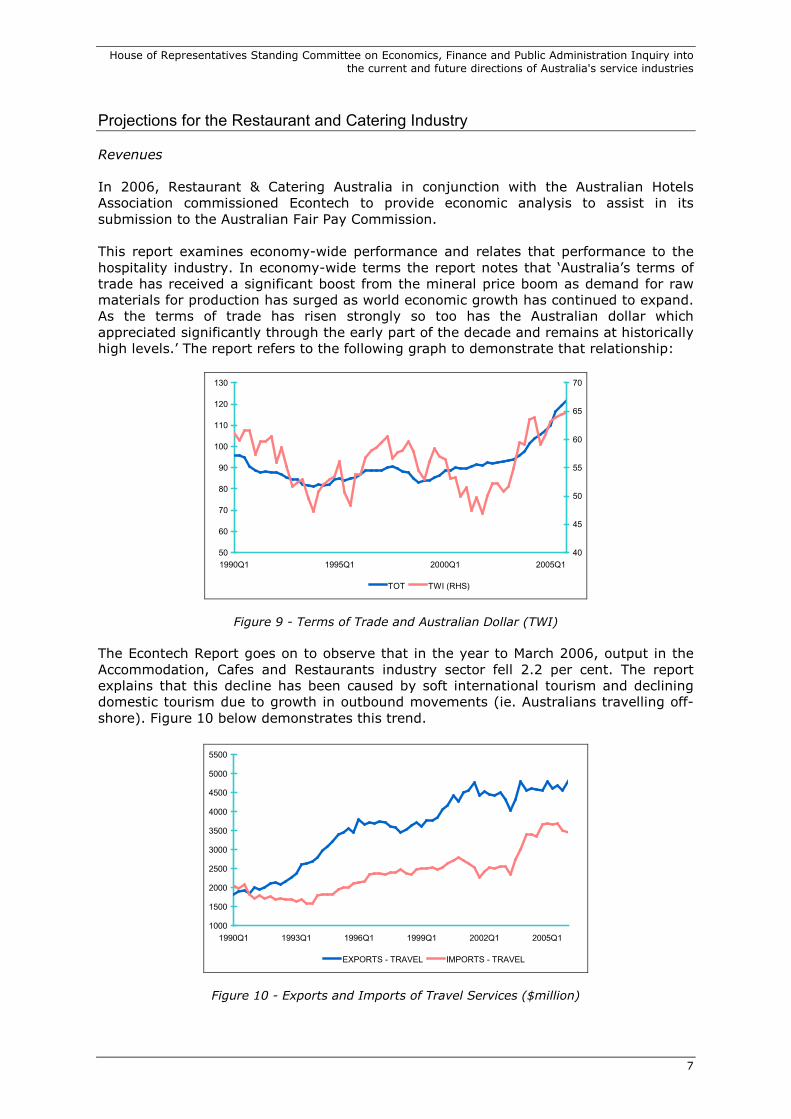
Revenues In 2006, Restaurant & Catering Australia in conjunction with the Australian Hotels Association commissioned Econtech to provide economic analysis to assist in its submission to the Australian Fair Pay Commission. This report examines economy-wide performance and relates that performance to the hospitality industry. In economy-wide terms the report notes that ‘Australia’s terms of trade has received a significant boost from the mineral price boom as demand for raw materials for production has surged as world economic growth has continued to expand. As the terms of trade has risen strongly so too has the Australian dollar which appreciated significantly through the early part of the decade and remains at historically high levels.’ The report refers to the following graph to demonstrate that relationship:
50
60
70
80
90
100
110
120
130
1990Q1 1995Q1 2000Q1 2005Q1
40
45
50
55
60
65
70
TOT TWI (RHS)
Figure 9 - Terms of Trade and Australian Dollar (TWI)
The Econtech Report goes on to observe that in the year to March 2006, output in the Accommodation, Cafes and Restaurants industry sector fell 2.2 per cent. The report explains that this decline has been caused by soft international tourism and declining domestic tourism due to growth in outbound movements (ie. Australians travelling off-shore). Figure 10 below demonstrates this trend.
1000
1500
2000
2500
3000
3500
4000
4500
5000
5500
1990Q1 1993Q1 1996Q1 1999Q1 2002Q1 2005Q1
EXPORTS - TRAVEL IMPORTS - TRAVEL
Figure 10 - Exports and Imports of Travel Services ($million)
House of Representatives Standing Committee on Economics, Finance and Public Administration Inquiry into the current and future directions of Australia's service industries
8
The report forecasts a continuation of these factors. It states that ‘Growth in output and employment is expected to continue to significantly under-perform the rest of the
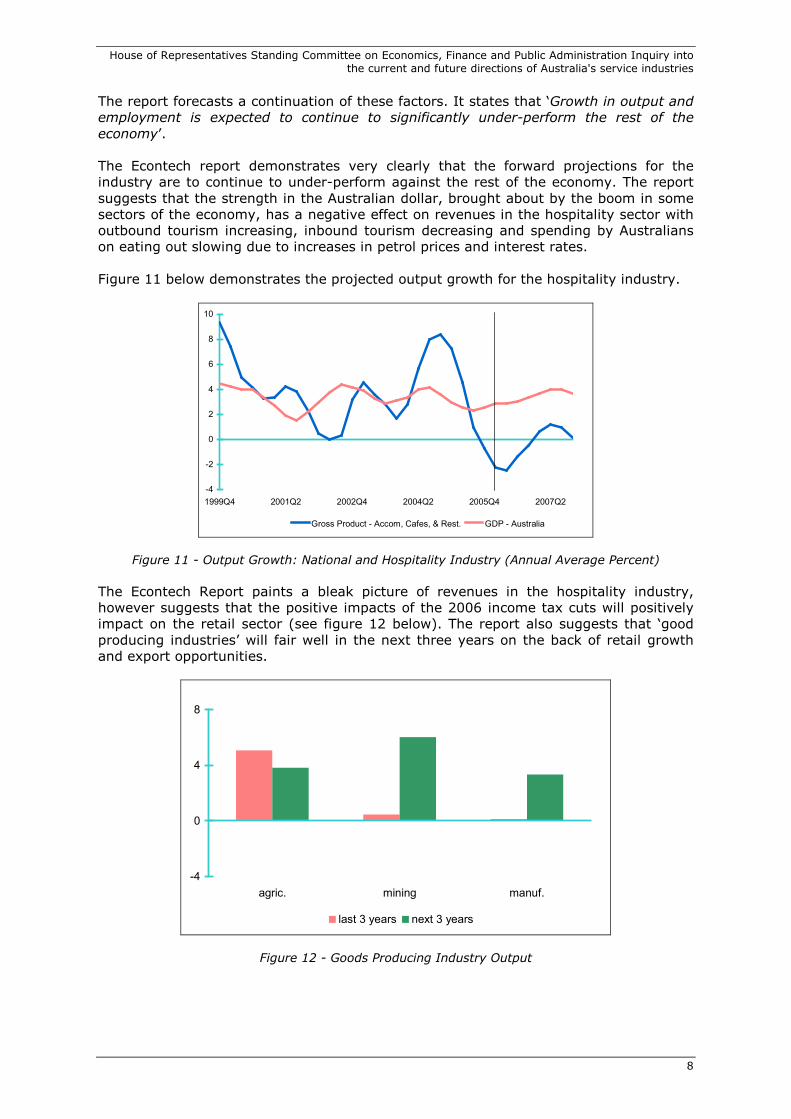
economy’. The Econtech report demonstrates very clearly that the forward projections for the industry are to continue to under-perform against the rest of the economy. The report suggests that the strength in the Australian dollar, brought about by the boom in some sectors of the economy, has a negative effect on revenues in the hospitality sector with outbound tourism increasing, inbound tourism decreasing and spending by Australians on eating out slowing due to increases in petrol prices and interest rates. Figure 11 below demonstrates the projected output growth for the hospitality industry.
-4
-2
0
2
4
6
8
10
1999Q4 2001Q2 2002Q4 2004Q2 2005Q4 2007Q2
Gross Product - Accom, Cafes, & Rest. GDP - Australia
Figure 11 - Output Growth: National and Hospitality Industry (Annual Average Percent)
The Econtech Report paints a bleak picture of revenues in the hospitality industry, however suggests that the positive impacts of the 2006 income tax cuts will positively impact on the retail sector (see figure 12 below). The report also suggests that ‘good producing industries’ will fair well in the next three years on the back of retail growth and export opportunities.
-4
0
4
8
agric. mining manuf.
last 3 years next 3 years
Figure 12 - Goods Producing Industry Output
House of Representatives Standing Committee on Economics, Finance and Public Administration Inquiry into the current and future directions of Australia's service industries
9
Costs
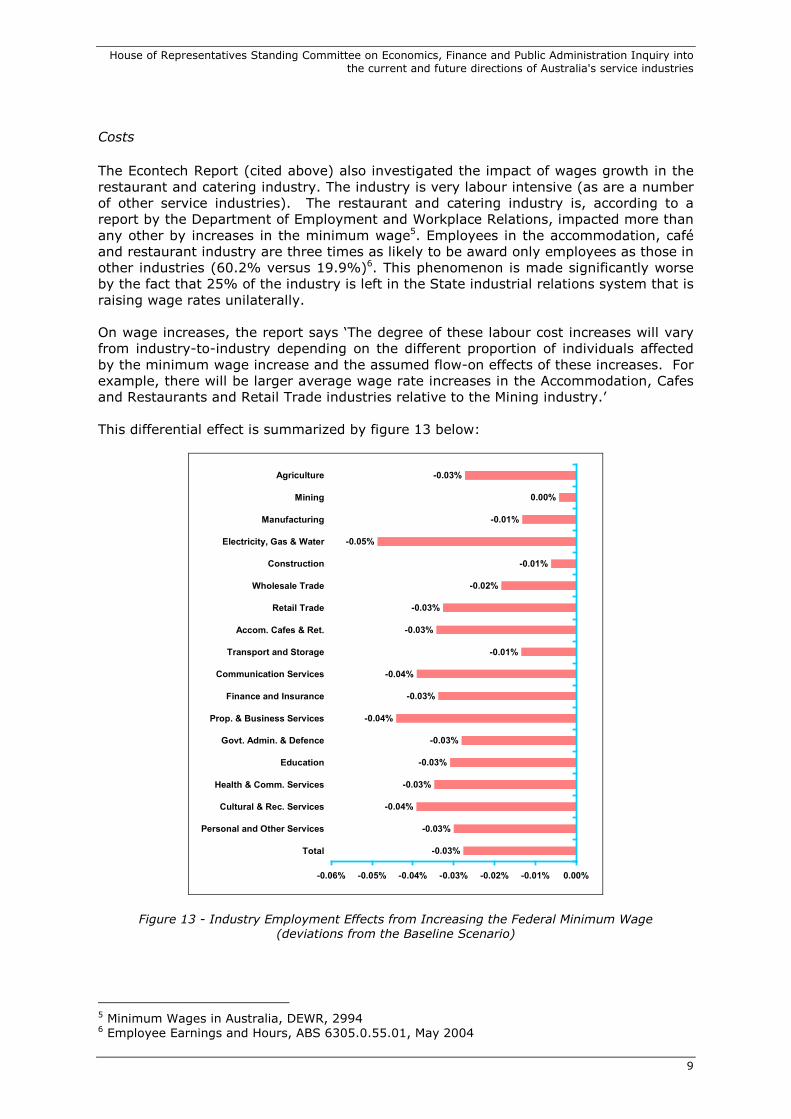
The Econtech Report (cited above) also investigated the impact of wages growth in the restaurant and catering industry. The industry is very labour intensive (as are a number of other service industries). The restaurant and catering industry is, according to a report by the Department of Employment and Workplace Relations, impacted more than any other by increases in the minimum wage5. Employees in the accommodation, café and restaurant industry are three times as likely to be award only employees as those in other industries (60.2% versus 19.9%)6. This phenomenon is made significantly worse by the fact that 25% of the industry is left in the State industrial relations system that is raising wage rates unilaterally. On wage increases, the report says ‘The degree of these labour cost increases will vary from industry-to-industry depending on the different proportion of individuals affected by the minimum wage increase and the assumed flow-on effects of these increases. For example, there will be larger average wage rate increases in the Accommodation, Cafes and Restaurants and Retail Trade industries relative to the Mining industry.’ This differential effect is summarized by figure 13 below:
-0.03%
0.00%
-0.01%
-0.05%
-0.01%
-0.02%
-0.03%
-0.03%
-0.01%
-0.04%
-0.03%
-0.04%
-0.03%
-0.03%
-0.03%
-0.04%
-0.03%
-0.03%
-0.06% -0.05% -0.04% -0.03% -0.02% -0.01% 0.00%
Agriculture
Mining
Manufacturing
Electricity, Gas & Water
Construction
Wholesale Trade
Retail Trade
Accom. Cafes & Ret.
Transport and Storage
Communication Services
Finance and Insurance
Prop. & Business Services
Govt. Admin. & Defence
Education
Health & Comm. Services
Cultural & Rec. Services
Personal and Other Services
Total
Figure 13 - Industry Employment Effects from Increasing the Federal Minimum Wage (deviations from the Baseline Scenario)
5 Minimum Wages in Australia, DEWR, 2994 6 Employee Earnings and Hours, ABS 6305.0.55.01, May 2004
House of Representatives Standing Committee on Economics, Finance and Public Administration Inquiry into the current and future directions of Australia's service industries
10
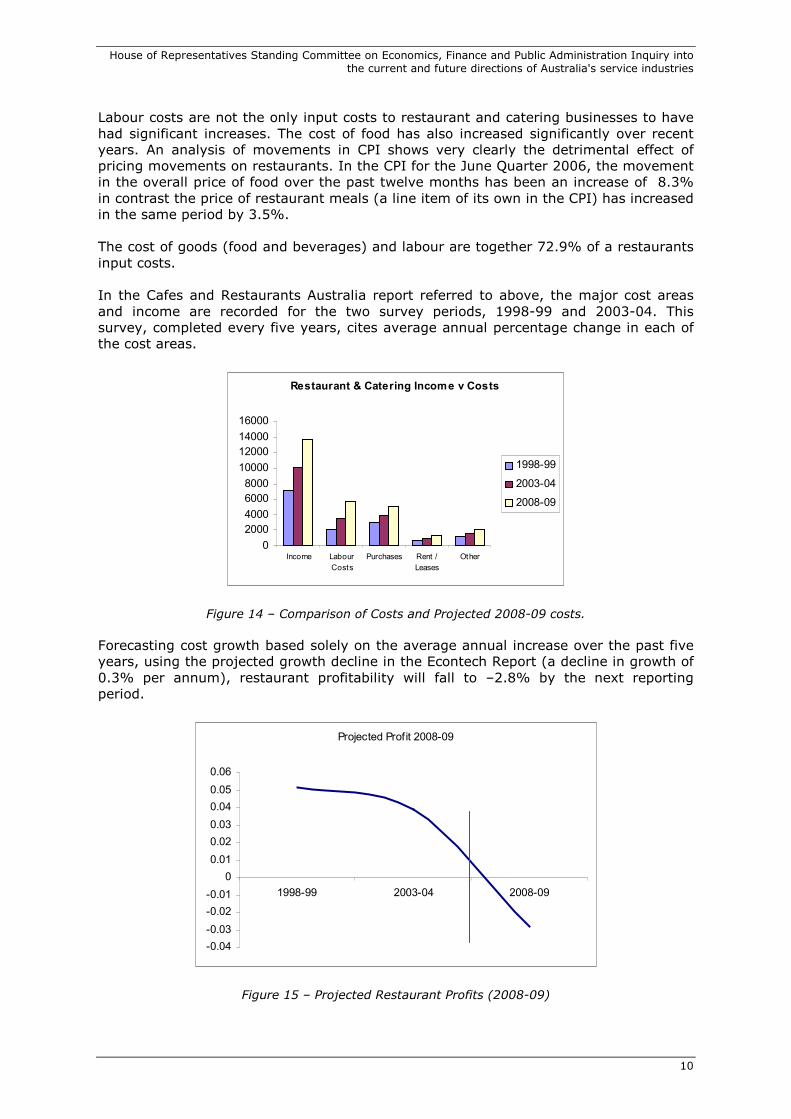
Labour costs are not the only input costs to restaurant and catering businesses to have had significant increases. The cost of food has also increased significantly over recent years. An analysis of movements in CPI shows very clearly the detrimental effect of pricing movements on restaurants. In the CPI for the June Quarter 2006, the movement in the overall price of food over the past twelve months has been an increase of 8.3% in contrast the price of restaurant meals (a line item of its own in the CPI) has increased in the same period by 3.5%. The cost of goods (food and beverages) and labour are together 72.9% of a restaurants input costs. In the Cafes and Restaurants Australia report referred to above, the major cost areas and income are recorded for the two survey periods, 1998-99 and 2003-04. This survey, completed every five years, cites average annual percentage change in each of the cost areas.
Restaurant & Catering Income v Costs
0
2000
4000
6000
8000
10000
12000
14000
16000
Income Labour
Costs
Purchases Rent /
Leases
Other
1998-99
2003-04
2008-09
Figure 14 – Comparison of Costs and Projected 2008-09 costs.
Forecasting cost growth based solely on the average annual increase over the past five years, using the projected growth decline in the Econtech Report (a decline in growth of 0.3% per annum), restaurant profitability will fall to –2.8% by the next reporting period.
Projected Profit 2008-09
-0.04
-0.03
-0.02
-0.01
0
0.01
0.02
0.03
0.04
0.05
0.06
1998-99 2003-04 2008-09
Figure 15 – Projected Restaurant Profits (2008-09)
House of Representatives Standing Committee on Economics, Finance and Public Administration Inquiry into the current and future directions of Australia's service industries
11
The Inquiry
Restaurant & Catering Australia acknowledges the scope of the inquiry into where the service export sector now sits in Australia’s export (and import competing) environment, focusing on, but not limited to:
o the tourism and education service sectors;
o the impact of the resources boom on the service sector;
o future global opportunities for Australian service exports; and
o policies for realising these opportunities.
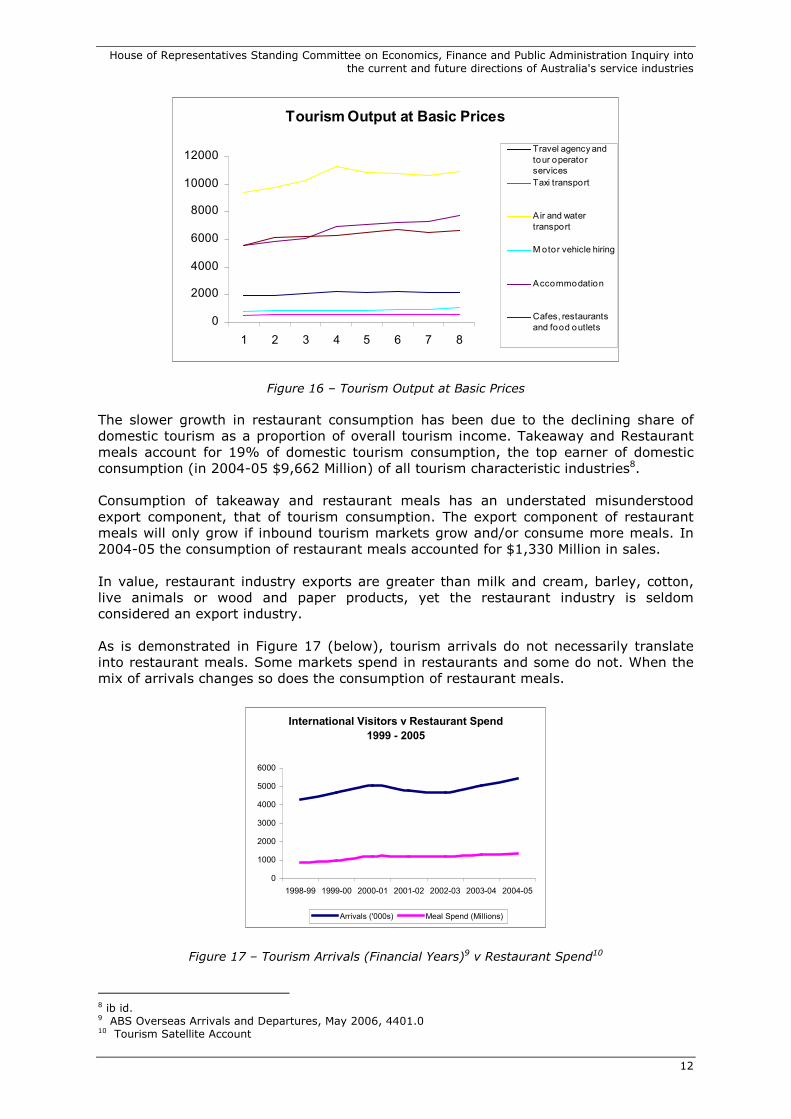
This submission will deal with each of the aspects of relevant aspects of the inquiry in turn. The tourism and education service sectors The restaurant industry is a significant slice of the tourism industry. 14.77% of tourists spend is on meals and 31% of restaurant turnover is from tourists (both domestic and international). The current economic environment is not a positive one for industries servicing tourism in Australia, such as the restaurant and catering industry. The rising Australian Dollar has meant increases in the cost of travel to Australia for non-Australians and decreases the cost of international travel for Australian residents. The conditions result in increases in outbound tourism (Australians travel off-shore as opposed to travelling around Australia) and inbound arrivals slowing. Whilst parts of the tourism industry in Australia benefit from this activity (ie. Airlines and Travel Agents), restaurants and catering businesses suffer. The Tourism Satellite Account defines the restaurant and catering industry as a ‘tourism characteristic industry’. This means that it is considered that the restaurant and catering industry ‘would either cease to exist in their present form, producing their present product(s), or would be significantly affected if tourism were to cease. In the Australian Tourism Satellite Account, for an industry to be ‘characteristic’, at least 25% of its output must be consumed by visitors’, according to the Australian Bureau of Statistics. Figures 16 below demonstrates (for the tourism characteristic industries) the trend in tourism consumption over the past 8 years.
7 ABS Tourism Satellite Account, 2004-05
House of Representatives Standing Committee on Economics, Finance and Public Administration Inquiry into the current and future directions of Australia's service industries
12
Tourism Output at Basic Prices
0
2000
4000
6000
8000
10000
12000
1 2 3 4 5 6 7 8
Travel agency and
tour operator
services
Taxi transport
A ir and water
transport
M otor vehicle hiring
Accommodation
Cafes, restaurants
and food outlets
Figure 16 – Tourism Output at Basic Prices
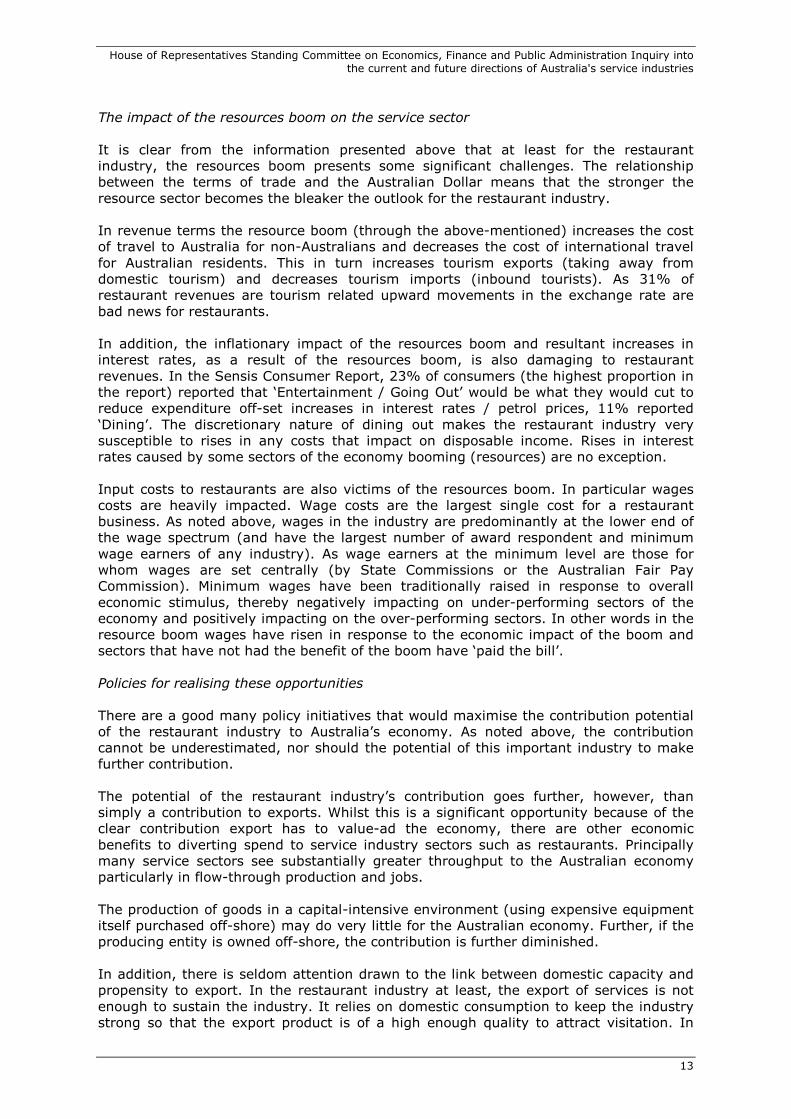
The slower growth in restaurant consumption has been due to the declining share of domestic tourism as a proportion of overall tourism income. Takeaway and Restaurant meals account for 19% of domestic tourism consumption, the top earner of domestic consumption (in 2004-05 $9,662 Million) of all tourism characteristic industries8. Consumption of takeaway and restaurant meals has an understated misunderstood export component, that of tourism consumption. The export component of restaurant meals will only grow if inbound tourism markets grow and/or consume more meals. In 2004-05 the consumption of restaurant meals accounted for $1,330 Million in sales. In value, restaurant industry exports are greater than milk and cream, barley, cotton, live animals or wood and paper products, yet the restaurant industry is seldom considered an export industry. As is demonstrated in Figure 17 (below), tourism arrivals do not necessarily translate into restaurant meals. Some markets spend in restaurants and some do not. When the mix of arrivals changes so does the consumption of restaurant meals.
International Visitors v Restaurant Spend
1999 - 2005
0
1000
2000
3000
4000
5000
6000
1998-99 1999-00 2000-01 2001-02 2002-03 2003-04 2004-05
Arrivals ('000s) Meal Spend (Millions)
Figure 17 – Tourism Arrivals (Financial Years)9 v Restaurant Spend10
8 ib id. 9 ABS Overseas Arrivals and Departures, May 2006, 4401.0 10 Tourism Satellite Account
House of Representatives Standing Committee on Economics, Finance and Public Administration Inquiry into the current and future directions of Australia's service industries
13
The impact of the resources boom on the service sector
It is clear from the information presented above that at least for the restaurant industry, the resources boom presents some significant challenges. The relationship between the terms of trade and the Australian Dollar means that the stronger the resource sector becomes the bleaker the outlook for the restaurant industry. In revenue terms the resource boom (through the above-mentioned) increases the cost of travel to Australia for non-Australians and decreases the cost of international travel for Australian residents. This in turn increases tourism exports (taking away from domestic tourism) and decreases tourism imports (inbound tourists). As 31% of restaurant revenues are tourism related upward movements in the exchange rate are bad news for restaurants. In addition, the inflationary impact of the resources boom and resultant increases in interest rates, as a result of the resources boom, is also damaging to restaurant revenues. In the Sensis Consumer Report, 23% of consumers (the highest proportion in the report) reported that ‘Entertainment / Going Out’ would be what they would cut to reduce expenditure off-set increases in interest rates / petrol prices, 11% reported ‘Dining’. The discretionary nature of dining out makes the restaurant industry very susceptible to rises in any costs that impact on disposable income. Rises in interest rates caused by some sectors of the economy booming (resources) are no exception. Input costs to restaurants are also victims of the resources boom. In particular wages costs are heavily impacted. Wage costs are the largest single cost for a restaurant business. As noted above, wages in the industry are predominantly at the lower end of the wage spectrum (and have the largest number of award respondent and minimum wage earners of any industry). As wage earners at the minimum level are those for whom wages are set centrally (by State Commissions or the Australian Fair Pay Commission). Minimum wages have been traditionally raised in response to overall economic stimulus, thereby negatively impacting on under-performing sectors of the economy and positively impacting on the over-performing sectors. In other words in the resource boom wages have risen in response to the economic impact of the boom and sectors that have not had the benefit of the boom have ‘paid the bill’. Policies for realising these opportunities There are a good many policy initiatives that would maximise the contribution potential of the restaurant industry to Australia’s economy. As noted above, the contribution cannot be underestimated, nor should the potential of this important industry to make further contribution. The potential of the restaurant industry’s contribution goes further, however, than simply a contribution to exports. Whilst this is a significant opportunity because of the clear contribution export has to value-ad the economy, there are other economic benefits to diverting spend to service industry sectors such as restaurants. Principally many service sectors see substantially greater throughput to the Australian economy particularly in flow-through production and jobs. The production of goods in a capital-intensive environment (using expensive equipment itself purchased off-shore) may do very little for the Australian economy. Further, if the producing entity is owned off-shore, the contribution is further diminished. In addition, there is seldom attention drawn to the link between domestic capacity and propensity to export. In the restaurant industry at least, the export of services is not enough to sustain the industry. It relies on domestic consumption to keep the industry strong so that the export product is of a high enough quality to attract visitation. In
House of Representatives Standing Committee on Economics, Finance and Public Administration Inquiry into the current and future directions of Australia's service industries
14
short, the export component of the industry cannot be separated from the domestic component. Policy that makes the domestic restaurant industry strong also assists in exports. The starting point for policy change to maximise the potential of the service industries should be to identify where there are policies that actively discriminate against the provision of services. Restaurant & Catering Australia contends that these policy areas should be addressed first. Secondly, attention should be paid to areas of policy that would actively favour service businesses as a means of off-setting the negative impacts of the resource boom.
Policies that Actively Discriminate Against the Services / Restaurant Industry
Taxation There are areas of the taxation system that actively discriminate against the restaurant industry, one area of particular concern is the GST on mixed inputs. Whilst there has been an announcement of a Simplified Accounting Method to solve this problem, the issue is still live among restaurateurs and caterers. The restaurant industry has mixed inputs (some GSTable and some not). As a result rather than dividing expenditure by 11 to get the GST paid, a restaurateur must go to each invoice in each reporting period. This increases the compliance cost of the GST for restaurateurs.
Businesses with mixed inputs (such as restaurants, cafes and caterers) should be able to elect to utilise a simplified accounting method that approximates input credits.
The Taxation treatment of business meals also actively discriminates against small business and against the restaurant industry. Treating a business meal in a restaurant as a fringe benefit is unfair and discriminatory. It discriminates against small business by providing a tax break to large businesses that have meals in their board rooms and do not pay FBT and it discriminates against restaurants by viewing all other forms of expenditure (rental of expensive premises, placement of advertising, postage etc) as legitimate business costs but assumed that every business meal is a benefit in the hands of the staff member. Legitimate business meal expenditure should be removed from FBT coverage and made non-deductible11.
Superannuation The superannuation guarantee is indexed to the salary and wages an employee receives. Whilst this is of course understandable as this is the only way in which equitable retirement savings could be generated, it does place an additional burden on labour intensive businesses. Service businesses by their very nature are more labour intensive than their resource, manufacturing or primary industry competitors (in a labour market sense). This being the case service businesses pay more superannuation and are making a greater contribution to Australia’s retirement savings than other industry sectors.
11 To confirm the legitimacy of a business expense, it is proposed that the reforms are limited to situations where an ABN is exchanged as part of the transaction, including where the business representative is the holder of a company credit card or where a company has a direct account with a restaurant.
House of Representatives Standing Committee on Economics, Finance and Public Administration Inquiry into the current and future directions of Australia's service industries
15
Ways in which this burden can be reduced should therefore be investigated. Two ways in which service business could be relieved of some of their load, without reducing retirement savings would be to raise the superannuation guarantee threshold (thereby eliminating more of the part-time and casual employees who do not collect their super.) and by directing the superannuation for working holiday makers to some form of industry fund. The service industries employ the lion share of casual employees (due to the irregular nature of the hours worked etc). When the superannuation guarantee threshold was established a threshold was put in place to shield businesses from having to invest in superannuation for these individuals. Since 1992 the threshold has remained the same yet wages have increased substantially over this period. The is a significant amount of evidence that these casual employees do not collect the superannuation contributions made on their behalf.
The superannuation guarantee threshold is raised to $1800 per quarter (from $450 per month) and that it be indexed to CPI.
The overall superannuation contributions by working holiday-makers is ever increasing. The working holiday-maker program is expanding in both raw numbers of arrivals and length of stay. Whilst it is acknowledged that it is not feasible not to make contributions for these individuals, the superannuation paid seldom gets to the individuals themselves and is almost never contributed to their retirement savings.
That superannuation contributions for working holiday makers be contributed to a training and education fund.
Food Regulation A very large number of service businesses are food businesses (either foodservice or retail). These businesses are some of the most regulated businesses in the country. One aspect of regulation that has been proven over and over again as impractical for foodservice businesses is Food Safety Plans. This template standard in the Food Standards (3.2.1) has been demonstrated through any number of reports to have no cost benefit for foodservice businesses, yet regulators continue to progress ways of advancing this standard with foodservice businesses. There are several alternatives to this highly regulated and administrative process. Many of these alternatives have been demonstrated to have a greater impact on the standard of food safety. These include training of food handlers. That the FSANZ proposal to implement mandatory food safety plans be changed (as a result of the current further studies and evaluation) and a new approach be developed that encourages food safety plans being developed as best practice or punitive measures and food handler training be mandated.
Policies that would advance the contribution of service businesses
Tourism The only reason that international tourism has been able to stay somewhat buoyant is the investment made by the Australian Government into tourism promotion through Tourism Australia. This level of contribution, instigated through the Tourism White Paper in 2003-04 must continue at current levels if industries servicing tourism, such as restaurants and catering businesses are to survive.
House of Representatives Standing Committee on Economics, Finance and Public Administration Inquiry into the current and future directions of Australia's service industries
16
Decision on the allocation of marketing funds by Tourism Australia must also continue to be driven by which markets offer yield (not just numbers of arrivals but spend in tourism characteristic industries such as restaurants). Investment in tourism marketing by the Australian Government should continue and continue to be driven by yield. The development of domestic tourism also remains a high priority for the restaurant industry. As indicated above, the spend by domestic tourists is higher in restaurants than in any other tourism characteristic product area. This is, at $9.6 Billion per annum, an strategically important piece of business. It accounts for a large number of jobs (estimated at over 80,000) and has a flow through to food and beverage producers of some $3.2 Billion. In addition, as noted above, the restaurant, café and catering product, that creates tourism exports of this product, is dependant on the domestic tourism component to survive. Product development occurs substantially to meet the need of the domestic market and then is available to the international market as a result. The role of Tourism Australia in the strategic development of domestic tourism, and the funding of domestic tourism development by the State / Territory Government must continue and not decline in real terms.
Education & Training Service businesses, including the restaurant industry, are much more labour intensive that their competitor resource, manufacturing or primary industry businesses. As a result they are more reliant on the vocational training and education sectors to ensure a supply of adequately trained staff. In recent times there are many examples of revenues to individual restaurant businesses being reduced directly by the availability of suitably trained staff (ie. businesses that have to shut down parts of their premises due to not being able to staff them). It is critical that this does not happen and that the industry is able to attract sufficient staff numbers at sufficiently high quality for business to be enhanced rather than compromised. Policy priorities in training are education to:
Decrease the wastage in the training effort through the adequate selection of individuals
to undertake training whether in the school systems or through other means. Screening of aptitude and attitude must form part of this process.
Review the administrative and employer incentive arrangements, surrounding the New Apprenticeship Scheme, with a view to minimising the burden on employers and should
be modified to (a) focus on occupations in skill shortage and (b) encourage the retention of an apprentice by the employer who has invested in their training particularly in the first two years.
Encourage State Training Agencies to recognise and fund appropriate assessment pathways to hospitality qualifications.
Overhaul the promotion of training options, the consultation of operators and the very language used by the training system to make it more customer focussed.
Immigration
House of Representatives Standing Committee on Economics, Finance and Public Administration Inquiry into the current and future directions of Australia's service industries
17
Another source of skilled labour, to assist in meeting the skills and labour shortages faced by service industries is immigration. As labour intensive industries, service industries clearly have a significant need for an effective migration program (both permeant, semi-permeant and short term). Policy priorities in this area include:
The process of justifying the skill shortage, for immigration purposes, should be made easier through streamlining at an industry wide basis12.
The process of work rights checking should be streamlined with other Government
systems (in particular the Australian Taxation Office’s Income Tax Declaration process).
Skilled Front of House (Hospitality) Occupations should be added to the Migration Occupation in demand listing.
The maximum working hours per week for an international student on a student visa should be extended to 30 hours per week (from the current 20).
Perth should be classified as a region for immigration purposes.
DIMIA should continue to provide support to business, through industry associations, to
provide support for skilled migration. This support should be provided on the basis of the level of need (skill shortage). Workplace Relations Once again, the service industry’s stake in workplace relations reform is higher than other industries due to its inherent labour intensity. As a policy priority the most important area of workplace relations policy is to ensure that the wage setting process acknowledged the differences between levels of performance between sectors of the economy and is able to compensate in awarding differential decisions. As noted above, in a resource boom, the resultant economic good fortune is not felt across the board. In fact the boom in one sector is bust in another. Increases to the minimum wage must be able to be granted with this in mind and be greater in some sectors and less in others OR only be granted at the lowest common denominator level. In addition, the Australian Government overall policy of the primacy of the negotiation of wages and conditions in the workplace, must continue. Restaurant & Catering Australia believes however, that this effort requires support for small service based businesses. Policy priorities for workplace relations include:
The process of setting the Safety Net Wage should require the consideration the impact of increases on impacted industries on a case by case basis and apply differential increases based on their specific economic conditions.
The process of individual and collective agreement should be fostered and promoted throughout the industry and adequately resourced to ensure greater take up.
12 Achieved through the signing of a Labour Agreement ONLY FOR COOKS / CHEFS.