Embed Size (px)
Citation preview
491
Ecological Monographs, 69(4), 1999, pp. 491–511q 1999 by the Ecological Society of America
RESPONSES OF TUNDRA PLANTS TO EXPERIMENTAL WARMING:META-ANALYSIS OF THE INTERNATIONAL TUNDRA EXPERIMENT
A. M. ARFT,1 M. D. WALKER,1,22 J. GUREVITCH,2 J. M. ALATALO,3 M. S. BRET-HARTE,4 M. DALE,5
M. DIEMER,6 F. GUGERLI,7 G. H. R. HENRY,8 M. H. JONES,9 R. D. HOLLISTER,10 I. S. JONSDOTTIR,11
K. LAINE,12 E. LEVESQUE,13 G. M. MARION,14 U. MOLAU,3 P. MøLGAARD,15 U. NORDENHALL,3
V. RASZHIVIN,16 C. H. ROBINSON,17 G. STARR,18 A. STENSTROM,3 M. STENSTROM,3 Ø. TOTLAND,19
P. L. TURNER,1 L. J. WALKER,10 P. J. WEBBER,10 J. M. WELKER,20 AND P. A. WOOKEY21
1Institute of Arctic and Alpine Research, University of Colorado, Boulder, Colorado 80303-0450 USA2Department of Ecology and Evolution, State University of New York at Stony Brook,
Stony Brook, New York 11794-5245 USA3Department of Botany, University of Gothenburg, Box 461, SE-405 30 Gothenburg, Sweden
4The Ecosystems Center, Marine Biological Laboratory, 7 MBL St., Woods Hole, Massachusetts 02543 USA5Department of Biological Sciences, University of Alberta, Edmonton, Alberta T6G 2E9, Canada
6Botanisches Institut, Universitat Basel, Schonbeinstr. 6, CH-4056 Basel, Switzerland7Institut fur Systematische Botanik, University of Zurich, Zollikerstrasse 107, CH-8008 Zurich, Switzerland
8Department of Geography, University of British Columbia, Vancouver, British Columbia V6T 1Z2, Canada9Department of Plant Biology, 1735 Neil Avenue, The Ohio State University, Columbus, Ohio 43210-1293 USA
10Michigan State University, East Lansing, Michigan 48824-1031 USA11Department of Botany, University of Gothenburg, Box 461, SE-405 30 Gothenburg, Sweden
12Botanical Gardens, University of Oulu, P.O. Box 333, Fin-90571 Oulu, Finland13Departement de chimie-biologie, Universite du Quebec a Trois-Rivieres, C.P. 500,
Trois-Rivieres, Quebec, G9A 5H7, Canada14Cold Regions Research and Engineering Laboratory, 72 Lyme Road, Hanover, New Hamphire 03755 USA
15Royal Danish School of Pharmacy, Afdeling for Pharmakognosi, Universitetsparken 2,DK-2100 København Ø, Denmark
16Komarov Botanical Institute, Department of Geobotany, Popov St. 2, RU-197022, St. Petersburg, Russia17Division of Life Sciences, King’s College, University of London, Campden Hill Road, London W8 7AH, UK
18Department of Biological Sciences, Florida International University, University Park, Miami, Florida 33199 USA19Botanical Institute, University of Bergen, Allegaten 41, N-5007 Bergen, Norway
20Department of Rangeland Ecology, University of Wyoming, Laramie, Wyoming 72801 USA21Department of Geography, University of London, Royal Holloway, Egham, Surrey TW20 0EX, UK
Abstract. The International Tundra Experiment (ITEX) is a collaborative, multisite experiment using acommon temperature manipulation to examine variability in species response across climatic and geographicgradients of tundra ecosystems. ITEX was designed specifically to examine variability in arctic and alpine speciesresponse to increased temperature. We compiled from one to four years of experimental data from 13 differentITEX sites and used meta-analysis to analyze responses of plant phenology, growth, and reproduction to ex-perimental warming. Results indicate that key phenological events such as leaf bud burst and flowering occurredearlier in warmed plots throughout the study period; however, there was little impact on growth cessation at theend of the season. Quantitative measures of vegetative growth were greatest in warmed plots in the early yearsof the experiment, whereas reproductive effort and success increased in later years. A shift away from vegetativegrowth and toward reproductive effort and success in the fourth treatment year suggests a shift from the initialresponse to a secondary response. The change in vegetative response may be due to depletion of stored plantreserves, whereas the lag in reproductive response may be due to the formation of flower buds one to severalseasons prior to flowering. Both vegetative and reproductive responses varied among life-forms; herbaceousforms had stronger and more consistent vegetative growth responses than did woody forms. The greater re-sponsiveness of the herbaceous forms may be attributed to their more flexible morphology and to their relativelygreater proportion of stored plant reserves. Finally, warmer, low arctic sites produced the strongest growthresponses, but colder sites produced a greater reproductive response. Greater resource investment in vegetativegrowth may be a conservative strategy in the Low Arctic, where there is more competition for light, nutrients,or water, and there may be little opportunity for successful germination or seedling development. In contrast,in the High Arctic, heavy investment in producing seed under a higher temperature scenario may provide anopportunity for species to colonize patches of unvegetated ground. The observed differential response to warmingsuggests that the primary forces driving the response vary across climatic zones, functional groups, and throughtime.
Key words: arctic tundra; experimental warming; global change; global warming; International Tundra Experiment;ITEX; meta-analysis; plant response patterns; spatiotemporal gradients; tundra plants.
Manuscript received 29 June 1998; revised 31 December 1998; accepted 5 January 1999; final version received 29 January1999.
22 Author to whom correspondence should be addressed. Current address: Cooperative Forestry Research Unit, Universityof Alaska, Fairbanks, AK 99775-6780.
492 A. M. ARFT ET AL. Ecological MonographsVol. 69, No. 4
INTRODUCTION
Global air temperatures are predicted to increase1–4.58C over the next century, with the greatest in-creases expected in the Arctic (Mitchell et al. 1990,Maxwell 1992, Intergovernmental Panel on ClimateChange 1996). Field experiments designed to simulatethis warming incorporate variation in growth, repro-ductive, and phenological responses among species aswell as by latitude and habitat (Havstrom et al. 1993,Wookey et al. 1993, Chapin et al. 1995, Henry andMolau 1997, Welker et al. 1997). Little is known aboutthe nature of variation in response to these experiments,yet understanding it is critical to our ability to ade-quately predict and understand ecosystem response toa changing climate. A common assumption is that pat-terns of experimental response can be directly extrap-olated to the geographic range of the species, to otherspecies within the same functional type, or acrossyears, but rarely have ecologists explicitly tested theseassumptions.
Tundra ecosystems are globally important in relationto the rise in atmospheric CO2 concentrations becausethey contain large stores of soil carbon, and shifts inbalance between photosynthesis and respiration, there-fore, potentially could have a major impact on carbonfluxes between the ecosystem and atmosphere (Oechelet al. 1993). Arctic tundra stores between 250 and 455Pg of C below ground on a global basis (Oechel andBillings 1992). In tundra ecosystems where meangrowing-season temperatures are near zero, an increaseof a few degrees can produce a significant increase inthe total warmth available to plants and decomposers.There is considerable current interest in understandinghow this biome will respond to warming.
We examined the responses of a set of tundra vas-cular plant species that were subjected to experimentalwarming at 13 sites located throughout the circumpolarArctic and in north temperate alpine regions (althoughthere remains a lack of coverage in Russia). The datawere collected as part of the International Tundra Ex-periment (ITEX), a collaborative, global experimentbased on a common warming manipulation treatment(Henry and Molau 1997). ITEX was designed specif-ically to examine variability in arctic and alpine speciesresponse across climatic and geographic gradients(Henry and Molau 1997). The experiment is based ona common experimental design, a common set of spe-cies, and quantifying common environmental param-eters (Molau and Mølgaard 1996). By using geograph-ically widespread experimentation, a broad spectrumof species, and multiple years of sampling, ITEX in-corporates controlled variability in time, space, andfunctional groups. In the present analysis, time rep-resents the duration of the experiment; space representsa complex of climate and site factor variables (climaticzones); and functional groups are plant growth forms
traditionally recognized by arctic ecologists. By com-piling and integrating the initial four years of data fromthese sites, we were able to examine how the responseof tundra plants to experimental warming varied withinand among temporal, spatial, and functional groups.
We examined three specific scientific hypotheses:1. Most species will exhibit measurable, significant
increases in vegetative growth due to warming in theearly years of experimentation.—Most of the live bio-mass of tundra vegetation occurs below ground (Kjel-vik and Karenlampi 1975, Webber 1977, Jonasson1982, Miller et al. 1982, Ellenberg 1988, Henry et al.1990, Shaver and Kummerow 1992). Much of this be-lowground biomass consists of stems or rhizomes thatfunction primarily as storage tissues (Shaver and Cutler1979, Bliss 1981). These carbon and nutrient reservesare important resources when growth requirements can-not be met by current uptake of nutrients (Berendseand Jonasson 1992, Shaver and Kummerow 1992).Thus, short-term temperature-enhanced vegetativegrowth may occur at the expense of stored plant re-serves. The long-term cost of increased shoot growth,however, will be a decline in production if plants arenot allowed to recover and restore reserves. Chapinand Shaver (1996) found that arctic species that re-sponded to increased temperature with earlier leaf ex-pansion (Betula and Ledum) had reduced total nitrogenand phosphorus pools after three years, suggesting thatearlier phenology may have depleted stored plant re-serves.
2. Vegetative growth will be greater at warmer, lowarctic sites, whereas sexual reproduction will be great-er at colder, high arctic sites.—Relative shifts in veg-etative growth and reproduction will be a function ofcompetition and nutrient availability. The change froma complete to an incomplete canopy cover along a gra-dient of summer temperature corresponds with a gra-dient from combined biotic and abiotic controls topurely abiotic controls (Svoboda and Henry 1987,Walker 1995). Thus, as the size of the flora, canopycover, and biomass decrease, competitive interactionsdecrease as well. Within the polar barrens, there is littleevidence that competition occurs at all; in most areas,average plant cover is ,1% (Bliss and Peterson 1992).In the Low Arctic, an increase in nutrients translatesinto increased vegetative growth, but not increased re-production (Walker et al. 1995, Chapin and Shaver1996), which we have interpreted as a response to com-petition. In the High Arctic, an increase in nutrientsresults in an increase in both vegetative growth andreproduction (Wookey et al. 1994, 1995). The moreextreme resource limitations in the High Arctic maylimit an increase in vegetative growth (Bliss and Pe-terson 1992). In addition to constraints on growth im-posed directly by soil nutrient availability, the responseof high arctic vegetation might be constrained by itsdevelopmental or evolutionary history; if the vegeta-
November 1999 493ITEX META-ANALYSIS
tion has adapted to an environment in which repro-duction is favored, perhaps it will respond to morefavorable conditions with more reproduction, ratherthan increased vegetative growth.
3. Although species will exhibit individualistic re-sponses to increased summer temperature, there willbe high similarity of response within functionalgroups.—The response of each species to warming de-pends on inherent physiological pathways, reproduc-tive structures, and leaf morphology (Billings 1992).Although these characteristics vary widely among spe-cies, similarities within functional groups contribute toa similar response within these groups. Chapin et al.(1996) developed a hierarchical classification of func-tional types for arctic plant species, based on environ-mental gradients and the relative impact of differenttraits on ecosystem processes. Within the vascular plantgroup, plants were broadly divided into woody or her-baceous forms. Woody plants differ from herbaceousplants in the maximum canopy height that they canachieve, and in the high lignin and low nitrogen contentof wood. Within the woody form, deciduous plants dif-fer from evergreens in their shorter period of photo-synthetic activity, greater resource requirements, high-er leaf turnover, and higher quality of leaf litter. De-ciduous shrubs within the Arctic tend to dominate nu-trient-rich sites, whereas evergreen shrubs dominatedry and infertile heath sites (Chapin et al. 1996). Her-baceous forms include sedges, grasses, and forbs. With-in the Arctic, sedges tend to dominate waterloggedsoils, whereas the belowground meristems of grassesallow them to be effective colonizers following dis-turbance, and forbs reach their greatest abundance anddiversity in dry and moist nutrient-rich sites (Chapinet al. 1996). Plant functional types such as these havebeen widely used in arctic research to describe patternsof response to environmental change (Webber 1978,Henry et al. 1986, Walker et al. 1989) and have beenproposed as a key tool for developing predictive modelsof plant responses to changing environments.
Although many of these hypotheses have been ex-amined in specific research contexts, our objective wasto determine how well they held up across a variety ofsites and conditions. The nature and strength of theITEX network, a circumpolar series of arctic and alpinesites with similar sampling protocols, provided aunique opportunity to synthesize our data using meta-analysis techniques. Meta-analysis permits the statis-tical analysis of a set of primary studies (usually takenfrom the scientific literature), and has only recentlybeen applied to ecological data (Gurevitch et al. 1992).This is the first quantitative assessment of ITEX, fol-lowing the more qualitative synthesis of Henry andMolau (1997).
METHODS
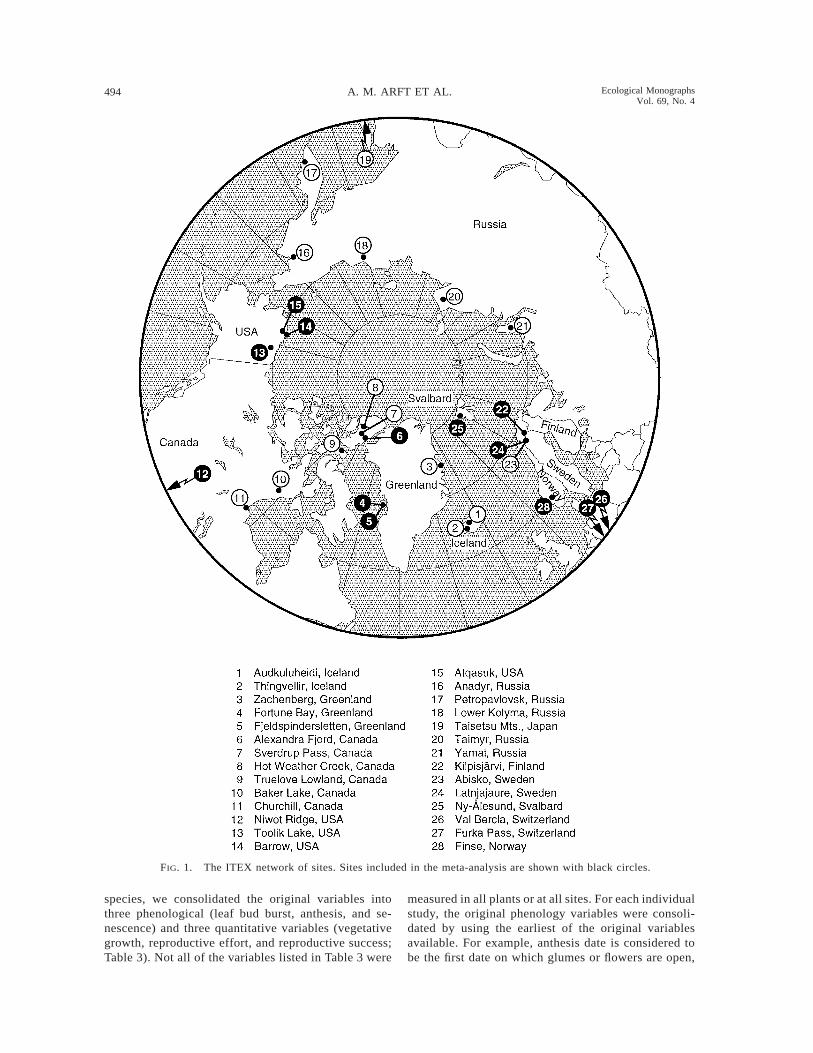
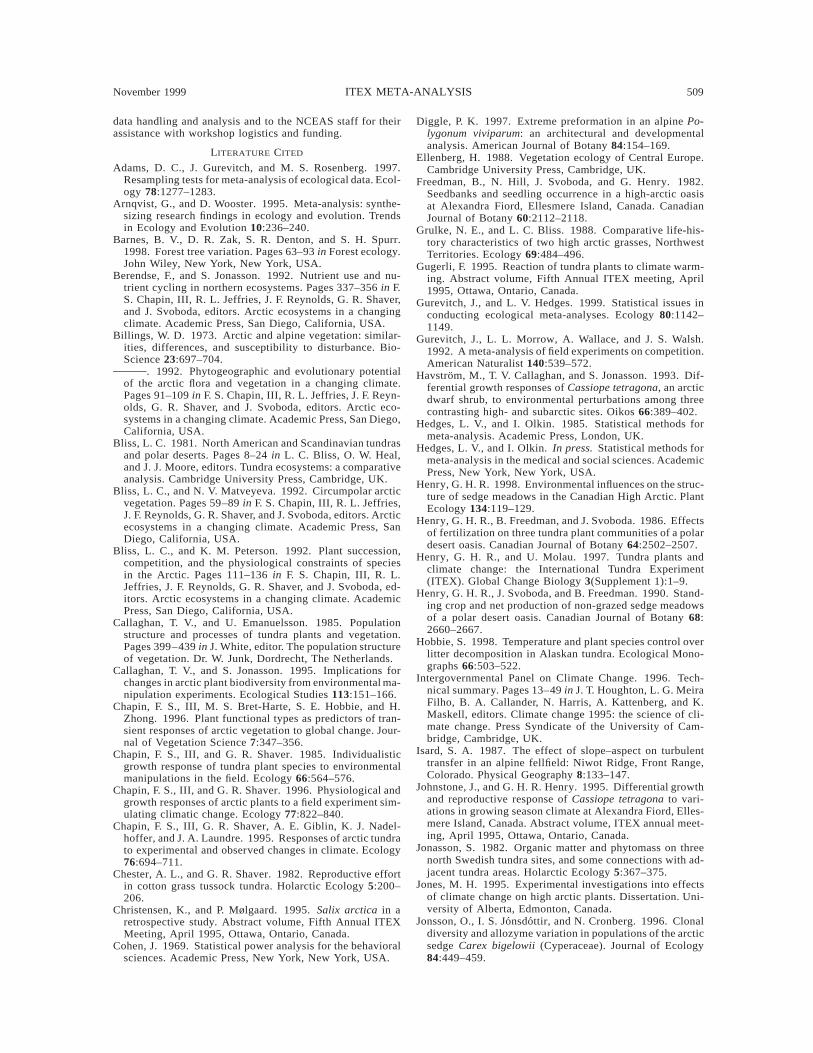
The data for this analysis came from 13 circumarcticand alpine ITEX sites (Fig. 1). Although all studies
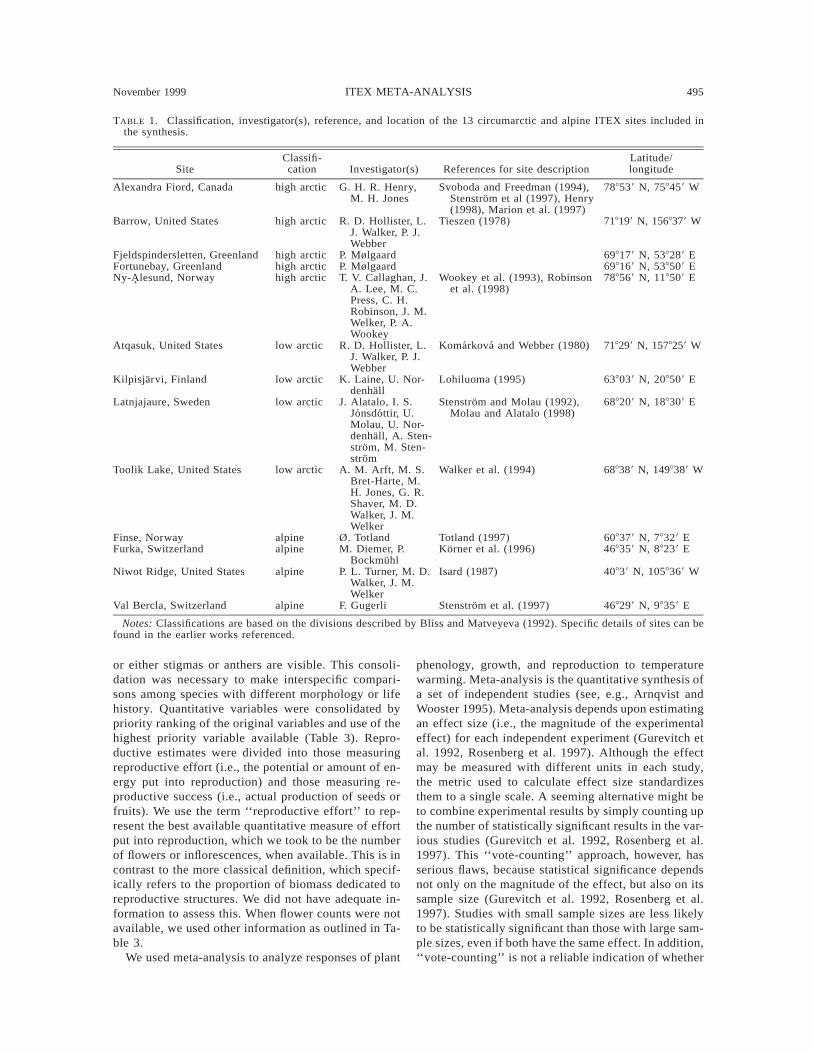
used similar methods, the timing and duration of thestudies varied, with studies beginning as early as 1989and with duration ranging from one to four years. Weassumed that experimental duration was more impor-tant than calendar year. Each site was classified as al-pine, high arctic, or low arctic, based upon the divisionsdescribed by Bliss and Matveyeva (1992). These di-visions are based upon latitude, vegetation, tempera-ture, and precipitation. The data set includes five higharctic, four low arctic, and four alpine sites (Table 1).We included a total of 61 plant species from 13 sites(Table 2). We classified each species into a broad func-tional type (woody or herbaceous) and a narrow func-tional type (deciduous shrub, evergreen shrub, forb, orgraminoid) using the functional type classificationscheme of Chapin et al. (1996).
The ITEX experiment uses open-topped chambers(OTCs) or corners (open walls at 908 angles) with trans-parent walls made from greenhouse fiber glass, plex-iglass, or polycarbonate to passively warm the localmicroenvironment (Marion 1996, Marion et al. 1993,1997). Marion et al. (1997) have conducted detailedstudies on ITEX chambers at six sites in the Arctic andAntarctic, including three sites in the present study(Alexandra Fiord, Canada; Fortunebay, Greenland; andLatnjajaure, Sweden). They found that the mean dailynear-surface air and soil temperatures increased by 1.28to 1.88C in warmed plots, whereas the effect on snowaccumulation was variable, with one site showing nodifference in snow melt date and another site at whichsnow melt occurred 1–2 wk earlier. At some sites,OTCs were removed from the plots during the wintermonths because of high winter wind velocity. Althoughthe degree of warming differed across climatic zones,particularly between arctic and alpine sites, we werenot able to adjust for these differences using ANCOVA,because the statistical theory has not been developedfor meta-analysis. Although OTCs significantly alterair temperature, unwanted side effects such as alteredlight, moisture, and/or gas exchange are minimized. Arandomized-block design with equal numbers of con-trol and experimental plots in each plant communitywas used; however, different numbers of plots wereestablished at different sites. Individual plants withineach plot were marked for quantitative growth analysis(Molau and Edlund 1996). Methods of selection variedamong studies and included an array of approachesincluding random, systematic, or all-plants approaches.Phenology was recorded from the same individuals orwas based on individuals within the entire plot (Molauand Edlund 1996).
Standard ITEX plant response variables, both veg-etative and reproductive, are grouped in two main cat-egories, phenological and quantitative (Molau andMøgaard 1996). Many of the studies used in the syn-thesis included more than one measure of vegetativegrowth or reproduction. To eliminate redundancies inthe data set and to be able to compare among different
494 A. M. ARFT ET AL. Ecological MonographsVol. 69, No. 4
FIG. 1. The ITEX network of sites. Sites included in the meta-analysis are shown with black circles.
species, we consolidated the original variables intothree phenological (leaf bud burst, anthesis, and se-nescence) and three quantitative variables (vegetativegrowth, reproductive effort, and reproductive success;Table 3). Not all of the variables listed in Table 3 were
measured in all plants or at all sites. For each individualstudy, the original phenology variables were consoli-dated by using the earliest of the original variablesavailable. For example, anthesis date is considered tobe the first date on which glumes or flowers are open,
November 1999 495ITEX META-ANALYSIS
TABLE 1. Classification, investigator(s), reference, and location of the 13 circumarctic and alpine ITEX sites included inthe synthesis.
SiteClassifi-cation Investigator(s) References for site description
Latitude/longitude
Alexandra Fiord, Canada high arctic G. H. R. Henry,M. H. Jones
Svoboda and Freedman (1994),Stenstrom et al (1997), Henry(1998), Marion et al. (1997)
788539 N, 758459 W
Barrow, United States high arctic R. D. Hollister, L.J. Walker, P. J.Webber
Tieszen (1978) 718199 N, 1568379 W
Fjeldspindersletten, Greenland high arctic P. Mølgaard 698179 N, 538289 EFortunebay, Greenland high arctic P. Mølgaard 698169 N, 538509 ENy-Alesund, Norway high arctic T. V. Callaghan, J.
A. Lee, M. C.Press, C. H.Robinson, J. M.Welker, P. A.Wookey
Wookey et al. (1993), Robinsonet al. (1998)
788569 N, 118509 E
Atqasuk, United States low arctic R. D. Hollister, L.J. Walker, P. J.Webber
Komarkova and Webber (1980) 718299 N, 1578259 W
Kilpisjarvi, Finland low arctic K. Laine, U. Nor-denhall
Lohiluoma (1995) 638039 N, 208509 E
Latnjajaure, Sweden low arctic J. Alatalo, I. S.Jonsdottir, U.Molau, U. Nor-denhall, A. Sten-strom, M. Sten-strom
Stenstrom and Molau (1992),Molau and Alatalo (1998)
688209 N, 188309 E
Toolik Lake, United States low arctic A. M. Arft, M. S.Bret-Harte, M.H. Jones, G. R.Shaver, M. D.Walker, J. M.Welker
Walker et al. (1994) 688389 N, 1498389 W
Finse, Norway alpine Ø. Totland Totland (1997) 608379 N, 78329 EFurka, Switzerland alpine M. Diemer, P.
BockmuhlKorner et al. (1996) 468359 N, 88239 E
Niwot Ridge, United States alpine P. L. Turner, M. D.Walker, J. M.Welker
Isard (1987) 40839 N, 1058369 W
Val Bercla, Switzerland alpine F. Gugerli Stenstrom et al. (1997) 468299 N, 98359 E
Notes: Classifications are based on the divisions described by Bliss and Matveyeva (1992). Specific details of sites can befound in the earlier works referenced.
or either stigmas or anthers are visible. This consoli-dation was necessary to make interspecific compari-sons among species with different morphology or lifehistory. Quantitative variables were consolidated bypriority ranking of the original variables and use of thehighest priority variable available (Table 3). Repro-ductive estimates were divided into those measuringreproductive effort (i.e., the potential or amount of en-ergy put into reproduction) and those measuring re-productive success (i.e., actual production of seeds orfruits). We use the term ‘‘reproductive effort’’ to rep-resent the best available quantitative measure of effortput into reproduction, which we took to be the numberof flowers or inflorescences, when available. This is incontrast to the more classical definition, which specif-ically refers to the proportion of biomass dedicated toreproductive structures. We did not have adequate in-formation to assess this. When flower counts were notavailable, we used other information as outlined in Ta-ble 3.
We used meta-analysis to analyze responses of plant
phenology, growth, and reproduction to temperaturewarming. Meta-analysis is the quantitative synthesis ofa set of independent studies (see, e.g., Arnqvist andWooster 1995). Meta-analysis depends upon estimatingan effect size (i.e., the magnitude of the experimentaleffect) for each independent experiment (Gurevitch etal. 1992, Rosenberg et al. 1997). Although the effectmay be measured with different units in each study,the metric used to calculate effect size standardizesthem to a single scale. A seeming alternative might beto combine experimental results by simply counting upthe number of statistically significant results in the var-ious studies (Gurevitch et al. 1992, Rosenberg et al.1997). This ‘‘vote-counting’’ approach, however, hasserious flaws, because statistical significance dependsnot only on the magnitude of the effect, but also on itssample size (Gurevitch et al. 1992, Rosenberg et al.1997). Studies with small sample sizes are less likelyto be statistically significant than those with large sam-ple sizes, even if both have the same effect. In addition,‘‘vote-counting’’ is not a reliable indication of whether
496 A. M. ARFT ET AL. Ecological MonographsVol. 69, No. 4
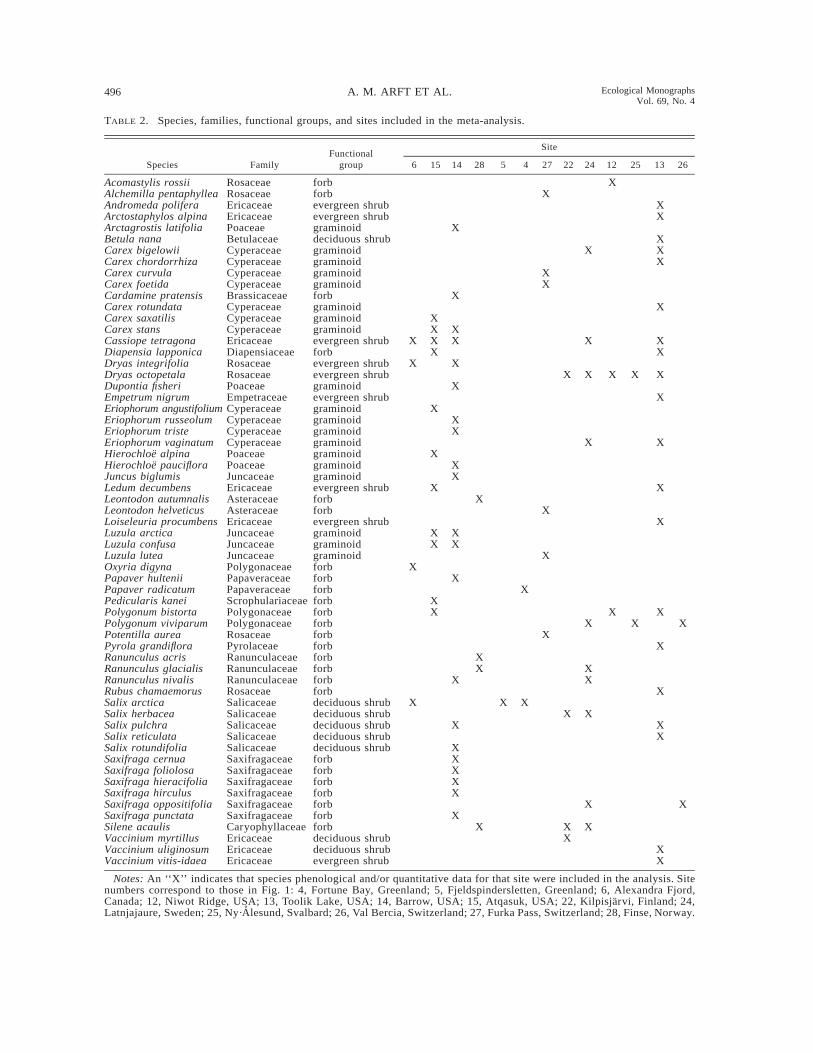
TABLE 2. Species, families, functional groups, and sites included in the meta-analysis.
Species FamilyFunctional
group
Site
6 15 14 28 5 4 27 22 24 12 25 13 26
Acomastylis rossiiAlchemilla pentaphylleaAndromeda poliferaArctostaphylos alpinaArctagrostis latifoliaBetula nanaCarex bigelowiiCarex chordorrhizaCarex curvulaCarex foetidaCardamine pratensis
RosaceaeRosaceaeEricaceaeEricaceaePoaceaeBetulaceaeCyperaceaeCyperaceaeCyperaceaeCyperaceaeBrassicaceae
forbforbevergreen shrubevergreen shrubgraminoiddeciduous shrubgraminoidgraminoidgraminoidgraminoidforb
X
X
X
XX
X
X
XX
XXX
Carex rotundataCarex saxatilisCarex stansCassiope tetragonaDiapensia lapponicaDryas integrifoliaDryas octopetalaDupontia fisheriEmpetrum nigrumEriophorum angustifoliumEriophorum russeolumEriophorum triste
CyperaceaeCyperaceaeCyperaceaeEricaceaeDiapensiaceaeRosaceaeRosaceaePoaceaeEmpetraceaeCyperaceaeCyperaceaeCyperaceae
graminoidgraminoidgraminoidevergreen shrubforbevergreen shrubevergreen shrubgraminoidevergreen shrubgraminoidgraminoidgraminoid
X
X
XXXX
X
XX
X
X
XX
X
X
X X X
X
XX
X
X
Eriophorum vaginatumHierochloe alpinaHierochloe paucifloraJuncus biglumisLedum decumbensLeontodon autumnalisLeontodon helveticusLoiseleuria procumbensLuzula arcticaLuzula confusaLuzula lutea
CyperaceaePoaceaePoaceaeJuncaceaeEricaceaeAsteraceaeAsteraceaeEricaceaeJuncaceaeJuncaceaeJuncaceae
graminoidgraminoidgraminoidgraminoidevergreen shrubforbforbevergreen shrubgraminoidgraminoidgraminoid
X
X
XX
XX
XX
XX
X
X X
X
X
Oxyria digynaPapaver hulteniiPapaver radicatumPedicularis kaneiPolygonum bistortaPolygonum viviparumPotentilla aureaPyrola grandifloraRanunculus acrisRanunculus glacialisRanunculus nivalisRubus chamaemorus
PolygonaceaePapaveraceaePapaveraceaeScrophulariaceaePolygonaceaePolygonaceaeRosaceaePyrolaceaeRanunculaceaeRanunculaceaeRanunculaceaeRosaceae
forbforbforbforbforbforbforbforbforbforbforbforb
X
XX
X
X
XX
X
XX
XX
XX
X
X
X
X
Salix arcticaSalix herbaceaSalix pulchraSalix reticulataSalix rotundifoliaSaxifraga cernuaSaxifraga foliolosaSaxifraga hieracifoliaSaxifraga hirculusSaxifraga oppositifoliaSaxifraga punctata
SalicaceaeSalicaceaeSalicaceaeSalicaceaeSalicaceaeSaxifragaceaeSaxifragaceaeSaxifragaceaeSaxifragaceaeSaxifragaceaeSaxifragaceae
deciduous shrubdeciduous shrubdeciduous shrubdeciduous shrubdeciduous shrubforbforbforbforbforbforb
X
X
XXXXX
X
X XX X
X
XX
X
Silene acaulisVaccinium myrtillusVaccinium uliginosumVaccinium vitis-idaea
CaryophyllaceaeEricaceaeEricaceaeEricaceae
forbdeciduous shrubdeciduous shrubevergreen shrub
X XX
X
XX
Notes: An ‘‘X’’ indicates that species phenological and/or quantitative data for that site were included in the analysis. Sitenumbers correspond to those in Fig. 1: 4, Fortune Bay, Greenland; 5, Fjeldspindersletten, Greenland; 6, Alexandra Fjord,Canada; 12, Niwot Ridge, USA; 13, Toolik Lake, USA; 14, Barrow, USA; 15, Atqasuk, USA; 22, Kilpisjarvi, Finland; 24,Latnjajaure, Sweden; 25, Ny·Alesund, Svalbard; 26, Val Bercia, Switzerland; 27, Furka Pass, Switzerland; 28, Finse, Norway.
November 1999 497ITEX META-ANALYSIS
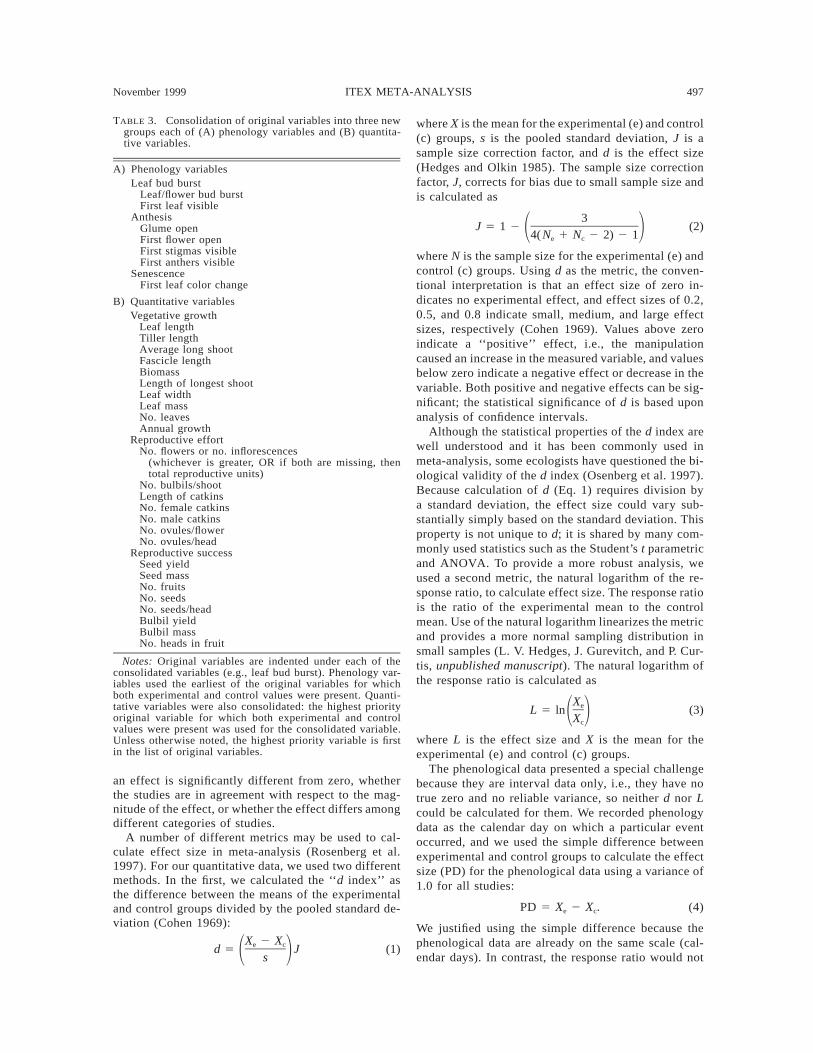
TABLE 3. Consolidation of original variables into three newgroups each of (A) phenology variables and (B) quantita-tive variables.
A) Phenology variablesLeaf bud burst
Leaf/flower bud burstFirst leaf visible
AnthesisGlume openFirst flower openFirst stigmas visibleFirst anthers visible
SenescenceFirst leaf color change
B) Quantitative variablesVegetative growth
Leaf lengthTiller lengthAverage long shootFascicle lengthBiomassLength of longest shootLeaf widthLeaf massNo. leavesAnnual growth
Reproductive effortNo. flowers or no. inflorescences
(whichever is greater, OR if both are missing, thentotal reproductive units)
No. bulbils/shootLength of catkinsNo. female catkinsNo. male catkinsNo. ovules/flowerNo. ovules/head
Reproductive successSeed yieldSeed massNo. fruitsNo. seedsNo. seeds/headBulbil yieldBulbil massNo. heads in fruit
Notes: Original variables are indented under each of theconsolidated variables (e.g., leaf bud burst). Phenology var-iables used the earliest of the original variables for whichboth experimental and control values were present. Quanti-tative variables were also consolidated: the highest priorityoriginal variable for which both experimental and controlvalues were present was used for the consolidated variable.Unless otherwise noted, the highest priority variable is firstin the list of original variables.
an effect is significantly different from zero, whetherthe studies are in agreement with respect to the mag-nitude of the effect, or whether the effect differs amongdifferent categories of studies.
A number of different metrics may be used to cal-culate effect size in meta-analysis (Rosenberg et al.1997). For our quantitative data, we used two differentmethods. In the first, we calculated the ‘‘d index’’ asthe difference between the means of the experimentaland control groups divided by the pooled standard de-viation (Cohen 1969):
X 2 Xe cd 5 J (1)1 2s
where X is the mean for the experimental (e) and control(c) groups, s is the pooled standard deviation, J is asample size correction factor, and d is the effect size(Hedges and Olkin 1985). The sample size correctionfactor, J, corrects for bias due to small sample size andis calculated as
3J 5 1 2 (2)1 24(N 1 N 2 2) 2 1e c
where N is the sample size for the experimental (e) andcontrol (c) groups. Using d as the metric, the conven-tional interpretation is that an effect size of zero in-dicates no experimental effect, and effect sizes of 0.2,0.5, and 0.8 indicate small, medium, and large effectsizes, respectively (Cohen 1969). Values above zeroindicate a ‘‘positive’’ effect, i.e., the manipulationcaused an increase in the measured variable, and valuesbelow zero indicate a negative effect or decrease in thevariable. Both positive and negative effects can be sig-nificant; the statistical significance of d is based uponanalysis of confidence intervals.
Although the statistical properties of the d index arewell understood and it has been commonly used inmeta-analysis, some ecologists have questioned the bi-ological validity of the d index (Osenberg et al. 1997).Because calculation of d (Eq. 1) requires division bya standard deviation, the effect size could vary sub-stantially simply based on the standard deviation. Thisproperty is not unique to d; it is shared by many com-monly used statistics such as the Student’s t parametricand ANOVA. To provide a more robust analysis, weused a second metric, the natural logarithm of the re-sponse ratio, to calculate effect size. The response ratiois the ratio of the experimental mean to the controlmean. Use of the natural logarithm linearizes the metricand provides a more normal sampling distribution insmall samples (L. V. Hedges, J. Gurevitch, and P. Cur-tis, unpublished manuscript). The natural logarithm ofthe response ratio is calculated as
XeL 5 ln (3)1 2Xc
where L is the effect size and X is the mean for theexperimental (e) and control (c) groups.
The phenological data presented a special challengebecause they are interval data only, i.e., they have notrue zero and no reliable variance, so neither d nor Lcould be calculated for them. We recorded phenologydata as the calendar day on which a particular eventoccurred, and we used the simple difference betweenexperimental and control groups to calculate the effectsize (PD) for the phenological data using a variance of1.0 for all studies:
PD 5 Xe 2 Xc. (4)
We justified using the simple difference because thephenological data are already on the same scale (cal-endar days). In contrast, the response ratio would not

498 A. M. ARFT ET AL. Ecological MonographsVol. 69, No. 4
TABLE 4. Total number of studies (with number of sites in parentheses) included in each meta-analysis and within eachcategory.
Variables† Treatment year 1 Treatment year 2 Treatment year 3 Treatment year 4
Vegetative growthTotalHA, LA, ALW, HDS, ES, F, G
28 (6)14 (2), 6 (2), 8 (2)6 (4), 22 (6)0, 5 (4), 12 (5), 10 (3)
30 (10)14 (3), 6 (3), 10 (4)5 (4), 25 (9)0, 4 (3), 15 (8), 10 (4)
27 (9)11 (4), 14 (3), 2 (2)16 (7), 11 (7)5 (3), 11 (6), 6 (5), 5 (3)
9 (3)7 (2), 2 (1), 05 (2), 4 (3)3 (2), 2 (1), 4 (3)
Reproductive effortTotalHA, LA, ALW, HDS, ES, F, G
17 (6)8 (2), 6 (2), 3 (2)6 (4), 11 (6)0, 5 (4), 8 (5), 3 (2)
17 (6)7 (3), 6 (1), 4 (2)5 (3), 12 (5)0, 4 (4), 10 (5), 2 (2)
20 (7)6 (4), 12 (2), 2 (1)13 (5), 7 (3)3 (2), 10 (5), 6 (3), 0
5 (2)4 (1), 0, 04 (1), 02 (1), 2 (1), 0, 0
Reproductive successTotal 18 (8) 17 (7) 20 (9) 4 (3)HA, LA, ALW, HDS, ES, F, G
0, 7 (2), 10 (4)5 (4), 13 (4)2 (2), 3 (3), 11 (6), 2 (2)
0, 10 (2), 6 (4)5 (3), 12 (6)2 (2), 3 (3), 11 (6), 0
3 (3), 13 (3), 4 (3)12 (7), 8 (4)0, 11 (7), 7 (4), 0
2 (1), 0, 03 (2), 00, 3 (2), 0, 0
Leaf bud burstTotalHA, LA, ALW, HDS, ES, F, G
28 (6)23 (3), 4 (2), 08 (4), 20 (3)5 (3), 3 (2), 10 (3), 10 (1)
38 (7)23 (2), 12 (3), 3 (2)15 (5), 23 (5)9 (4), 6 (3), 13 (5), 10 (1)
15 (5)8 (2), 7 (3), 06 (3), 9 (3)3 (2), 3 (2), 6 (3), 3 (1)
8 (3)5 (1), 3 (2), 06 (3), 2 (2)3 (2), 3 (2), 2 (2), 0
AnthesisTotalHA, LA, ALW, H
34 (8)18 (3), 9 (2), 7 (3)8 (5), 26 (5)
49 (10)21 (3), 20 (3), 8 (4)16 (6), 33 (6)
37 (8)8 (3), 27 (3), 8 (2)20 (5), 17 (6)
10 (3)4 (1), 6 (2), 07 (3), 3 (1)
DS, ES, F, G 2 (2), 6 (4), 13 (5), 13 (3)5 (3), 11 (6), 18 (6), 15(2)
5 (3), 15 (5), 10 (6), 7(3) 3 (2), 4 (2), 2 (1), 0
SenescenceTotalHA, LA, ALW, HDS, ES, F, G
11 (4)2 (1), 4 (2), 5 (1)6 (2), 5 (3)4 (2), 2 (1), 2 (2), 3 (3)
16 (6)4 (1), 7 (3), 5 (2)6 (3), 10 (4)4 (3), 2 (2), 7 (3), 3 (2)
29 (3)0, 29 (3), 020 (3), 9 (2)7 (3), 13 (2), 5 (2), 4 (1)
2 (1)0, 2 (1), 00, 00, 0, 0, 0
Note: Categories with only one study were not included in the analysis.† Abbreviations: HA, high arctic; LA, low arctic; AL, alpine; W, woody forms; H, herbaceous forms; DS, deciduous shrubs;
ES, evergreen shrubs; F, forbs; G, graminoids.
be a good phenological metric, because it would changebased on when the event occurred during the season(e.g., if the mean between experimental and controlgroups differed by 5, the response ratio might be (135/140) at the beginning of the season and (205/210) laterin the season. Note that Eq. 1 collapses down to Eq. 4if s and J are set equal to 1.
The initial four years of data from 13 circumarcticand alpine ITEX sites were analyzed using SAS andMetawin 1.0, a statistical software program for meta-analysis (Rosenberg et al. 1997). Data were analyzedusing treatment years (i.e., the year since initiation ofexperimental manipulation) and not calendar years.The total number of studies included in each meta-analysis is shown in Table 4. We chose to analyze eachyear separately, even though by doing so we may havecreated a problem of non-independence. We felt thatthe alternative of using a single year or only studieswith four full years of data resulted in the loss of toomuch data.
Means and confidence intervals for the average ef-fects of warming on various groups of studies wereestimated using a mixed model and standard, weighted
meta-analytic parametric methods for the d index andnatural logarithm response ratio (Hedges and Olkin1985; Hedges and Olkin, in press, Gurevitch and Hedg-es 1999). Effect sizes were weighted by the inverse ofthe estimated sampling variance, as is conventional.For the phenological analyses, we used an unweightedmixed model (i.e., all weights 5 1) and bias-correctedbootstrapping to calculate means and confidence in-tervals, because parametric weights have not been de-fined for this measure (Adams et al. 1997).
The homogeneity statistic, Q, was used to test wheth-er the various effect sizes within and among spatial,temporal, and functional groups differ only by sam-pling error, vs. the alternative hypothesis that there aretrue differences in effect among studies (Hedges andOlkin 1985, Gurevitch et al. 1992, Rosenberg et al.1997). The total homogeneity can be partitioned intowithin-class homogeneity, Qw, a measure of the vari-ability among individual studies within a particularclass, and between-class homogeneity, Qb, a measureof the variability among classes of studies in the anal-ysis. We used parametric, weighted homogeneity testsfor variables measured using the d index and natural
November 1999 499ITEX META-ANALYSIS
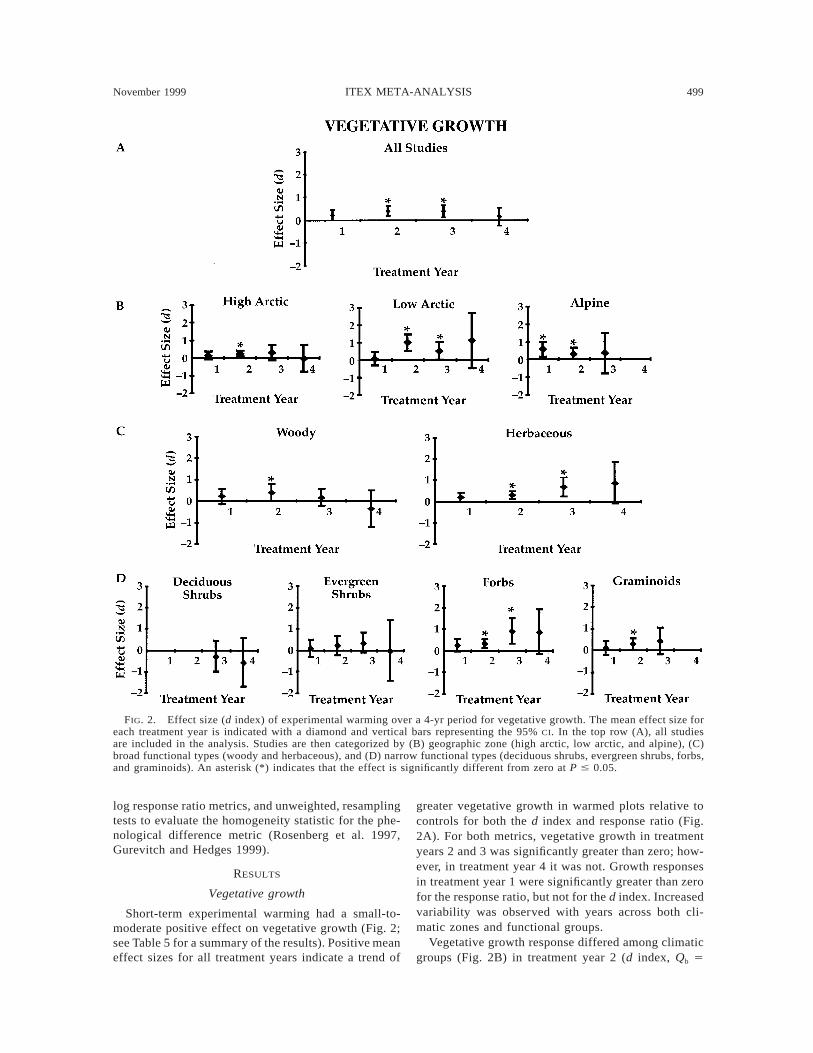
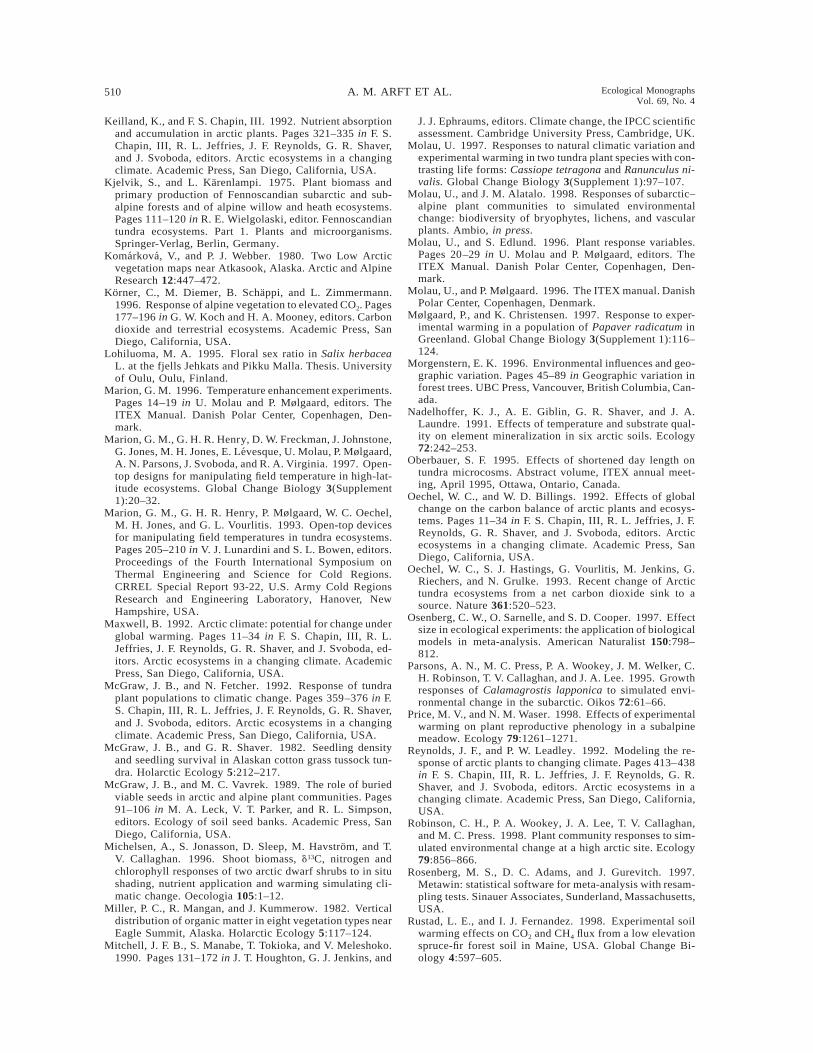
FIG. 2. Effect size (d index) of experimental warming over a 4-yr period for vegetative growth. The mean effect size foreach treatment year is indicated with a diamond and vertical bars representing the 95% CI. In the top row (A), all studiesare included in the analysis. Studies are then categorized by (B) geographic zone (high arctic, low arctic, and alpine), (C)broad functional types (woody and herbaceous), and (D) narrow functional types (deciduous shrubs, evergreen shrubs, forbs,and graminoids). An asterisk (*) indicates that the effect is significantly different from zero at P # 0.05.
log response ratio metrics, and unweighted, resamplingtests to evaluate the homogeneity statistic for the phe-nological difference metric (Rosenberg et al. 1997,Gurevitch and Hedges 1999).
RESULTS
Vegetative growth
Short-term experimental warming had a small-to-moderate positive effect on vegetative growth (Fig. 2;see Table 5 for a summary of the results). Positive meaneffect sizes for all treatment years indicate a trend of
greater vegetative growth in warmed plots relative tocontrols for both the d index and response ratio (Fig.2A). For both metrics, vegetative growth in treatmentyears 2 and 3 was significantly greater than zero; how-ever, in treatment year 4 it was not. Growth responsesin treatment year 1 were significantly greater than zerofor the response ratio, but not for the d index. Increasedvariability was observed with years across both cli-matic zones and functional groups.
Vegetative growth response differed among climaticgroups (Fig. 2B) in treatment year 2 (d index, Qb 5
500 A. M. ARFT ET AL. Ecological MonographsVol. 69, No. 4
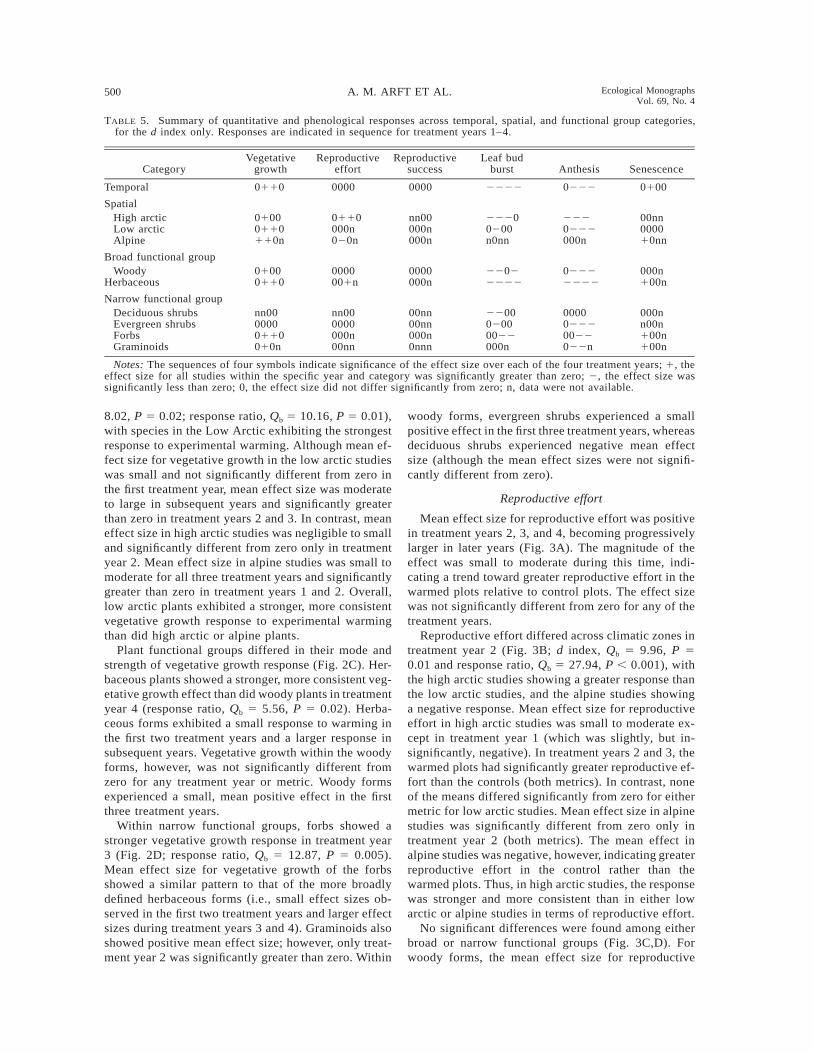
TABLE 5. Summary of quantitative and phenological responses across temporal, spatial, and functional group categories,for the d index only. Responses are indicated in sequence for treatment years 1–4.
CategoryVegetative
growthReproductive
effortReproductive
successLeaf bud
burst Anthesis Senescence
Temporal 0110 0000 0000 2222 0222 0100
SpatialHigh arcticLow arcticAlpine
01000110110n
0110000n020n
nn00000n000n
22200200n0nn
2220222000n
00nn000010nn
Broad functional groupWoody 0100 0000 0000 2202 0222 000n
Herbaceous 0110 001n 000n 2222 2222 100n
Narrow functional groupDeciduous shrubsEvergreen shrubsForbsGraminoids
nn0000000110010n
nn000000000n00nn
00nn00nn000n0nnn
220002000022000n
000002220022022n
000nn00n100n100n
Notes: The sequences of four symbols indicate significance of the effect size over each of the four treatment years; 1, theeffect size for all studies within the specific year and category was significantly greater than zero; 2, the effect size wassignificantly less than zero; 0, the effect size did not differ significantly from zero; n, data were not available.
8.02, P 5 0.02; response ratio, Qb 5 10.16, P 5 0.01),with species in the Low Arctic exhibiting the strongestresponse to experimental warming. Although mean ef-fect size for vegetative growth in the low arctic studieswas small and not significantly different from zero inthe first treatment year, mean effect size was moderateto large in subsequent years and significantly greaterthan zero in treatment years 2 and 3. In contrast, meaneffect size in high arctic studies was negligible to smalland significantly different from zero only in treatmentyear 2. Mean effect size in alpine studies was small tomoderate for all three treatment years and significantlygreater than zero in treatment years 1 and 2. Overall,low arctic plants exhibited a stronger, more consistentvegetative growth response to experimental warmingthan did high arctic or alpine plants.
Plant functional groups differed in their mode andstrength of vegetative growth response (Fig. 2C). Her-baceous plants showed a stronger, more consistent veg-etative growth effect than did woody plants in treatmentyear 4 (response ratio, Qb 5 5.56, P 5 0.02). Herba-ceous forms exhibited a small response to warming inthe first two treatment years and a larger response insubsequent years. Vegetative growth within the woodyforms, however, was not significantly different fromzero for any treatment year or metric. Woody formsexperienced a small, mean positive effect in the firstthree treatment years.
Within narrow functional groups, forbs showed astronger vegetative growth response in treatment year3 (Fig. 2D; response ratio, Qb 5 12.87, P 5 0.005).Mean effect size for vegetative growth of the forbsshowed a similar pattern to that of the more broadlydefined herbaceous forms (i.e., small effect sizes ob-served in the first two treatment years and larger effectsizes during treatment years 3 and 4). Graminoids alsoshowed positive mean effect size; however, only treat-ment year 2 was significantly greater than zero. Within
woody forms, evergreen shrubs experienced a smallpositive effect in the first three treatment years, whereasdeciduous shrubs experienced negative mean effectsize (although the mean effect sizes were not signifi-cantly different from zero).
Reproductive effort
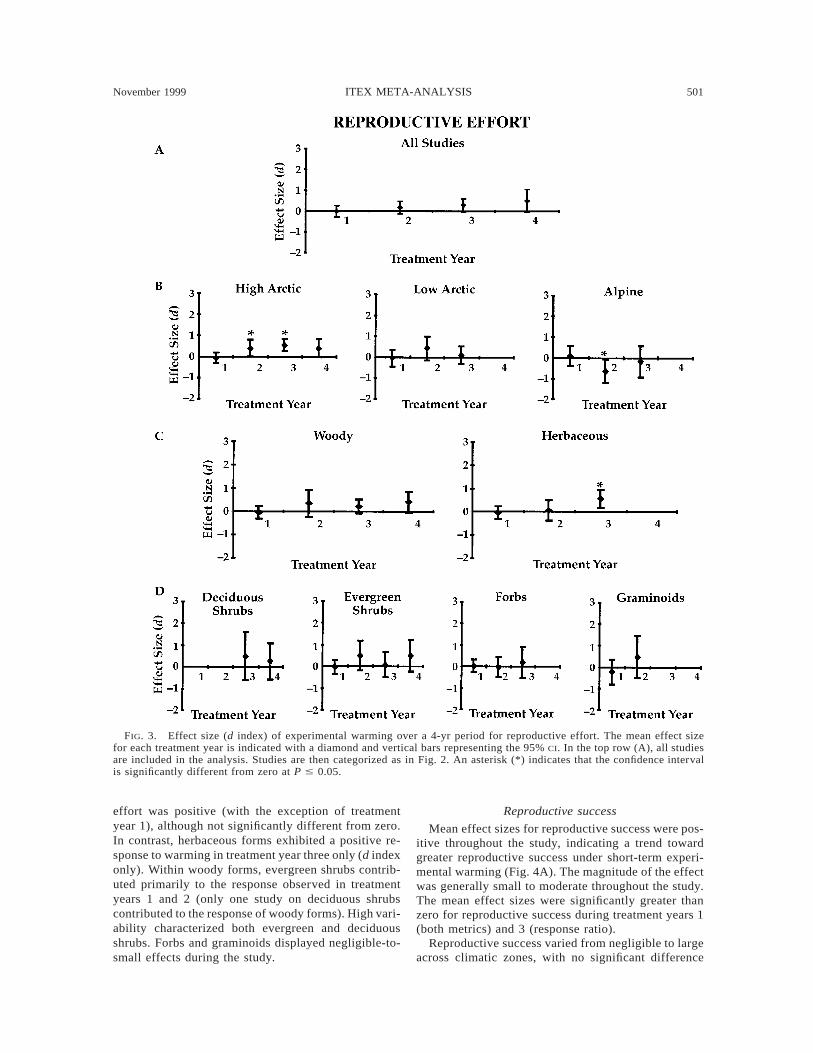
Mean effect size for reproductive effort was positivein treatment years 2, 3, and 4, becoming progressivelylarger in later years (Fig. 3A). The magnitude of theeffect was small to moderate during this time, indi-cating a trend toward greater reproductive effort in thewarmed plots relative to control plots. The effect sizewas not significantly different from zero for any of thetreatment years.
Reproductive effort differed across climatic zones intreatment year 2 (Fig. 3B; d index, Qb 5 9.96, P 50.01 and response ratio, Qb 5 27.94, P , 0.001), withthe high arctic studies showing a greater response thanthe low arctic studies, and the alpine studies showinga negative response. Mean effect size for reproductiveeffort in high arctic studies was small to moderate ex-cept in treatment year 1 (which was slightly, but in-significantly, negative). In treatment years 2 and 3, thewarmed plots had significantly greater reproductive ef-fort than the controls (both metrics). In contrast, noneof the means differed significantly from zero for eithermetric for low arctic studies. Mean effect size in alpinestudies was significantly different from zero only intreatment year 2 (both metrics). The mean effect inalpine studies was negative, however, indicating greaterreproductive effort in the control rather than thewarmed plots. Thus, in high arctic studies, the responsewas stronger and more consistent than in either lowarctic or alpine studies in terms of reproductive effort.
No significant differences were found among eitherbroad or narrow functional groups (Fig. 3C,D). Forwoody forms, the mean effect size for reproductive
November 1999 501ITEX META-ANALYSIS
FIG. 3. Effect size (d index) of experimental warming over a 4-yr period for reproductive effort. The mean effect sizefor each treatment year is indicated with a diamond and vertical bars representing the 95% CI. In the top row (A), all studiesare included in the analysis. Studies are then categorized as in Fig. 2. An asterisk (*) indicates that the confidence intervalis significantly different from zero at P # 0.05.
effort was positive (with the exception of treatmentyear 1), although not significantly different from zero.In contrast, herbaceous forms exhibited a positive re-sponse to warming in treatment year three only (d indexonly). Within woody forms, evergreen shrubs contrib-uted primarily to the response observed in treatmentyears 1 and 2 (only one study on deciduous shrubscontributed to the response of woody forms). High vari-ability characterized both evergreen and deciduousshrubs. Forbs and graminoids displayed negligible-to-small effects during the study.
Reproductive success
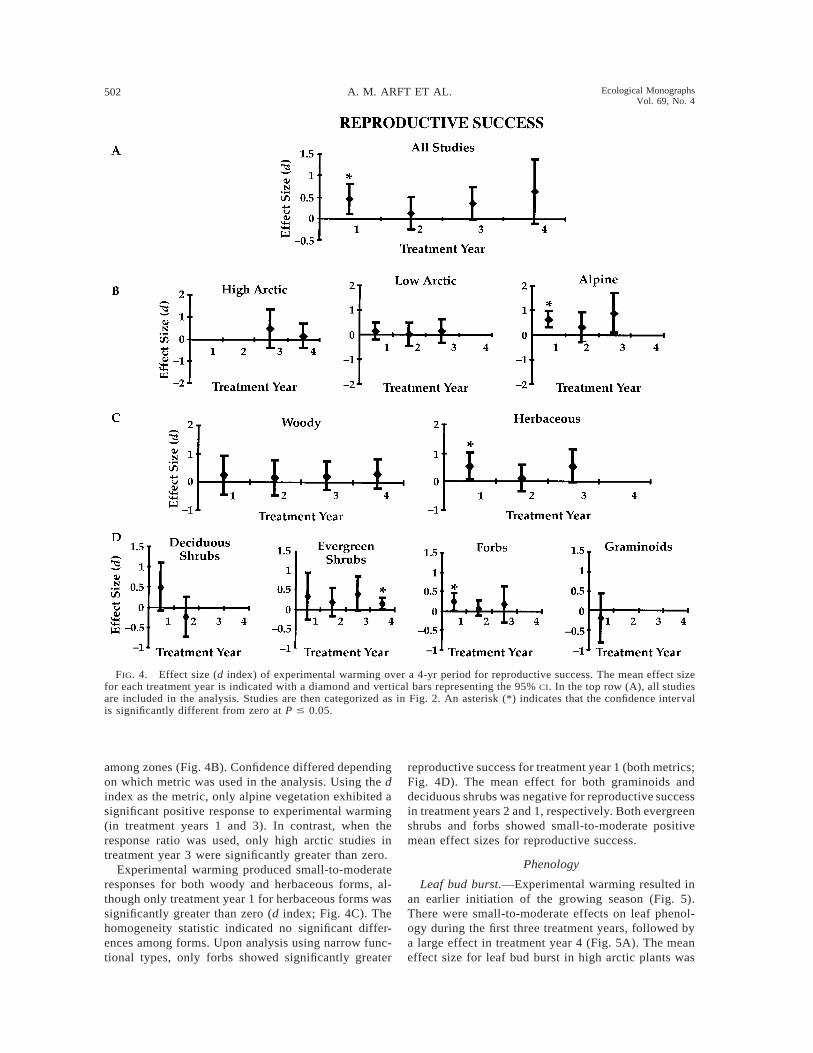
Mean effect sizes for reproductive success were pos-itive throughout the study, indicating a trend towardgreater reproductive success under short-term experi-mental warming (Fig. 4A). The magnitude of the effectwas generally small to moderate throughout the study.The mean effect sizes were significantly greater thanzero for reproductive success during treatment years 1(both metrics) and 3 (response ratio).
Reproductive success varied from negligible to largeacross climatic zones, with no significant difference
502 A. M. ARFT ET AL. Ecological MonographsVol. 69, No. 4
FIG. 4. Effect size (d index) of experimental warming over a 4-yr period for reproductive success. The mean effect sizefor each treatment year is indicated with a diamond and vertical bars representing the 95% CI. In the top row (A), all studiesare included in the analysis. Studies are then categorized as in Fig. 2. An asterisk (*) indicates that the confidence intervalis significantly different from zero at P # 0.05.
among zones (Fig. 4B). Confidence differed dependingon which metric was used in the analysis. Using the dindex as the metric, only alpine vegetation exhibited asignificant positive response to experimental warming(in treatment years 1 and 3). In contrast, when theresponse ratio was used, only high arctic studies intreatment year 3 were significantly greater than zero.
Experimental warming produced small-to-moderateresponses for both woody and herbaceous forms, al-though only treatment year 1 for herbaceous forms wassignificantly greater than zero (d index; Fig. 4C). Thehomogeneity statistic indicated no significant differ-ences among forms. Upon analysis using narrow func-tional types, only forbs showed significantly greater
reproductive success for treatment year 1 (both metrics;Fig. 4D). The mean effect for both graminoids anddeciduous shrubs was negative for reproductive successin treatment years 2 and 1, respectively. Both evergreenshrubs and forbs showed small-to-moderate positivemean effect sizes for reproductive success.
Phenology
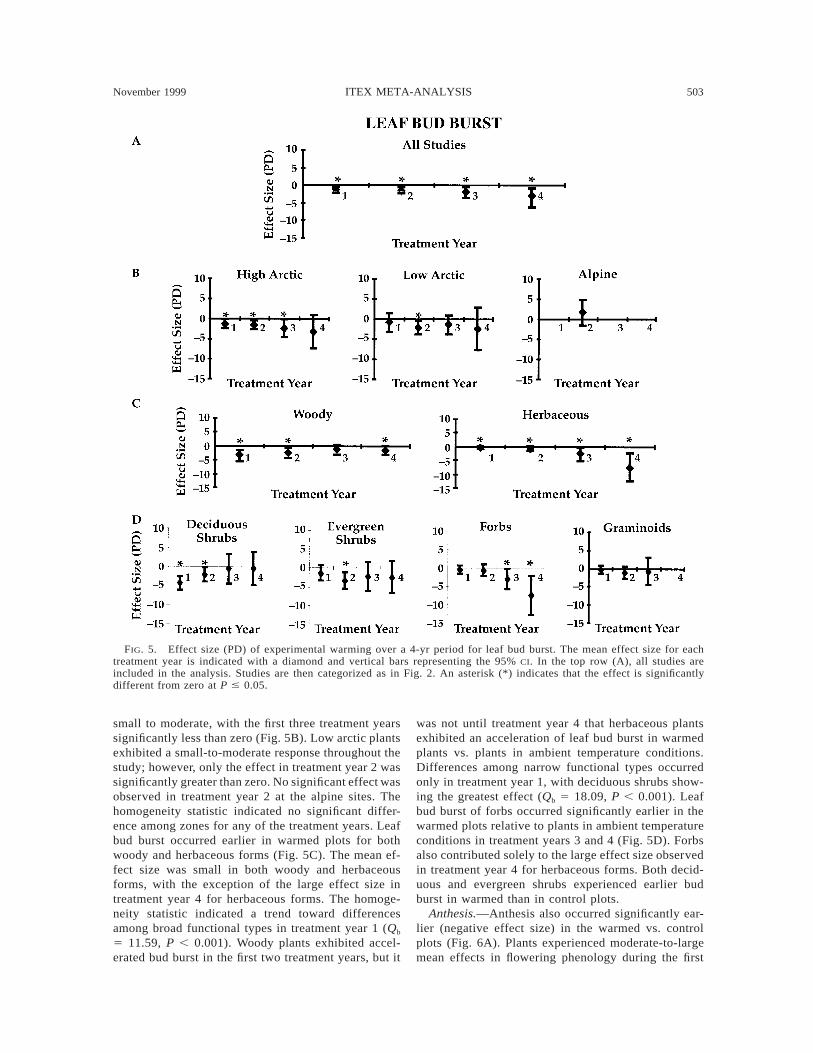
Leaf bud burst.—Experimental warming resulted inan earlier initiation of the growing season (Fig. 5).There were small-to-moderate effects on leaf phenol-ogy during the first three treatment years, followed bya large effect in treatment year 4 (Fig. 5A). The meaneffect size for leaf bud burst in high arctic plants was
November 1999 503ITEX META-ANALYSIS
FIG. 5. Effect size (PD) of experimental warming over a 4-yr period for leaf bud burst. The mean effect size for eachtreatment year is indicated with a diamond and vertical bars representing the 95% CI. In the top row (A), all studies areincluded in the analysis. Studies are then categorized as in Fig. 2. An asterisk (*) indicates that the effect is significantlydifferent from zero at P # 0.05.
small to moderate, with the first three treatment yearssignificantly less than zero (Fig. 5B). Low arctic plantsexhibited a small-to-moderate response throughout thestudy; however, only the effect in treatment year 2 wassignificantly greater than zero. No significant effect wasobserved in treatment year 2 at the alpine sites. Thehomogeneity statistic indicated no significant differ-ence among zones for any of the treatment years. Leafbud burst occurred earlier in warmed plots for bothwoody and herbaceous forms (Fig. 5C). The mean ef-fect size was small in both woody and herbaceousforms, with the exception of the large effect size intreatment year 4 for herbaceous forms. The homoge-neity statistic indicated a trend toward differencesamong broad functional types in treatment year 1 (Qb
5 11.59, P , 0.001). Woody plants exhibited accel-erated bud burst in the first two treatment years, but it
was not until treatment year 4 that herbaceous plantsexhibited an acceleration of leaf bud burst in warmedplants vs. plants in ambient temperature conditions.Differences among narrow functional types occurredonly in treatment year 1, with deciduous shrubs show-ing the greatest effect (Qb 5 18.09, P , 0.001). Leafbud burst of forbs occurred significantly earlier in thewarmed plots relative to plants in ambient temperatureconditions in treatment years 3 and 4 (Fig. 5D). Forbsalso contributed solely to the large effect size observedin treatment year 4 for herbaceous forms. Both decid-uous and evergreen shrubs experienced earlier budburst in warmed than in control plots.
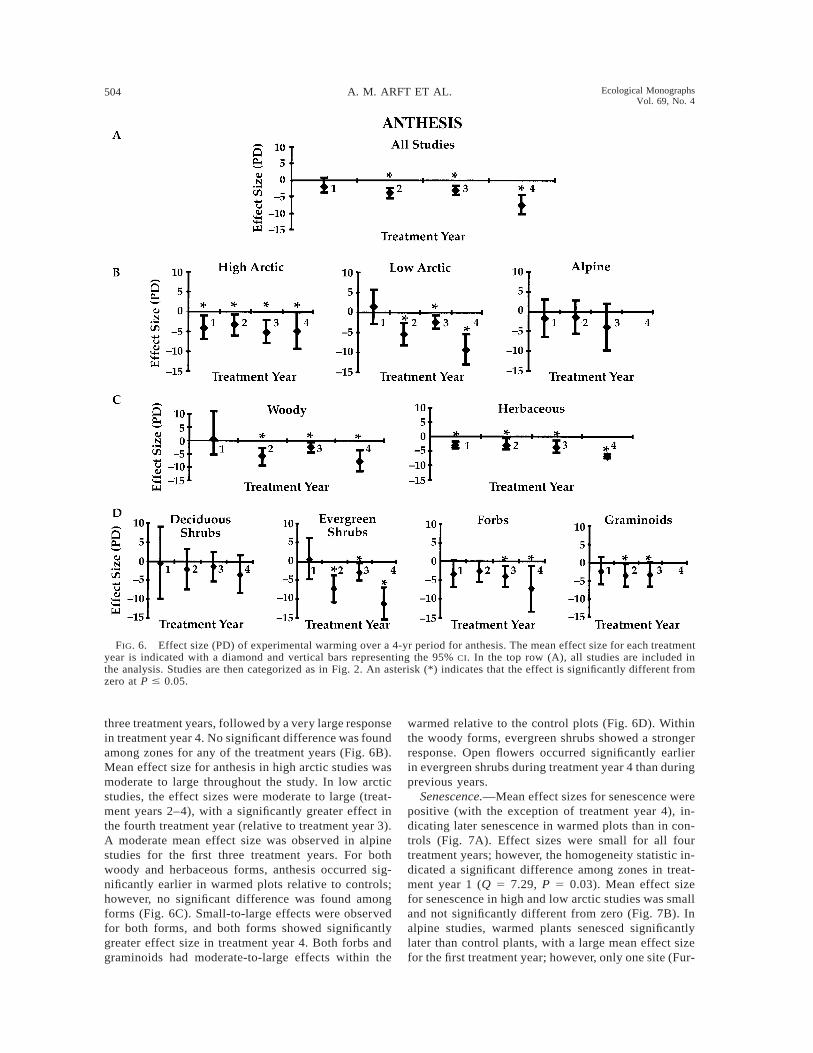
Anthesis.—Anthesis also occurred significantly ear-lier (negative effect size) in the warmed vs. controlplots (Fig. 6A). Plants experienced moderate-to-largemean effects in flowering phenology during the first
504 A. M. ARFT ET AL. Ecological MonographsVol. 69, No. 4
FIG. 6. Effect size (PD) of experimental warming over a 4-yr period for anthesis. The mean effect size for each treatmentyear is indicated with a diamond and vertical bars representing the 95% CI. In the top row (A), all studies are included inthe analysis. Studies are then categorized as in Fig. 2. An asterisk (*) indicates that the effect is significantly different fromzero at P # 0.05.
three treatment years, followed by a very large responsein treatment year 4. No significant difference was foundamong zones for any of the treatment years (Fig. 6B).Mean effect size for anthesis in high arctic studies wasmoderate to large throughout the study. In low arcticstudies, the effect sizes were moderate to large (treat-ment years 2–4), with a significantly greater effect inthe fourth treatment year (relative to treatment year 3).A moderate mean effect size was observed in alpinestudies for the first three treatment years. For bothwoody and herbaceous forms, anthesis occurred sig-nificantly earlier in warmed plots relative to controls;however, no significant difference was found amongforms (Fig. 6C). Small-to-large effects were observedfor both forms, and both forms showed significantlygreater effect size in treatment year 4. Both forbs andgraminoids had moderate-to-large effects within the
warmed relative to the control plots (Fig. 6D). Withinthe woody forms, evergreen shrubs showed a strongerresponse. Open flowers occurred significantly earlierin evergreen shrubs during treatment year 4 than duringprevious years.
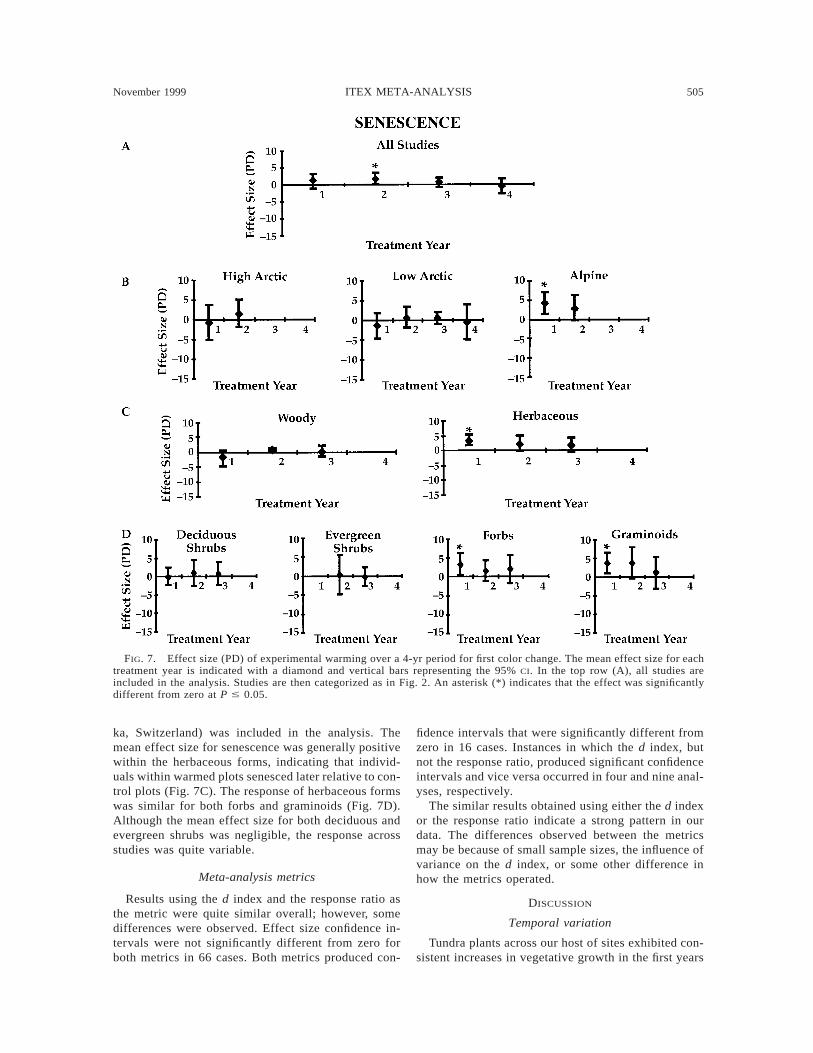
Senescence.—Mean effect sizes for senescence werepositive (with the exception of treatment year 4), in-dicating later senescence in warmed plots than in con-trols (Fig. 7A). Effect sizes were small for all fourtreatment years; however, the homogeneity statistic in-dicated a significant difference among zones in treat-ment year 1 (Q 5 7.29, P 5 0.03). Mean effect sizefor senescence in high and low arctic studies was smalland not significantly different from zero (Fig. 7B). Inalpine studies, warmed plants senesced significantlylater than control plants, with a large mean effect sizefor the first treatment year; however, only one site (Fur-
November 1999 505ITEX META-ANALYSIS
FIG. 7. Effect size (PD) of experimental warming over a 4-yr period for first color change. The mean effect size for eachtreatment year is indicated with a diamond and vertical bars representing the 95% CI. In the top row (A), all studies areincluded in the analysis. Studies are then categorized as in Fig. 2. An asterisk (*) indicates that the effect was significantlydifferent from zero at P # 0.05.
ka, Switzerland) was included in the analysis. Themean effect size for senescence was generally positivewithin the herbaceous forms, indicating that individ-uals within warmed plots senesced later relative to con-trol plots (Fig. 7C). The response of herbaceous formswas similar for both forbs and graminoids (Fig. 7D).Although the mean effect size for both deciduous andevergreen shrubs was negligible, the response acrossstudies was quite variable.
Meta-analysis metrics
Results using the d index and the response ratio asthe metric were quite similar overall; however, somedifferences were observed. Effect size confidence in-tervals were not significantly different from zero forboth metrics in 66 cases. Both metrics produced con-
fidence intervals that were significantly different fromzero in 16 cases. Instances in which the d index, butnot the response ratio, produced significant confidenceintervals and vice versa occurred in four and nine anal-yses, respectively.
The similar results obtained using either the d indexor the response ratio indicate a strong pattern in ourdata. The differences observed between the metricsmay be because of small sample sizes, the influence ofvariance on the d index, or some other difference inhow the metrics operated.
DISCUSSION
Temporal variation
Tundra plants across our host of sites exhibited con-sistent increases in vegetative growth in the first years
506 A. M. ARFT ET AL. Ecological MonographsVol. 69, No. 4
of experimental manipulation, substantiating our hy-pothesis that there would be a significant increase invegetative growth early in the experiment (see Table5). By the fourth year, however, this effect, althoughpositive, was more variable and not significantly dif-ferent from zero. Higher variability in later years maybe due to a smaller sample size and an increase invariability of individual species response with time.The initial response of tundra plants to warmer con-ditions is relatively consistent across the circumarcticand in the alpine of the northern hemisphere, whichsupports the more site-specific findings of Chapin andShaver (1985) and others. The reduction in positivegrowth response of tundra plants to warming in lateryears may be indicative of resource limitations besidestemperature (Shaver and Kummerow 1992), or it maymerely be an artifact of sample size. Other potentiallimitations include soil nutrients (Nadelhoffer et al.1991), or, in some cases, the meristem network of tun-dra plants, i.e., source–sink carbon relations (Tissueand Oechel 1987). Our studies did not include a com-plete analysis of plant mineral nutrition; however, onewould postulate that as growth is enhanced and soilnutrients begin to constrain growth, leaf nutrient con-tent may be reduced. Increases in C:N ratios have beenfound in warming experiments, especially in the dwarfshrubs (Michelsen et al. 1996, Welker et al. 1997, Tol-vanen and Henry 1998).
The observed short-term growth response of tundraplants may be transient in nature, based on the limitedsupply of nutrients available in these harsh environ-ments. Seastedt and Knapp (1993) described a ‘‘tran-sient maxima hypothesis’’ in which a transient maximaor elevated response of key system processes will occurunder non-equilibrium conditions when availability ordemand for limiting resources varies. These transientresponses may affect ecological processes on a timescale from annual estimates of net primary productivitythrough decadal or longer changes in plant succession,soil organic matter, and nitrogen dynamics (Seastedtand Knapp 1993). In our study, the relatively largeeffect size during the second and third treatment yearsand the subsequent decline in vegetative growth duringthe fourth treatment year may support a transient max-ima as resource limitations (temperature, nutrients)vary. This trend was also observed within many of theindividual studies (Henry and Molau 1997). For ex-ample, during their 4-yr ITEX experiment in Green-land, Mølgaard and Christensen (1997) found that thegreatest increase in vegetative growth of the forb Pa-paver radicatum occurred during the second treatmentyear.
Ecosystem responses that would help to mitigate thisresource limitation (increased active layer depth, soilmoisture, and nutrient mineralization rates) may notoccur for many years and will depend on feedbackscoupling plant and soil processes. Chapin et al. (1995)observed a long time lag (.3 yr) between the initiation
of treatment and ecosystem response. A major effectof their 9-yr temperature warming experiment at ToolikLake, Alaska, was an increase in nutrient availabilitydue to changes in mineralization (Chapin et al. 1995).Other studies have found that an increase in soil tem-perature increased the rate of carbon and nitrogen cy-cling through litter and soil (Hobbie 1998, Rustad andFernandez 1998). Warmer temperatures could result inincreased mineralization of this carbon, producing apositive feedback to rising atmospheric CO2 concen-trations. In addition to direct thermal effects, decom-position may be affected indirectly through changes inspecies composition and litter quality (Hobbie 1998).Decreasing litter quality (increased C:N ratios) hasbeen found for high arctic dwarf shrubs four years afterITEX warming treatments were established (Tolvanenand Henry 1998); however, there was no effect ongraminoids or forbs. Hence, we may expect a shift inspecies composition to faster growing species that areable to maintain their nutrient uptake, a result notedby Chapin et al. (1996). Changes in canopy cover will,in turn, affect active layer depth and soil moisture re-gimes, which are tightly linked to soil nutrient reser-voirs and availability.
The lag in reproductive effort may be due to adap-tation of individual species to the short, and often un-predictable, arctic and alpine summers. In many tundraspecies, flower buds form one to several seasons priorto flowering (Sørensen 1941, Diggle 1997). Thus, theeffects of increased temperature on reproduction maynot manifest for several years and will vary by species.Preformation of buds may be an evolutionary adapta-tion to a short growing season. For example, the pre-formed buds of Eriophorum vaginatum are able to be-gin development before snow melt in the spring, pro-viding the maximum amount of time for seed matu-ration. Some species, however, may be more plastic inother aspects of reproduction. The developmental pro-cesses of seed production in a high arctic Dryas pop-ulation were highly sensitive, even within one growingseason, to enhanced temperature (Wookey et al. 1993,Welker et al. 1997).
Temperature and photoperiod are key environmentalfactors that may initiate growth, flowering, and senes-cence in vascular plants (Reynolds and Leadley 1992,Shaver and Kummerow 1992, Price and Waser 1998,Thorhallsdottir 1998). Key phenological events such asleaf bud burst and flowering occurred earlier in warmedplots throughout the study period. This early-seasondevelopment may contribute to the increase in vege-tative growth observed, particularly in light of plantsbeing able to capitalize on the period of longest daylength and potentially highest photon flux density. Thelack of a response in senescence at the end of the seasonmay indicate that photoperiod plays a more importantrole in late-season phenology, similar to many woodyplant species with northern ranges (Barnes et al. 1998).Some studies have indicated short-term changes in phe-
November 1999 507ITEX META-ANALYSIS
nology, particularly delayed senescence (Christensenand Mølgaard 1995, Gugerli 1995, Jones 1995, Molau1997, Stenstrom et al. 1997). There is a degree of ge-netic control in the timing of senescence in Picea spe-cies, with high-latitude plants senescing earlier whengrown in a common environment (Morganstern 1996).Thus, photoperiod may indeed limit the extent to whichtundra plants can capitalize on warmer temperature atthe end of the season. There is potential, however, fordecomposer processes to be prolonged into the autumn(if freeze-up is delayed). If decomposition continueslater in the season (under a warming scenario), thenincreased autumn assimilation of the mineralized nu-trients may be a very important process for vascularplants, even if aboveground senescence and/or frosthardening is taking place. Such responses could, tosome extent, offset the increased demand for nutrientscaused by increased aboveground growth in warmerconditions (although there would be significant timelags involved). Experiments on season length, daylength, and snowpack also indicate significant pheno-logical responses to warming (Johnstone and Henry1995, Oberbauer 1995, Walker et al. 1995).
Spatial variation
The results support the hypothesis that warmer, lowarctic sites will show greater increases in vegetativegrowth, whereas colder, high arctic sites will showgreater increases in reproduction (Table 5). Warmer,low arctic and alpine sites produced the strongest veg-etative growth response. Greater resource investmentin vegetative growth may be a conservative strategy inthe Low Arctic, where there is severe competition forlight, nutrients, or water and there may be little op-portunity for successful germination or seedling de-velopment (Parsons et al. 1995). In contrast, in the HighArctic, heavy investment in producing seed under ahigher temperature scenario may provide an opportu-nity for species to colonize patches of unvegetatedground (Welker et al. 1997). The increase in repro-duction in some species, however, may take severalyears to manifest, due to preformation of flower buds.
Seedling establishment is thought to occur rarely inthe Arctic because of the short growing season, lowtemperatures, drought, and ice (Billings 1973). Al-though this is true for most species in undisturbed tun-dra (Freedman et al. 1982, McGraw and Shaver 1982),many kinds of natural disturbance do occur (Billings1973, Freedman et al. 1982, McGraw and Vavrek 1989,McGraw and Fetcher 1992). Grulke and Bliss (1988)showed that establishment from seed is the predomi-nant form of reproduction in the High Arctic. Due tothe long life-spans of individual plants (Callaghan andEmanuelsson 1985, Johnstone and Henry 1995, Stein-ger et al. 1996, Molau 1997), successful seed set andseedling recruitment need only take place infrequentlyto ensure that a viable population is maintained. Jons-son et al. (1996) found that recruitment by seedlings
occurs relatively frequently, when considered in thisbroader context, even for long-lived clonal plantsgrowing in closed vegetation of the Arctic and Sub-arctic. Wookey et al. (1993, 1995) found that the de-velopmental processes of seed production and viabilityin Dryas were highly sensitive to specific environmen-tal perturbations (their data are included in the presentstudy). The high arctic response of Dryas supports thehypothesis that high arctic plants respond by increasingreproductive processes that may, in turn, limit theirvegetative response. Johnstone and Henry (1995) foundthat there was a cyclical trade-off between vegetativegrowth and reproductive effort in Cassiope tetragona(an evergreen dwarf shrub). Strong vegetative growthwas negatively correlated with reproductive effort inthe same year, but positively correlated in the followingyear. Whether other arctic plants display this period-icity, and how environmental changes affect the allo-cation patterns is still not well known.
Increased reproduction and earlier reproductive phe-nology could be particularly important in light of thepresence of large unvegetated areas in the High Arcticand the potential need for genetic variability to accom-modate the predicted climate change. Environmentalchange in the High Arctic could shift the balance be-tween clonal and sexual colonization of unvegetatedareas. In contrast, the closed vegetation in the LowArctic is dominated by species that persist predomi-nantly vegetatively. Wookey et al. (1993) found a strik-ing effect of temperature warming on phenology andseed-setting in Dryas octopetala ssp. octopetala at apolar semidesert, and no significant effects on fruit pro-duction of Empetrum hermaphroditum at the subarcticsite. In fact, Chester and Shaver (1982) found that abor-tion of fruiting structures between flower and fruit for-mation was common in the Alaskan tussock tundra,particularly in Empetrum nigrum, possibly reducingcarbon and nutrient losses.
Functional group variation
Vegetative growth and phenology results supportedthe hypothesis that there would be a high similarity ofresponse within functional groups (Table 5). For re-productive responses, however, we found no differ-ences among broad or narrow functional groups. Al-though considerable variability in response occurredamong life-forms, herbaceous forms responded morestrongly and consistently by increasing vegetativegrowth than did woody forms. The responsiveness ofthe herbaceous forms to warming may be attributed totheir more flexible morphology, greater ability to scav-enge nutrients, and/or greater supply of belowgroundresources (Shaver et al. 1997). For example, many arc-tic graminoids may add new leaves without formingnew buds, graminoid leaf size may increase dramati-cally, and rapid tillering is possible. The strong veg-etative growth response of evergreen shrubs and somegraminoids may also be linked to their ability to more
508 A. M. ARFT ET AL. Ecological MonographsVol. 69, No. 4
fully utilize a longer growing season (Chapin et al.1996, Shaver and Laundre 1997, Welker et al. 1997).
Deciduous shrubs exhibited the weakest growth re-sponse to experimental warming, which may be due toa shorter period of photosynthetic activity, greater re-source requirements, and a higher leaf turnover rate(Keilland and Chapin 1992). Genera such as Salix andLedum may have tight developmental control over mer-istem activity, which may limit their response or abilityto respond quickly to warming. Other genera such asBetula nana may be more flexible in responding towarming. Betula nana may be unusual in that it hastwo types of shoots (short shoots and long shoots) thatmay give it an advantage in responding to increasedtemperature because it has a much larger pool of activemeristems than do any other species (M. S. Bret-Harte,personal communication). Significant ecological re-sponses may not be elicited, however, unless multipleenvironmental stresses are relieved, i.e., warmer tem-peratures and more available nutrients (mineralized ordeposited in precipitation). Chapin et al. (1995, 1996)reported no net increase in Betula biomass after nineyears of an increased temperature treatment, althoughBetula became the dominant shrub under conditions inwhich temperature was increased in concert with in-creases in nutrients applied as fertilizer.
Chapin and Shaver (1996) found that species withina growth form were similar to one another in theirresponse to resources (light and nutrients), but werespecies specific in their temperature response. Thus,changes in functional groups due to increased temper-ature may ultimately depend, particularly in the LowArctic, on changes in nutrient availability and howthese changes affect the competitive balance betweenspecies with different abilities to take up and utilizesoil nutrients (Berendse and Jonasson 1992, Keillandand Chapin 1992, Callaghan and Jonasson 1995). Spe-cies typical of nutrient-rich sites (deciduous shrubs andgrasses) show a greater growth response to improvednutrient availability than do species typical of nutrient-poor sites (evergreen shrubs; Henry et al. 1986, Keil-land and Chapin 1992).
Conclusions
Plants from both the arctic and alpine tundra exhib-ited consistent sensitivity to warmer summer temper-atures, especially short-term increases in vegetativegrowth with gradual increases in sexual reproduction.Short-term changes in plant performance, however,may not be maintained. Although the mechanisms arestill uncertain, they are probably the results of nutrientlimitations (Shaver and Kummerow 1992). Thesechanges in vegetative growth associated with experi-mental warming are not totally uniform across allgrowth forms, being most pronounced in herbaceousforbs.
Our multisite study supports the following results:(1) most species exhibited a measurable increase in
vegetative growth in the early years of the experiment;(2) warmer, low arctic and alpine sites produced thestrongest vegetative growth response, whereas higharctic sites produced a greater reproductive response;(3) herbaceous forms produced a stronger vegetativegrowth response than did woody forms; and (4) warmertemperatures accelerated plant development in thespring, but had little impact on growth cessation at theend of the season.
Manipulation of single factors such as increased tem-perature may not account for all of the complex inter-actions between environmental factors that limitgrowth of tundra species. For example, long-term re-sponses will probably be constrained by water and/ornutrients, in both the Low and High Arctic (Chapin etal. 1996, Henry and Molau 1997, Shaver et al. 1997,Robinson et al. 1998). Thus, long-term studies will becrucial for resolving how nutrients and other environ-mental factors affect arctic and alpine plants, becauseshort-term experiments may miss many of the re-sponses that are important in determining the ultimateconsequence of disturbances. Whether these initial re-sponses are maintained in the warming experiments,and how they translate to community-level changes,are the focus of ongoing research at ITEX sites.
ACKNOWLEDGMENTS
This synthesis was begun as part of the workshop ‘‘A Cir-cumpolar Comparison of Tundra Response to TemperatureManipulation: A Synthesis of International Tundra Experi-ment Data,’’ supported by the National Center for EcologicalAnalysis and Synthesis, a Center funded by NSF (Grant DEB-94-21535), the University of California–Santa Barbara, andthe State of California. Additional support was also providedfor the Postdoctoral Associate (Anna Arft) in the group.
The data and analyses here were supported by NationalScience Foundation grants OPP-9400083, OPP-9321730,OPP-9321626, OPP-9415411, OPP-9318528, OPP-9612647,OPP-9714103, DEB-9024188, DEB-9211775, DEB-9211776; Natural Sciences and Engineering Research Coun-cil of Canada; Northern Scientific Training Program, De-partment of Indian Affairs and Northern Development Can-ada; University of Alberta, Canadian Circumpolar Institute;Norwegian Research Council grant 101535/720; SwedishNatural Science Research Council (NFR); UK Natural En-vironment Research Council (NERC) Grant GST/02/531;Swedish Environmental Protection Agency; the Kempe Foun-dation; Swiss Nationalfonds project 4031-033431; Swiss Po-lar Commission; Swiss Foundation for Alpine Research;Splinter Legacy; Carl Skottsberg’s Research Foundation,Anna Ahrenberg’s Fund, Th. Krok’s Foundation, Lars Hierta’sCommemorative Fund, Helge Axson Johnsons Fund, P. A.Larsson’s Research Fund, The Swedish Institute, GoteborgUniversity, Councilor and Mrs. Ernst Colliander’s Founda-tion, Letterstedska Association, Hierta-Retzius Trust, Enan-derska Fund, and Nordic Academy for Advanced Study(NorFA). Logistical support was provided by the Polar Con-tinental Shelf Project, Natural Resources Canada, Abisko Sci-entific Research Station, UK NERC Arctic Research StationHarland Huset, the Norwegian Polar Research Institute, theRoyal Canadian Mounted Police, the Toolik Field Station,University of Alaska Fairbanks, and the Polar Ice CoringOffice, University of Nebraska. Special thanks are due toMark Schildhauer and Matt Jones of the National Center forEcological Analysis and Synthesis for their assistance with
November 1999 509ITEX META-ANALYSIS
data handling and analysis and to the NCEAS staff for theirassistance with workshop logistics and funding.
LITERATURE CITED
Adams, D. C., J. Gurevitch, and M. S. Rosenberg. 1997.Resampling tests for meta-analysis of ecological data. Ecol-ogy 78:1277–1283.
Arnqvist, G., and D. Wooster. 1995. Meta-analysis: synthe-sizing research findings in ecology and evolution. Trendsin Ecology and Evolution 10:236–240.
Barnes, B. V., D. R. Zak, S. R. Denton, and S. H. Spurr.1998. Forest tree variation. Pages 63–93 in Forest ecology.John Wiley, New York, New York, USA.
Berendse, F., and S. Jonasson. 1992. Nutrient use and nu-trient cycling in northern ecosystems. Pages 337–356 in F.S. Chapin, III, R. L. Jeffries, J. F. Reynolds, G. R. Shaver,and J. Svoboda, editors. Arctic ecosystems in a changingclimate. Academic Press, San Diego, California, USA.
Billings, W. D. 1973. Arctic and alpine vegetation: similar-ities, differences, and susceptibility to disturbance. Bio-Science 23:697–704.
. 1992. Phytogeographic and evolutionary potentialof the arctic flora and vegetation in a changing climate.Pages 91–109 in F. S. Chapin, III, R. L. Jeffries, J. F. Reyn-olds, G. R. Shaver, and J. Svoboda, editors. Arctic eco-systems in a changing climate. Academic Press, San Diego,California, USA.
Bliss, L. C. 1981. North American and Scandinavian tundrasand polar deserts. Pages 8–24 in L. C. Bliss, O. W. Heal,and J. J. Moore, editors. Tundra ecosystems: a comparativeanalysis. Cambridge University Press, Cambridge, UK.
Bliss, L. C., and N. V. Matveyeva. 1992. Circumpolar arcticvegetation. Pages 59–89 in F. S. Chapin, III, R. L. Jeffries,J. F. Reynolds, G. R. Shaver, and J. Svoboda, editors. Arcticecosystems in a changing climate. Academic Press, SanDiego, California, USA.
Bliss, L. C., and K. M. Peterson. 1992. Plant succession,competition, and the physiological constraints of speciesin the Arctic. Pages 111–136 in F. S. Chapin, III, R. L.Jeffries, J. F. Reynolds, G. R. Shaver, and J. Svoboda, ed-itors. Arctic ecosystems in a changing climate. AcademicPress, San Diego, California, USA.
Callaghan, T. V., and U. Emanuelsson. 1985. Populationstructure and processes of tundra plants and vegetation.Pages 399–439 in J. White, editor. The population structureof vegetation. Dr. W. Junk, Dordrecht, The Netherlands.
Callaghan, T. V., and S. Jonasson. 1995. Implications forchanges in arctic plant biodiversity from environmental ma-nipulation experiments. Ecological Studies 113:151–166.
Chapin, F. S., III, M. S. Bret-Harte, S. E. Hobbie, and H.Zhong. 1996. Plant functional types as predictors of tran-sient responses of arctic vegetation to global change. Jour-nal of Vegetation Science 7:347–356.
Chapin, F. S., III, and G. R. Shaver. 1985. Individualisticgrowth response of tundra plant species to environmentalmanipulations in the field. Ecology 66:564–576.
Chapin, F. S., III, and G. R. Shaver. 1996. Physiological andgrowth responses of arctic plants to a field experiment sim-ulating climatic change. Ecology 77:822–840.
Chapin, F. S., III, G. R. Shaver, A. E. Giblin, K. J. Nadel-hoffer, and J. A. Laundre. 1995. Responses of arctic tundrato experimental and observed changes in climate. Ecology76:694–711.
Chester, A. L., and G. R. Shaver. 1982. Reproductive effortin cotton grass tussock tundra. Holarctic Ecology 5:200–206.
Christensen, K., and P. Mølgaard. 1995. Salix arctica in aretrospective study. Abstract volume, Fifth Annual ITEXMeeting, April 1995, Ottawa, Ontario, Canada.
Cohen, J. 1969. Statistical power analysis for the behavioralsciences. Academic Press, New York, New York, USA.
Diggle, P. K. 1997. Extreme preformation in an alpine Po-lygonum viviparum: an architectural and developmentalanalysis. American Journal of Botany 84:154–169.
Ellenberg, H. 1988. Vegetation ecology of Central Europe.Cambridge University Press, Cambridge, UK.
Freedman, B., N. Hill, J. Svoboda, and G. Henry. 1982.Seedbanks and seedling occurrence in a high-arctic oasisat Alexandra Fiord, Ellesmere Island, Canada. CanadianJournal of Botany 60:2112–2118.
Grulke, N. E., and L. C. Bliss. 1988. Comparative life-his-tory characteristics of two high arctic grasses, NorthwestTerritories. Ecology 69:484–496.
Gugerli, F. 1995. Reaction of tundra plants to climate warm-ing. Abstract volume, Fifth Annual ITEX meeting, April1995, Ottawa, Ontario, Canada.
Gurevitch, J., and L. V. Hedges. 1999. Statistical issues inconducting ecological meta-analyses. Ecology 80:1142–1149.
Gurevitch, J., L. L. Morrow, A. Wallace, and J. S. Walsh.1992. A meta-analysis of field experiments on competition.American Naturalist 140:539–572.
Havstrom, M., T. V. Callaghan, and S. Jonasson. 1993. Dif-ferential growth responses of Cassiope tetragona, an arcticdwarf shrub, to environmental perturbations among threecontrasting high- and subarctic sites. Oikos 66:389–402.
Hedges, L. V., and I. Olkin. 1985. Statistical methods formeta-analysis. Academic Press, London, UK.
Hedges, L. V., and I. Olkin. In press. Statistical methods formeta-analysis in the medical and social sciences. AcademicPress, New York, New York, USA.
Henry, G. H. R. 1998. Environmental influences on the struc-ture of sedge meadows in the Canadian High Arctic. PlantEcology 134:119–129.
Henry, G. H. R., B. Freedman, and J. Svoboda. 1986. Effectsof fertilization on three tundra plant communities of a polardesert oasis. Canadian Journal of Botany 64:2502–2507.
Henry, G. H. R., and U. Molau. 1997. Tundra plants andclimate change: the International Tundra Experiment(ITEX). Global Change Biology 3(Supplement 1):1–9.
Henry, G. H. R., J. Svoboda, and B. Freedman. 1990. Stand-ing crop and net production of non-grazed sedge meadowsof a polar desert oasis. Canadian Journal of Botany 68:2660–2667.
Hobbie, S. 1998. Temperature and plant species control overlitter decomposition in Alaskan tundra. Ecological Mono-graphs 66:503–522.
Intergovernmental Panel on Climate Change. 1996. Tech-nical summary. Pages 13–49 in J. T. Houghton, L. G. MeiraFilho, B. A. Callander, N. Harris, A. Kattenberg, and K.Maskell, editors. Climate change 1995: the science of cli-mate change. Press Syndicate of the University of Cam-bridge, Cambridge, UK.
Isard, S. A. 1987. The effect of slope–aspect on turbulenttransfer in an alpine fellfield: Niwot Ridge, Front Range,Colorado. Physical Geography 8:133–147.
Johnstone, J., and G. H. R. Henry. 1995. Differential growthand reproductive response of Cassiope tetragona to vari-ations in growing season climate at Alexandra Fiord, Elles-mere Island, Canada. Abstract volume, ITEX annual meet-ing, April 1995, Ottawa, Ontario, Canada.
Jonasson, S. 1982. Organic matter and phytomass on threenorth Swedish tundra sites, and some connections with ad-jacent tundra areas. Holarctic Ecology 5:367–375.
Jones, M. H. 1995. Experimental investigations into effectsof climate change on high arctic plants. Dissertation. Uni-versity of Alberta, Edmonton, Canada.
Jonsson, O., I. S. Jonsdottir, and N. Cronberg. 1996. Clonaldiversity and allozyme variation in populations of the arcticsedge Carex bigelowii (Cyperaceae). Journal of Ecology84:449–459.
510 A. M. ARFT ET AL. Ecological MonographsVol. 69, No. 4
Keilland, K., and F. S. Chapin, III. 1992. Nutrient absorptionand accumulation in arctic plants. Pages 321–335 in F. S.Chapin, III, R. L. Jeffries, J. F. Reynolds, G. R. Shaver,and J. Svoboda, editors. Arctic ecosystems in a changingclimate. Academic Press, San Diego, California, USA.
Kjelvik, S., and L. Karenlampi. 1975. Plant biomass andprimary production of Fennoscandian subarctic and sub-alpine forests and of alpine willow and heath ecosystems.Pages 111–120 in R. E. Wielgolaski, editor. Fennoscandiantundra ecosystems. Part 1. Plants and microorganisms.Springer-Verlag, Berlin, Germany.
Komarkova, V., and P. J. Webber. 1980. Two Low Arcticvegetation maps near Atkasook, Alaska. Arctic and AlpineResearch 12:447–472.
Korner, C., M. Diemer, B. Schappi, and L. Zimmermann.1996. Response of alpine vegetation to elevated CO2. Pages177–196 in G. W. Koch and H. A. Mooney, editors. Carbondioxide and terrestrial ecosystems. Academic Press, SanDiego, California, USA.
Lohiluoma, M. A. 1995. Floral sex ratio in Salix herbaceaL. at the fjells Jehkats and Pikku Malla. Thesis. Universityof Oulu, Oulu, Finland.
Marion, G. M. 1996. Temperature enhancement experiments.Pages 14–19 in U. Molau and P. Mølgaard, editors. TheITEX Manual. Danish Polar Center, Copenhagen, Den-mark.
Marion, G. M., G. H. R. Henry, D. W. Freckman, J. Johnstone,G. Jones, M. H. Jones, E. Levesque, U. Molau, P. Mølgaard,A. N. Parsons, J. Svoboda, and R. A. Virginia. 1997. Open-top designs for manipulating field temperature in high-lat-itude ecosystems. Global Change Biology 3(Supplement1):20–32.
Marion, G. M., G. H. R. Henry, P. Mølgaard, W. C. Oechel,M. H. Jones, and G. L. Vourlitis. 1993. Open-top devicesfor manipulating field temperatures in tundra ecosystems.Pages 205–210 in V. J. Lunardini and S. L. Bowen, editors.Proceedings of the Fourth International Symposium onThermal Engineering and Science for Cold Regions.CRREL Special Report 93-22, U.S. Army Cold RegionsResearch and Engineering Laboratory, Hanover, NewHampshire, USA.
Maxwell, B. 1992. Arctic climate: potential for change underglobal warming. Pages 11–34 in F. S. Chapin, III, R. L.Jeffries, J. F. Reynolds, G. R. Shaver, and J. Svoboda, ed-itors. Arctic ecosystems in a changing climate. AcademicPress, San Diego, California, USA.
McGraw, J. B., and N. Fetcher. 1992. Response of tundraplant populations to climatic change. Pages 359–376 in F.S. Chapin, III, R. L. Jeffries, J. F. Reynolds, G. R. Shaver,and J. Svoboda, editors. Arctic ecosystems in a changingclimate. Academic Press, San Diego, California, USA.
McGraw, J. B., and G. R. Shaver. 1982. Seedling densityand seedling survival in Alaskan cotton grass tussock tun-dra. Holarctic Ecology 5:212–217.
McGraw, J. B., and M. C. Vavrek. 1989. The role of buriedviable seeds in arctic and alpine plant communities. Pages91–106 in M. A. Leck, V. T. Parker, and R. L. Simpson,editors. Ecology of soil seed banks. Academic Press, SanDiego, California, USA.
Michelsen, A., S. Jonasson, D. Sleep, M. Havstrom, and T.V. Callaghan. 1996. Shoot biomass, d13C, nitrogen andchlorophyll responses of two arctic dwarf shrubs to in situshading, nutrient application and warming simulating cli-matic change. Oecologia 105:1–12.
Miller, P. C., R. Mangan, and J. Kummerow. 1982. Verticaldistribution of organic matter in eight vegetation types nearEagle Summit, Alaska. Holarctic Ecology 5:117–124.
Mitchell, J. F. B., S. Manabe, T. Tokioka, and V. Meleshoko.1990. Pages 131–172 in J. T. Houghton, G. J. Jenkins, and
J. J. Ephraums, editors. Climate change, the IPCC scientificassessment. Cambridge University Press, Cambridge, UK.
Molau, U. 1997. Responses to natural climatic variation andexperimental warming in two tundra plant species with con-trasting life forms: Cassiope tetragona and Ranunculus ni-valis. Global Change Biology 3(Supplement 1):97–107.
Molau, U., and J. M. Alatalo. 1998. Responses of subarctic–alpine plant communities to simulated environmentalchange: biodiversity of bryophytes, lichens, and vascularplants. Ambio, in press.
Molau, U., and S. Edlund. 1996. Plant response variables.Pages 20–29 in U. Molau and P. Mølgaard, editors. TheITEX Manual. Danish Polar Center, Copenhagen, Den-mark.
Molau, U., and P. Mølgaard. 1996. The ITEX manual. DanishPolar Center, Copenhagen, Denmark.
Mølgaard, P., and K. Christensen. 1997. Response to exper-imental warming in a population of Papaver radicatum inGreenland. Global Change Biology 3(Supplement 1):116–124.
Morgenstern, E. K. 1996. Environmental influences and geo-graphic variation. Pages 45–89 in Geographic variation inforest trees. UBC Press, Vancouver, British Columbia, Can-ada.
Nadelhoffer, K. J., A. E. Giblin, G. R. Shaver, and J. A.Laundre. 1991. Effects of temperature and substrate qual-ity on element mineralization in six arctic soils. Ecology72:242–253.
Oberbauer, S. F. 1995. Effects of shortened day length ontundra microcosms. Abstract volume, ITEX annual meet-ing, April 1995, Ottawa, Ontario, Canada.
Oechel, W. C., and W. D. Billings. 1992. Effects of globalchange on the carbon balance of arctic plants and ecosys-tems. Pages 11–34 in F. S. Chapin, III, R. L. Jeffries, J. F.Reynolds, G. R. Shaver, and J. Svoboda, editors. Arcticecosystems in a changing climate. Academic Press, SanDiego, California, USA.
Oechel, W. C., S. J. Hastings, G. Vourlitis, M. Jenkins, G.Riechers, and N. Grulke. 1993. Recent change of Arctictundra ecosystems from a net carbon dioxide sink to asource. Nature 361:520–523.
Osenberg, C. W., O. Sarnelle, and S. D. Cooper. 1997. Effectsize in ecological experiments: the application of biologicalmodels in meta-analysis. American Naturalist 150:798–812.
Parsons, A. N., M. C. Press, P. A. Wookey, J. M. Welker, C.H. Robinson, T. V. Callaghan, and J. A. Lee. 1995. Growthresponses of Calamagrostis lapponica to simulated envi-ronmental change in the subarctic. Oikos 72:61–66.
Price, M. V., and N. M. Waser. 1998. Effects of experimentalwarming on plant reproductive phenology in a subalpinemeadow. Ecology 79:1261–1271.
Reynolds, J. F., and P. W. Leadley. 1992. Modeling the re-sponse of arctic plants to changing climate. Pages 413–438in F. S. Chapin, III, R. L. Jeffries, J. F. Reynolds, G. R.Shaver, and J. Svoboda, editors. Arctic ecosystems in achanging climate. Academic Press, San Diego, California,USA.
Robinson, C. H., P. A. Wookey, J. A. Lee, T. V. Callaghan,and M. C. Press. 1998. Plant community responses to sim-ulated environmental change at a high arctic site. Ecology79:856–866.
Rosenberg, M. S., D. C. Adams, and J. Gurevitch. 1997.Metawin: statistical software for meta-analysis with resam-pling tests. Sinauer Associates, Sunderland, Massachusetts,USA.
Rustad, L. E., and I. J. Fernandez. 1998. Experimental soilwarming effects on CO2 and CH4 flux from a low elevationspruce-fir forest soil in Maine, USA. Global Change Bi-ology 4:597–605.
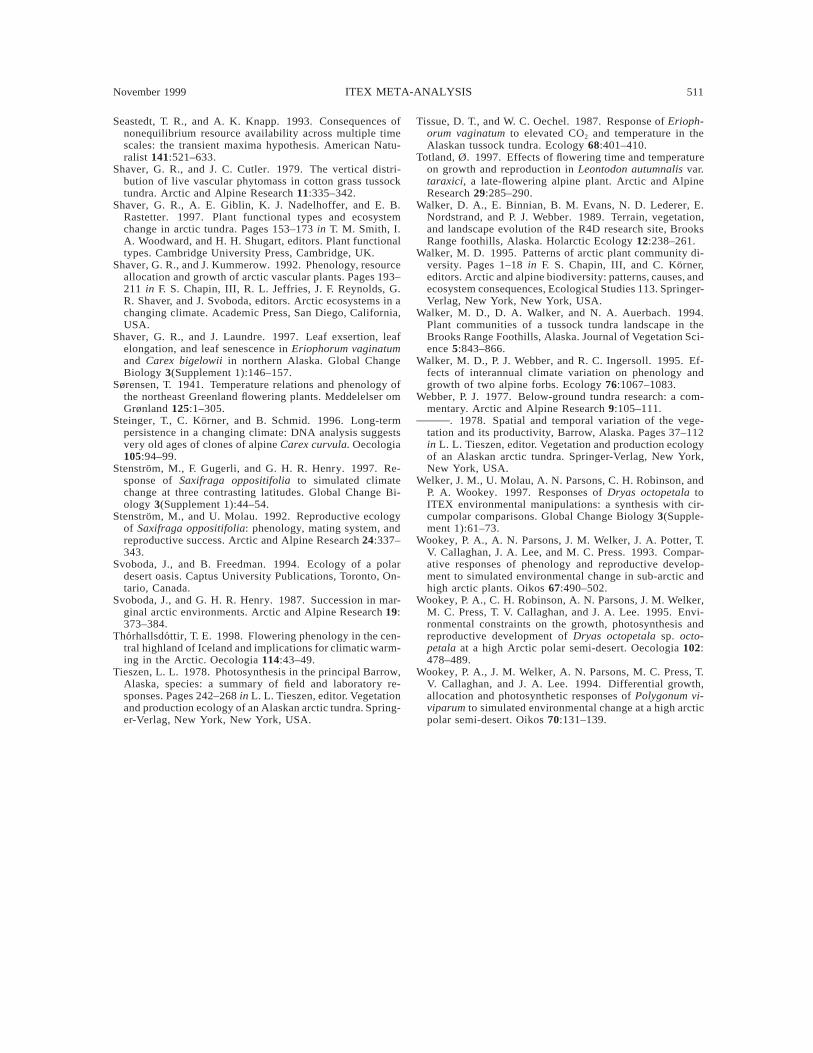
November 1999 511ITEX META-ANALYSIS
Seastedt, T. R., and A. K. Knapp. 1993. Consequences ofnonequilibrium resource availability across multiple timescales: the transient maxima hypothesis. American Natu-ralist 141:521–633.
Shaver, G. R., and J. C. Cutler. 1979. The vertical distri-bution of live vascular phytomass in cotton grass tussocktundra. Arctic and Alpine Research 11:335–342.
Shaver, G. R., A. E. Giblin, K. J. Nadelhoffer, and E. B.Rastetter. 1997. Plant functional types and ecosystemchange in arctic tundra. Pages 153–173 in T. M. Smith, I.A. Woodward, and H. H. Shugart, editors. Plant functionaltypes. Cambridge University Press, Cambridge, UK.
Shaver, G. R., and J. Kummerow. 1992. Phenology, resourceallocation and growth of arctic vascular plants. Pages 193–211 in F. S. Chapin, III, R. L. Jeffries, J. F. Reynolds, G.R. Shaver, and J. Svoboda, editors. Arctic ecosystems in achanging climate. Academic Press, San Diego, California,USA.
Shaver, G. R., and J. Laundre. 1997. Leaf exsertion, leafelongation, and leaf senescence in Eriophorum vaginatumand Carex bigelowii in northern Alaska. Global ChangeBiology 3(Supplement 1):146–157.
Sørensen, T. 1941. Temperature relations and phenology ofthe northeast Greenland flowering plants. Meddelelser omGrønland 125:1–305.
Steinger, T., C. Korner, and B. Schmid. 1996. Long-termpersistence in a changing climate: DNA analysis suggestsvery old ages of clones of alpine Carex curvula. Oecologia105:94–99.
Stenstrom, M., F. Gugerli, and G. H. R. Henry. 1997. Re-sponse of Saxifraga oppositifolia to simulated climatechange at three contrasting latitudes. Global Change Bi-ology 3(Supplement 1):44–54.
Stenstrom, M., and U. Molau. 1992. Reproductive ecologyof Saxifraga oppositifolia: phenology, mating system, andreproductive success. Arctic and Alpine Research 24:337–343.
Svoboda, J., and B. Freedman. 1994. Ecology of a polardesert oasis. Captus University Publications, Toronto, On-tario, Canada.
Svoboda, J., and G. H. R. Henry. 1987. Succession in mar-ginal arctic environments. Arctic and Alpine Research 19:373–384.
Thorhallsdottir, T. E. 1998. Flowering phenology in the cen-tral highland of Iceland and implications for climatic warm-ing in the Arctic. Oecologia 114:43–49.
Tieszen, L. L. 1978. Photosynthesis in the principal Barrow,Alaska, species: a summary of field and laboratory re-sponses. Pages 242–268 in L. L. Tieszen, editor. Vegetationand production ecology of an Alaskan arctic tundra. Spring-er-Verlag, New York, New York, USA.
Tissue, D. T., and W. C. Oechel. 1987. Response of Erioph-orum vaginatum to elevated CO2 and temperature in theAlaskan tussock tundra. Ecology 68:401–410.
Totland, Ø. 1997. Effects of flowering time and temperatureon growth and reproduction in Leontodon autumnalis var.taraxici, a late-flowering alpine plant. Arctic and AlpineResearch 29:285–290.
Walker, D. A., E. Binnian, B. M. Evans, N. D. Lederer, E.Nordstrand, and P. J. Webber. 1989. Terrain, vegetation,and landscape evolution of the R4D research site, BrooksRange foothills, Alaska. Holarctic Ecology 12:238–261.
Walker, M. D. 1995. Patterns of arctic plant community di-versity. Pages 1–18 in F. S. Chapin, III, and C. Korner,editors. Arctic and alpine biodiversity: patterns, causes, andecosystem consequences, Ecological Studies 113. Springer-Verlag, New York, New York, USA.
Walker, M. D., D. A. Walker, and N. A. Auerbach. 1994.Plant communities of a tussock tundra landscape in theBrooks Range Foothills, Alaska. Journal of Vegetation Sci-ence 5:843–866.
Walker, M. D., P. J. Webber, and R. C. Ingersoll. 1995. Ef-fects of interannual climate variation on phenology andgrowth of two alpine forbs. Ecology 76:1067–1083.
Webber, P. J. 1977. Below-ground tundra research: a com-mentary. Arctic and Alpine Research 9:105–111.
. 1978. Spatial and temporal variation of the vege-tation and its productivity, Barrow, Alaska. Pages 37–112in L. L. Tieszen, editor. Vegetation and production ecologyof an Alaskan arctic tundra. Springer-Verlag, New York,New York, USA.
Welker, J. M., U. Molau, A. N. Parsons, C. H. Robinson, andP. A. Wookey. 1997. Responses of Dryas octopetala toITEX environmental manipulations: a synthesis with cir-cumpolar comparisons. Global Change Biology 3(Supple-ment 1):61–73.
Wookey, P. A., A. N. Parsons, J. M. Welker, J. A. Potter, T.V. Callaghan, J. A. Lee, and M. C. Press. 1993. Compar-ative responses of phenology and reproductive develop-ment to simulated environmental change in sub-arctic andhigh arctic plants. Oikos 67:490–502.
Wookey, P. A., C. H. Robinson, A. N. Parsons, J. M. Welker,M. C. Press, T. V. Callaghan, and J. A. Lee. 1995. Envi-ronmental constraints on the growth, photosynthesis andreproductive development of Dryas octopetala sp. octo-petala at a high Arctic polar semi-desert. Oecologia 102:478–489.
Wookey, P. A., J. M. Welker, A. N. Parsons, M. C. Press, T.V. Callaghan, and J. A. Lee. 1994. Differential growth,allocation and photosynthetic responses of Polygonum vi-viparum to simulated environmental change at a high arcticpolar semi-desert. Oikos 70:131–139.