Embed Size (px)
Citation preview
SUBMISSION
To
Independent Competition and Regulatory Commission
Draft Determination – Taxi Fares 1 July 2004 to 30 June 2007
by
The Canberra Taxi Proprietors Association
and Canberra Cabs
in consultation with
Professor Des Nicholls BSc(Hons), MSc, PhD
School of Finance and Applied Statistics Faculty of Economics and Commerce Australian National University ACT
March 2004

Response to the ICRC Draft Determination — Taxi Fares 1 July 2004 to 30 June 2007
In responding to the ICRC Draft Determination on taxi fares Canberra Taxi Proprietors Association and Canberra Cabs (CC) will offer specific comments on aspects of the Draft. In addition this submission presents details on actual costings (and related information) experienced by the ACT taxi industry during 2003. Specific Comments on Executive Summary Effectiveness of the WCI CC believes that dot point 3 on page x is not correct. The costs encountered by taxi operators are not costs over which they have control or influence. They have no capacity to reduce these costs, whether incentives exist or not. Rather, these costs are imposed by third parties, such as Government and commercial product suppliers. Increases in costs have always been third party costs and have been substantiated by the industry before they could be introduced. Any increase in fare levels has only just (if at all) covered the third party increase in costs and there was no excessive advantage to the industry. Merit of the TCCI The third dot point under ‘Merit of the TCCI’ (page xiii) warrants comment. The industry maintains the view that it is in the interests of the taxi industry and taxi users to include actual, contemporary information wherever possible and practicable in the fare review process. It does not balk at the so called ‘resource-intensive’ approach and the Commission needs only audit the industry’s submission. It is not appropriate for the Commission to continue to use short cuts, that have the clear potential to compromise accurate fares outcomes. Demand In discussing demand (page xiv) the Commission states that ‘…customers should not pay for falling demand’. It would certainly not be the industry’s intention that customers pay for fall in demand but that customers pay only for the actual cost of the service. Also on this theme, it is inappropriate to require the industry to absorb cost increases (by deliberate suppression of reasonable fare levels) that have been imposed on the industry through ill-conceived Government decisions to unnecessarily increase taxi numbers. Service Quality In discussing service quality the Commission suggests (page xiv) that
‘The best way to improve wheelchair accessible taxi service quality issues is through improved operational regulations and network sanctions’.
It appears that the Commission continues to ignore the reality of the problem and at the end of the day sanctions on the network will not result in any sustained improvement in driver commitment. The Commission then ‘suggests that some additional evaluation of driver health and safety issues may have merit’. The Commission has provided no grounds for such
2

a conclusion. Instead, the Commission may be indicating its understanding of a symptom evident in other places where taxi numbers have been actually or effectively deregulated — the practice of taxi drivers working excessive hours to obtain minimal returns (page 29 relates that ‘… some drivers under financial pressure complete shifts longer than 12 hours’). Taxi Industry Position For many years the industry has presented its case for fare reviews on the basis that taxi operators need to be able to recover their operating costs from fares revenue. Acknowledging that there is a variation in vehicle types and management arrangements within the Canberra taxi fleet, the industry has predicated its submissions on the most efficient vehicle type and management arrangement. The model that it uses is based on an operator/driver standard taxi. The industry again proposes that only demonstrated changes in actual taxi operating costs should be used to adjust fares. The costing information to support this approach is obtained from reputable commercial sources; and is verifiable and replicable over time. Only where such contemporary information is not readily available, appropriate indexes are used. An example of this is the labour cost, which has moved over time from an award-based assessment to an ABS index (the Wage Cost Index); reflecting the community move away from award-based pay rates to more flexible individual contract arrangements. The reliance on actual non-labour costs enables the industry to keep its pricing at responsible levels, while incorporating the WCI gives taxi drivers the opportunity to maintain their potential earnings at community levels. In contrast to this, the ICRC Draft Determination proposes to continue a recent decision of the ICRC to replace the use of actual costs with an array of ABS indices. This is despite acknowledging, firstly, that “… the ABS information is not specific to the taxi industry …” (page 99 of ICRC Final Report dated June 2002) and, secondly, that its most recent format did not produce ideal results. It now proposes to introduce a new methodology called the Taxi Composite Cost Index. This index includes a component called “Interest cost”. In the previous ICRC index the related item was called “Return on investment”. Both of these items are fundamentally intended to intro-duce a link between fares and taxi plate values. It is worth noting that no fare increase has flowed from the initial incorporation of the Return on investment component valued at $26,000 annually. The industry remains opposed to the inclusion of a capital asset (i.e. taxi plates) into a fares formula which is supposed to reflect operating costs. In addition, the industry maintains that this cost has never, in fact, been recognised financially in the outputs from the ICRC models. The industry view is that the previous item “Return on investment” and the proposed item “Interest cost” reflect the approach that the ICRC has adopted towards the taxi industry. This submission contains the industry approach of obtaining actual costings to determine the actual operating costs of an operator/driver standard taxi business. These costs are then contrasted against the earnings profile of an average taxi to determine what fares increase is necessary to enable the operator to recover operating costs; and for a driver to potentially keep pace with community wage movements.
3

This model contains no recognition of taxi plate values or any proxy for those values. In addition, the labour costs contained in this model have reverted to recognising only the time that the vehicle is being driven. There is no recognition of administration costs (of drivers or operators); nor is there any recognition of normal community expectations such as holiday pay, holiday loading, sick pay or superannuation. These costs relating to improvements for drivers have been abandoned in the face of ICRC opposition to their inclusion over a number of years. Against this background, the industry again proposes that the ICRC should accept its commonsense approach of adjusting fares based on demonstrated changes in actual taxi operating costs. In the event that the ICRC does not support this approach, this submission contains a modified TCCI model, which reflects the specific comments contained in the following paragraphs. It is worth noting that the outcome produced by the industry approach is the most conservative outcome available from the three models addressed. These outcomes are: • the industry model results in a 2.66% increase in fares; • the modified TCCI model results in a 3.84% increase; and • the ICRC TCCI model results in a 4.38% increase. In addition, as both the modified TCCI model and the ICRC TCCI model contain a new cost component (Interest Costs) that has not previously been incorporated into fares, there is a need to initially increase fares to accommodate this component. This will produce additional increases (above those detailed in the preceding paragraph) of approximately 4.85% and 11.45% respectively for each of the TCCI models.
Comments on Draft Determination Previous Decisions Section 1.4 (page 3) of the Draft discusses previous fare decisions by the ICRC. From the point of view of an ‘outsider’ reading this it could be concluded that the ICRC can develop different approaches to suit its needs, in each case producing reasons as to why the previous methodology was not satisfactory. Having used a ‘profit and loss’ approach, this has been overtaken by a weighted cost index approach, which has now been replaced with a ‘Taxi Composite Cost Index (TCCI). The Commission is proposing to automatically update this model each year using an index-based approach
Given the current state of the taxi industry as a result of the Government’s response to National Competition Policy requirements, CC believes that it would be inappropriate to automatically update fares each year. The Commission should continue to determine fares on an annual basis until the Government finalises its decision on the future of the industry. The Commission notes this in its Preliminary Conclusion (PC) 4 on page 39. Issues in the ACT Taxi Industry CC noted with interest the statement at page 15 of the Draft:
The ACT has a relatively smaller fleet, per capita, than Sydney (one taxi per 1,315 residents, compared to Sydney’s one per 900 residents). However, ACT residents are far less frequent taxi users (fewer than eight hirings per resident per year, compared to Sydney’s 20 hirings).
4

This could be interpreted as an indication that the ACT, when compared to Sydney, is oversupplied with taxis given the level of demand. Indeed a taxi in Sydney would have 18,000 hirings per annum compared with only 10,520 in The ACT. If the number of hirings per head of resident population is an appropriate measure of service delivery and if Sydney is adequately served by its taxis, then the corresponding level of service could be achieved in the ACT with a reduction of over 40 percent of its taxi numbers. Clearly this would be an irresponsible approach. The Commission’s comparison between Sydney and Canberra is neither sensible nor relevant. Relationship between Fare Increases and Patronage The interpretation of Table 2.2 (page 20) is seriously flawed. To claim that the fall in demand from June to July is a result of the impact of fare increases has not been justified. While the Commission does note that July ‘may well be a weaker month than June’ it is well known in the industry that the major impact on demand for taxi services in Canberra is whether or not Federal parliament is sitting. Parliament sits in June but does not sit in July. Seasonal conditions also impact on the taxi industry, both in July and January. This is clearly demonstrated in Figure 2.2 (page 21). Any suggestion that the impact of fare increases is reflected in demand figures for June and July cannot be claimed by simply comparing hiring data as has been done in Table 2.2. Another important feature of the Commission’s analysis is that it addresses only those years when fare increases were applied in July. It does not address those years when fare increases were applied in a month other than July. Since 1990 there have been 12 fare increases, only 8 of which have occurred in July. Two of these July increases have been accompanied by demand increases. Of the other 4 fare increases that occurred in other than July, 3 were accompanied by demand increases. There is also evidence that any coincidental demand reduction in the month of a fare increase is invariably followed by an increase in demand in the next month (see Attachment 1). The Commission also places some faith in a measurement of the price elasticity for taxis (page 20). Quantifying elasticities, and using these to make categorical statements, is once more speculation. Commentaries on the taxi industry are infamous for different studies producing different estimates of elasticity, as the Booz Allen & Hamilton (BAH) study has clearly shown in its Table 5.1 (BAH report for NSW IPART titled Appraisal of Taxi Fare Structure Issues dated July 2003). Here the BAH elasticity estimate of –0.36 is chosen for the ACT in line with that reported in Table 5.1. The way this figure has been determined is based on very limited data and should be given little, if any weight. Indeed it is amazing that any weight at all should be placed on this figure, given the data on which it was based. As the BAH study indicates in its Table 5.1, the data was obtained from in-cab interviews with taxi users; ‘the interviewer travelled with a single cab for a full driver shift. Only those people not charging their fares to a third party were interviewed. Surveys excluded evening/night travel…’ The scope of the elasticity survey therefore covered total passenger trips of almost certainly less than 20 and only engaged those who were paying their own way and only during daylight hours. As daylight hours travel consists predominantly of business travellers, upwards of 60% of total travellers, the scope of the BAH survey, therefore, probably involved about 8 passenger trips. To make claims about the magnitude of elasticities based on such limited information is unacceptable.
5

The BAH study summarises other studies and presents a huge range of elasticities. One could choose the one to suit. What is of concern to the industry is that the Freehill NCC Review of the ACT Taxi and Hire Car industry chose an elasticity of –0.8 to determine outcomes which the Commission has quoted in its Review (which followed the Freehill Review). The industry is continually frustrated by information being quoted from analyses based on theoretical assumptions or inappropriate data. Against this background of available and verifiable empirical data, the Commission’s assertion that “It is clear that demand for taxis is significantly affected by fare increases.”(page 20) is patently incorrect. Network Fees The Commission has acknowledged that it has concerns with the network fees charged in the ACT (page 30). This Draft contains a number of comparisons, identifies services and attempts to cost services supplied by the network. There are a number of costs which have not been identified, including the cost of Government through continual reviews, information requests and other requests, all of which add to the cost of conducting an efficient industry in the ACT. The network fees have had to absorb the total cost of these. In making comparisons ‘like must be compared with like’. To simply quote network fees in different jurisdictions, as has been done in the case of Table 2.7, is misleading unless there is an associated detailed analysis to determine why these fees are different. The Commission has not undertaken such a comparative analysis. The issue of regulatory scrutiny (PC 2 page 33) is not, and never has been, an area of disagreement between CC and the Commission. The Commission would be aware that it has access to the audited annual accounts of CC. It would also be aware that CC has consistently provided the Commission with detailed calculations of how the relevant costs contained in those accounts are incorporated into its network fees. At section 3.3.3 (Page 57) the Draft identifies a number of costs incurred by CC that are not incurred by other network providers; and makes an assessment of the suitability of their inclusion in the setting of fares. What is absent from the list of costs are those costs directly related to the role of peak industry representation and advocacy for the ACT taxi industry. This role is jointly undertaken by CC and the CTPA. The similar role is performed in other jurisdictions by state taxi councils, such as the NSW Taxi Council. The issues addressed in each jurisdiction are broadly the same, for example annual fare reviews, National Competition Policy reviews, Human Rights and Equal Opportunity Commission reviews; as well as local issues. However, because the duties performed by interstate taxi councils are performed in the ACT by CC and the CTPA - which is funded by CC - there is a disproportionate funding cost per taxi. In NSW there are in excess of 5,000 taxis contributing to the cost of industry representation and advocacy; in the ACT there are now only 241 taxis contributing to the same level of activity. That networks of similar size can, and do, vary in the fees charged is demonstrated at the top of page 31 of the Draft. As has been pointed out, two networks of a similar size (Newcastle - 158 taxis and Wollongong - 128 taxis) in the same state have fees that are such that the Newcastle fee ($10,100) is 53% higher than the Wollongong fee ($6,600). To compare fees without comparing the full services supplied, as well as the full demands imposed on each
6
network, is meaningless. In addition to economies of scale (through the size of network membership) different jurisdictions have different requirements. In the ACT the demands from Government, and other agencies, have been, and continue to be, significant and costly. It is important that the Commission recognises these costs and ratifies their inclusion in the fare setting process. These costs are incorporated in the network fee calculations provided to the Commission at each fare review. Escalation of Labour Cost Component CC supports the use of the ABS Wage Cost Index to escalate the labour cost in line with PC 3 (page 37). Price Path Duration Given the current unstable state of the ACT taxi industry with respect to outcomes from NCC Reviews and the Government’s current uncertain position, the industry agrees with the thrust of the latter part of PC 4 (page 39). That is, the industry believes that because of the current uncertain state of the future of the industry, annual fare reviews should continue as at present. Alternative Approaches to revising Taxi Fares In Section 3.2 (page 44) the Commission has reviewed approaches to fare setting it has adopted in recent times and comes up with an assessment of ‘Potential Taxi Cost Indices in Table 3.2, page 50. Each of these indices has incorporated into it an X-factor ‘which could be inserted into the index to provide incentives to improve efficiency’. The industry is opposed to the concept of building penalties referred to as ‘efficiency gains’, the so-called X-factor. While this may be seen as appropriate in large corporations such as ACTEW AGL, the application of such an approach in an industry such as the ACT taxi industry, which consists of hundreds of small business people competing amongst themselves, would be appalling.
In recent years the Commission has frozen the network fees in the fare model to the detriment of those liable for the paying of these fees. The fees have had to continue to increase and so the industry has had to absorb the cost of the added benefits received by the public as a result of the benefits evolving from the network. In one sense the Commission has introduced its X-factor already. In essence, taxi users have already received an “efficiency gain” from each and every taxi operator and driver - through the artificial depression of real fare levels by the Commission’s refusal to include full network fees within fares.
The Commission could choose whatever X-factor it liked. In the taxi industry the quality and efficiency of the service very much depends on the quality of the driver. As has been experienced in the Northern Territory the deregulation of entry bought the industry to its knees, efficiency and productivity were destroyed and safety issues resulted in such a degraded industry that the Government had to reregulate entry and introduce controls which were previously never in place. As indicated earlier in this submission, the Commission is already aware of the link between low earnings capability and compromised driver and passenger safety.
7
A contemporary illustration of the link between low fares and poor service can be seen in the media reports of the state of the taxi service in Melbourne (Attachment 2 - Herald Sun article dated 10 March 2004). The Commission has noted in its Table 3.1 (page 41) that there has been no increase in taxi fares in Melbourne for well over 3 years. Assessment of Composite Indexes With respect to PC 5 (page 51), what the Commission is doing is attempting to estimate movements in the taxi industry through an array of ABS indices. This is a surprising approach when the industry, as it has done for many years, can, and does, supply actual movements in costs. A more accurate outcome will be obtained using actual cost movements rather than trying to estimate these using ABS indices and from these building a Composite Taxi Cost Index. In the case of the composite index 5 it is noted that labour costs are at 45% and the X-factor has been subtracted. CC completely rejects the X-factor based composite taxi cost indices proposed in Table 3.2 . Also in relation to PC 5 it is noted that the Commission favours making greater use of ABS indices. While the industry supports this in the case of labour costs, it believes that actual costs, which the industry gathers each year, are a more accurate measure of reality than are adjustments made using indices.
However, when indices are, in fact, used they must all be applied over the same period of time, namely December to December. Refining the WCI Labour costs - CC supports the proposal (page 52) to adjust the labour component by the wage cost index (PC 7). However, it does not support the imposition of a fixed 50/50 relationship between labour costs and non-labour costs - as proposed by the Commission. While the industry prefers the NSW IPART approach to that of the ICRC, it does not agree that there needs to be any difficulty in calculating a base cost. There is considerable documentation available to the Commission concerning the process that Government and the industry success-fully operated for many years to determine an appropriate base for labour costs. This process was discontinued by the Commission. An example of how the process can be re-introduced is contained in the industry’s assessment of operating costs, later in this submission.
Return on investment - CC notes that the Commission is replacing the previous ‘Return on Investment’ in the formula with an ‘Interest Cost’. It is also notable, at page 56 of the Draft, that: ‘The Commission believes that the capital cost of owning or leasing plates is a legitimate cost of taxi operation.’ Having clearly stated its approach the Commission must include an appropriate interest cost based on capital borrowings. It is, therefore, inappropriate to then determine an interest cost figure based on plate rent levels as proposed in PC 7. Plate rent levels have nothing to do with interest costs.
The question arises at to what is an appropriate cost of capital. The Commission states (page 54) that, from information supplied by DUS, the average price paid by the current holders of
8
taxi plates ‘is likely to be between $160,000 and $170,000’. If the total amount of $170,000 is borrowed at 8% interest rate with the loan extending over 15 years, the total interest paid on this loan would be $120,493, or $8,032 per year. This would be a realistic cost of capital to include in the model. Notwithstanding these comments, it is important to understand that any approach taken to include any costs relating to the acquisition of taxi plates needs to be accompanied by the explicit addition of a corresponding amount to base fares. This has not happened previously. Only then can fares be adjusted to reflect movement in the value of that item. In the absence of such an explicit addition, any belief that “By including RoI in the WCI calculation, this issue will be addressed explicitly.”(page 56), is disingenuous. Network fees - In PC 8 (page 60) the Commission proposes setting network fees based on a ‘more efficient cost of operation’. As the only network representing the industry in the ACT, the fees paid by the 241 contributors are justified, despite the arguments put forward in the Draft. CC operates in a unique environment, servicing not only itself but also the requirements of Government and other agencies, including the ICRC. It is continually gathering data and other information to satisfy bureaucratic requests. CC believes that there would not be another taxi group in Australia which has supplied, and continues to supply, as much information at no charge to external organisations requiring this data. This is not properly costed into the network fee calculations proposed by the Commission. CC believes that the Commission should allow for the full costs of the network fees in the model, as this is what taxi operators are required to pay. In addition, because a large component (approximately 70%) of the network fee that is not captured in the iDispatch contract is directly attributable to salaries, superannuation (including salary sacrifice) and other cost items that are essentially labour-based, the proposed Canberra CPI escalation method, on its own, is not appropriate. Any escalation method needs to reflect the proportionate impact of the ABS WCI.
Vehicle repairs, maintenance, tyres and washing - With respect to vehicle related costs (page 65), taking a simple average of three ABS indices is not acceptable and will lead to an incorrect outcome. What has to be done is to take a weighted average of the three indices, with the weights being determined from the costs associated with each of the three listed categories. There is a legal precedent for doing this (the Austral Fisheries case). The costs for 2003 will be supplied to the Commission (with the cost of producing these data being paid for from taxi operators’ network fees).
Potential for further efficiency gain —The Commission lists examples of where efficiency or productivity gains may be present (page 68). This would appear to those in the industry to be a clash of economic theory and empirical reality. The Commission continues to expound its views on GPS job distribution without having understood the fundamental reason why a taxi driver drives a taxi - he does it to make money. So-called “dead running” is not an issue for the driver. Nor is he likely to agree with the Commission’s view that his earnings should be determined by the vagaries of his potential relative proximity to upcoming hirings with indeterminate GPS co-ordinates. The most efficient taxi in the fleet is the one that doesn’t move until it gets a hiring and doesn’t move again, after completing that hiring, until it gets its next hiring. It is also the taxi that takes the least amount of fares income. The most productive driver is often the one that encounters
9
relatively high distances travelled in order to maximise gross fares income. Earning income in a competitive industry is a function of effort, not of coincidence. Growth in SMS usage will be customer-driven. Any appropriate resolution of emerging staffing issues will naturally flow from this. At this stage, the number of customers who don’t have mobile phones or who don’t use SMS, for any communication purposes, is assessed as high. Government plans to expand the fleet will depress the earnings capabilities of taxi drivers with or without a reduction in fixed costs. If such a reduction is realised and translated to reduced fares, there is no doubt that service to customers will deteriorate commensurately. The current situation in Melbourne is a contemporary example. (Attachment 2) Improvements in relative service quality will not be encouraged by a combination of increased taxi numbers and reduced fares. Every available study of places where the high supply/low price theory has been introduced has identified failure as the outstanding result. The belief that real insurance costs are lower in other Australian jurisdictions is misplaced. For example Workers Compensation premiums in NSW are ‘capped’ and subsidised by the State Government. The Commission needs to review this suggestion - and to identify the existence of different types of insurance arrangements in those places, including taxpayer-subsidisation. Proposed weightings Comparison with weights used by IPART - CC has always had a close working relationship with the Commission and has always supplied all data as requested. CC believes this is appropriate and that by having accurate data updated each year more accurate fare adjustments can be achieved, rather than applying a large number of different ABS indices to particular components of the model envisaged in Table 4.3 (page 71). CC is concerned that the ICRC is moving towards an approach adopted by IPART in NSW where in that case the industry has not co-operated with IPART in the supply of information. Much of this is as a result of there being many networks and much of the information required might be regarded as ‘commercial-in-confidence’. As a result IPART has not been able to obtain industry data needed to conduct analyses like those in the ACT.
While Table 4.2 on page 70 is of interest, it is inappropriate to make comparisons of ACT weightings with those in NSW. As CC continually states, you have to compare ‘like-with-like’. In Table 4.3:
• As has already been indicated, all indices should be taken over the same period, namely from December to December each year. This also includes the 90 day bank bill rate in the case of interest cost, which currently runs from 1/7/03 to 9/2/04.
• Appropriate weightings will emerge when the 2003 cost figures have been analysed.
• The escalation method for network fees needs to be a combination of the Canberra CPI and the ABS WCI, to properly reflect the large impact of labour cost movements on that portion of the network fees that are not captured by the iDispatch contract.
10
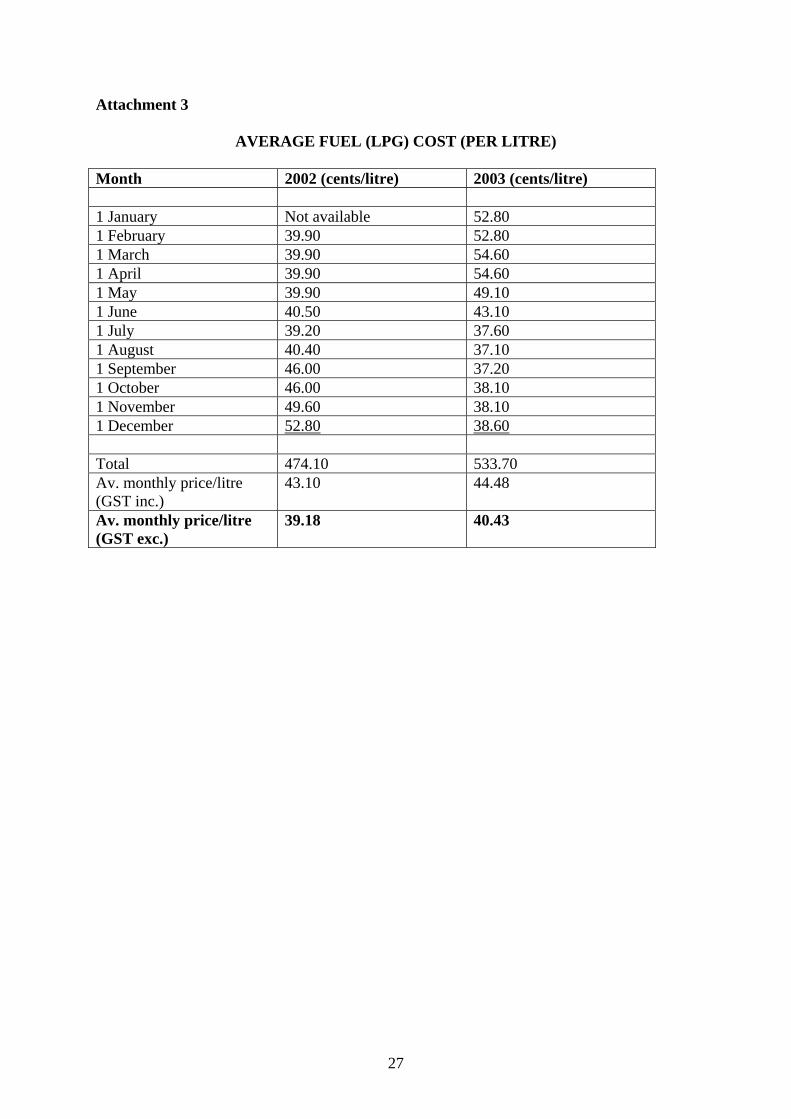
• With respect to LPG, CC believes that it is more appropriate to take average LPG prices over the year by taking the LPG price on a particular day each month averaging these twelve prices to get a price for 2003. The same should be done for 2002 and these two average prices used to determine movements in the price of LPG. CC believes this is a more accurate reflection of reality throughout the year and will help to eliminate large short-term fluctuations in LPG prices. The LPG costs on 1st of each month for 2002 and 2003 appear in Attachment 3, together with the average monthly cost for 2002 and 2003.
Fare structure issues Comparison with Queanbeyan Fare In section 5.1.2 (page 76) of the Draft the Commission has quite rightly identified a potential problem with the Queanbeyan taxis charges compared to the ACT. Their presented analysis clearly demonstrates that Queanbeyan taxis have a significant potential financial advantage in their fare structure. However, it may be that the differences between the fares reflect the differences in operating costs and profiles that apply to the separate taxi groups. If the Commission feels that it should have a fare structure so that the ACT based taxis are not financially disadvantaged with respect to their Queanbeyan counterparts, then it should propose a fundamental review of the fares that the NSW Government has approved for Queanbeyan. This could accommodate any variations to costs and revenues that the Queanbeyan taxi fleet may have experienced since becoming licenced to operate without limitation in the ACT. A more important question might arise in this context. This relates to the possibility that the Commission’s current suggestion might be seen to constitute price fixing, to the detriment of ACT consumers. Finally, the ability of taxi consumers to differentiate between taxi services based on price and service quality is a cornerstone of the theory of taxi deregulation. It is odd that the Commission should be a proponent of the removal of this pro-competition aspect of the present situation, by denying taxi users the opportunity to compare prices and make informed decisions in their selection of a taxi service. For these reasons, the industry sees no merit in the proposals implicit in PC 12 (page 77).
In Table 5.2 (page 76) CC notes the typos for the Night Fee times for both ACT and Queanbeyan.
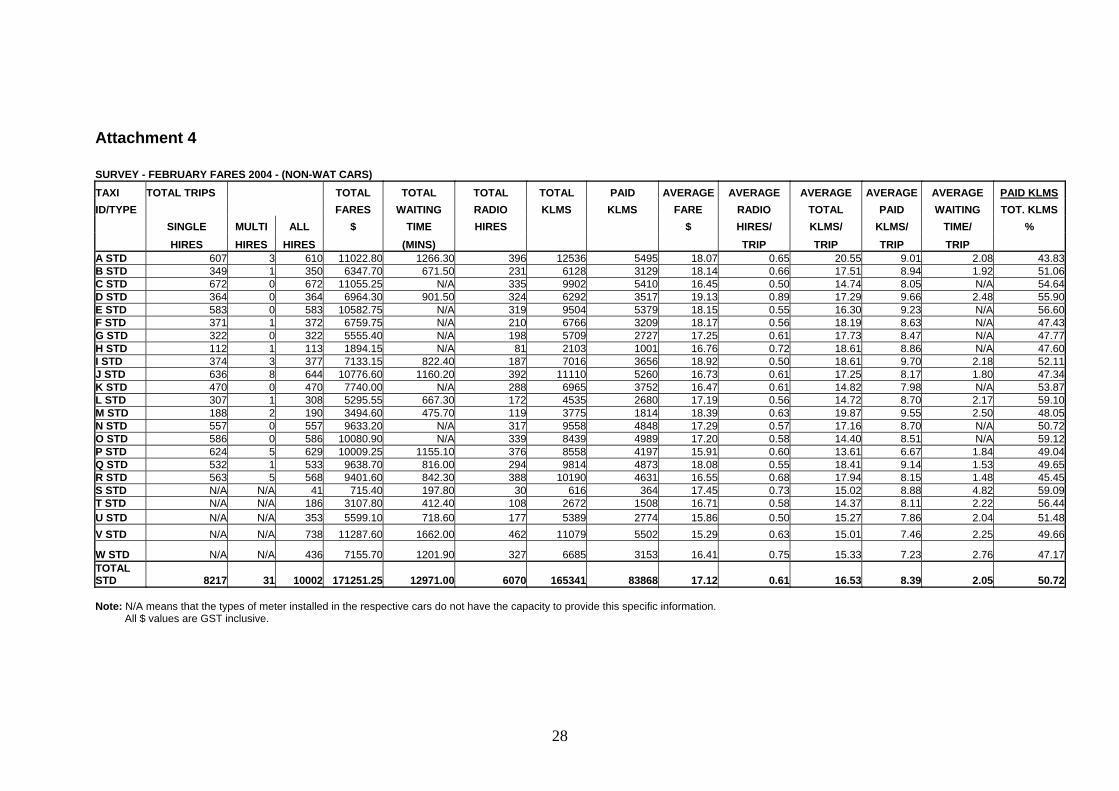
Ordinary hire flagfall There has been no change to the circumstances prevailing when the value of the flagfall was last reviewed. Consequently, no increase is again envisaged. Waiting time rates The latest Fares Survey results (Attachment 4) show an increase in waiting time per trip from 1.9 minutes in October 2001 to 2.05 minutes in February 2004. As this represents an increase of 7.9% in the time that a taxi’s income is earned in waiting mode, an appropriate increase (from $30.00 to $32.50) to the Waiting Time rate is justified.
11

Taxi booking fee For the reasons stated at page 78 of the Draft, the value of the booking fee is neither an incentive nor a disincentive for customers to move to a taxi rank or to try to hail a taxi on a main road. The decision to book a taxi is not a financial one - it is based on necessity. This has not changed since this component was last reviewed. With respect to PC 13 (page 78) CC believes that the appropriate booking fee should remain at $0.80. Multi-hire fares The Commission suggests (page 79) that the current arrangements can provide “… sizable windfalls to drivers.” It describes a theoretical situation to exemplify how this can occur. In reality, as is often the situation, the theory has not been verified. There are relatively few multi-hire situations as a proportion of total trips - about 0.38% (31 out of a recorded total of 8248 trips — Attachment 4). Of these, there are very few instances, if any, of 4 people travelling without family or work colleagues, that would enable the airport commissionaires to load 4 separate fares into one taxi. Even if there was a situation involving 4 available people, the commissionaires’ practice is to not exceed 3 people in one taxi. The issues of comfort and quality service are important to Canberra Cabs. In relation to “Survey results from the Department of Urban Services indicate significant dissatisfaction with multi-hire arrangements.” (page 79) it may be appropriate to analyse that survey information to clearly identify the size of the sample and the precise nature of the area(s) of dissatisfaction. This is not available in the Draft. In the absence of this information (or even a reference to where this information may be found) it is not possible to put the claims of a third party (Urban Services) into a proper perspective. High occupancy taxi rates In the case of PC14 (page 80) there is very little reliable information available about the frequency of HOT hirings. It was intended to measure this during the recent Fares Survey; however, this was not possible because this information is not recorded in, or retrievable from, the taxi meters. Nonetheless, a brief history of the introduction of the HOT rates may give an insight into the impact of any potential reduction in their fares income that might arise in moving from a premium based on a percentage of the fare to a fixed surcharge. In the late 1990s, Canberra Cabs provided a financial incentive (in the form of free network fees) to 6 operators to introduce HOT vehicles. The incentive was available for 4 years. The HOT fare rates were agreed by Government; and Government monitored the progress of the initiative. At the end of the 4 years only 2 HOT vehicles were still in operation. The majority of HOT operators had concluded that the cost of providing the service outweighed the income available from that particular market. This decision was taken and acted on during the period that significant financial incentives remained in place.
More recently, the HOT role has been taken over by the WAT vehicles. These vehicles continue to be supported by a significant financial incentive in the nature of the token Government lease fees. It is of interest that the operators of 3 of these vehicles have returned their plates to the Government; and that Government has acknowledged the industry’s concerns about the viability of the WAT fleet by not re-releasing those returned plates.
12
Therefore, unless the Commission intends to set the fixed surcharge at a level that actually provides increased income per fare to the HOT operator, it is likely that the fixed surcharge approach will further compromise the viability of the HOT service. A flow-on effect of this will be a further reduction in the viability of WAT operators, because they are the main providers of the HOT service. This will inevitably produce a catastrophic (even if unintended) impact on the taxi service to wheelchair taxi users. For these reasons, the suggested movement to a fixed surcharge for HOT travel is not supported. Night and weekend distance rates In section 5.1.8 (page 80) the Commission attempts to compare different hours of operation of “penalty” rates among different states. The presupposition appears to be that some jurisdictions, other than the ACT, have achieved optimal use of their taxi resource through their particular practice. This view is not supported by a factual and objective analysis of the levels of service delivered in each jurisdiction. As recently as 10 March 2004 (Attachment 2), media reports commentating on the alleged parlous state of the Melbourne taxi service would suggest that there should be no attempt made to parallel that service or any part of it. Of particular interest is the claim that 15% of the available taxis are lying idle in depots at any time. Similar comments have been made recently, and frequently in the past, about the Sydney taxi service. Media reports on the state of the taxi services in Qld and WA do not filter into the ACT — and the Commission has not offered any information to support its presupposition of optimal servicing. It is possible that the Commission’s assessment of these latter states parallels its assessments of Sydney and Melbourne. In contrast, all independent surveys of the ACT taxi industry since 1999 (when they commenced) confirm a high level of customer satisfaction. For these reasons, any change to the existing periods of operation of “penalty” rates is not supported. There is scope, however, to review the level of this premium. Table 5.3 (page 82) shows that the ACT premium is 4 percentage points below the Queanbeyan premium. This may not always have been the case. In fact, before the Commission became involved in setting ACT taxi fares, the ACT premium (and possibly its relativity to Queanbeyan) was higher. This was because the night time rate was set at a differential of 15% above the day time rate for the average trip. It was the ICRC that contracted this differential by applying it only to the dis-tance rate. Had the ICRC not taken this approach, it is probable that the premiums applying in the ACT and Queanbeyan would be comparable, though not necessarily the same dollar value.
For these reasons, a re-instatement of the night time premium at 15% above the day time rate, based on the average trip, is supported.
Social impacts of decisions At PC 17 (page 85) the Commission seeks views on the likely social impacts of fare rises. It
13

does not, but should, also seek views on the likely impacts of artificially suppressing necessary fare increases. These impacts are well documented in international and local literature that has been consistently identified to the Commission over recent years. It is clear from this volume of literature that the most vulnerable members of society, the unemployed, disabled and frail aged, are the groups most adversely affected when taxi operators and drivers are put under avoidable financial stress through misconceived Government decisions regarding both artificially suppressed fare levels and excessive taxi numbers. Once again, the present state of the taxi service in Melbourne should not be overlooked. Model for a viable Taxi Business This section identifies the components associated with a properly run taxi business. It includes a comprehensive range of costs encountered by an average taxi, together with a profile of operating activity undertaken by an average taxi. The resultant costs indicate the level of income necessary to support a viable taxi business. Costs The costs identified in this section are divided into fixed and variable costs, which are further divided (where appropriate) into costs borne by the taxi operator and those borne by the taxi driver. Each cost is separately identified and explained. Fixed Costs Vehicle Capital Costs reflects the cost of purchase of a new or used vehicle (as appropriate), together with the cost of initial modifications to the vehicle to enable it to operate as a taxi - and the cost of finance to fund that purchase and those modifications. These costs are offset against the residual value of the vehicle at the end of its functional life. Vehicle Registration Costs reflects the cost of a taxi vehicle registration together with the cost of a taxi operator’s licence (both of which are subject to annual renewal). In addition, there is the cost of inspection of the vehicle (annual), the cost of a gas leak certificate (annual) and the cost of the third party personal insurance, which accompanies registration. Driver’s Licence and Medical reflects the cost of a driver’s licence (5 year duration) and the cost of a medical examination (annual) necessary for retention of the taxi endorsement to that licence. Comprehensive Insurance reflects the cost of insuring the taxi against the normal contingencies envisaged by motor vehicle insurance policies. Demurrage Insurance reflects the cost of insuring against a total loss of income where a taxi is inoperable while undergoing repairs to damage resulting from an accident. Network Fees reflects the cost of the services provided generally by Canberra Cabs including telephone booking, radio despatch, satellite tracking, safety cameras, complaints resolution infrastructure, industry-third parties (including Government) liaison, equipment provision and
14
maintenance, marketing and individual taxi operator assistance associated with these services. The fees incorporate the outsourcing of the booking and despatch services to iDispatch.
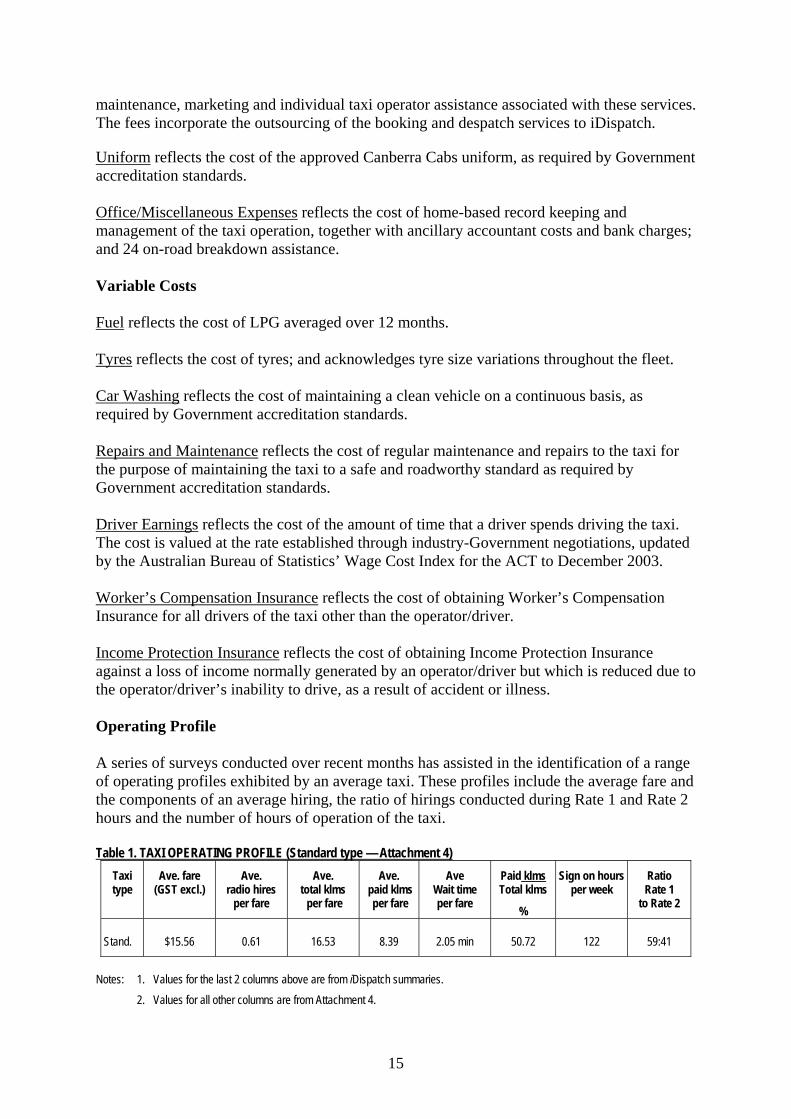
Uniform reflects the cost of the approved Canberra Cabs uniform, as required by Government accreditation standards. Office/Miscellaneous Expenses reflects the cost of home-based record keeping and management of the taxi operation, together with ancillary accountant costs and bank charges; and 24 on-road breakdown assistance. Variable Costs Fuel reflects the cost of LPG averaged over 12 months. Tyres reflects the cost of tyres; and acknowledges tyre size variations throughout the fleet. Car Washing reflects the cost of maintaining a clean vehicle on a continuous basis, as required by Government accreditation standards. Repairs and Maintenance reflects the cost of regular maintenance and repairs to the taxi for the purpose of maintaining the taxi to a safe and roadworthy standard as required by Government accreditation standards. Driver Earnings reflects the cost of the amount of time that a driver spends driving the taxi. The cost is valued at the rate established through industry-Government negotiations, updated by the Australian Bureau of Statistics’ Wage Cost Index for the ACT to December 2003. Worker’s Compensation Insurance reflects the cost of obtaining Worker’s Compensation Insurance for all drivers of the taxi other than the operator/driver. Income Protection Insurance reflects the cost of obtaining Income Protection Insurance against a loss of income normally generated by an operator/driver but which is reduced due to the operator/driver’s inability to drive, as a result of accident or illness. Operating Profile A series of surveys conducted over recent months has assisted in the identification of a range of operating profiles exhibited by an average taxi. These profiles include the average fare and the components of an average hiring, the ratio of hirings conducted during Rate 1 and Rate 2 hours and the number of hours of operation of the taxi. Table 1. TAXI OPERATING PROFILE (Standard type — Attachment 4)
Taxi type
Ave. fare (GST excl.)
Ave. radio hires
per fare
Ave. total klms per fare
Ave. paid klms per fare
Ave Wait time per fare
Paid klms Total klms
%
Sign on hours per week
Ratio Rate 1
to Rate 2
Stand. $15.56 0.61 16.53 8.39 2.05 min 50.72 122 59:41
Notes: 1. Values for the last 2 columns above are from iDispatch summaries. 2. Values for all other columns are from Attachment 4.
15

Table 2. MODEL FOR A VIABLE STANDARD TAXI
Expense Item Operator/driver business Fixed Costs Operator Expense Vehicle capital costs 6941 Vehicle registration costs 7093 Driver’s licence and medical 98 Comprehensive insurance 10006 Demurrage insurance 325 Network fees 14170 Uniform 184 Office/miscellaneous expenses 3634 Sub-total 42451 Driver Expense Driver’s licence and medical 196 Uniform 368 Sub-total 564 Fixed Costs Sub-total 43015 Variable Costs
Operator Expense Fuel 12810 Tyres 2742 Car washing 2136 Repairs and maintenance 15948 Driver earnings 29432 Worker’s compensation insurance 4870 Income protection insurance 1379 Sub-total 69317 Driver Expense Driver earnings 60336 Variable Costs Sub-total 129653 TOTAL 172668
16
Necessary Income Levels
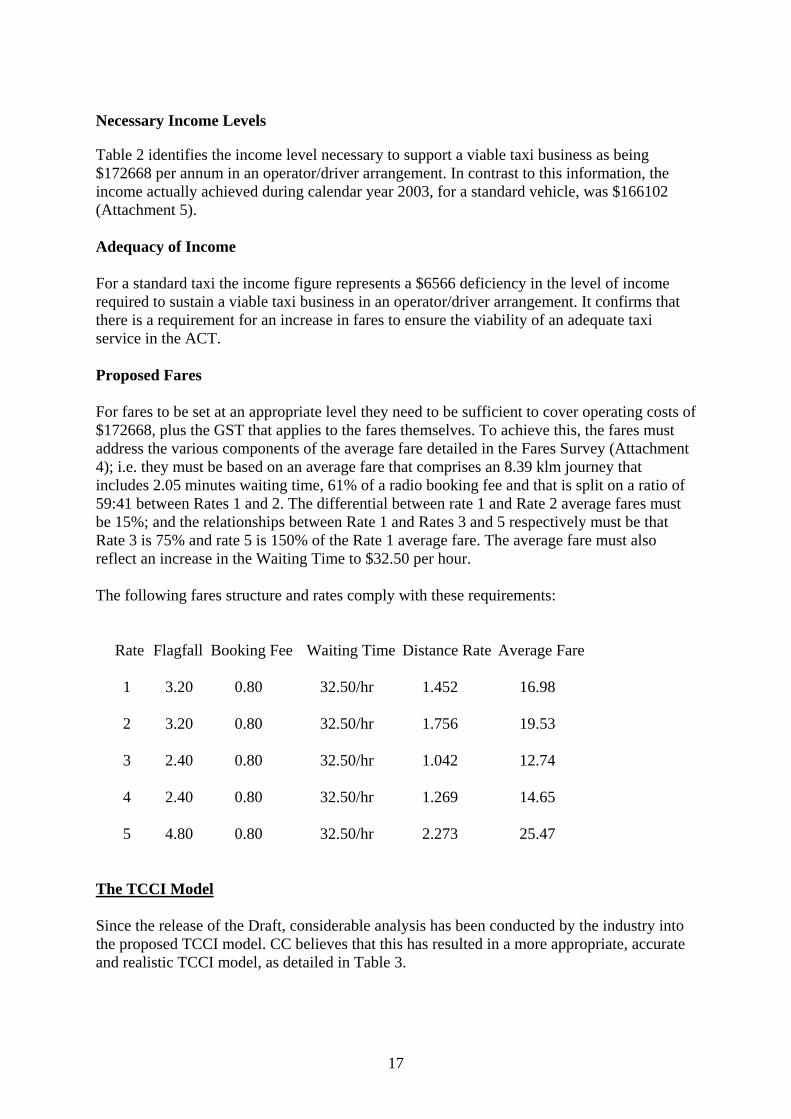
Table 2 identifies the income level necessary to support a viable taxi business as being $172668 per annum in an operator/driver arrangement. In contrast to this information, the income actually achieved during calendar year 2003, for a standard vehicle, was $166102 (Attachment 5). Adequacy of Income For a standard taxi the income figure represents a $6566 deficiency in the level of income required to sustain a viable taxi business in an operator/driver arrangement. It confirms that there is a requirement for an increase in fares to ensure the viability of an adequate taxi service in the ACT. Proposed Fares For fares to be set at an appropriate level they need to be sufficient to cover operating costs of $172668, plus the GST that applies to the fares themselves. To achieve this, the fares must address the various components of the average fare detailed in the Fares Survey (Attachment 4); i.e. they must be based on an average fare that comprises an 8.39 klm journey that includes 2.05 minutes waiting time, 61% of a radio booking fee and that is split on a ratio of 59:41 between Rates 1 and 2. The differential between rate 1 and Rate 2 average fares must be 15%; and the relationships between Rate 1 and Rates 3 and 5 respectively must be that Rate 3 is 75% and rate 5 is 150% of the Rate 1 average fare. The average fare must also reflect an increase in the Waiting Time to $32.50 per hour. The following fares structure and rates comply with these requirements: Rate Flagfall Booking Fee Waiting Time Distance Rate Average Fare 1 3.20 0.80 32.50/hr 1.452 16.98
2 3.20 0.80 32.50/hr 1.756 19.53
3 2.40 0.80 32.50/hr 1.042 12.74 4 2.40 0.80 32.50/hr 1.269 14.65 5 4.80 0.80 32.50/hr 2.273 25.47
The TCCI Model Since the release of the Draft, considerable analysis has been conducted by the industry into the proposed TCCI model. CC believes that this has resulted in a more appropriate, accurate and realistic TCCI model, as detailed in Table 3.
17
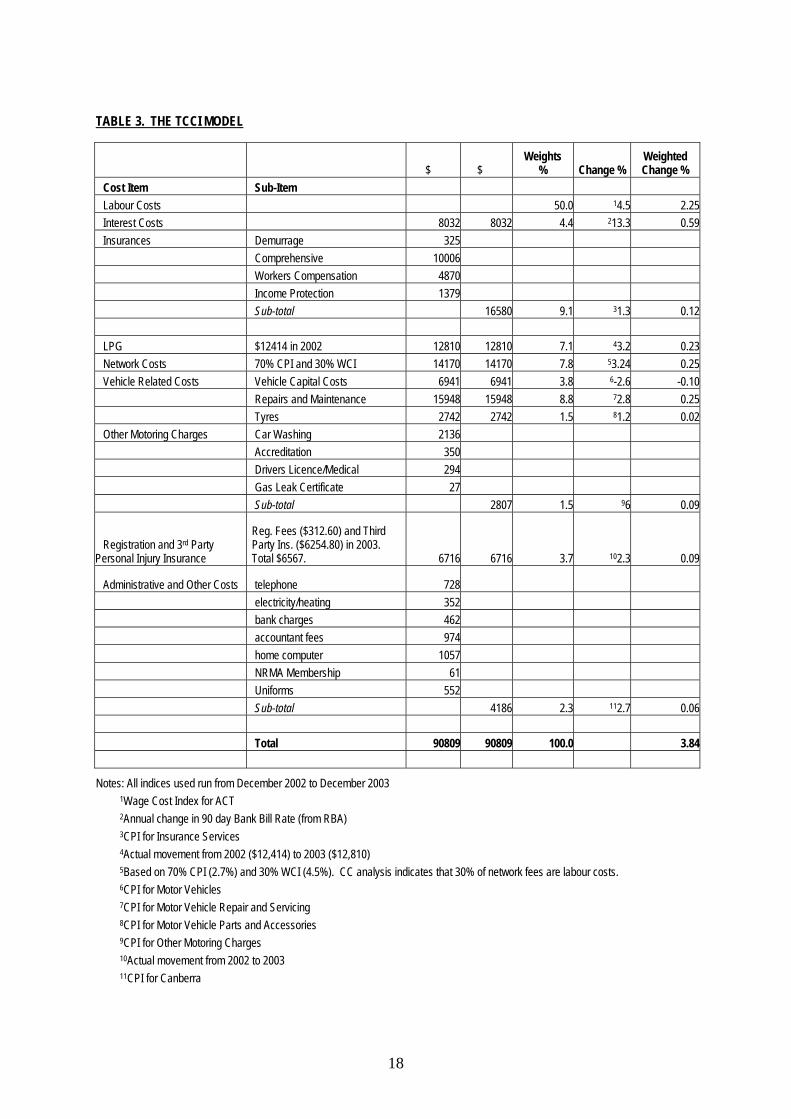
TABLE 3. THE TCCI MODEL
$ $ Weights
% Change % Weighted Change %
Cost Item Sub-Item Labour Costs 50.0 14.5 2.25Interest Costs 8032 8032 4.4 213.3 0.59Insurances Demurrage 325 Comprehensive 10006 Workers Compensation 4870 Income Protection 1379 Sub-total 16580 9.1 31.3 0.12 LPG $12414 in 2002 12810 12810 7.1 43.2 0.23Network Costs 70% CPI and 30% WCI 14170 14170 7.8 53.24 0.25Vehicle Related Costs Vehicle Capital Costs 6941 6941 3.8 6-2.6 -0.10 Repairs and Maintenance 15948 15948 8.8 72.8 0.25 Tyres 2742 2742 1.5 81.2 0.02Other Motoring Charges Car Washing 2136 Accreditation 350 Drivers Licence/Medical 294 Gas Leak Certificate 27 Sub-total 2807 1.5 96 0.09
Registration and 3rd Party Personal Injury Insurance
Reg. Fees ($312.60) and Third Party Ins. ($6254.80) in 2003. Total $6567. 6716 6716 3.7 102.3 0.09
Administrative and Other Costs telephone 728 electricity/heating 352 bank charges 462 accountant fees 974 home computer 1057 NRMA Membership 61 Uniforms 552 Sub-total 4186 2.3 112.7 0.06 Total 90809 90809 100.0 3.84
Notes: All indices used run from December 2002 to December 2003 1Wage Cost Index for ACT 2Annual change in 90 day Bank Bill Rate (from RBA) 3CPI for Insurance Services 4Actual movement from 2002 ($12,414) to 2003 ($12,810) 5Based on 70% CPI (2.7%) and 30% WCI (4.5%). CC analysis indicates that 30% of network fees are labour costs. 6CPI for Motor Vehicles 7CPI for Motor Vehicle Repair and Servicing 8CPI for Motor Vehicle Parts and Accessories 9CPI for Other Motoring Charges 10Actual movement from 2002 to 2003 11CPI for Canberra
18

It is notable that in this Table Network Costs represent 7.8% of total costs. This should be compared to NSW Country weights for Network Costs of 7% (Table 21 page 51 of the Draft). Given the extra identified network costs (in the case of the ACT taxi industry) in this response, CC believes that their Network Costs are at an appropriate level and should be given a weighting of 7.8%. The data from which Table 3 has been developed appear in Attachment 5. As has been indicated, CC strongly believes this form of the model to be more appropriate than that presented in the Draft since it is based on more accurate and up-to-date industry data. Projected Fares This TCCI model produces a 3.84% increase to current fares. As the current Rate1 average fare is $16.54 (based on the survey-derived booking fee, waiting time and paid distance criteria), the projected Rate 1 average fare is $17.18. This produces the following structure and rates: Rate Flagfall Booking Fee Waiting Time Distance Rate Average Fare 1 3.20 0.80 32.50/hr 1.476 17.18
2 3.20 0.80 32.50/hr 1.783 19.76
3 2.40 0.80 32.50/hr 1.060 12.89 4 2.40 0.80 32.50/hr 1.290 14.82 5 4.80 0.80 32.50/hr 2.309 25.77
However, as indicated earlier in this submission, these fares fail to take into account the initial inclusion of the Interest Cost component; which has an additional impact of 4.85%. The correct incorporation of this component necessitates an additional increase in these fares to properly reflect this new cost component.
19

Attachment 1 RELATIONSHIP BETWEEN FARE INCREASES AND PATRONAGE 1991 - 4.76% increase from 19 April 1991 1992 - 1.48% increase from 3 December 1992 Radio + or - + or - Radio + or - + or - Hirings prev. mth prev. year Hirings prev. mth prev. year % % % %
Jan 102600 -24.2 2.1 Jan 97000 -30.5 -5.5 Feb 125500 22.3 8.3 Feb 120100 23.8 -4.3 Mar 138200 10.1 3.1 Mar 134000 11.6 -3.0 Apr 128200 -7.2 -0.9 Apr 132345 -1.2 3.2 May 138800 8.3 -2.9 May 148305 12.1 6.8 Jun 128000 -7.8 -2.9 Jun 133854 -9.7 4.6 Jul 127700 -0.2 -3.1 Jul 134867 0.8 5.6 Aug 135700 6.3 -5.6 Aug 134358 -0.4 -1.0 Sep 132100 -2.7 1.3 Sep 141172 5.1 6.9 Oct 129100 -2.3 -4.4 Oct 153996 9.1 19.3 Nov 135400 4.9 1.2 Nov 145041 -5.8 7.1 Dec 139600 3.1 3.2 Dec 151457 4.4 8.5
Total 1,560,900 -0.5 Total 1,626,495 4.2 1993 - no change in fares 1994 - 2.35% increase from 6 July 1994 Radio + or - + or - Radio + or - + or - Hirings prev. mth prev. year Hirings prev. mth prev. year % % % %
Jan 103518 -31.7 6.7 Jan 104064 -35.0 0.5 Feb 122861 18.7 2.3 Feb 140895 35.4 14.7 Mar 142085 15.6 6.0 Mar 165325 17.3 16.4 Apr 135129 -4.9 2.1 Apr 145076 -12.2 7.4 May 148161 9.6 -0.1 May 160565 10.7 8.4 Jun 141080 -4.8 5.4 Jun 150163 -6.5 6.4 Jul 145820 3.4 8.1 Jul 149388 -0.5 2.4 Aug 147253 1.0 9.6 Aug 155894 4.4 5.9 Sep 149613 1.6 6.0 Sep 155627 -0.2 4.0 Oct 156155 4.4 1.4 Oct 154432 -0.8 -1.1 Nov 155392 -0.5 7.1 Nov 163535 5.9 5.2 Dec 160021 3.0 5.7 Dec 166161 1.6 3.8
Total 1,707,088 5.0 Total 1,811,125 6.1
20
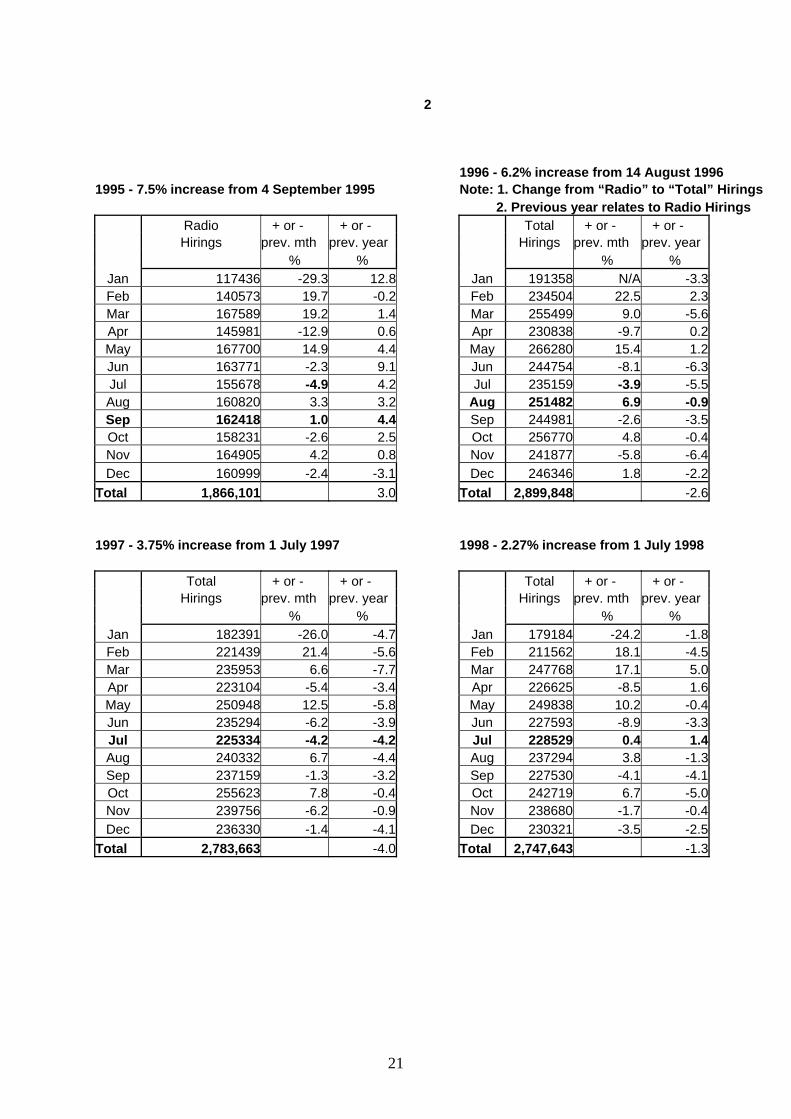
2 1996 - 6.2% increase from 14 August 1996 1995 - 7.5% increase from 4 September 1995 Note: 1. Change from “Radio” to “Total” Hirings 2. Previous year relates to Radio Hirings Radio + or - + or - Total + or - + or - Hirings prev. mth prev. year Hirings prev. mth prev. year % % % %
Jan 117436 -29.3 12.8 Jan 191358 N/A -3.3 Feb 140573 19.7 -0.2 Feb 234504 22.5 2.3 Mar 167589 19.2 1.4 Mar 255499 9.0 -5.6 Apr 145981 -12.9 0.6 Apr 230838 -9.7 0.2 May 167700 14.9 4.4 May 266280 15.4 1.2 Jun 163771 -2.3 9.1 Jun 244754 -8.1 -6.3 Jul 155678 -4.9 4.2 Jul 235159 -3.9 -5.5 Aug 160820 3.3 3.2 Aug 251482 6.9 -0.9 Sep 162418 1.0 4.4 Sep 244981 -2.6 -3.5 Oct 158231 -2.6 2.5 Oct 256770 4.8 -0.4 Nov 164905 4.2 0.8 Nov 241877 -5.8 -6.4 Dec 160999 -2.4 -3.1 Dec 246346 1.8 -2.2
Total 1,866,101 3.0 Total 2,899,848 -2.6 1997 - 3.75% increase from 1 July 1997 1998 - 2.27% increase from 1 July 1998 Total + or - + or - Total + or - + or - Hirings prev. mth prev. year Hirings prev. mth prev. year % % % %
Jan 182391 -26.0 -4.7 Jan 179184 -24.2 -1.8 Feb 221439 21.4 -5.6 Feb 211562 18.1 -4.5 Mar 235953 6.6 -7.7 Mar 247768 17.1 5.0 Apr 223104 -5.4 -3.4 Apr 226625 -8.5 1.6 May 250948 12.5 -5.8 May 249838 10.2 -0.4 Jun 235294 -6.2 -3.9 Jun 227593 -8.9 -3.3 Jul 225334 -4.2 -4.2 Jul 228529 0.4 1.4 Aug 240332 6.7 -4.4 Aug 237294 3.8 -1.3 Sep 237159 -1.3 -3.2 Sep 227530 -4.1 -4.1 Oct 255623 7.8 -0.4 Oct 242719 6.7 -5.0 Nov 239756 -6.2 -0.9 Nov 238680 -1.7 -0.4 Dec 236330 -1.4 -4.1 Dec 230321 -3.5 -2.5
Total 2,783,663 -4.0 Total 2,747,643 -1.3
21

3 1999 - 2.3% increase from 1 July 1999 2000 - 7.71% increase from 1 July 2000 Total + or - + or - Total + or - + or - Hirings prev. mth prev. year Hirings prev. mth prev. year % % % %
Jan 174251 -27.0 -2.8 Jan 171469 -25.3 -1.6 Feb 211325 21.3 -0.1 Feb 217915 27.1 3.1 Mar 247863 17.3 0.0 Mar 251931 15.6 1.6 Apr 223331 -9.9 -1.5 Apr 227636 -9.6 1.9 May 238835 6.9 -4.4 May 250118 9.9 4.7 Jun 232869 -2.5 2.3 Jun 248091 -0.8 6.5 Jul 236419 1.5 3.5 Jul 226570 -8.7 -4.2 Aug 243910 3.2 2.8 Aug 236246 4.3 -3.1 Sep 245057 0.5 7.7 Sep 209868 -11.2 -14.4 Oct 252444 3.0 4.0 Oct 232002 10.5 -8.1 Nov 241544 -4.3 1.2 Nov 238722 2.9 -1.2 Dec 229435 -5.0 -0.4 Dec 217351 -9.0 -5.3
Total 2,777,283 1.1 Total 2,727,919 -2.6 2001 - 5.5% increase from 1 July 2001 2002 - 3.0% increase from 1 July 2002 Total + or - + or - Total + or - + or - Hirings prev. mth prev. year Hirings prev. mth prev. year % % % %
Jan 168662 -22.4 -1.6 Jan 145633 -23.0 -13.7 Feb 204230 21.1 -6.3 Feb 184917 27.0 -9.5 Mar 238840 16.9 -5.2 Mar 205296 11.0 -14.0 Apr 211476 -11.5 -7.1 Apr 184988 -9.9 -12.5 May 233494 10.4 -6.6 May 208009 12.4 -10.9 Jun 224297 -3.9 -9.6 Jun 207620 -0.2 -7.4 Jul 209236 -6.7 -7.7 Jul 190845 -8.1 -8.8 Aug 217295 3.9 -8.0 Aug N/A N/A N/A Sep 200164 -7.9 -4.6 Sep 188403 N/A -5.9 Oct 190994 -4.6 -17.7 Oct 197381 4.8 3.3 Nov 193552 1.3 -18.9 Nov 202285 2.5 4.5 Dec 189062 -2.3 -13.0 Dec 199877 -1.2 5.7
Total 2,481,302 -9.0 Total 2,115,254 N/A
22
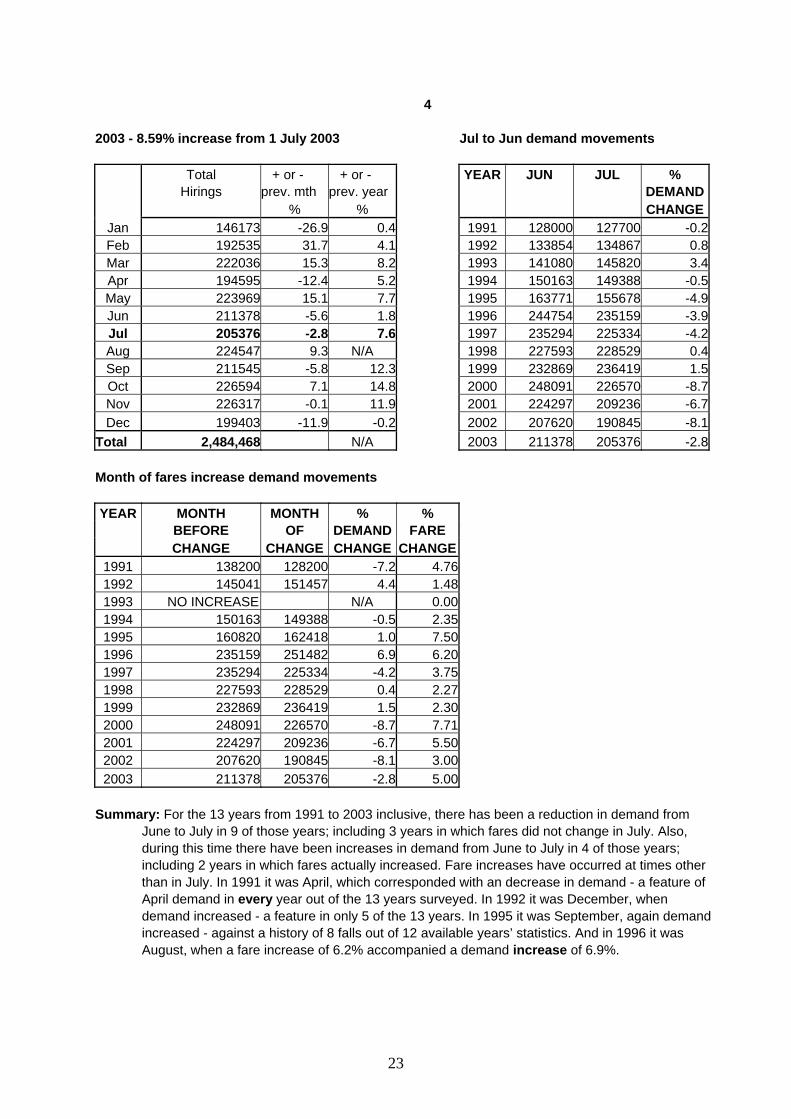
4 2003 - 8.59% increase from 1 July 2003 Jul to Jun demand movements Total + or - + or - YEAR JUN JUL % Hirings prev. mth prev. year DEMAND % % CHANGE
Jan 146173 -26.9 0.4 1991 128000 127700 -0.2 Feb 192535 31.7 4.1 1992 133854 134867 0.8 Mar 222036 15.3 8.2 1993 141080 145820 3.4 Apr 194595 -12.4 5.2 1994 150163 149388 -0.5 May 223969 15.1 7.7 1995 163771 155678 -4.9 Jun 211378 -5.6 1.8 1996 244754 235159 -3.9 Jul 205376 -2.8 7.6 1997 235294 225334 -4.2 Aug 224547 9.3 N/A 1998 227593 228529 0.4 Sep 211545 -5.8 12.3 1999 232869 236419 1.5 Oct 226594 7.1 14.8 2000 248091 226570 -8.7 Nov 226317 -0.1 11.9 2001 224297 209236 -6.7 Dec 199403 -11.9 -0.2 2002 207620 190845 -8.1
Total 2,484,468 N/A 2003 211378 205376 -2.8 Month of fares increase demand movements YEAR MONTH MONTH % %
BEFORE OF DEMAND FARE CHANGE CHANGE CHANGE CHANGE
1991 138200 128200 -7.2 4.76 1992 145041 151457 4.4 1.48 1993 NO INCREASE N/A 0.00 1994 150163 149388 -0.5 2.35 1995 160820 162418 1.0 7.50 1996 235159 251482 6.9 6.20 1997 235294 225334 -4.2 3.75 1998 227593 228529 0.4 2.27 1999 232869 236419 1.5 2.30 2000 248091 226570 -8.7 7.71 2001 224297 209236 -6.7 5.50 2002 207620 190845 -8.1 3.00 2003 211378 205376 -2.8 5.00
Summary: For the 13 years from 1991 to 2003 inclusive, there has been a reduction in demand from June to July in 9 of those years; including 3 years in which fares did not change in July. Also, during this time there have been increases in demand from June to July in 4 of those years; including 2 years in which fares actually increased. Fare increases have occurred at times other than in July. In 1991 it was April, which corresponded with an decrease in demand - a feature of April demand in every year out of the 13 years surveyed. In 1992 it was December, when demand increased - a feature in only 5 of the 13 years. In 1995 it was September, again demand increased - against a history of 8 falls out of 12 available years’ statistics. And in 1996 it was August, when a fare increase of 6.2% accompanied a demand increase of 6.9%.
23
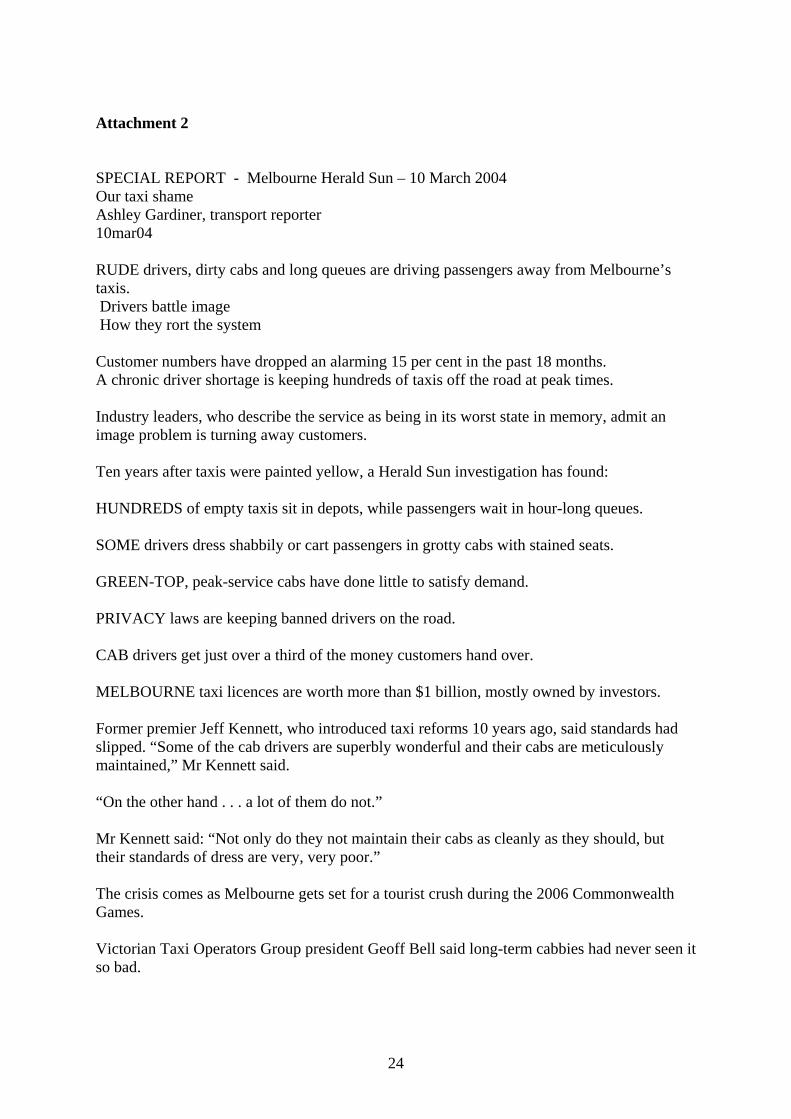
Attachment 2 SPECIAL REPORT - Melbourne Herald Sun – 10 March 2004 Our taxi shame Ashley Gardiner, transport reporter 10mar04 RUDE drivers, dirty cabs and long queues are driving passengers away from Melbourne’s taxis. Drivers battle image How they rort the system Customer numbers have dropped an alarming 15 per cent in the past 18 months. A chronic driver shortage is keeping hundreds of taxis off the road at peak times. Industry leaders, who describe the service as being in its worst state in memory, admit an image problem is turning away customers. Ten years after taxis were painted yellow, a Herald Sun investigation has found: HUNDREDS of empty taxis sit in depots, while passengers wait in hour-long queues. SOME drivers dress shabbily or cart passengers in grotty cabs with stained seats. GREEN-TOP, peak-service cabs have done little to satisfy demand. PRIVACY laws are keeping banned drivers on the road. CAB drivers get just over a third of the money customers hand over. MELBOURNE taxi licences are worth more than $1 billion, mostly owned by investors. Former premier Jeff Kennett, who introduced taxi reforms 10 years ago, said standards had slipped. “Some of the cab drivers are superbly wonderful and their cabs are meticulously maintained,” Mr Kennett said. “On the other hand . . . a lot of them do not.” Mr Kennett said: “Not only do they not maintain their cabs as cleanly as they should, but their standards of dress are very, very poor.” The crisis comes as Melbourne gets set for a tourist crush during the 2006 Commonwealth Games. Victorian Taxi Operators Group president Geoff Bell said long-term cabbies had never seen it so bad.
24

“Associates of mine who have been in the industry for 40 years have never known it to be in such a critical state,” said Mr Bell, who represents businesses that lease taxi licences. Problems getting taxis during peak times were due to a shortage of drivers, not of taxis. Industry chiefs claim several hundred extra drivers are needed. Poor pay, long hours and offensive passengers also deter candidates. Victorian Taxi Association chief executive Neil Sach said patronage had slumped by 15 per cent over the last 18 months. He said a minority of slack drivers needed to be weeded out. “Five per cent of drivers should get the a...,” Mr Sach said. “People who come across the 5 per cent will tell all their mates, friends and family. “They’ll say, ‘Oh gee, I’ve had a terrible taxi ride. The guy couldn’t drive, he was smoking . . . don’t take taxis’. “The industry has a very bad habit of white-anting itself by not complying with normal expectations. But it’s from a minority. There is an image problem.” Mr Sach said up to 15 per cent of Melbourne’s 3500 taxis were without a driver at any given time. At 10pm on Saturday, just 1495 of a taxi company’s fleet of 1700 were on the road. By 2am Sunday, this figure was 1406. The government regulator, the Victorian Taxi Directorate, was failing to adequately police the industry, Mr Sach said. A small number of taxis had unlicensed drivers. “A taxi operator doesn’t know if a driver has lost his licence,” Mr Sach said. “Under privacy rules, the owner of the cab can’t find out.” Unlicensed drivers can log into the dispatch system using another driver’s ID number and PIN. One driver’s number was recently logged on for more than 48 continuous hours, a source said. Mr Kennett said the Government was not giving the industry the attention he gave it in the 1990s. “Maybe that’s understandable, because in one sense the cab changes represented a Kennettism.”
25

But parliamentary secretary for infrastructure Carlo Carli, who heads the State Government’s taxi reform working party, said the industry was moving out of its slump. He said the industry had been flat after September 11 and the SARS alarm. “But all indications are it is picking up.” At $334,000 each and rising, Melbourne taxi licences are a sought-after investment. With 3507 licences in Melbourne, nearly $1.2 billion is tied up in licences and 60 per cent are owned by people not directly in the industry. Mr Carli said too many licences were owned by investors who were driving up their price. Mr Carli said the Government made no apologies for trying to drive down the value of licences with the new green-top licences. There are 100 green-top cabs, which can operate only between 3pm and 7am and another 100 would be introduced soon, he said.
26
Attachment 3
AVERAGE FUEL (LPG) COST (PER LITRE) Month 2002 (cents/litre) 2003 (cents/litre) 1 January Not available 52.80 1 February 39.90 52.80 1 March 39.90 54.60 1 April 39.90 54.60 1 May 39.90 49.10 1 June 40.50 43.10 1 July 39.20 37.60 1 August 40.40 37.10 1 September 46.00 37.20 1 October 46.00 38.10 1 November 49.60 38.10 1 December 52.80 38.60 Total 474.10 533.70 Av. monthly price/litre (GST inc.)
43.10 44.48
Av. monthly price/litre (GST exc.)
39.18 40.43
27
Attachment 4 SURVEY - FEBRUARY FARES 2004 - (NON-WAT CARS) TAXI TOTAL TRIPS TOTAL TOTAL TOTAL TOTAL PAID AVERAGE AVERAGE AVERAGE AVERAGE AVERAGE PAID KLMS ID/TYPE FARES WAITING RADIO KLMS KLMS FARE RADIO TOTAL PAID WAITING TOT. KLMS SINGLE MULTI ALL $ TIME HIRES $ HIRES/ KLMS/ KLMS/ TIME/ % HIRES HIRES HIRES (MINS) TRIP TRIP TRIP TRIP A STD 607 3 610 11022.80 1266.30 396 12536 5495 18.07 0.65 20.55 9.01 2.08 43.83B STD 349 1 350 6347.70 671.50 231 6128 3129 18.14 0.66 17.51 8.94 1.92 51.06C STD 672 0 672 11055.25 N/A 335 9902 5410 16.45 0.50 14.74 8.05 N/A 54.64D STD 364 0 364 6964.30 901.50 324 6292 3517 19.13 0.89 17.29 9.66 2.48 55.90E STD 583 0 583 10582.75 N/A 319 9504 5379 18.15 0.55 16.30 9.23 N/A 56.60F STD 371 1 372 6759.75 N/A 210 6766 3209 18.17 0.56 18.19 8.63 N/A 47.43G STD 322 0 322 5555.40 N/A 198 5709 2727 17.25 0.61 17.73 8.47 N/A 47.77H STD 112 1 113 1894.15 N/A 81 2103 1001 16.76 0.72 18.61 8.86 N/A 47.60I STD 374 3 377 7133.15 822.40 187 7016 3656 18.92 0.50 18.61 9.70 2.18 52.11J STD 636 8 644 10776.60 1160.20 392 11110 5260 16.73 0.61 17.25 8.17 1.80 47.34K STD 470 0 470 7740.00 N/A 288 6965 3752 16.47 0.61 14.82 7.98 N/A 53.87L STD 307 1 308 5295.55 667.30 172 4535 2680 17.19 0.56 14.72 8.70 2.17 59.10M STD 188 2 190 3494.60 475.70 119 3775 1814 18.39 0.63 19.87 9.55 2.50 48.05N STD 557 0 557 9633.20 N/A 317 9558 4848 17.29 0.57 17.16 8.70 N/A 50.72O STD 586 0 586 10080.90 N/A 339 8439 4989 17.20 0.58 14.40 8.51 N/A 59.12P STD 624 5 629 10009.25 1155.10 376 8558 4197 15.91 0.60 13.61 6.67 1.84 49.04Q STD 532 1 533 9638.70 816.00 294 9814 4873 18.08 0.55 18.41 9.14 1.53 49.65R STD 563 5 568 9401.60 842.30 388 10190 4631 16.55 0.68 17.94 8.15 1.48 45.45S STD N/A N/A 41 715.40 197.80 30 616 364 17.45 0.73 15.02 8.88 4.82 59.09T STD N/A N/A 186 3107.80 412.40 108 2672 1508 16.71 0.58 14.37 8.11 2.22 56.44U STD N/A N/A 353 5599.10 718.60 177 5389 2774 15.86 0.50 15.27 7.86 2.04 51.48V STD N/A N/A 738 11287.60 1662.00 462 11079 5502 15.29 0.63 15.01 7.46 2.25 49.66
W STD N/A N/A 436 7155.70 1201.90 327 6685 3153 16.41 0.75 15.33 7.23 2.76 47.17TOTAL STD 8217 31 10002 171251.25 12971.00 6070 165341 83868 17.12 0.61 16.53 8.39 2.05 50.72
Note: N/A means that the types of meter installed in the respective cars do not have the capacity to provide this specific information.
All $ values are GST inclusive.
28

Attachment 5 2004 COST AND REVENUE SUMMARY – STANDARD TAXIS Calculations – Fixed Costs
1. Vehicle Capital Costs i) Value of vehicle (prices are GST inclusive) New vehicles (retained for 5 years) 70% of fleet (LPG equipment factory fitted) = {[{($36060 + $470 + $600) @ 8.0%pa} – $3439] / 5} x 0.7 = {[($37130 @ 8.0%) - $3439] / 5} x 0.7 = {($706 x 60 - $3439) / 5} x 0.7 = {$38921 / 5} x 0.7 = $5449
2 year old used vehicles (retained for 4 years) 25% of fleet = {[{($18700 + $2273 + $470 + $600) @ 8.0%pa} – $1749] / 4} x 0.25 = {[($22043 @ 8.0%) - $2853] / 4} x 0.25 = {($488 x 48 -$2853) /4} x 0.25 = {$20571 / 4} x 0.25 =$1286 3 year old vehicles (retained for 4 years) 5% of fleet = {({[$14150 + $2273 + $470 + $600} @ 8.0%} – $2159) / 4} x 0.05 = {({$17493 @ 8%} - $2159) / 4} x 0.05 = {({$389 x 48} - $2159) / 4} x 0.05 = {$16513 / 4} x 0.05 = $206
Total annual cost ($5449 + $1286 + $206) = $6941
ii) Gas conversion (GST exclusive):- Impco conversion cost - $2136 Vialle conversion cost - $2409 Average conversion cost $2273.00 iii) In car electronics (GST exclusive):- Remove/install Sigtec radio equipment - $ 400 Remove/install EFPTOS equipment - $ 70 $470.00 iv) Supply/fit Schmidt meter $600.00 2. Vehicle Registration Costs i) Gas leak certificate (GST exclusive) $27.00 ii) Registration Fees (No GST applicable) – registration fee (with gas) $270.40
– Road rescue fee/safety contrib. $ 18.00 – Inspection fee $ 36.30 $324.70
iii) Third Party Personal Insurance Premium (GST inclusive) = $6391.20
29
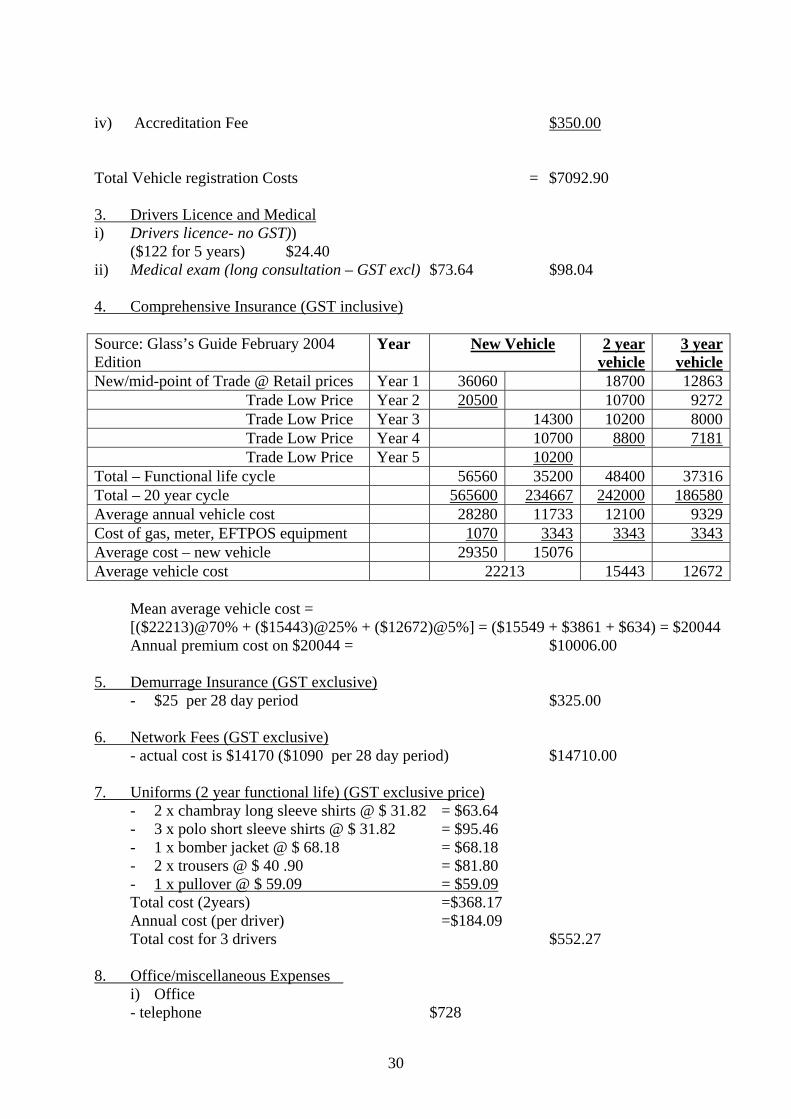
iv) Accreditation Fee $350.00
Total Vehicle registration Costs = $7092.90
3. Drivers Licence and Medical i) Drivers licence- no GST)) ($122 for 5 years) $24.40 ii) Medical exam (long consultation – GST excl) $73.64 $98.04 4. Comprehensive Insurance (GST inclusive) Source: Glass’s Guide February 2004 Edition
Year New Vehicle 2 year vehicle
3 year vehicle
New/mid-point of Trade @ Retail prices Year 1 36060 18700 12863 Trade Low Price Year 2 20500 10700 9272 Trade Low Price Year 3 14300 10200 8000 Trade Low Price Year 4 10700 8800 7181 Trade Low Price Year 5 10200 Total – Functional life cycle 56560 35200 48400 37316Total – 20 year cycle 565600 234667 242000 186580Average annual vehicle cost 28280 11733 12100 9329Cost of gas, meter, EFTPOS equipment 1070 3343 3343 3343Average cost – new vehicle 29350 15076 Average vehicle cost 22213 15443 12672
Mean average vehicle cost = [($22213)@70% + ($15443)@25% + ($12672)@5%] = ($15549 + $3861 + $634) = $20044 Annual premium cost on $20044 = $10006.00
5. Demurrage Insurance (GST exclusive)
- $25 per 28 day period $325.00
6. Network Fees (GST exclusive) - actual cost is $14170 ($1090 per 28 day period) $14710.00 7. Uniforms (2 year functional life) (GST exclusive price)
- 2 x chambray long sleeve shirts @ $ 31.82 = $63.64 - 3 x polo short sleeve shirts @ $ 31.82 = $95.46 - 1 x bomber jacket @ $ 68.18 = $68.18 - 2 x trousers @ $ 40 .90 = $81.80 - 1 x pullover @ $ 59.09 = $59.09 Total cost (2years) =$368.17 Annual cost (per driver) =$184.09 Total cost for 3 drivers $552.27
8. Office/miscellaneous Expenses
i) Office - telephone $728
30
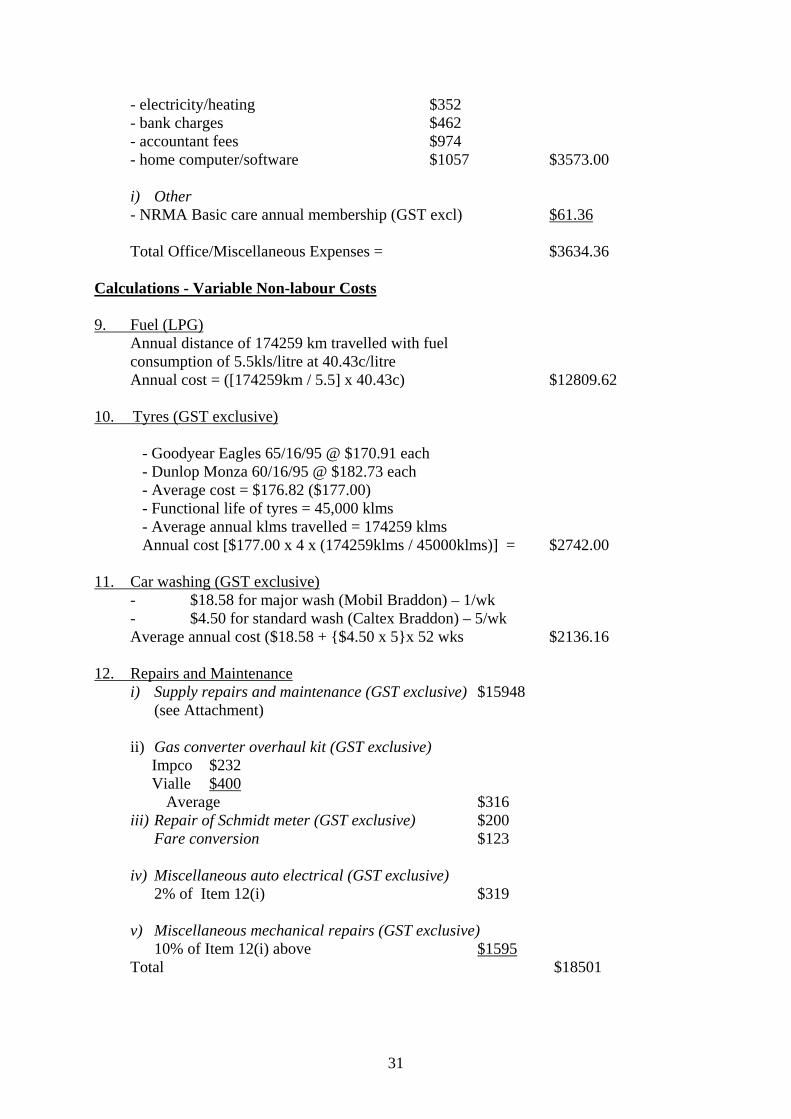
- electricity/heating $352 - bank charges $462 - accountant fees $974 - home computer/software $1057 $3573.00
i) Other - NRMA Basic care annual membership (GST excl) $61.36 Total Office/Miscellaneous Expenses = $3634.36
Calculations - Variable Non-labour Costs 9. Fuel (LPG)
Annual distance of 174259 km travelled with fuel consumption of 5.5kls/litre at 40.43c/litre Annual cost = ([174259km / 5.5] x 40.43c) $12809.62
10. Tyres (GST exclusive)
- Goodyear Eagles 65/16/95 @ $170.91 each - Dunlop Monza 60/16/95 @ $182.73 each - Average cost = $176.82 ($177.00) - Functional life of tyres = 45,000 klms - Average annual klms travelled = 174259 klms Annual cost [$177.00 x 4 x (174259klms / 45000klms)] = $2742.00
11. Car washing (GST exclusive)
- $18.58 for major wash (Mobil Braddon) – 1/wk - $4.50 for standard wash (Caltex Braddon) – 5/wk Average annual cost ($18.58 + {$4.50 x 5}x 52 wks $2136.16
12. Repairs and Maintenance i) Supply repairs and maintenance (GST exclusive) $15948
(see Attachment)
ii) Gas converter overhaul kit (GST exclusive) Impco $232 Vialle $400 Average $316 iii) Repair of Schmidt meter (GST exclusive) $200 Fare conversion $123 iv) Miscellaneous auto electrical (GST exclusive) 2% of Item 12(i) $319 v) Miscellaneous mechanical repairs (GST exclusive) 10% of Item 12(i) above $1595 Total $18501
31

13. Operator/Driver - Earnings In an operator/driver business the operator earnings figure is based on an operator/driver driving 40 hours per week for 52 weeks per year. The cost of the hours actually driven by the operator/driver is $29432.00. (52 weeks @ $566.00/week. The hourly rate is $14.15.)
14. Bailee Drivers - Earnings
In an operator/driver business there are two principal bailee drivers each driving 41 hours per week for 52 weeks per year. At $566.00 per 41 hour week the cost of this labour of 4264 hours is $60335.60.
15. Workers Compensation Insurance
In an operator/driver business where bailee drivers retain earnings of $60335.60 the cost of this insurance is $4870. [calculation: ($60335.60 x 7.93%) + $85.00 admin fee = $4869.61]
16. Income Protection Insurance (GST exempt) Annual premium figures (below) cover 75% (18527) of annual operator/driver earnings of $26036.00. Calculations:- Operator/driver over 30 years $917.00 per annum Operator/driver over 40 years $977.00 per annum Operator/driver over 50 years $1767.00 per annum Average annual premium =$1220.00 Based on an adjusted earnings of $29432, a pro-rata premium = $1379.13 Note: The adjusted earnings value was assessed after the quote had been obtained for the previous (lower) figure.
Part 4: Source of Information and Explanations Fixed Costs 1. Vehicle Capital Costs
i) Value of vehicle
source for vehicle prices: Glass’s Guide – February 2004 edition (prices are GST inclusive); source for interest rate: Commonwealth Bank Finance Company (phone 1800 811446).
- Lease interest rate is 8.00% over 5 years) - Depreciation/residual value is 37.5% -
ii) Gas conversion (source GAS TUNE written response dated 9/1/03) iii) Remove/install/repair “in car” electronics (source: written quote from Premier Instruments undated) iv) Supply and fit Meter
32

(source: written quote from Premier Instruments)
2. Vehicle Registration Costs i) Gas leak certificate. The quote is $30 for an annual inspection. (source: written response from GAS TUNE)
ii) Registration Fees
(source: Motor Registry (ph 62077000) and Dept. of Urban Services – ph 62071423) 3. Drivers Licence and Medical
source:- a) Drivers licence - (telephone advice from Motor Registry - 62077000)
b) Medical exam – Health Services Australia (ph 62692001) - $81.00 ($73.64 GST excl).
4. Comprehensive Insurance
source: Vehicle prices obtained from Glass’ Guide February 2003 edition. New vehicle price is based on new/mid point. Used vehicle prices are based on Trade low price. Annual premium cost obtained from Lumleys General Insurance and based on the average cost of a vehicle plus equipment (as per calculation at Item 2). {NOTE – annual premium includes 3rd Party Property Insurance})
5. Demurrage Insurance (source: Canberra Cabs) 6. Network Fees (GST exclusive) (source: Annual fee retained at 2001 level of $12454 as per ICRC 2002 Final Report. (actual cost is $14170 ($1090 GST excl. per 28 day period) 7. Uniforms (2 year functional life) (GST exclusive price) (source: Canberra Cabs Social Club)
8. Office/Miscellaneous Expenses
i) Telephone: ABS - Telecommunications 8 capital cities CPI index increase of 1.1% from Dec 2002 to Dec 2003. ii) Electricity/Heating: ABS -Housing 8 capital cities index increase of 5.1% from Dec 2002 to Dec 2003. iii) Bank charges: ABS - Calculated by applying CPI Dec 2002 to Dec 2003 increase of 2.7% to previous year. iv) Accountant Fees: ABS – “Full time adult total earnings” trend series for all persons for Aug 2003 was $974.30. v) Home computer: ABS - Calculated by applying CPI Dec 2002 to Dec 2003 increase of 2.7% to previous year. vi) NRMA membership – NRMA (ph 132132)
Variable Costs 9. Fuel
(source: Canberra Cabs and iDispatch)
33
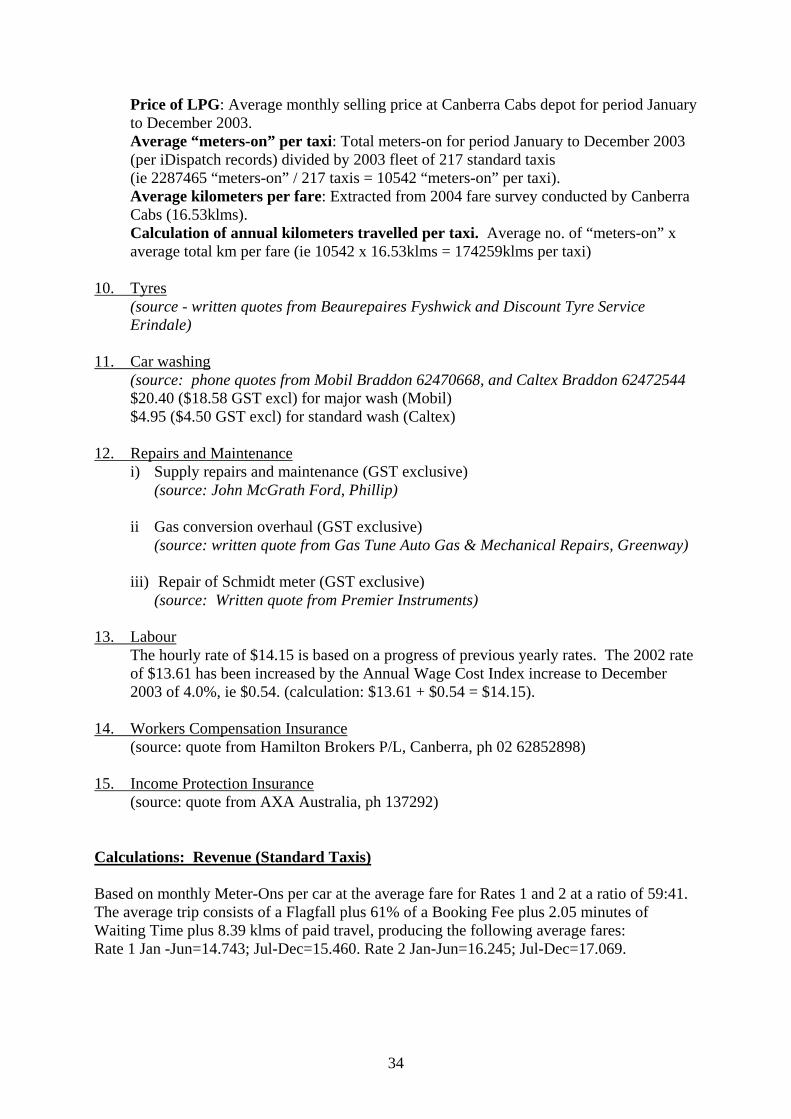
Price of LPG: Average monthly selling price at Canberra Cabs depot for period January to December 2003. Average “meters-on” per taxi: Total meters-on for period January to December 2003 (per iDispatch records) divided by 2003 fleet of 217 standard taxis (ie 2287465 “meters-on” / 217 taxis = 10542 “meters-on” per taxi). Average kilometers per fare: Extracted from 2004 fare survey conducted by Canberra Cabs (16.53klms). Calculation of annual kilometers travelled per taxi. Average no. of “meters-on” x average total km per fare (ie 10542 x 16.53klms = 174259klms per taxi)
10. Tyres
(source - written quotes from Beaurepaires Fyshwick and Discount Tyre Service Erindale)
11. Car washing (source: phone quotes from Mobil Braddon 62470668, and Caltex Braddon 62472544
$20.40 ($18.58 GST excl) for major wash (Mobil) $4.95 ($4.50 GST excl) for standard wash (Caltex)
12. Repairs and Maintenance i) Supply repairs and maintenance (GST exclusive) (source: John McGrath Ford, Phillip)
ii Gas conversion overhaul (GST exclusive) (source: written quote from Gas Tune Auto Gas & Mechanical Repairs, Greenway) iii) Repair of Schmidt meter (GST exclusive)
(source: Written quote from Premier Instruments)
13. Labour The hourly rate of $14.15 is based on a progress of previous yearly rates. The 2002 rate of $13.61 has been increased by the Annual Wage Cost Index increase to December 2003 of 4.0%, ie $0.54. (calculation: $13.61 + $0.54 = $14.15).
14. Workers Compensation Insurance (source: quote from Hamilton Brokers P/L, Canberra, ph 02 62852898) 15. Income Protection Insurance (source: quote from AXA Australia, ph 137292) Calculations: Revenue (Standard Taxis) Based on monthly Meter-Ons per car at the average fare for Rates 1 and 2 at a ratio of 59:41. The average trip consists of a Flagfall plus 61% of a Booking Fee plus 2.05 minutes of Waiting Time plus 8.39 klms of paid travel, producing the following average fares: Rate 1 Jan -Jun=14.743; Jul-Dec=15.460. Rate 2 Jan-Jun=16.245; Jul-Dec=17.069.
34
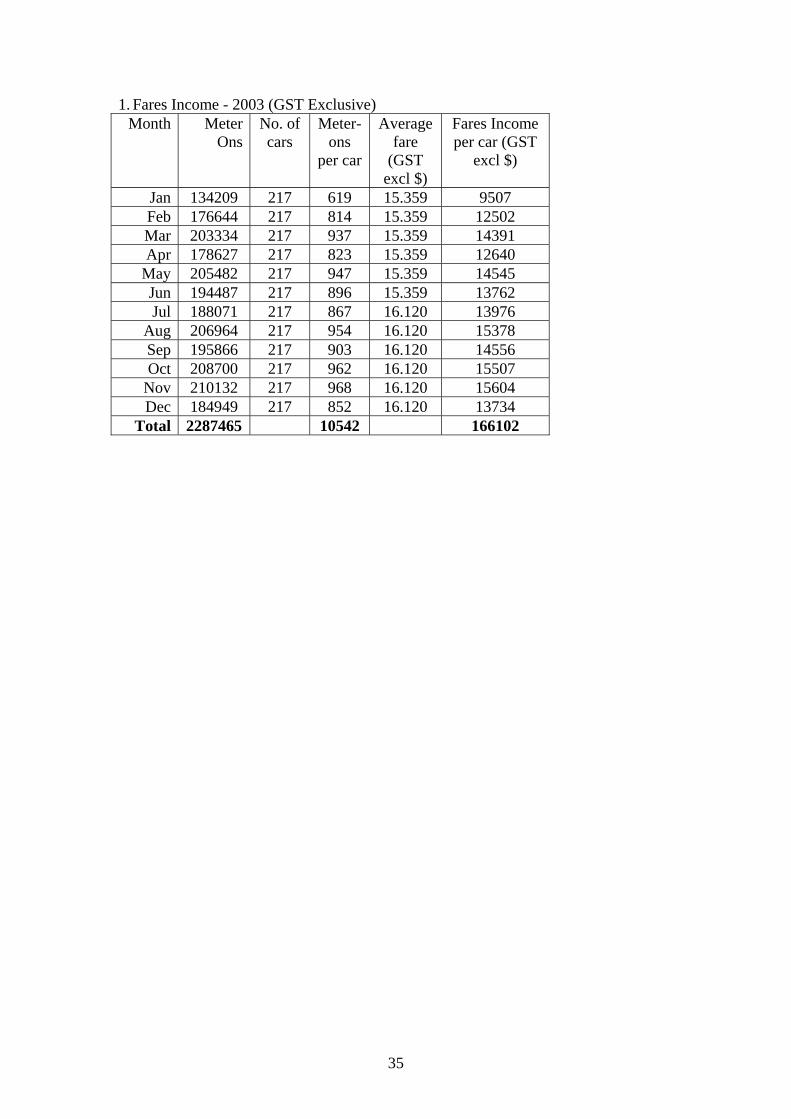
1. Fares Income - 2003 (GST Exclusive) Month Meter
OnsNo. of cars
Meter-ons
per car
Average fare
(GST excl $)
Fares Income per car (GST
excl $)
Jan 134209 217 619 15.359 9507 Feb 176644 217 814 15.359 12502 Mar 203334 217 937 15.359 14391 Apr 178627 217 823 15.359 12640
May 205482 217 947 15.359 14545 Jun 194487 217 896 15.359 13762 Jul 188071 217 867 16.120 13976
Aug 206964 217 954 16.120 15378 Sep 195866 217 903 16.120 14556 Oct 208700 217 962 16.120 15507
Nov 210132 217 968 16.120 15604 Dec 184949 217 852 16.120 13734
Total 2287465 10542 166102
35