Embed Size (px)
Citation preview
Pressor Response toSaralasin (1-Sar-8-Ala-Angiotensin II) Bolus Injection
in Hypertensive PatientsUzi A. WAKS, M.D., MORTON H. MAXWELL, M.D., LEONARD MARKS, M.D.,
EDWARD T. ZAWADA, M.D., AND JOSEPH J. KAUFMAN, M.D.
SUMMARY A 10 mg bolus of the angiotensin blocker saralasinwas injected 113 times in 68 subjects with essential or renovascularhypertension. Ninety percent of injections caused a transient increasein blood pressure, which correlated with plasma renin activity(PRA) (r = -0.54). Mean increase at 2 minutes was 21/13.4 mm Hg(P < 0.001) and was independent of pre-injection control blood pres-sure, with a rapid decrease to or below control values thereafter.
Thirty-seven subjects were studied on successive days before andafter furosemide-induced sodium depletion (152 ± 26 mEq [SE]
A VASODEPRESSOR RESPONSE to intravenous ad-ministration of saralasin (1-sar-8-ala-angiotensin II), a com-petitive inhibitor of angiotensin II, signifies the presence ofrenin-mediated hypertension.1-7 We and others have sug-gested the use of saralasin testing in widespread screening ofhypertensive patients.' I Because the usual method ofsaralasin administration, i.e., continuous, pump-controlledintravenous infusion, is not applicable for outpatient screen-ing of large populations, we studied the effects of a single,rapid bolus injection of the drug." 8 We noted a close cor-relation of blood pressure responses to a bolus injection ascompared to infusion of saralasin in patients with essentialand renovascular hypertension, and concluded that thesaralasin bolus test has many characteristics of an idealscreening procedure for renin-mediated hypertension.
Severe pressor responses following saralasin infusionshave been recently reported.9-12 However, there are few dataconcerning pressor responses to saralasin bolus ad-ministration.' Since the bolus technique involves rapiddelivery of a relatively large quantity of saralasin to thereceptor sites as compared to the various infusion tech-niques described,9 12 it has been predicted that saralasinbolus testing ". . . will sooner or later, result in a vascularcatastrophe".' Accordingly, the present report presents adetailed systematic analysis of the pressor responses to 113bolus injections in 68 hypertensive patients.
Methods
Subjects
The study group consisted of 68 hypertensive patients (44males and 24 females) who ranged in age from 10 to 62 years(mean age 40.1 years). Sixty-four were Caucasian and fourwere black. Before entry into the study, all patients were
From the Department of Medicine and Department of Surgery/Urology,University of California, Los Angeles, School of Medicine, and the Hyperten-sion Service, Cedars-Sinai Medical Center, Los Angeles, California.
Supported in part by The University Medical Research Foundation andUSPHS RR00865.Address for reprints: Morton H. Maxwell, M.D., Hypertension Service,
Cedars-Sinai Medical Center, 8700 Beverly Blvd., Los Angeles, California90048.
Received August 8, 1977; revision accepted January 16, 1978.
sodium loss). In the low renin group, sodium depletion did not changePRA or the magnitude of the pressor response to saralasin, butsignificantly decreased control MAP by 13 mm Hg (P < 0.01). Innormal and high renin patients, MAP was unchanged after diuresis,but PRA increased significantly and the pressor response wasattenuated. The net effect of sodium depletion was to reduce the pres-sor response to saralasin in all renin subgroups by 9 to 12 mm Hg.
Saralasin bolus injection, unlike infusion, saturates available vas-cular receptors only briefly, eliminating prolonged pressor responses.
taken off antihypertensive medication for two weeks andthen subjected to an extensive inpatient work-up designed todiagnose secondary forms of hypertension. Thirty-five pa-tients were thus found to have essential hypertension and 33patients were found to have renovascular hypertension. Thediagnosis of renovascular hypertension was established bypostoperative cure or improvement of hypertension at oneyear follow-up, as defined in the Cooperative Study ofRenovascular Hypertension," or, in unoperated patients, byunequivocally positive arteriographic and renal vein renindata. 14
Study Design
Two weeks prior to saralasin testing a sodium replete dietconsisting of approximately 120 to 150 mEq/day of sodiumwas begun. At this time each patient was interviewed by theinvestigators, and an informed consent approved in advanceby the Human Use Protection and Review Committee ofUCLA Medical Center was obtained. In addition to thesaralasin tests, each patient had a complete blood count andmultiphasic serum analysis (SMA-12, Technicon Cor-poration), as well as determinations of serum and urine elec-trolytes, serum creatinine, and supine and upright plasmarenin activity (PRA) on the morning of each test.
Thirty seven patients were admitted to the UCLAClinical Research Center and studied in a three-day protocoldescribed in detail elsewhere.8 In brief, saralasin was ad-ministered to these patients on two consecutive mornings,beginning the day after admission. The first drug ad-ministration was performed while the patients were ingest-ing the sodium replete diet. The second drug administrationwas performed the next morning, a state of mild sodiumdepletion having been achieved by furosemide, 1 mg/kgbody weight, given orally at 5 p.m. of the first test dayfollowed by a low sodium diet (10 mEq/day). Before andafter sodium depletion, the patients were weighed on a stan-dard balance-type scale. Thus, with regard to sodiumbalance, each of these patients served as his own control.8
Thirty-one patients were studied as outpatients in thesodium deplete state only. Mild sodium depletion wasachieved in these patients by furosemide and dietary sodiumrestriction, in an identical manner as for the inpatient group.
1165
by guest on July 18, 2018http://circ.ahajournals.org/
Dow
nloaded from
VOL 27, No 6, JUNE 1978
Eight of these outpatients had repeat saralasin testingseveral weeks after the initial test.
Altogether, 113 saralasin tests were performed, 37 duringsodium repletion and 76 during mild sodium depletion.
Saralasin Testing
A private, quiet, dimly lit room was used for the saralasintests. All patients were in the supine position. Blood pres-sure was monitored and recorded every two minutes with anautomated ultrasonic device (Arteriosonde 1216, RocheMedical Electronics).15 The accuracy of the Arteriosondereadings was confirmed in each patient by multiple com-parisons with simultaneous readings obtained using a stan-dard sphygmomanometer and stethoscope.
After a one-hour period of blood pressure stabilization, 2ml of saline were injected through a cannula connected to avenous infusion line. Ten minutes later, a 10 mg bolus ofsaralasin was administered in the same manner over a two-minute period. The patients were kept unaware of the timingof the injections. Thirty minutes later, saralasin infusion (10to 50 ,ug/kg/min) was started and administered for 90minutes in 37 patients. The remaining 31 patients did notreceive an infusion, and the test was terminated 60 minutesafter administration of the bolus. After testing, bloodpressure was monitored every 10 to 15 minutes with asphygmomanometer and stethoscope for at least 120minutes in the outpatients and every hour for 12 to 18 hoursin the hospitalized patients.
"Control blood pressure" was considered to be theaverage of the five Arteriosonde readings just prior tosaralasin administration. "Admission blood pressure" wasconsidered to be the average of the first four hourly blood
SYSTOLIC0 70
E 60
E50 -
W. 40 - X s *
ui
0- 0 1-J0
z -o -
w-20 -
Z) -30 BOU
z
c~-70
pressures measured by sphygmomanometer immediatelyafter admission to the Clinical Research Center.
Renin Determinations
A radioimmunoassay was used for determinations ofplasma renin activity,16 and all samples were run induplicate. In our laboratory, this test has a within-assayvariation of +5.6% SD.17 Each morning before saralasin ad-ministration, peripheral venous samples were obtained forrenin determinations with the patient supine for one hour,and after one hour of ambulation. Patients were stratifiedinto renin subgroups by two different methods: I) The pre-test supine, post-furosemide PRA values in all patients wereranked from lowest to highest, and then stratified into threecategories of equal size. This permitted saralasin-inducedblood pressure changes within each renin category to beanalyzed statistically by a stepwise, multiple regressiontechnique in order to derive a best-fitting polynomial foreach category,'8 and 2) The 37 patients who were studiedboth in the salt replete and sale deplete states on successivedays were categorized into absolute renin subgroups by com-parison with a normal range (±2 SD) established in 28healthy adults studied previously in our laboratory underidentical sampling conditions.19 As in previous studies fromour laboratory, sodium deplete, upright PRA values wereused for absolute renin categorization." '9
Results
Magnitude and Duration of Early Pressor Response toSaralasin (113 Bolus Injections)
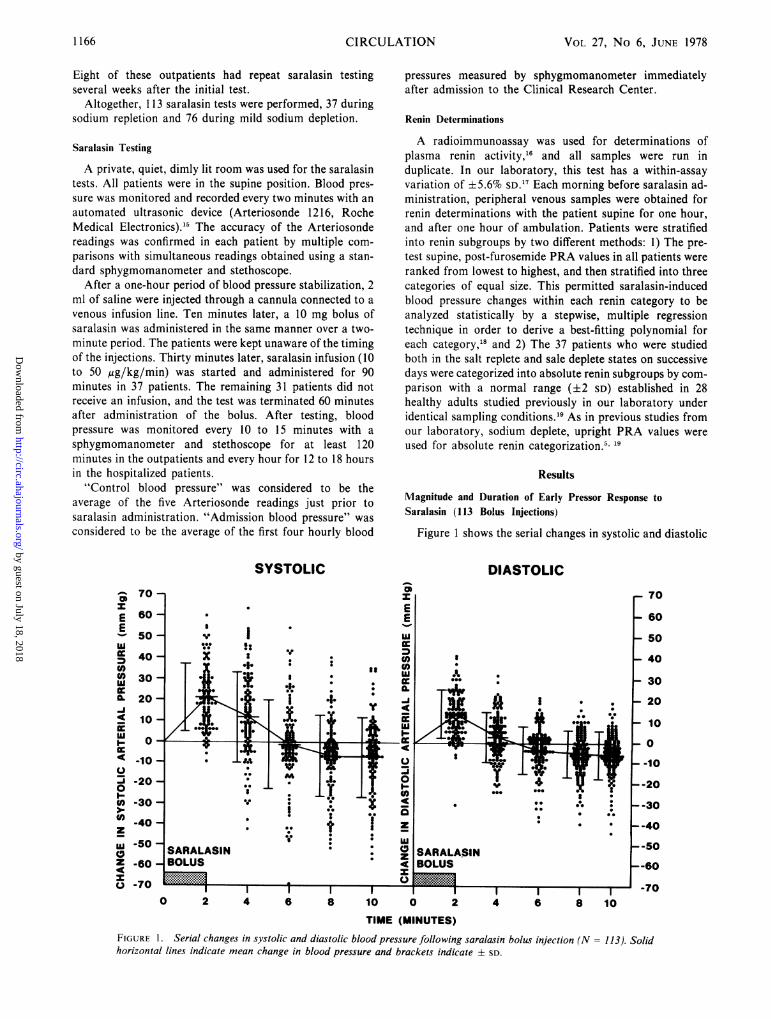
Figure 1 shows the serial changes in systolic and diastolic
DIASTOLIC
ZI
0 2 4 6 8 10 0 2 4 6 8 10TIME (MINUTES)
FIGURE 1. Serial changes in systolic and diastolic blood pressure following saralasin bolus injection (N = 113). Solidhorizontal lines indicate mean change in blood pressure and brackets indicate ± SD.
1166 CIRCULATION
by guest on July 18, 2018http://circ.ahajournals.org/
Dow
nloaded from
PRESSOR RESPONSE TO SARALASIN BOLUS/Waks et al.
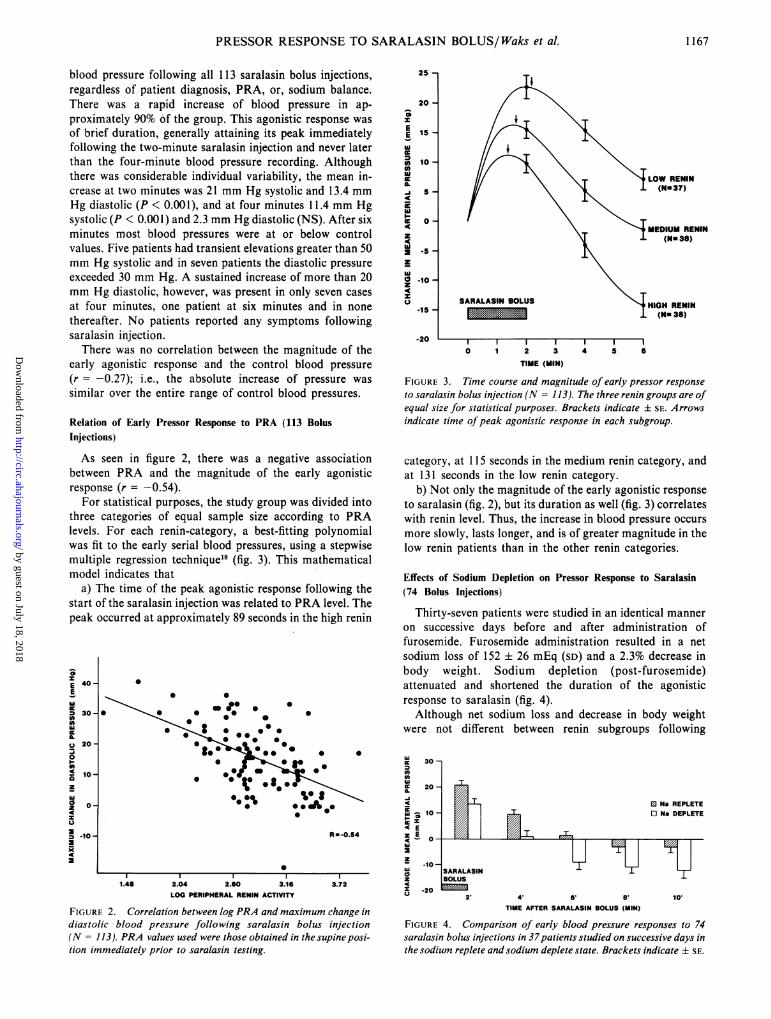
blood pressure following all 113 saralasin bolus injections,regardless of patient diagnosis, PRA, or, sodium balance.There was a rapid increase of blood pressure in ap-proximately 90% of the group. This agonistic response wasof brief duration, generally attaining its peak immediatelyfollowing the two-minute saralasin injection and never laterthan the four-minute blood pressure recording. Althoughthere was considerable individual variability, the mean in-crease at two minutes was 21 mm Hg systolic and 13.4 mmHg diastolic (P < 0.001), and at four minutes 11.4 mm Hgsystolic (P < 0.001) and 2.3 mm Hg diastolic (NS). After sixminutes most blood pressures were at or below controlvalues. Five patients had transient elevations greater than 50mm Hg systolic and in seven patients the diastolic pressureexceeded 30 mm Hg. A sustained increase of more than 20mm Hg diastolic, however, was present in only seven casesat four minutes, one patient at six minutes and in nonethereafter. No patients reported any symptoms followingsaralasin injection.
There was no correlation between the magnitude of theearly agonistic response and the control blood pressure(r = -0.27); i.e., the absolute increase of pressure wassimilar over the entire range of control blood pressures.
Relation of Early Pressor Response to PRA (113 BolusInjections)
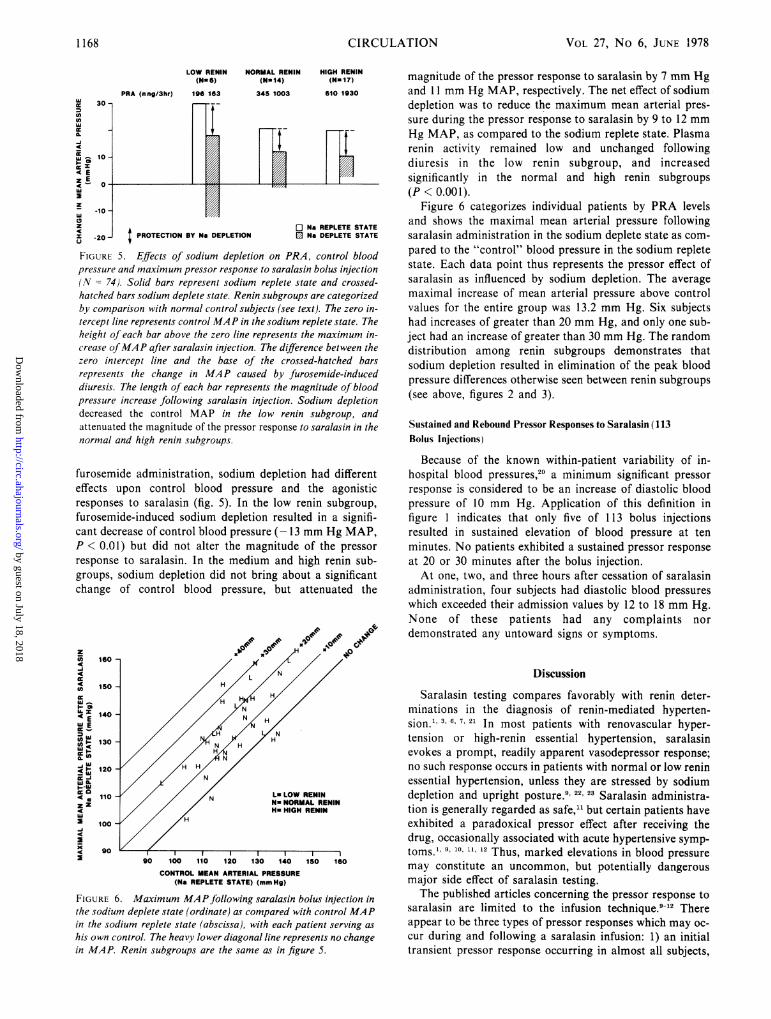
As seen in figure 2, there was a negative associationbetween PRA and the magnitude of the early agonisticresponse (r = -0.54).
For statistical purposes, the study group was divided intothree categories of equal sample size according to PRAlevels. For each renin-category, a best-fitting polynomialwas fit to the early serial blood pressures, using a stepwisemultiple regression technique18 (fig. 3). This mathematicalmodel indicates that
a) The time of the peak agonistic response following thestart of the saralasin injection was related to PRA level. Thepeak occurred at approximately 89 seconds in the high renin
S
E 40-Ew0 30-0)
J
a.
g0 20-
00)- 10-az
0 0-z
0 .10-a4IC
0
* S
a 00*004. 0
0
0* S*- 0
0
0*
R a -0.54
.~~I l1.48 2.04 2.60 3.16
LOG PERIPHERAL RENIN ACTIVITY3.72
FIGURE 2. Correlation between log PRA and maximum change indiastolic blood pressure following saralasin bolus injection(N = 113). PRA values used were those obtained in thesupineposi-tion immediately prior to saralasin testing.
25 -
20 -SzEE is-
w
0 10-UJw
-i 5 -
wOiE 0 -4z4c
a -lo-z4cz
-15 -
-20
OW RENIN(N- 37)
SARALASIN BOLUS
I I0 1 2 3
TIME (MIN)
44 5 6
FIGURE 3. Time course and magnitude of early pressor responseto saralasin bolus injection (N = 113). The three renin groups are ofequal size for statistical purposes. Brackets indicate ± SE. Arrowsindicate time ofpeak agonistic response in each subgroup.
category, at 115 seconds in the medium renin category, andat 131 seconds in the low renin category.
b) Not only the magnitude of the early agonistic responseto saralasin (fig. 2), but its duration as well (fig. 3) correlateswith renin level. Thus, the increase in blood pressure occursmore slowly, lasts longer, and is of greater magnitude in thelow renin patients than in the other renin categories.
Effects of Sodium Depletion on Pressor Response to Saralasin(74 Bolus Injections)
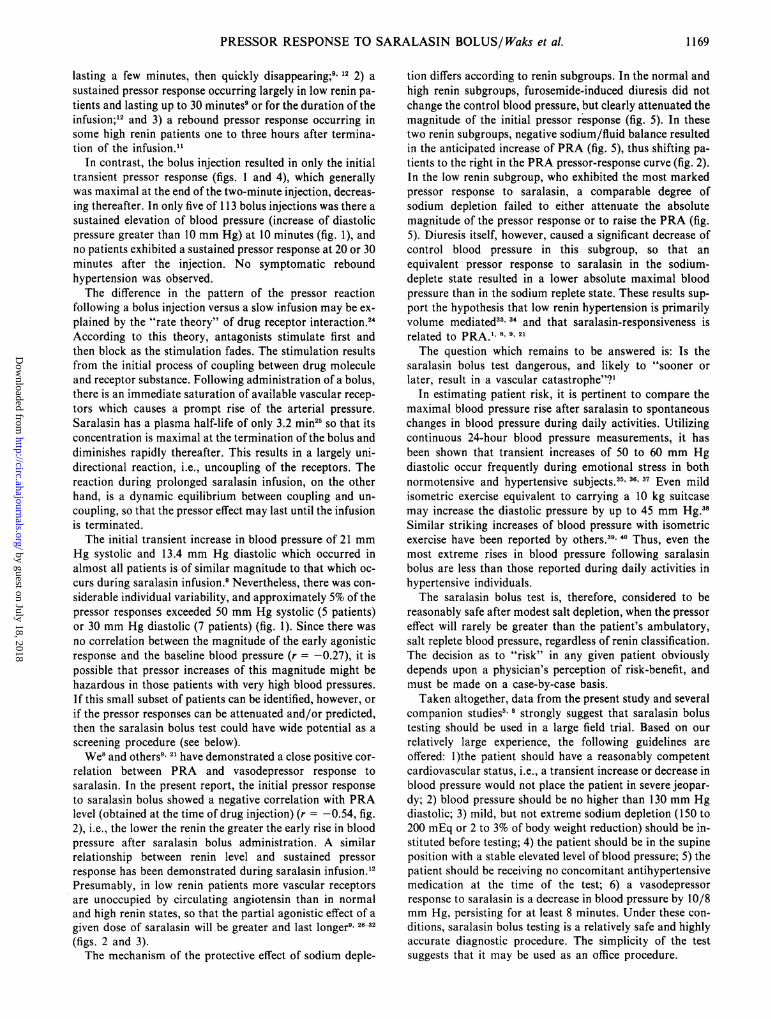
Thirty-seven patients were studied in an identical manneron successive days before and after administration offurosemide. Furosemide administration resulted in a netsodium loss of 152 ± 26 mEq (SD) and a 2.3% decrease inbody weight. Sodium depletion (post-furosemide)attenuated and shortened the duration of the agonisticresponse to saralasin (fig. 4).Although net sodium loss and decrease in body weight
were not different between renin subgroups following
Mc 30-
cooD0
c 20-
4
w ^ 10-_xE
z-10-
lu0z
x -20
ED Na REPLETEO Na DEPLETE
y y[SARALASINBOLUS
-O 2' 4' 6' 8' 10'TIME AFTER SARALASIN BOLUS (MIN)
FIGURE 4. Comparison of early blood pressure responses to 74saralasin bolus injections in 37patients studied on successive days inthe sodium replete and sodium deplete state. Brackets indicate ± SE.
X X X | i | |
f .z -zzw
1167
by guest on July 18, 2018http://circ.ahajournals.org/
Dow
nloaded from
VOL 27, No 6, JUNE 1978
LOW RENIN NORMAL RENIN HIGH RENIN(Nu6) (Nu1a4) (N. 17)
PRA (nng/3hr) 196 163 345 1003 610 1930
In
zA flNa REPLETE STATE
CL
FIGURE 5. Effiects of sodium depletion on PRA, control blood
pressure and maximum pressor response to saralasin bolus injection
(N =74). Solid bars represent sodium replete state and crossed-
hatched bars sodiulm deplete state. Renin subgroups are categorized
by comparison with normal control subjects (see text). The zero in-
tercept line represents control MA P in the sodium replete state. The
height of each bar above the zero line represents the maximum in-
crease ofMAP after saralasin injection. The diffierence between the
zero intercept line and the base of the crossed-hatched bars
represents the change in MAP caused by furosemide-induced
diuresis. The length of each bar represents the magnitude of blood
pressure increase following saralasin injection. Sodium depletion
decreased the control MAP in the low renin subgroup, and
attenuated the magnitude of the pressor response to saralasin in the
normal and high renin subgroups.
furosemide administration, sodium depletion had different
effects upon control blood pressure and the agonistic
responses to saralasin (fig. 5). In the low renin subgroup,
furosemide-induced sodium depletion resulted in a signifi-
cant decrease of control blood pressure (- 13 mm Hg MAP,
P 0.01) but did not alter the magnitude of the pressor
response to saralasin. In the medium and high renin sub-
groups, sodium depletion did not bring about a significant
change of control blood pressure, but attenuated the
_J~~~~~~~~~~~~~~~~~
w 150-
WE
a 130-
12 0 HTT I I I I
FIGUR 5. ffect of odiu100 epletio no A n blo
4rsueadmxmmpesrrsonet aaai ou neto
(N=7) oi asrpeetsoimrpeesaeadcosdhace assdimdpeesae90nnsbrus r aeoie
VW Wt 11I l̂ZU 14U IOU IO>U IOU
CONTROL MEAN ARTERIAL PRESSURE(Na REPLETE STATE) (mmHg)
FIGURE 6. Maximum MAP following saralasin bolus injection inthe sodium deplete state (ordinate) as compared with control MAPin the sodium replete state (abscissa), with each patient serving as
his own control. The heavy lower diagonal line represents no changein MAP. Renin subgroups are the same as in figure 5.
magnitude of the pressor response to saralasin by 7 mm Hgand 11 mm Hg MAP, respectively. The net effect of sodiumdepletion was to reduce the maximum mean arterial pres-sure during the pressor response to saralasin by 9 to 12 mmHg MAP, as compared to the sodium replete state. Plasmarenin activity remained low and unchanged followingdiuresis in the low renin subgroup, and increasedsignificantly in the normal and high renin subgroups(P < 0.001).
Figure 6 categorizes individual patients by PRA levelsand shows the maximal mean arterial pressure followingsaralasin administration in the sodium deplete state as com-pared to the "control" blood pressure in the sodium repletestate. Each data point thus represents the pressor effect ofsaralasin as influenced by sodium depletion. The averagemaximal increase of mean arterial pressure above controlvalues for the entire group was 13.2 mm Hg. Six subjectshad increases of greater than 20 mm Hg, and only one sub-ject had an increase of greater than 30 mm Hg. The randomdistribution among renin subgroups demonstrates thatsodium depletion resulted in elimination of the peak bloodpressure differences otherwise seen between renin subgroups(see above, figures 2 and 3).
Sustained and Rebound Pressor Responses to Saralasin (113Bolus Injections)
Because of the known within-patient variability of in-hospital blood pressures,20 a minimum significant pressorresponse is considered to be an increase of diastolic bloodpressure of 10 mm Hg. Application of this definition infigure 1 indicates that only five of 113 bolus injectionsresulted in sustained elevation of blood pressure at tenminutes. No patients exhibited a sustained pressor responseat 20 or 30 minutes after the bolus injection.At one, two, and three hours after cessation of saralasin
administration, four subjects had diastolic blood pressureswhich exceeded their admission values by 12 to 18 mm Hg.None of these patients had any complaints nordemonstrated any untoward signs or symptoms.
Discussion
Saralasin testing compares favorably with renin deter-minations in the diagnosis of renin-mediated hyperten-sion.' ,3 6, 7. 21 In most patients with renovascular hyper-tension or high-renin essential hypertension, saralasinevokes a prompt, readily apparent vasodepressor response;no such response occurs in patients with normal or low reninessential hypertension, unless they are stressed by sodiumdepletion and upright posture.9' 22, 23 Saralasin administra-tion is generally regarded as safe," but certain patients haveexhibited a paradoxical pressor effect after receiving thedrug, occasionally associated with acute hypertensive symp-toms.' 9, 110, 11, 12 Thus, marked elevations in blood pressuremay constitute an uncommon, but potentially dangerousmajor side effect of saralasin testing.The published articles concerning the pressor response to
saralasin are limited to the infusion technique.9 12 Thereappear to be three types of pressor responses which may oc-cur during and following a saralasin infusion: 1) an initialtransient pressor response occurring in almost all subjects,
1168 CIRCULATION
by guest on July 18, 2018http://circ.ahajournals.org/
Dow
nloaded from
PRESSOR RESPONSE TO SARALASIN BOLUS/Waks et al.
lasting a few minutes, then quickly disappearing;9 12 2) asustained pressor response occurring largely in low renin pa-tients and lasting up to 30 minutes9 or for the duration of theinfusion;'2 and 3) a rebound pressor response occurring insome high renin patients one to three hours after termina-tion of the infusion."1
In contrast, the bolus injection resulted in only the initialtransient pressor response (figs. 1 and 4), which generallywas maximal at the end of the two-minute injection, decreas-ing thereafter. In only five of 113 bolus injections was there asustained elevation of blood pressure (increase of diastolicpressure greater than 10 mm Hg) at 10 minutes (fig. 1), andno patients exhibited a sustained pressor response at 20 or 30minutes after the injection. No symptomatic reboundhypertension was observed.The difference in the pattern of the pressor reaction
following a bolus injection versus a slow infusion may be ex-plained by the "rate theory" of drug receptor interaction.24According to this theory, antagonists stimulate first andthen block as the stimulation fades. The stimulation resultsfrom the initial process of coupling between drug moleculeand receptor substance. Following administration of a bolus,there is an immediate saturation of available vascular recep-tors which causes a prompt rise of the arterial pressure.Saralasin has a plasma half-life of only 3.2 min2 so that itsconcentration is maximal at the termination of the bolus anddiminishes rapidly thereafter. This results in a largely uni-directional reaction, i.e., uncoupling of the receptors. Thereaction during prolonged saralasin infusion, on the otherhand, is a dynamic equilibrium between coupling and un-coupling, so that the pressor effect may last until the infusionis terminated.The initial transient increase in blood pressure of 21 mm
Hg systolic and 13.4 mm Hg diastolic which occurred inalmost all patients is of similar magnitude to that which oc-curs during saralasin infusion.9 Nevertheless, there was con-siderable individual variability, and approximately 5% of thepressor responses exceeded 50 mm Hg systolic (5 patients)or 30 mm Hg diastolic (7 patients) (fig. 1). Since there wasno correlation between the magnitude of the early agonisticresponse and the baseline blood pressure (r = -0.27), it ispossible that pressor increases of this magnitude might behazardous in those patients with very high blood pressures.If this small subset of patients can be identified, however, orif the pressor responses can be attenuated and/or predicted,then the saralasin bolus test could have wide potential as ascreening procedure (see below).We8 and others9' 21 have demonstrated a close positive cor-
relation between PRA and vasodepressor response tosaralasin. In the present report, the initial pressor responseto saralasin bolus showed a negative correlation with PRAlevel (obtained at the time of drug injection) (r = -0.54, fig.2), i.e., the lower the renin the greater the early rise in bloodpressure after saralasin bolus administration. A similarrelationship between renin level and sustained pressorresponse has been demonstrated during saralasin infusion."2Presumably, in low renin patients more vascular receptorsare unoccupied by circulating angiotensin than in normaland high renin states, so that the partial agonistic effect of agiven dose of saralasin will be greater and last longer9' 26-32(figs. 2 and 3).The mechanism of the protective effect of sodium deple-
tion differs according to renin subgroups. In the normal andhigh renin subgroups, furosemide-induced diuresis did notchange the control blood pressure, but clearly attenuated themagnitude of the initial pressor response (fig. 5). In thesetwo renin subgroups, negative sodium/fluid balance resultedin the anticipated increase of PRA (fig. 5), thus shifting pa-tients to the right in the PRA pressor-response curve (fig. 2).In the low renin subgroup, who exhibited the most markedpressor response to saralasin, a comparable degree ofsodium depletion failed to either attenuate the absolutemagnitude of the pressor response or to raise the PRA (fig.5). Diuresis itself, however, caused a significant decrease ofcontrol blood pressure in this subgroup, so that anequivalent pressor response to saralasin in the sodium-deplete state resulted in a lower absolute maximal bloodpressure than in the sodium replete state. These results sup-port the hypothesis that low renin hypertension is primarilyvolume mediated33 34 and that saralasin-responsiveness isrelated to PRA." 8, 9, 21The question which remains to be answered is: Is the
saralasin bolus test dangerous, and likely to "sooner orlater, result in a vascular catastrophe"'T
In estimating patient risk, it is pertinent to compare themaximal blood pressure rise after saralasin to spontaneouschanges in blood pressure during daily activities. Utilizingcontinuous 24-hour blood pressure measurements, it hasbeen shown that transient increases of 50 to 60 mm Hgdiastolic occur frequently during emotional stress in bothnormotensive and hypertensive subjects.35 36 Even mildisometric exercise equivalent to carrying a 10 kg suitcasemay increase the diastolic pressure by up to 45 mm Hg.38Similar striking increases of blood pressure with isometricexercise have been reported by others.39' 40 Thus, even themost extreme rises in blood pressure following saralasinbolus are less than those reported during daily activities inhypertensive individuals.The saralasin bolus test is, therefore, considered to be
reasonably safe after modest salt depletion, when the pressoreffect will rarely be greater than the patient's ambulatory,salt replete blood pressure, regardless of renin classification.The decision as to "risk" in any given patient obviouslydepends upon a physician's perception of risk-benefit, andmust be made on a case-by-case basis.Taken altogether, data from the present study and several
companion studies5 8 strongly suggest that saralasin bolustesting should be used in a large field trial. Based on ourrelatively large experience, the following guidelines areoffered: l)the patient should have a reasonably competentcardiovascular status, i.e., a transient increase or decrease inblood pressure would not place the patient in severe jeopar-dy; 2) blood pressure should be no higher than 130 mm Hgdiastolic; 3) mild, but not extreme sodium depletion (150 to200 mEq or 2 to 3% of body weight reduction) should be in-stituted before testing; 4) the patient should be in the supineposition with a stable elevated level of blood pressure; 5) thepatient should be receiving no concomitant antihypertensivemedication at the time of the test; 6) a vasodepressorresponse to saralasin is a decrease in blood pressure by 10/8mm Hg, persisting for at least 8 minutes. Under these con-ditions, saralasin bolus testing is a relatively safe and highlyaccurate diagnostic procedure. The simplicity of the testsuggests that it may be used as an office procedure.
1169
by guest on July 18, 2018http://circ.ahajournals.org/
Dow
nloaded from
1170 CIRCULATION
Acknowledgment
We gratefully acknowledge the assistance of Cheryl Gross, R.N., who per-formed the saralasin studies and of Gracieta Vegagomez, who performed therenin assays. The statistical analyses were performed by Paul Varady, M.S.
Saralasin was generously provided by Dr. Robert Keenan, EatonLaboratories, Norwich, New York.
References
Streeten DHP, Anderson GH Jr, Dalakos TG: Angiotensin blockade: Itsclinical significance. Am J Med 60: 817, 1976
2. Streeten DHP, Freiberg JM, Anderson GH, Dalakos T: Identification ofangiotensinogenic hypertension in man using l-sar-8-ala-angiotensin II
(saralasin, P-I1 3). Circ Res 36 (Suppl I):I- 125, 19753. Brunner HR, Gavras H, Laragh JH, Keenan R: Angiotensin II blockade
in man by sarl-ala8-angiotensin II for understanding and treatment ofhigh blood-pressure. Lancet 2: 1045, 1973
4. Brunner HR, Gavras H, Laragh JH, Keenan R: Hypertension in man:
Exposure of the renin and sodium components using angiotensin II
blockade. Circ Res 34 (Suppl I):I-35, 19745. Marks LS, Maxwell MH, Kaufman JJ: Saralasin bolus test: Rapid
screening procedure for renin-mediated hypertension. Lancet 2: 784,1975
6. Hollenberg NK, Williams GH, Burger B, Ishikawa I, Adams DF:Blockade and stimulation of renal, adrenal, and vascular angiotensin IIreceptors with I-sar, 8-ala angiotensin II in normal man. J Clin Invest 57:39, 1976
7. Haber E: The role of renin in normal and pathological cardiovascularhomeostasis. Circulation 54: 849, 1976
8. Marks LS, Maxwell MH, Kaufman JJ: Renin, sodium, andvasodepressor response to saralasin in renovascular and essentialhypertension. Ann Intern Med 87: 176, 1977
9. Case DB, Wallace JM, Keim HJ, Sealey JE, Laragh JH: Usefulness andlimitations of saralasin, a partial competitive agonist of angiotensin II,for evaluating the renin and sodium factors in hypertensive patients. AmJ Med 60: 825, 1976
10. Case DB, Wallace JM, Keim HJ, Weber MA, Drayer JIM, White RP,Sealey JE, Laragh JH: Estimating renin participation in hypertension:Superiority of converting enzyme inhibitor over saralasin. Am J Med 61:790, 1976
11. Keim JH, Drayer JI, Case DB, Lopez-Ovejero J, Wallace JM, WeberMA, Laragh JH: A role for renin in rebound hypertension andencephalopathy after infusion of saralasin acetate (sar'-ala8-angiotensinII). N Engl J Med 295: 1175, 1976
12. Anderson GH Jr, Streeten DHP, Dalakos TG: Pressor response to I-sar-8-ala-angiotensin II (saralasin) in hypertensive subjects. Circ Res 40: 243,1977
13. Maxwell MH, Bleifer KH, Franklin SS, Varady P with the assistance ofDeegan C: Cooperative study of renovascular hypertension:Demographic analysis of the study. JAMA 220: 1195-1204, 1972
14. Maxwell MH, Marks LS, Lupu AN, Varady PD, Cahill PJ, Franklin SS,Kaufman J: Predictive value of renin determinations in renal arterystenosis. JAMA (in press).
15. Hochberg HM, Salomon H: Accuracy of an automated ultrasound bloodpressure monitor. Curr Ther Res 13: 129, 1971
16. Haber E, Koerner T, Page LB, Kliman B, Purnode A: Application of a
radioimmunoassay for angiotensin I to the physiologic measurements ofplasma renin activity in normal human subjects. J Clin Endocrinol Metab29: 1349, 1969
17. Maxwell MH, Marks LS, Varady PD, Lupu A, Kaufman JJ: Renal veinrenin in essential hypertension. J Lab Clin Med 86: 901, 1975
VOL 27, No 6, JUNE 1978
18. Efroymsen MA: Multiple regression analysis. In Mathematical Methodsfor Digital Computers, part V, vol I. Edited by A Ralston, HS Wilf. NewYork, Wiley Publications, 1960, pp 191-203
19. Marks LS, Maxwell MH, Kaufman JJ: Non-renin-mediatedrenovascular hypertension: A new syndrome? Lancet 1: 615, 1977
20. Varady PD, Maxwell MH: Assessment of statistically significant changesin diastolic blood pressures. JAMA 221: 365-368, 1972
21. Geyskes GG, Boer P, Vos J, Dorhout Mees EJ: Renin dependency ofblood-pressure: Analysis by angiotensin II antagonist P113 in hyperten-sive patients treated with salt depletion and propranolol. Lancet 1: 1049,1976
22. Haber E, Sancho J, Re R, Burton J, Barger AC: The role of the renin-angiotensin-aldosterone system in cardiovascular homeostasis in normalman. Clin Sci Mol Med 48: 49s, 1975
23. Gavras H, Ribeiro AB, Gavras I, Brunner HR: Reciprocal relationbetween renin dependency and sodium dependency in essential hyperten-sion. N Engl J Med 295: 1278, 1976
24. Goldstein A, Aronow L, Kalman SM: In Principles of Drug Action: TheBasis of Pharmacology, ed 2. New York, Hoeber Medical Division,Harper and Row. 1968, pp 95-99
25. Pettinger WA, Keeton K, Tanaka K: The radioimmunoassay and phar-macokinetics of saralasin (l-Sar-8-Ala-angiotensin II) in the rat andhypertensive man. Clin Pharmacol Ther 17: 146, 1975
26. Brunner HR, Chang P, Wallach R, Sealey JE, Laragh JH: AngiotensinII vascular receptors: Their avidity in relationship to sodium balance, theautonomic nervous system, and hypertension. J Clin Invest 51: 58, 1972
27. Hollenberg NK, Chenitz WR, Adams DF, Williams GH: Reciprocal in-fluence of salt intake on adrenal glomerulosa and renal vascularresponses to angiotensin II in normal man. J Clin Invest 54: 34, 1974
28. Hollenberg NK, Solomon HS, Adams DF, Abrams HL, Merrill JP:Renal vascular responses to angiotensin and norepinephrine in normalman. Circ Res 31: 750, 1972
29. Mimran A, Hinrichs KJ, Hollenberg NK: Characterization of smoothmuscle receptors for angiotensin: studies with an antagonist. Am JPhysiol 226: 185, 1974
30. Devynck M-A, Meyer P: Angiotensin receptors in vascular tissue. Am JMed 61: 758, 1976
31. Thurston H: Vascular angiotensin receptors and their role in blood pres-sure control. Am J Med 61: 768, 1976
32. Thurston H, Laragh JH: Prior receptor occupancy as a determinant ofthe pressor activity of infused angiotensin II in the rat. Circ Res 36: 113,1975
33. Vaughan ED Jr, Laragh JH, Gavras I, Biuhler FR, Gavras H, BrunnerHR, Baer L: Volume factor in low and normal renin essential hyperten-sion: Treatment with either spironolactone or chlorthalidone. Am J Car-diol 32: 523, 1973
34. Laragh JH: Vasoconstriction-volume analysis for understanding andtreating hypertension: the rise of renin and aldosterone profiles. Am JMed 55: 261, 1973
35. Richardson DW, Honour AJ, Fenton GW, Stott FH, Pickering GW:Variation in arterial pressure throughout the day and night. Clin Sci 26:445, 1964
36. Bevan AT, Honour AJ, Stott FH: Direct arterial pressure recording inunrestricted man. Clin Sci 36: 329, 1969
37. Wertheimer L: Studies in a hypertensive population. Postgrad Med J 52:114, 1976
38. Ewing DJ, Irving JB, Kerr F, Kirby BJ: Static exercise in untreatedsystemic hypertension. Br Heart J 35: 413, 1973
39. Donald KW, Lind AR, McNicol GW, Humphreys PW, Taylor SH,Staunton HP: Cardiovascular responses to sustained (static) contrac-tions. Circ Res 20, 21 (suppl I):I-1, 1-32, 1967
40. Kovowitz C, Parmley WW, Donoso R, Marcus H, Ganz W, Swan HJC:Effects of isometric exercise on cardiac performance: The grip test. Cir-culation 44: 994, 1971
by guest on July 18, 2018http://circ.ahajournals.org/
Dow
nloaded from
U A Waks, M H Maxwell, L Marks, E T Zawada and J J Kaufmanpatients.
Pressor response to saralasin (1-sar-8-ala-angiotensin II) bolus injection in hypertensive
Print ISSN: 0009-7322. Online ISSN: 1524-4539 Copyright © 1978 American Heart Association, Inc. All rights reserved.
is published by the American Heart Association, 7272 Greenville Avenue, Dallas, TX 75231Circulation doi: 10.1161/01.CIR.57.6.1165
1978;57:1165-1170Circulation.
http://circ.ahajournals.org/content/57/6/1165the World Wide Web at:
The online version of this article, along with updated information and services, is located on
http://circ.ahajournals.org//subscriptions/
is online at: Circulation Information about subscribing to Subscriptions:
http://www.lww.com/reprints Information about reprints can be found online at: Reprints:
document. Permissions and Rights Question and Answer information about this process is available in the
located, click Request Permissions in the middle column of the Web page under Services. FurtherEditorial Office. Once the online version of the published article for which permission is being requested is
can be obtained via RightsLink, a service of the Copyright Clearance Center, not theCirculationpublished in Requests for permissions to reproduce figures, tables, or portions of articles originallyPermissions:
by guest on July 18, 2018http://circ.ahajournals.org/
Dow
nloaded from


![Samsung Chassis Ks7a Cw29m064n 1165 [ET]](https://img.pdfslide.us/doc/110x75/542ce1d7219acd4e4b8b4d17/samsung-chassis-ks7a-cw29m064n-1165-et.jpg)