Embed Size (px)
Citation preview

HESSD10, C2196–C2210, 2013
InteractiveComment
Full Screen / Esc
Printer-friendly Version
Interactive Discussion
Discussion Paper
Hydrol. Earth Syst. Sci. Discuss., 10, C2196–C2210, 2013www.hydrol-earth-syst-sci-discuss.net/10/C2196/2013/© Author(s) 2013. This work is distributed underthe Creative Commons Attribute 3.0 License.
EGU Journal Logos (RGB)
Advances in Geosciences
Open A
ccess
Natural Hazards and Earth System
Sciences
Open A
ccess
Annales Geophysicae
Open A
ccess
Nonlinear Processes in Geophysics
Open A
ccess
Atmospheric Chemistry
and Physics
Open A
ccess
Atmospheric Chemistry
and Physics
Open A
ccess
Discussions
Atmospheric Measurement
Techniques
Open A
ccess
Atmospheric Measurement
Techniques
Open A
ccess
Discussions
Biogeosciences
Open A
ccess
Open A
ccess
BiogeosciencesDiscussions
Climate of the Past
Open A
ccess
Open A
ccess
Climate of the Past
Discussions
Earth System Dynamics
Open A
ccess
Open A
ccess
Earth System Dynamics
Discussions
GeoscientificInstrumentation
Methods andData Systems
Open A
ccess
GeoscientificInstrumentation
Methods andData Systems
Open A
ccess
Discussions
GeoscientificModel Development
Open A
ccess
Open A
ccess
GeoscientificModel Development
Discussions
Hydrology and Earth System
Sciences
Open A
ccess
Hydrology and Earth System
Sciences
Open A
ccess
Discussions
Ocean Science
Open A
ccess
Open A
ccess
Ocean ScienceDiscussions
Solid Earth
Open A
ccess
Open A
ccess
Solid EarthDiscussions
The Cryosphere
Open A
ccess
Open A
ccessThe Cryosphere
Discussions
Natural Hazards and Earth System
Sciences
Open A
ccess
Discussions
Interactive comment on “Probability distributionsfor explaining hydrological losses in SouthAustralian catchments” by S. H. P. W. Gamageet al.
S. H. P. W. Gamage et al.
Received and published: 4 June 2013
Response to reviewers’ comments on Manuscript ID HESSD, 10, 4597-4626, 2013
In this document below we have listed each of the reviewer’s comments. This is fol-lowed by our response.
Response to Reviewer #1 (Dr. Golian):
Comment 1: “The paper aims to identify suitable parametric and non-parametric prob-ability distributions on initial loss (IL) and continuous loss (CL) data of four catchmentsin South Australia (SA) region. There are some ser[i]ous controversies over the work.
C2196

HESSD10, C2196–C2210, 2013
InteractiveComment
Full Screen / Esc
Printer-friendly Version
Interactive Discussion
Discussion Paper
The main issue is the lack of innovation or scientific improvement of previous works.”
Response 1: The main aim of this paper is to improve the estimation of design lossesfor South Australian (SA) catchments. The presented work contributes to ongoing re-search on losses in Australia for updating Australian Rainfall Runoff (ARR) – A Guidefor Flood Estimation in Australia. Also the presented work improves event based Rain-fall Runoff (RR) model predictions. Event based RR models (e.g. WBNM, RORB) gen-erally need the user to input initial loss (IL) and continuous loss (CL) as parameters.However, for SA catchments, the only available loss values for this purpose are ARRrecommended values. According to the ARR, the loss values of the SA catchmentsare given as those for the humid zone of SA, namely: 10mm for IL and 2.5mm/h for CLin winter; and 25mm for IL and 4mm/hr for CL in summer (ARR Book 2, p. 47). TheseARR recommended values are based on the median values of losses. Due to the highvariability of losses in SA, the use of a representative single value (mean or median)is not appropriate. This can be seen in the Figure 1. The use of single representativeloss values introduces large errors into event based RR model predictions. Consideringthe random nature of hydrological losses, probabilistic modelling has been suggestedas a better approach to overcome the issues associated with the use of single rep-resentative values. The distributions suggested from previous studies were tested forSA catchments and it was found that these distributions were not able to describe SAcatchments’ loss data. Previous studies and the recommended distributions are givenin Table 1. Therefore, this study aimed to identify a suitable distribution function whichcan adequately describe hydrological losses in SA catchments. As shown in the Table1, the two-parameter Gamma distribution has not previously been tested for losses inSA catchments. As hydrological behaviour of South Australian catchments are gener-ally different compared to other catchments listed in Table 1, it is required to test thedistributions before applying them to SA catchments. This study provides a specificdistribution, the two-parameter Gamma, which has not previously been tested for SAcatchments. Also as pointed out by the third reviewer (Dr. A. Rahman), the results ofthis paper will provide a significant contribution to the Australian Rainfall and Runoff
C2197

HESSD10, C2196–C2210, 2013
InteractiveComment
Full Screen / Esc
Printer-friendly Version
Interactive Discussion
Discussion Paper
(ARR) guidelines, which are currently being updated. More importantly, this study pro-vides new knowledge on how IL in SA based catchments are characterised and thiswill help fill the gap in ARR information for hydrological losses in SA catchments. In therevised paper, we have modified the Introduction stating how the work presented in thispaper contributes to ongoing research in SA and why existing distributions cannot beused for catchments in the SA region. Table 1 has also been added to the Introduction.
Comment 2: “I refer to some parts of the text in this regard. On Page 4600 Lines 24-27and Lines 28-29 it is stated that previous probabilistic methods could not be used forSA catchments. The question is do the work by authors can be generalized to otherparts of Australia? The answer is no, as indicated in Page 4612 Line 21 “parametergeneralization is not within the scope of this paper”. As stated in Page 4601 Lines13-14 the present work is just a case study for four catchments in SA.”
Response 2: From the current content of the paper it is not clear whether or not thefinding can be used for other parts of SA. Like any other hydrological variable, IL canalso be directly transferred to another catchment, only if the two catchments are hydro-logically similar. This study does not cover the aspect of testing “homogeneity of catch-ments” and hence we stated that it is beyond the scope of our study. However, in orderto demonstrate applicability of the developed methodology to other parts of SA, therecommended two-parameter Gamma distribution is tested for two randomly selectedcatchments in the same region. The two test catchments are Rhynie (A5060500) andSplading (A5070501) which both belong to the SA wet/humid region. It was found thatthe IL for these two catchments followed the two-parameter Gamma distribution. Al-though geographical proximity does not always guarantee hydrological similarity, basedon these findings, it can be stated that the two-parameter Gamma distribution is suit-able for SA wet/humid catchments. Information on validation of the methodology usingthe two test catchments has been added to the revised paper.
Comment 3: “The authors used the terms “joint probability” which had the potentialfor making their work different from others. But there was not any sign of using this
C2198

HESSD10, C2196–C2210, 2013
InteractiveComment
Full Screen / Esc
Printer-friendly Version
Interactive Discussion
Discussion Paper
concept in their work. All the paper is based on the univariate analyses. I, as a reader,expected to see some joint probability distribution functions (jpdf) of IL and CL or anysets of two or more variables.”
Response 3: This paper does not intend to determine the joint probability of IL andCL. It has been identified that incorporating the joint response of initial losses (IL) andtotal losses (TL) into rainfall runoff simulation can improve model accuracy (Haddadand Rahman, 2005). The first step of any joint probability approach (JPA) is to identifydistributions of random variable inputs of interest (Rahman et al., 2000; Rahman etal., 2002; Nathan et al., 2003; Kuczera et al., 2006). As there is no understandingof the distribution of any of these variables (either IL or CL) for the SA catchments, aJPA approach cannot be adopted for this region. Therefore, the work presented in thispaper could be the starting point towards applying or investigating JPAs to describehydrological losses.
Comment 4: “1- Page 4604-4605, other goodness-of-fit tests such as Anderson-Darling are preferred to graphical methods which are based on visual comparison ofempirical and selected distributions.”
Response 4: Anderson –Darling test results for the selected Gamma distribution havebeen added to the revised paper.
Comment 5: “ 2- Some information missed in the paper, an important one is the sizeof observed IL and CL series for each catchment or better to say the number of rainfalland runoff events which are used to extract IL and CL data.”
Response 5: The number of rainfall and runoff events selected for this study is pre-sented in the Table 2, which has been included in the revised paper.
Comment 6: “3- Page 4613 Lines 5-6 which criterion was used for similarity (con-sistency) between distributions. The authors stated that the obtained distributions forselected catchments in SA are similar to those of other studies. How can the authors
C2199

HESSD10, C2196–C2210, 2013
InteractiveComment
Full Screen / Esc
Printer-friendly Version
Interactive Discussion
Discussion Paper
support this statement?”
Response 6: The shapes of the non-parametric distributions for the other parts ofAustralia can be found in the literature (Nathan and Weinmann, 2004; Ilahee, 2005;Nathan et al., 2003; Waugh, 1991). These shapes were visually tested against thenon-parametric distribution that we presented for SA catchments. Unlike the para-metric distributions, in non-parametric distributions, the shape of the distribution of SAcatchments is similar to some other parts of Australia. The revised manuscript is mod-ified as follows: “Shapes of the non-parametric distributions given in this study areconsistent with similar studies conducted for other regions of Australia (Nathan andWeinmann, 2004; Ilahee, 2005; Nathan et al., 2003; Waugh, 1991).
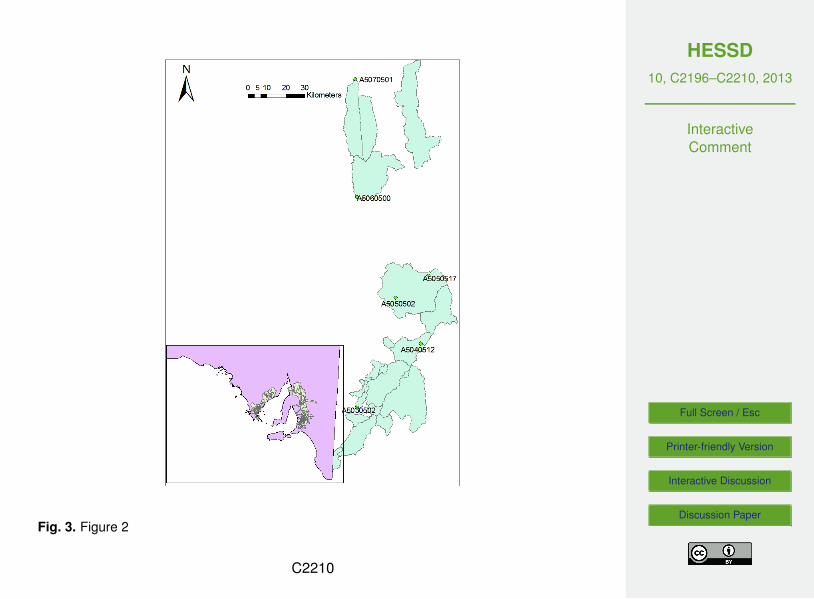
Comment 7: “4- It is suggested that the authors provide a map with more details forthe selected catchments. For instance, the location of rainfall and hydrometry gaugescan be added to the map.”
Response 7: A modified map has been included in the revised paper as shown inFigure 2.
Comment 8: “5- How can it be perceived from Table 3 that the observed and simulatedIL values are within the 95% confidence interval? (Page 4611 Lines 12-14).”
Response 8: Yes, it cannot be said that observed and simulated values of the IL arewithin the 95% confidence interval. We revised the manuscript as follows: “In Table 3,the values of Sim (x) were calculated using a 95% confidence interval.” (Please notethat the Table 3 refer to the original paper)
Response to Reviewer # 2 (anonymous):
Comment 1: “The Authors presented that the two-parameter Gamma distribution wasthe most suited for the initial losses and a non-parametric approach, which was de-veloped in past studies, described successfully both the initial and continuing losses.”“First of all, it is not clear to me what is new in the manuscript regarding to the past
C2200

HESSD10, C2196–C2210, 2013
InteractiveComment
Full Screen / Esc
Printer-friendly Version
Interactive Discussion
Discussion Paper
studies on this issue. The Authors should make clear the scientific frontiers dealing inthe manuscript.”
Response 1: The two parameter Gamma distribution has not previously been tested forthe SA region. Please refer to Response 1 for Reviewer #1 The hydrologic behaviourof SA catchments is quite different from the catchments used in previous studies thathave investigated probability distributions. Therefore this paper aims to find out whetherthe same distributions that were used for other studies are suitable for SA catchmentsor not, and if not what is the best distribution. A two parameter Gamma distributionhas not been tested in SA catchments before. From this study we show that the twoparameter Gamma distribution can only be used to describe IL. Unlike some otherstudies which are based on different hydrological regions, this distribution cannot beused to describe CL in the SA region (Refer to Table 1). Table 1 has been added to theIntroduction section of the revised paper.
Comment 2: “[t]he applicability and usefulness of the presented approach for majorfloods prediction in gauged and ungauged catchments are questionable in my point ofview.”. . . “Why is estimating hydrological losses distribution better than using directlythe stream- flow distribution, which is standard in Hydrologic Statistics (e.g. Stediger,Vogel and Foufoula-Georgiou, 1992), to estimate the major flood flows?”
Response 2: The intended purpose of this study is not to replace flood frequency anal-yses. This study does not question the benefits of the frequency analysis of extremefloods introduced by Stedinger, Vogel and Foufoula-Georgiou (1992). The main appli-cation of the findings is to improve event based RR model predictions. RR models dealwith all the events that have the potential to cause runoff and hence model predictionsat a range of ARIs are expected to be improved by improving loss estimations.
Comment 3: “In order to evaluate the applicability of the presented approach, the Au-thors must still apply it to a set of independent catchments, adopting some regionalisa-tion techniques. Also, the Authors must test whether the presented approach performs
C2201

HESSD10, C2196–C2210, 2013
InteractiveComment
Full Screen / Esc
Printer-friendly Version
Interactive Discussion
Discussion Paper
better than that using the streamflow distribution.”
Response 3: The results have been validated using two test catchments (Rhynie -A5060500 and Splading - A5070501) and new section titled “Results validation” hasbeen added to the revised paper. This validation is to prove that the two parameterGamma distribution can be used for other parts of SA. However, as mentioned in Re-sponse 2, the intended purpose of this study is not to replace streamflow distributionbased analysis.
Comment 4: “1. There is a lot of basic statistics, such as the explanation of bias andMSE, in the text. They can be summarized”.
Response 4: Basics statistics are now only briefly summarized in the revised paper.
Comment 5: “2. Fig. 1 has a very poor quality.”
Response 5: A modified map has been included in the revised paper as shown inFigure 2.
Comment 6: “ 3. Fig. 5 shows strange values for the x-line (MSE).”
Response 6: There was a mistake with MSE values in three graphs: The values shouldbe 0.001, 0.1, 0.2, 0.3, 0.4, 0.5, 0.6, 0.7, 0.8, 0.99 The corrections have been made inthe revised paper.
Comment 7: “4. ∆t instead of t in Eqs (2) and (3).”
Response 7: We have now inserted ∆t inserted of t in Equations (2) and (3)
Comment 8: “5. Lebanon (2010), Hill et al. (1996) and Waugh (1990) are not includedin References.”
Response 8: Missing references have been added to the revised paper.
Comment 9:
“6. In References, L.14 p. 4614 seems strange to me.”C2202
HESSD10, C2196–C2210, 2013
InteractiveComment
Full Screen / Esc
Printer-friendly Version
Interactive Discussion
Discussion Paper
Response 9: Corrected references have been added to the revised paper asfollows: Lebanon, G.: Bias, Variance and MSE of Estimators: available at:http://www.cc.gatech.edu/∼lebanon/notes/estimators1.pdf (last access 1 June 2013),2010.
Response to Reviewer #3 (Dr. Rahman):
Comment 1: “1. In Abstract, some minior rewordings are needed. Line 1, replace"multiple variables" by "various factors".”
Response 1:
Rewording has been done in the revised paper as suggested.
Comment 2: “2. Line 4, Replace first word "Using: by "Use of"”
Response 2: Rewording has been done in the revised paper as suggested.
Comment 3: “3. Line 15, Add a sentence break after "also discussed".”
Response 3: Rewording has been done in the revised paper as suggested.
Comment 4: “4. In Introduction, line 1, replace "crucial" by "an important".”
Response 4: Rewording has been done in the revised paper as suggested.
Comment 5: “5. In page 4599, line 8, what is RR?”
Response 5: RR is Rainfall-Runoff, and this has been added to the revised paper.
Comment 6: “6. Section 2, be more explicit about small to medium sized catchments,see paper by Haddad, K., Rahman, A., Weinmann, P.E., Kuczera, G. and Ball, J.E.(2010). Streamflow data preparation for regional flood frequency analysis: Lessonsfrom south-east Australia. Australian Journal of Water Resources, 14, 1, 17-32.”
Response 6: In the revised paper, small to medium size catchments have been definedas catchments that have an upper limit of1000km2 in area. Also the recommended
C2203

HESSD10, C2196–C2210, 2013
InteractiveComment
Full Screen / Esc
Printer-friendly Version
Interactive Discussion
Discussion Paper
references have been added.
Comment 7: “7. Last line of Section 2, replace "yr" by "years".”
Response 7: Rewording has been done in the revised paper as suggested.
Comment 8: “8. Section 3.1, explain how did you select start of a runoff? Did youselect a threshold runoff?”
Response 8: Yes, a threshold value equal to 0.01mm/hr was used and is now includedin the revised paper
Comment 9: “9. Page 4604, Can you give some justification about the selection ofcandidate distributions?”
Response 9: First the distributions that were used in previous studies were included ascandidate distributions. Then all the other distribution types that can be tested usingSPSS were selected.
Comment 10: “10. Some text book type materials are provided in Section 3 aboutstatistical methods, which should be reduced.”
Response 10: Details of BIAS, MSE have now only briefly been summarized in therevised paper
Comment 11: “11. For non-parametric distribution, how median/mean value of anungauged catchment can be estimated?”
Response 11: Estimating mean/median values for ungauged catchments by using non-parametric methods is out of the scope of the research. However, methods similar tothe index flood approach (Cunnane1988) can be used to estimate the mean/medianof an ungauged catchment. However, this would considerably change the focus of thepaper. Therefore this is not included in the revised paper.
Comment 12: “12. State, how the results of this study can contribute to the on-going
C2204

HESSD10, C2196–C2210, 2013
InteractiveComment
Full Screen / Esc
Printer-friendly Version
Interactive Discussion
Discussion Paper
research on losses in Australia.”
Response 12: The following sentences have been added to the Introduction sectionof the revised paper: “ The results of this paper will provide a significant contributionto the Australian Rainfall and Runoff (ARR) guidelines, which are currently being up-dated. More importantly, this study provides new knowledge on how IL in SA basedcatchments are characterised and this will help fill the gap in ARR information for hy-drological losses in SA catchments.”
Comment 13: “13. Please refer few recent papers e.g. Hill, P., Graszkiewicz, Z., Sih, K.,Nathan, R., Loveridge, M., Rahman, A. (2012). Outcomes from a pilot study on mod-elling losses for design flood estimation, Hydrology and Water Resources Symposium,Engineers Australia, 19-22 Nov 2012, Sydney, Australia. Loveridge, M, Rahman, A.(2012). Probabilistic Losses for Design Flood Estimation: A Case Study in New SouthWales, Hydrology and Water Resources Symposium, Engineers Australia, 19-22 Nov2012, Sydney, Australia.”
Response 13: These references have been added to the revised paper.
Reference
Cunnane, C. :Methods and merits of regional flood frequency analysis, J. Hydrol.,100(1), 269-290, 1988.
Haddad, K. and Rahman, A.: Regionalisation of rainfall duration in Victoria for de-sign flood estimation using Monte Carlo simulation, in: Proceedings of MODSIM05 –International Congress on Modelling and Simulation: Advances and Applications forManagement and De- cision Making, MODSIM05, 12–15 December 2005, Melbourne,VIC, Australia, 1827–1833, 2005.
Ilahee, M.: Modelling Losses in Flood Estimation, Ph.D. thesis, School of Urban Devel-opment Queensland University of Technology, Queensland University of Technology,Queensland, 2005.
C2205

HESSD10, C2196–C2210, 2013
InteractiveComment
Full Screen / Esc
Printer-friendly Version
Interactive Discussion
Discussion Paper
Kuczera, G., Kavetski, D., Franks, S., and Thyer, M.: Towards a Bayesian total erroranaly- sis of conceptual rainfall-runoff models: characterising model error using storm-dependent parameters, J. Hydrol., 331, 161–177, 2006.
Nathan, R. and Weinmann, P.: An improved framework for the characterisation of ex-treme floods and for the assessment of dam safety, in: Proceedings of the British Hy-drological Society International Conference, Imperial College, London, July, 186–193,2004.
Nathan, R., Weinmann, E., and Hill, P.: Use of Monte Carlo Simulation to Estimate theExpected Probability of Large to Extreme Floods, in: Proceedings of the 28th Interna-tional Hydrology and Water Resources Symposium: About Water, 10–13 November,Novotel North beach, Wollongong, NSW, Australia, 1.105–1.112, 2003.
Rahman, A., Weinmann, P. E., and Mein, R. G.: The probabilistic nature of initiallosses and its impact on design flood estimation, Hydrology and Water ResourcesSymposium, Perth, Australia, 20–23 November, Sheraton Perth Hotel, Perth, WesternAustralia, 71–75, 2000.
Rahman, A., Weinmann, P., Hoang, T., and Laurenson, E.: Monte Carlo simulation offlood frequency curves from rainfall, J. Hydrol., 256, 196–210, 2002.
Stedinger, J.R., R.M. Vogel and E. Foufoula-Georgiou: Frequency Analysis of ExtremeEvents, Chapter 18, Handbook of Hydrology, McGraw-Hill Book Company, David R.Maidment, Editor-in-Chief, 1993.
Waugh, A.: Design losses in flood estimation, International Hydrology and WaterResources Symposium, Perth, October 1991, 629–630, 1991.
Please also note the supplement to this comment:http://www.hydrol-earth-syst-sci-discuss.net/10/C2196/2013/hessd-10-C2196-2013-supplement.pdf
C2206
HESSD10, C2196–C2210, 2013
InteractiveComment
Full Screen / Esc
Printer-friendly Version
Interactive Discussion
Discussion Paper
Interactive comment on Hydrol. Earth Syst. Sci. Discuss., 10, 4597, 2013.
C2207

HESSD10, C2196–C2210, 2013
InteractiveComment
Full Screen / Esc
Printer-friendly Version
Interactive Discussion
Discussion PaperFig. 1. Tables
C2208

HESSD10, C2196–C2210, 2013
InteractiveComment
Full Screen / Esc
Printer-friendly Version
Interactive Discussion
Discussion Paper
Fig. 2. Figure 1
C2209
HESSD10, C2196–C2210, 2013
InteractiveComment
Full Screen / Esc
Printer-friendly Version
Interactive Discussion
Discussion PaperFig. 3. Figure 2
C2210