Embed Size (px)
Citation preview

Response to Intervention “A culture is a pyramid to which each of us brings a stone.”
by Wallace Stegner
January 6, 2014
Harrah
Elementary
Presented by
Nancy Goosen
Director of Special Services
Edmond Public Schools

Response to Intervention (RtI) • What is it? It is NOT a program RtI is first a GENERAL Education framework to maximize the
learning of all students by making instructional decisions based on
data and monitor their progress.

Components of RtI 1. Universal Screening (identify students at-risk, not
meant to diagnose)
2. Data Based Decision Making (all decisions are based from the data. (Such as: curriculum, professional development, interventions, including possibly identifying students with a specific learning disability)
3. Tiered Interventions (provide evidence based interventions to give students support)
4. Progress Monitoring (monitor their progress and response to the intervention in order to adjust the intensity/nature of the interventions)
5. Fidelity (looking at the integrity of the curriculum instruction, intervention, assessment, etc.).

Universal Screening
Screening procedures will be administered three times each school year to ALL students in the elementary building:
• Fall
• Winter
• Spring

Curriculum Based Measurements
We are using:
• DIBELS—Dynamic Indicators of Basic Early Literacy Skills
https://dibels.uoregon.edu/
• AIMSweb
http://www.aimsweb.com/
• MBSP—Monitoring Basic Skills Program (Orange/Navy book)

DIBELS Measures
Letter Naming Fluency
Initial Sound Fluency
Phoneme Segmentation Fluency
Nonsense Word Fluency
Oral Reading Fluency
Retell Fluency
DAZE (closure task)
Word Use Fluency

Oral Reading Fluency Refers to accurate, fluid decoding and word recognition.
Number of words read correctly within 1 minute.
(Shinn, Good, Knutson, & Tilly, 1992)
Reading fluency is the single-best indicator of reading
proficiency for younger students
Research (Chard, Vaughn, & Tyler, 2002;
Fuchs, Fuchs, Hosp, & Jenkins, 2001;
Kame’enue & Simmons, 2001) reveals reading fluency is a
prerequisite to independent comprehension of text and has
become a credible target for assessment and instruction in
the general curriculum

CBM is quick to administer
Read the story starter:
The cave was dark with lots of twists and turns.
I was scared, but kept going and……
Student has 1 minute to think and 3 minutes to
write.
Score:
Correct Writing Sequences
Total Words Written

Correct Writing Sequences
• A “caret” looks like
is used to mark each unit of CWS
Rule 1—Spelled correctly ( All of the kids started to
laghf. ---scored 6 CWS out of a possible of 8 CWS)
See remainder of rules on the website for AIMSweb web
site under http://www.aimsweb.com/measures-
2/written-expression-cbm/ scoring guide

Math Correct Digits
Science-based research (Marston, 1989; Thurber & Shinn, 2002)

Local v National Norms
• Schools whose performance on the
Universal Screening is significantly below
the national norms will use the local norms
to validate a discrepancy in performance
relevant to peers.

Need an Anchor
• Without norms and/or benchmarks, progress
monitoring data has limited use
• Data in isolation only tells us what students
can do now
• We are also interested in what they should
be able to do-what is the goal, what they
need to learn next to reach the benchmark,
and if they will likely achieve a “proficient”
outcome

Are these students doing well or not?
Scores on Digits Correct
Fall Winter Spring
John 20 26 25
Sally 16 23 26
Kevin 21 25 22
Paul 19 22 28
Target Goal
or
Benchmark
80
80
80
80

Graphing Data
“Aimline”
At or Below 65
3 Target Goals
Fall Universal Screening Score = 8 Words Read Correctly
Weeks
Word
s R
ead C
orr
ectl
y
65
37
8
End of 2nd Grade
Well Below Benchmark
At or Above 87
OCCT
Eligibility
for Specific
Learning
Disability

RtI Technical Manual • Decisions are made based on data. There are no rules
made for RtI in the literature except the ones each district develops. Edmond RtI Technical Manual has specific rules regarding the 3 tiered model with cut-off scores that drive decisions on when to move a student from one tier to the next.
• Without good adherence to the rules, then anything goes—Therefore, we have a manual to refer to so that we are consistent across the district.
• Decision rules also provide us with a standard process that will guide the intervention decisions as well as contribute to possible eligibility decisions for other programs providing long-term interventions

4x4 Rules • 4 to Score
– 4 intervention sessions before the weekly progress monitoring
– Allowing enough exposure for meaningful measurement
• 4 to Explore – 4 data points either above (means to continue or
remove the intervention) or on or below (means to change the intervention either intensify or change the type)
– Allowing enough time for intervention to work, establishing a clear performance pattern
• 4 to Do More – 4 below aimline= change intervention
• 4 to Watch ‘em Soar – 4 above aimline= discontinue intervention

Progress Monitoring
• Teachers provide interventions in the classroom for the students “at risk” identified through the universal screening in Tier I
• Teachers conduct weekly curriculum based measurements (CBMs) to progress monitor the student(s) responses to the intervention they are implementing in the classroom IF they have implemented the interventions 4 times that week.
• Interventions will last for a minimum of 4 weeks in Tier I.

Graphing Data
“Aimline”
25 %ile
Target Goal
Well Below Benchmark
or
Universal Screening Score
Weeks
Word
s R
ead C
orr
ectl
y

Wo
rds
Rea
d C
orr
ectl
y
Weeks
TIER 1
Target Goal

Word
s R
ead C
orr
ectl
y
Weeks
Target Goal

What an Intervention
IS NOT
• Moving the student closer to the front of
classroom or near teacher or separate
location
• Reducing the assignment or reducing the
number of items of an assignment
• Re-read directions or read test for student
These are all accommodations

Tiered Interventions
• Targeted
• Systematic (Scientifically based approach)
• Designed to directly improve the targeted
skill (single skill or targeted behavior)
• Not graded—not an assignment
• It’s specially designed instruction providing
the student with immediate feedback

Who is “At Risk”
Within Tier 1
Use a Universal Screening to determine which
students are “At Risk” and will be placed on Tier 1 in
need of interventions.
What are some types of Tier 1 interventions
• Computer Software Programs (e.g., SuccessMaker)
• Interventions built into the curriculum (Reading
Street Curriculum builds in supplemental materials
for interventions for students at-risk.

Say It, Move It
Example of Tier 2: Scientifically based researched intervention

Phaseline
TIER 2
TIER 1
Target Goal
Notice the slope of the aimline must become steeper to meet the goal

Phaseline
TIER 2
TIER 1
So we make a new aimline
Target Goal
and intensify the intervention

Slope of the Aimline Changes
with each intervention change.
Creating new aimlines and intensifying
the intervention
Phaseline
Target Goal
Original Aimline
goes away

Trendline
2nd phaseline
TIER 1
TIER 2
?
Target Goal

Treatment Fidelity
• Was the intervention implemented correctly?
A checklist will be completed from an observer (e.g., school psychologist, another teacher, school counselor, etc.) to assist in determining if the intervention is being implemented in the manner in which it was designed
• If you don’t have this component, then nothing matters. Teachers should not become defensive, but embrace treatment fidelity, because how can we improve upon intervention usage if it is not being implemented correctly?
• Legal support system

Example of Fidelity Checklist Response to Intervention Fidelity Check/ Observation
Tier II and Tier III
Student Name: _____________________________ Interventionist:______________________
Date of Check: _______________________________ Amount of Time Spent on Intervention___
Self-Check ____ or Observation ___ Name of Observer___________________
The interventionist had the materials he/she needed to deliver the intervention. ____YES ____NO
The intervention was delivered in a manner which is consistent with the plan as described. ____YES ____NO
ALL steps within the intervention were completed as written. ____YES ____NO
(Please note any variation in procedure, missed steps, interruptions, etc.)
_______________________________________________________________________________
_______________________________________________________________________________
_______________________________________________________________________________
The interventionist actively monitored the engagement of each child in the intervention. ____YES ____NO
The student’s behavior was satisfactory/ did not interfere with the implementation of the intervention.____ YES ____NO
The student’s attendance has not been a significant factor in hindering his/her progress. ____YES ____NO
The intervention seems appropriate for the needs of this student. _____YES ____NO
Notes: ____________________________________________________________________________________
__________________________________________________________________________________________

“A River Runs Through It”

Mellard and Johnson 2007
Fidelity should flow through the whole
process:
• Core Curriculum
• Assessment (universal screening and
progress monitoring)
• Interventions
• Data Based Decision Making

Targeted Skills
Instructional Hierarchy
1. Acquisition
2. Fluency
3. Generalization
4. Adaptation

Instructional
Hierarchy
Learning
Hierarchy
Teaching Hierarchy Example Tier 2
Interventions
Acquisition
Slow and Inaccurate Modeling
Explicit Instruction
Immediate Feedback
Say It/ Move It- Letter Sounds
Fold In- Sight Words
Accuracy
Accurate, but Slow Familiar Practice Activities
Independent Practice
Immediate Feedback
Reading Sprints
Listening Passage Preview
Fluency
Accurate, and Rapid Novel Practice Activities
Timings
Immediate Feedback
Cold Read/ Hot Read
Sprint Reading
Generalization
Can Apply to Novel
Settings
Discrimination Training
Differentiation Training
Reading Detective
Question Generation
Adaptation
Can Use Information to
Solve Problems
Problem-Solving
Simulations
Advanced Story Maps

Problem Analysis
• Skill Deficit: Student lacks necessary skills to perform the academic task. Skill deficits can be broken down into Acquisition and Accuracy deficits
• Fragile Skills: Student has the necessary skills, but is not fluent/automatic (often seen when student is inconsistent in performance)
• Performance Deficit: Student has the necessary skills and fluency, but lacks motivation.

Can’t Do or Won’t Do
• Jennifer’s multiplication In class performance = 25% accurate
Implement reward = 85% accurate
• Mark’s reading comprehension In class performance = 0% accurate
Implement reward = 30% accurate
• Kathy’s oral reading fluency In class performance = 30% accurate
Implement reward = 29% accurate
Won’t Do = no motivation Can’t Do = Lack of Ability
Won’t Do
Combination
Can’t Do

Tier 2
• If the progress monitoring data from Tier 1 indicate that the intervention is unsuccessful, the student will be referred to the RtI team.
• The team will develop a specific intervention and monitoring plan, set a goal, and reconvene to review progress.
• Intervention during this stage lasts a minimum of 10 weeks.

Good and Shinn (1990) Why assess for 10 weeks prior to moving to another Tier?
Research by Roland Good & Mark Shinn in 1990 found 10 data
points were necessary to have sufficient data to make reliable
decisions. Also, Gall & Gall, 2007, supported Good & Shinn’s
research, stating again, 10 data points are a minimum requirement
for a reliable trend line to make educational decisions.

What is Tier 2?
Who implements?
• Tier 2 interventions do not replace the core curriculum, they supplement it. By taking part in both general and targeted instruction, the learning opportunities for these students are extended.
• General Ed Teacher
or another person trained
to implement the strategic
evidenced-based intervention
Extra Academic Work-out
Core Targeted Skill

Differentiated Instruction
• An essential part of an instructional program to
implement interventions
• Flexible groupings/centers
meet the diverse learning
demands of all our students
• All students are part of the general education
system, there is a shared responsibility for student
achievement across the entire school community

I Don’t Have Time to Do
Interventions
Work Smarter……. Not Harder
Organize instruction----Have 30 minute Skills Groups---Use flexible groupings or flexible center activities divided up in specific areas---Be Creative (by teacher; by subject; by skill):
Phonemic awareness (e.g., phoneme isolation; phoneme blending; phoneme segmentation)
Phonics (e.g., alphabet recognition; patterns within words; sound/symbol relationships)
Fluency (e.g., sight words, speed/timed readings, phrasing, or intonation or inflection)
Vocabulary (e.g., prefix/suffixes/root words, synonyms/antonyms, etc.)


Problem Solving within Tiered Model Define the Problem
Develop a Plan
Implement the Plan
Frequency/Duration
Evaluate
Progress
Monitoring
Target Skill or Specific Content or Behavior
RtI Team
What is the problem? Why is it occurring?
What are we going
to do about it?
Did it Work?
Modify the Plan

Where does Special Ed come into
the RtI Model?
• A smaller piece of RtI may also function as an alternative method of identifying students who may have a Specific Learning Disability instead of using the traditional discrepancy model.
• IDEA Amendment of 2004
Gave States options between
RtI and Discrepancy Models

History Best gain the reason within the context of history
Prior to the 1970s, Public school practice was to
systematically deny students with handicaps
access to a public school education
President Gerald Ford signed
Public Law 94-142,
the Education for All
Handicapped Children's Act
(EHA), in 1975

Two Outcomes of PL 94-142
1. Child Find: “Find"all those students who had been denied access to a public education
2. Procedural safeguards: Parent Rights--requiring written consent for assessment and placement, adherence to assessment timelines, creation of an individualized education program (IEP), and regular reviews (annual and triennial) of placement status. (Monitoring of files by state departments of education focused exclusively on these safeguards, with little to no attention paid to academic outcomes for students identified as handicapped). The important documents that school districts needed to have were referral forms, consent forms, placement permissions, and IEPs.

How did Special Education impact
General Education? The impact on general education was subtle yet
profound.
When students failed to learn in a general education setting, it was
expected, if not required, that the student be referred for special education consideration.
Over time, this practice had an impact on both systems (general and special education) in two significant ways.
1. Special education enrollment ballooned, with too many students identified as disabled—not because they had a disability, but rather because they had not been successful in a general education program.
2. Changed Teacher’s Perspective: Failure to succeed in a general education program meant the student must, therefore, have a disability.

How have we been determining if the
student had a Specific Learning Disability?
With the Discrepancy Model
IQ Test score v. Achievements----Is the IQ discrepant with Achievement Test scores? (-22 point difference)
Many times a severe discrepancy could not be measured until the end of 2nd or beginning of 3rd grade.
Discrepancy Model became known as:
The “Wait to Fail” Model

Poor Treatment
With the Discrepancy Model
Eligibility is the main concern,
NOT the student’s individual treatment
Looking for the
Diagnosis----
not how to treat the
skill deficit

RtI is Not
NOT a pre-referral process
Meaning it is not something we do before we test to place a child in special education
Not about admiring the problem
It is about Problem Solving
About treatment
AND
SEAS

Why has the Discrepancy Model
Endured??
• Big debate that we must identify a processing disorder---Does that help identify how to teach the student to read?
• IQ-Achievement discrepancy
Is easy to administer and
provide quick results.
Test to place.

59% Specific
Learning
Disability
Total IEP Population
Over Identifying in 2000
Reduced Specific Learning
Disability Category by approx. 28%
31% SLD
2012 Edmond Public Schools
SLP
DD
OHI
SLP

Specific Learning Disability
RtI Model is first a GENERAL EDUCATION system to maximize the learning of ALL students by making instructional decisions based on data and monitoring their progress.
A Multi-Level Intervention System that “prevents” students from needing
special education services
1,494 in 2000 794 in 2012
1232 7
94
1494
Edmond Public School District’s Child Count
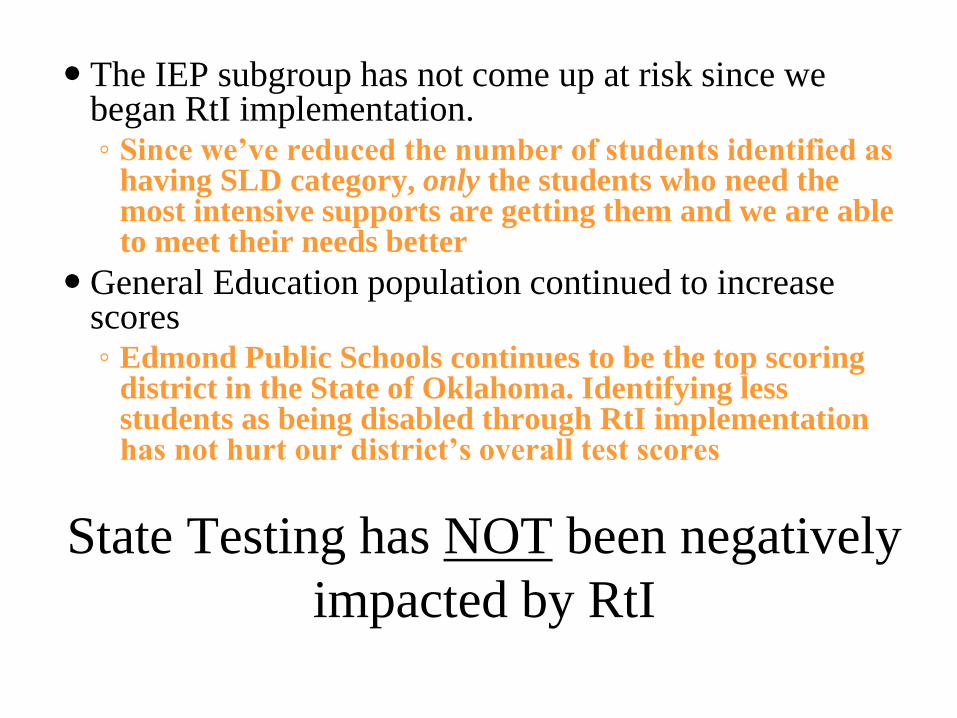
State Testing has NOT been negatively
impacted by RtI
The IEP subgroup has not come up at risk since we began RtI implementation. ◦ Since we’ve reduced the number of students identified as
having SLD category, only the students who need the most intensive supports are getting them and we are able to meet their needs better
General Education population continued to increase scores ◦ Edmond Public Schools continues to be the top scoring
district in the State of Oklahoma. Identifying less students as being disabled through RtI implementation has not hurt our district’s overall test scores

Problem-Solving
Data-Based Decisions
Tier 1: at least 4 weeks; teacher designed interventions
Tier 2: minimum 10 weeks; researched-based interventions designed by the RtI team
Tier 3: prolonged intervention that requires intensive/strategic instruction

Do we lower the Target Goal if we
move a student into Tier 3?
No
Target Goal remains the same,
yet the slope of the Aimline
continues to become steeper

Tier 3
• Tier 3 intervention is reserved for those students who require intensive interventions over a prolonged period of time.
• Tier 3 does not equal Special Education. In fact, Tier 3 could be Title I, or ELL or any other specialized program to provide intense, prolonged interventions lasting at least one year or longer.

Dual Discrepancy
• Student is discrepant from peers in achievement identified through the universal screening (At risk falling at or below the 16th %ile)
• Student is discrepant from peers in the growth rate (Based on CBM National or Local Norms) based on progress monitoring with interventions implemented

Traditional v Intervention • Traditionally we have pulled students out of the general
education environment during reading to come to special education to obtain a separate reading curriculum. We have provided a separate, but not equal education in special education
• With RtI, special education will be seen much like Title I. Special education teachers will not give a grade, because the student will not be pulled out during core instructional times for Reading, Math, and Written Expression.
• Change special education to be an intervention in addition to the core curriculum.

Transition in Implementation
• During the Transition Time from the Discrepancy Model to the RtI model you will need to focus on the students being identified through the RtI process and the lower grade levels (K-2).
• Older student in 3rd, 4th, and 5th grades may not be able to switch to the new model due to being out of the classroom setting for so long.
• Might individually decide which students through an IEP team meeting might be able to be placed in the general education classrooms.

How do we Progress Monitor a student
who has not mastered grade level skills?
• Survey Level Assessments (SLA) to find instructional level to progress monitor in special ed
SLA is an assessment process that is used to determine a student’s mastery (or independent level), instructional, or frustration level in a given skill or content area.
Special Ed teacher will administer 3 probes on the student’s grade level and moved down grade levels until the mean score is within the average range for a grade level to find the student’s instructional level and which skill areas they have mastery or are at the independent level.

How do we EXIT a student off an
IEP?
• The IEP team makes the decision based on data.
• If there is 4 consecutive data points at or above the Targeted Goal at the 25%ile for that single skill or content deficit, for that particular grade level, for that specific subject matter.

Tier 3 Supports – Paradigm Shift
• Direct Service Time
–Suggested 30 minutes per subject
–Direct service is based on specific
interventions in skill deficit area
–As caseloads decrease then • Co-teaching
• Push In/Tier 2
• Behavior Support
• Educating Parents
Exiting from special ed
This may
change year by
year depending
on caseloads
and staff
available.

Scheduling/Logistics
1/17/2014 64

1) Training:
A. RtI Implementation:
Dr. Gary Duhon with Oklahoma State University, and
Christa Knight with the Oklahoma State Department of
Education
B. CBM Training (e.g., DIBELS)
DIBELS 1 (Basics-Administrating and scoring),
DIBELS 2 (Progress Monitoring), and
DIBELS 3 (Advance-linking DIBELS data to effective
reading instruction)
C. Book Studies on RtI
What are some things you need to do before becoming an
RTI Problem-Solving Model Building

Resources
The best and most accurate site on RtI is
• http://www.rti4success.org/
National Center on Response to Intervention
• http://www.studentprogress.org/
The National Center on Student Progress Monitoring (Note: Funding has ceased, but website will continue)
http://www.rtinetwork.org/
RtI Action Network
www.nasde.org

Books • The ABCs of CBM by Drs. Michelle K.
Hosp, John L. Hosp
• Interventions for Reading Problems:
Designing and Evaluating Effective
Strategies by Edward Daly III, et.al.
• RtI in the Early Grades: Intervention
Strategies for Math, Literacy, Behavior &
Fine Motor Challenges by Chris Weber
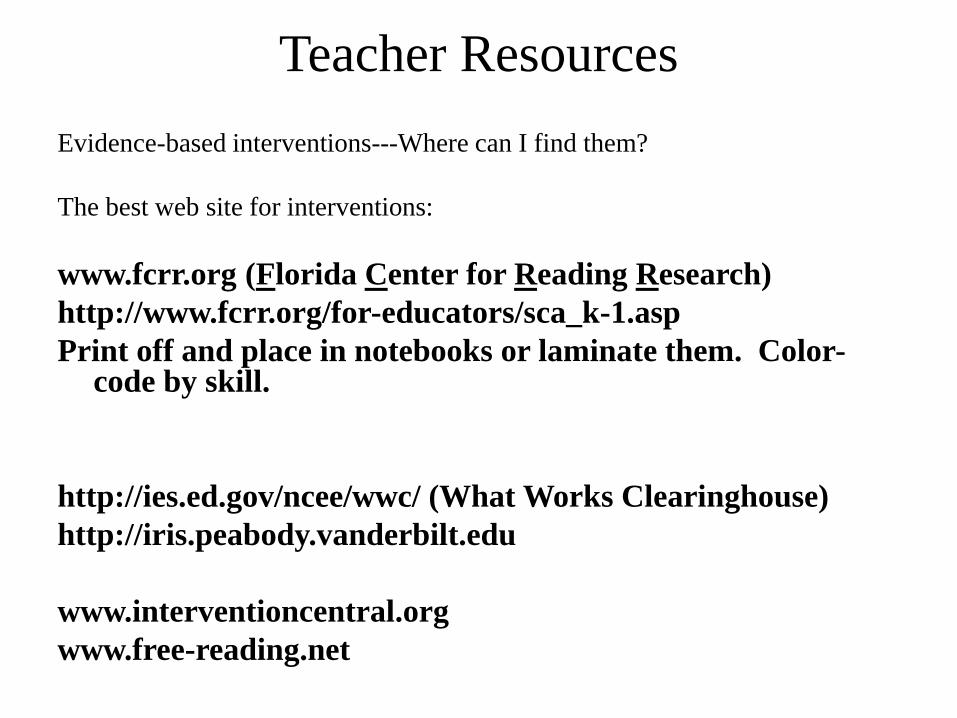
Teacher Resources
Evidence-based interventions---Where can I find them?
The best web site for interventions:
www.fcrr.org (Florida Center for Reading Research)
http://www.fcrr.org/for-educators/sca_k-1.asp
Print off and place in notebooks or laminate them. Color-code by skill.
http://ies.ed.gov/ncee/wwc/ (What Works Clearinghouse)
http://iris.peabody.vanderbilt.edu
www.interventioncentral.org
www.free-reading.net

![Response to Intervention (RtI) Handbook and RtI Resources · 2016-12-09 · OASD RtI Handbook [2] Response to Intervention (RtI) Overview Core Principles of RtI RtI is grounded in](https://img.pdfslide.us/doc/110x75/5f04175d7e708231d40c46b9/response-to-intervention-rti-handbook-and-rti-resources-2016-12-09-oasd-rti.jpg)