Embed Size (px)
Citation preview

eeeeA joint venture of the Center for Policy Studies and Hamline University
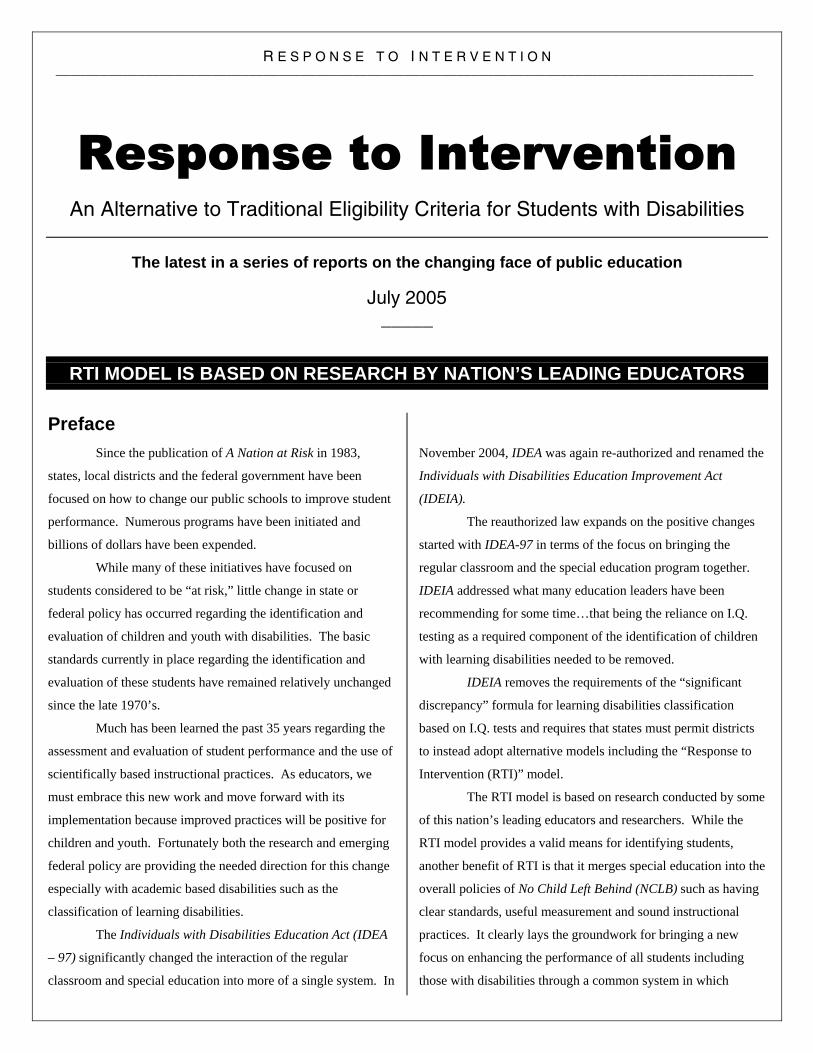
RESPONSE TO INTERVENTION An alternative to traditional eligibility criteria for students with disabilities
The latest in a series of reports on the
changing face of public education July 2005

ABOUT THE CONCEPT OF AN ‘OPEN SECTOR’ IN EDUCATION
Much of the work being done by Education|Evolving is to help create and sustain an “Open Sector” in public education – in Minnesota and elsewhere in the country. By “Open Sector,” we mean a “space” in public education that is open to new entrants – new schools that are started from scratch by teachers, parents, community organizations and multi-school networks. The “Open Sector” is also open to new authorizers or sponsors – entities other than school districts that oversee schools. The “Open Sector” is open to new learning programs and to new ways of governing and managing schools. And, as part of a broadening definition of public education, the “Open Sector” is open to all students who choose to attend schools in that sector. The “Open Sector” is based on the premise that we cannot get the degree of change and im- provement we need in education by relying only on fixing the schools we now have. And, to get enough new schools that are fundamentally dif- ferent, we need a combination of public policies and private actions that will allow new schools to emerge and that will create an environment in which they can succeed. This kind of positive envi-ronment for creating and sustaining new schools can be established on a state-level through act-ions led by state policy makers. It can also be done – and is certainly needed – in major urban communities all across America.
Though chartered schools may be the most visible part of the “Open Sector” today, this concept of a positive environment for creating and sustaining successful new schools is not limited to char-ters. The “Open Sector” can also include schools operating within a district or state on some kind of contract other than a charter – as long as they are truly autonomous, accountable and open to all students who chose them.
There is also no prescribed or uniform learning program presumed by this vision for creating many more schools new. In fact, there’s an urgent need to better understand, respect and address the individual differences in students. It’s likely, however, that successful new schools in the “Open Sector” will be smaller and that they will make it possible for all students to take a more active role in their learning and to develop more direct and nurturing relationships with adults.
ABOUT THIS REPORT AND ITS AUTHOR
This publication is the latest E|E report on the changing face of public education, both nationally and in Minnesota. The report describes and provides a review of the research on an alternative learning model called Response to Intervention (RTI). This model may be used for any student experiencing difficulty in school, but has particular application in the Special Education environment.
Under this model, student performance data are gathered frequently and are immediately available to teachers, psychologists and others. The data are then available to help evaluate that effective-ness of the instruction strategies being used and, when warranted, spur modifications in teaching and learning models that can produce better results.
Research and writing for this publication was done by E|E associate Robert J. Wedl. Wedl, who directs E|E’s sponsorship initiatives, is a former Minnesota Commissioner of Education and former senior executive in the Minneapolis Public Schools, including service as the district’s director of special education. Final editing and production supervision was provided by E|E’s coordinator, Jon Schroeder.
R E S P O N S E T O I N T E R V E N T I O N ______________________________________________________________________________________________
Response to Intervention
An Alternative to Traditional Eligibility Criteria for Students with Disabilities
The latest in a series of reports on the changing face of public education
July 2005 _____
RTI MODEL IS BASED ON RESEARCH BY NATION’S LEADING EDUCATORS
Preface Since the publication of A Nation at Risk in 1983,
states, local districts and the federal government have been
focused on how to change our public schools to improve student
performance. Numerous programs have been initiated and
billions of dollars have been expended.
While many of these initiatives have focused on
students considered to be “at risk,” little change in state or
federal policy has occurred regarding the identification and
evaluation of children and youth with disabilities. The basic
standards currently in place regarding the identification and
evaluation of these students have remained relatively unchanged
since the late 1970’s.
Much has been learned the past 35 years regarding the
assessment and evaluation of student performance and the use of
scientifically based instructional practices. As educators, we
must embrace this new work and move forward with its
implementation because improved practices will be positive for
children and youth. Fortunately both the research and emerging
federal policy are providing the needed direction for this change
especially with academic based disabilities such as the
classification of learning disabilities.
The Individuals with Disabilities Education Act (IDEA
– 97) significantly changed the interaction of the regular
classroom and special education into more of a single system. In
November 2004, IDEA was again re-authorized and renamed the
Individuals with Disabilities Education Improvement Act
(IDEIA).
The reauthorized law expands on the positive changes
started with IDEA-97 in terms of the focus on bringing the
regular classroom and the special education program together.
IDEIA addressed what many education leaders have been
recommending for some time…that being the reliance on I.Q.
testing as a required component of the identification of children
with learning disabilities needed to be removed.
IDEIA removes the requirements of the “significant
discrepancy” formula for learning disabilities classification
based on I.Q. tests and requires that states must permit districts
to instead adopt alternative models including the “Response to
Intervention (RTI)” model.
The RTI model is based on research conducted by some
of this nation’s leading educators and researchers. While the
RTI model provides a valid means for identifying students,
another benefit of RTI is that it merges special education into the
overall policies of No Child Left Behind (NCLB) such as having
clear standards, useful measurement and sound instructional
practices. It clearly lays the groundwork for bringing a new
focus on enhancing the performance of all students including
those with disabilities through a common system in which

R E S P O N S E T O I N T E R V E N T I O N ______________________________________________________________________________________________
2
classroom teachers, special education teachers and other
specialists can work together.
The results of implementing an RTI model will not only
be reduced paperwork and Individual Education Plans (IEP’s)
more focused on the attainment of learning standards, but it also
provides a new focus on improving student performance in
collaboration with all of those delivering educational services for
these children.
While procedural compliance must always be achieved,
in many districts, “being in compliance” has unfortunately
become special education’s primary goal. The goal to improve
student learning has been the “forgotten goal.” RTI helps to
make student learning the renewed focus.
Perhaps this is RTI’s most powerful benefit. Students
can no longer just be referred out of the classroom. Sound
evidence that research-based instructional interventions have
been initiated and data verifying the impact of these
interventions are key components to the RTI evaluation and
decision-making model.
Student performance data are gathered frequently and
are immediately available to teachers, psychologists and others.
They provide information to those delivering instruction as to
the effectiveness of that instruction. Based on these data,
instruction must be modified or changed. Students do not
continue in programs that are not working for them.
The frequent collection of data, aligned to state, local
and IEP standards, tells the teachers whether the student is on
track to meet these standards. If the student is not progressing,
teachers must change what they are doing because the
instructional strategies being implemented are not working with
the student.
While educators suggest that “this is what we do,” in
reality, instructional modification does not occur frequently and
typically is not done systematically or based on performance
data. At times we try to make students change when it is our
instruction that must change.
The use of the RTI model is not unique to special
education nor does this paper suggest that it is. It can and should
be used for any student that is experiencing difficulty in our
schools. This paper provides a review of the research regarding
RTI and the practical implementation model suggested provides
a starting point for sites to change their current practices to this
exciting new model.
Robert J. Wedl

R E S P O N S E T O I N T E R V E N T I O N ______________________________________________________________________________________________
3
I. Introduction This paper describes the Response to Intervention (RTI)
model that gained credibility in recent years as an alternative to
traditional special education criteria for students with high-
incidence disabilities.
model for special education services. The model is a useful
approach to providing data-based decision-making for any
students who may be in need of extra interventions for
improving their performance.
This paper addresses the following topics: history of
learning disabilities, eligibility issues, the reauthorization of
IDEA 97, the RTI model, RTI research, and model
implementation.
II. History of How Public Policy has Defined Learning Disabilities
Public Law 94-142 Federal support for special education services in this
country became a reality in 1976 with the passage of the
Education for All Handicapped Children Act of 1975 (Public
Law 94-142).
Hailed as one of the most influential federal laws
affecting the delivery of education services to students with
disabilities, this historic legislation contained several mandates,
including: a free and appropriate public education for students
with disabilities, an education in the least restrictive
environment, due process rights for parents, access to technically
adequate and nondiscriminatory evaluation procedures as well as
other provisions.
This legislation was renewed with the passage of the
Individuals with Disabilities Act of 1990 (101-476, IDEA) and
again reauthorized in 1997 (IDEA, 1997).
IDEA 97 identifies thirteen categories of disability. By
far the largest category is Learning Disabilities, which includes
almost 52% of the students served in special education in this
country (Gresham, 2001). It is also the disability category that
has created the most controversy over the past thirty years.
Much of the concern is related to definition and eligibility.
Definitional Issues The definition of learning disabilities has changed very
little since the 1960s. According to the Learning Disabilities
Association of America’s website (www.Idanatl.org), Samuel
Kirk initially used the term “learning disability” at a national
conference in 1963 to describe students having difficulty
learning. In his work, Kirk described learning disabilities as
follows:
Children with specific learning disabilities means those
children who have a disorder in one or more of the basic
psychological processes involved in understanding or in using
language, spoken or written, which disorder may manifest
itself in imperfect ability to listen, think, speak, read, write,
spell, or to do mathematical calculations. Such disorders
include such conditions as perceptual handicaps brain injury,
minimal brain dysfunction, dyslexia, and developmental
aphasia. Such term does not include children who have
learning problems which are primarily the result of visual,
hearing, or motor handicaps of mental retardation, of
emotional disturbance, or of environmental, cultural, or
economic disadvantage (p. 65803).
The definition has changed very little since then
(Ysseldyke and Marston, 1999). In Public Law 94-142, specific
learning disability is defined as:
…a disorder in one or more of the basic psychological
processes involved in understanding or in using language,
spoken or written, which may manifest itself in an imperfect
ability to listen, think, speak, read, write, spell or to do
mathematical calculations. [P.L. 94-142, 121a. 5b(9)]
IDEA 97 While continuing to reinforce important concepts
outlined in previous special education legislation, the passage of
IDEA 97 also recognized the significance of new issues, such as
the importance of regular education interventions and the use of
RTI, however, is more than a part of an eligibility

R E S P O N S E T O I N T E R V E N T I O N ______________________________________________________________________________________________
4
problem solving models for serving students with disabilities
(Prasse, 2002). IDEA 97 states:
Over 20 years of research and experience has demonstrated
that the education of children with disabilities can be made
more effective…(F) providing incentives for whole-school
approaches and pre-referral interventions to reduce the need
to label children as disabled in order to address their learning
needs; and (G) focusing resources on teaching and learning
while reducing paperwork and requirements that do not assist
in improving educational results (Section 601(c)(5), IDEA).
Prasse (2002) also observed that IDEA 97 contained
several provisions that reinforced the coordination of general
and special education. He noted extensive research and
experience had, “demonstrated that the education of children
with disabilities can be made more effective by (a) having high
expectations for such children and ensuring their access to the
general curriculum to the maximum extent possible; (b)
strengthening the role of parents and ensuring families have
meaningful opportunities to participate…(p.72).
Despite the emergence of these new concepts in IDEA
97, a traditional definition of learning disabilities remained. The
final regulations of IDEA 97 – 300.541 define the criteria for
determining the existence of a specific learning disability in this
way:
(a) A team may determine that a child has a specific learning
disability if –
(1) The child does not achieve commensurate with his or
her age and ability levels in one or more of the areas listed
in paragraph (a) (2) of this section, if provided with learning
experiences appropriate for the child’s age and ability
levels; and
(2) The team finds that a child has a severe discrepancy
between achievement and intellectual ability in one or more
of the following areas:
(i) Oral expression.
(ii) Listening comprehension.
(iii) Written expression.
(iv) Basic reading skill.
(v) Reading comprehension.
(vi) Mathematics calculation.
(vii) Mathematics reasoning.
(b) The team may not identify a child as having a specific
disability if the severe discrepancy between ability and
achievement is primarily the result of –
(1) A visual, hearing, or motor impairment;
(2) Mental retardation;
(3) Emotional disturbance; or
(4) Environmental, cultural or economic disadvantage.
Because of this broad definition and lack of clarity
regarding what constitutes a learning disability, the category has
become a “catch-all” label. Gresham (2001) refers to a
suggestion by G. Reid Lyon of the National Institute of Child
and Human Development that “learning disabilities have become
a sociological sponge to wipe up the spills of general education”
(p. 1).
In part, this is due to inconsistent application of the
definition. Gresham goes on to point out, “Findings over the
past 15 years have pointed out the lack of consistent definition in
policy or practice in the identification of LD students. Research
findings indicate that substantial proportions of school-identified
LD students – from 52 to 70 percent – fail to meet state or
federal eligibility criteria” (p. 1).
Fletcher, et al. (1998) raise the issue that the current
model for identification is a “wait to fail” approach that does not
get needed education services to students with disabilities until
3rd or 4th grade. Often the initial referral is made as early as first
grade when the teacher recognizes the student is having
significant difficulty in learning to read.
However, the ability-achievement discrepancy model
tends not to identify these students as needing the intensive
instruction found in special education. “For treatment, the use of
the discrepancy models forces identification to an older age
when interventions are demonstrably less effective” (Fletcher et
al., 1998, p. 201).

R E S P O N S E T O I N T E R V E N T I O N ______________________________________________________________________________________________
5
III. Eligibility Issues There are many issues regarding the criteria for
eligibility for learning disabilities which include both technical
and conceptual problems. A critical problem is the lack of
professional agreement on what constitutes a learning disability.
Naturally this results in significant inconsistencies for
LD eligibility across the nation (Ysseldyke, Algozzine, & Epps,
1983). Macmillan et al. (1998) found similar results. Reschly
and Tilly (2000) report the prevalence figures for learning
disabilities across fifty states range from 2.73% to 9.43%. They
conclude, “these variations in prevalence are more likely to be
related to unique state-by-state practices regarding how children
and youth with mild disabilities are identified as disabled than to
real differences in student populations.”
Some of these inconsistencies may be attributed to
technical issues related to the ability-achievement discrepancy
score. Reschly and Ysseldyke (2002) note discrepancy scores
may contain considerable measurement error. These authors
stated, “the exact size of ability-achievement discrepancy is
significantly less reliable than either of the tests used to
determine the discrepancy” (p. 8).
Another difficulty is related to the use of IQ tests as a
measure of ability (Siegal, 1989) and its potential for
discrimination (Larry P. v. Riles, 1977, 1984; Galagan, 1985). If
there is bias in these instruments for some populations of
students, it raises the question as to whether they can be used in
the eligibility process.
For disabilities, such as developmental cognitive
disabilities, where the IQ score is an important element of the
criteria, one might see “over-representation” of certain groups.
In fact, the National Academy of Sciences concluded, “The
balance that is struck between IQ and other measures is likely to
have significant consequences for the proportion of minority
children placed in educable mentally retarded (EMR) classes,
since minority children consistently score lower on standardized
tests of ability than do white children” (Heller, Holtzman, and
Messick, 1982).
For the learning disabilities category, the ability-
achievement discrepancy formula may contribute to under-
representation. Since the “ability” part of this equation is
measured by IQ, a student who performs poorly on the IQ test
will have difficulty demonstrating a significant discrepancy
between ability and achievement, and therefore not be found
eligible for services to which they are entitled (Ysseldyke &
Marston, 1999).
Just as problematic is the lack of research
demonstrating a connection between assessment and instruction
for students found eligible through the
discrepancy process.
Gresham (2001) writes, “The most serious flaw in the
current process is the absence of a direct link between
assessment procedures used for identification and subsequent
interventions that might be prescribed on the basis of these
assessment procedures. What appears to be needed is an
approach to defining LD that is based on how students respond
to instructional interventions rather than on some arbitrarily
defined discrepancy between ability and achievement” (page 3).
Finally, researchers have noted that differentiating
between LD, MR, and low achieving has always been
problematic. Gresham, MacMillan, and Bocian (1996), showed
considerable overlap among these groups on a variety of
educational variables.
The Algozzine, Ysseldyke and McGue (1995) research
also revealed few differences between low achieving and
learning disabled students. Vellutino et al. (2000) also
addressed the problems of using a discrepancy formula to
differentiate the needs of students who need help in reading.
IV. Most Recent Reauthorization of IDEA-97 -- to IDEIA
The reauthorization of the Individual Disabilities
Education Act (IDEA 1997) occurred in November 2004. Both
the House version (H.R. 1350) and the Senate version (S. 1248)
acknowledged the difficulties with the traditional IQ-
achievement discrepancy. The “House Committee on Education

R E S P O N S E T O I N T E R V E N T I O N ______________________________________________________________________________________________
6
and the Workforce” Report 108-077 quotes Dr. Robert
Pasternack, former Assistant Secretary for Special Education
and Rehabilitative Services:
“The convergence of scientific research about LD
[“Learning Disabled”], especially reading difficulties
associated with LD, has placed us on the edge of new
knowledge that we did not have even a few short years ago.
We now know, for example, that the way we have
traditionally looked at assessment of learning disabilities
needs to be re-thought based on recent research in the use
and role of IQ test in assessments for eligibility. We know
that using IQ discrepancy between the test and performance
is not always an indicator of a learning disability. Indeed,
some research indicates that if a child who reads slowly
has IQ scores that are above average, that child might
receive services under IDEA based on the discrepancy
between the IQ scores and the reading ability. On the other
hand, another child who also reads slowly but has IQ scores
that are average may not receive any services because of
the lack of a significant discrepancy. Such approaches to
assessment may clearly result in some children who need
services not getting them wile other who do not need them
will receive them.”
In response to these criticisms the Committee
recommended that LEAs be permitted (not required) to utilize
Response to Intervention (RTI) procedures. Doug Carnine,
director of the National Center to Improve the Tools of
Educators at the University of Oregon testified before the House
Committee on Education and the Workplace, Subcommittee on
Education Reform as follows:
“Given the converging evidence and agreement in the field
that we must do something better for our children, the
following model is recommended as the basis to improve
how we provide early intervention and identification:
Response to Intervention Model (RTI). An RTI model would
be designed to ensure that children who are indicating a
likelihood of failing in the early grades receive scientifically
based instruction as soon as possible. The eligibility for
special education services would focus on the children who,
even with these services, are not able to be successful. The
focus of RTI is on responding to the instructional challenges
caused by the disability not on giving tests to document the
failure of the student.” (Testimony provided on March 13,
2003)
The reauthorized IDEIA recognized these problems and
now includes the following provision at Section 614 (a) (6)
Specific Learning Disabilities:
(A) IN GENERAL. Notwithstanding section 607 (b), when
determining whether a child has a specific learning
disability as defined in section 602, a local educational
agency shall not be required to take into consideration
whether a child has a severe discrepancy between
achievement and intellectual ability in oral expression,
listening comprehension, written expression, basic reading
skill, reading comprehension, mathematical calculation or
mathematical reasoning.
(B) ADDITIONAL AUTHORITY. In determining whether a
child has a specific learning disability, a local education
agency may use a process that determines if the child re-
sponds to scientific, research-based interventions as a part of
the evaluation procedures described in paragraphs (2) and
(3).
The above language was supported by the President’s
Commission on Excellence in Special Education. The
Commission recommended simplifying the identification
process and stated “that assessments that reflect learning and
behavior in the classroom be encouraged and that “a student’s
response to scientifically based instruction become part of the
criteria for SLD identification.”
During the spring of 2004 both versions passed in their
legislative body, HR 1350 passed in April and S. 1248 passed in
May with Congress taking final action on November 19, 2004
followed by the President’s signing the bill into law. The
National Association of School Psychologists (NASP)
developed a side by side comparison that can be found at
http://www.nasponline.org/advocacy/04LDRoundtableRefMat.p
df. A summary of testimony for H. R. 1350 and S. 1248 can
also be found at this site.

R E S P O N S E T O I N T E R V E N T I O N ______________________________________________________________________________________________
7
In summary, there are a variety of technical and
conceptual issues that spark the debate over eligibility criteria
for students with high incidence disabilities. The issues
addressed to this point include lack of professional agreement on
definitions, inconsistencies in implementation of criteria around
the country, unreliability of discrepancy scores, the relevance of
IQ tests as measures of ability, potential for bias, and lack of a
researched base connecting the assessment model to better
interventions for students with disabilities.
From this debate has emerged an alternative to the
traditional assessment approaches to eligibility and the delivery
of special education services. This alternative approach focuses
on evaluating how well the student is responding to the
instruction offered in their education setting.
V. The Response to Intervention Model The Response to Intervention Model (RTI) is also
known as the Problem Solving Model (PSM). Both Response to
Intervention and Problem Solving Models are essentially a
variation of the Scientific Method, which is used to study natural
phenomena.
The Scientific Method involves (1) the description of
the phenomenon, (2) development of a hypothesis, (3)
implementing the procedure for study and prediction, (4)
collection of data and analysis, and (5) interpretation of the data
and conclusion.
An application of the scientific method can be found in
the work of Bransford and Stein (1984) who developed the
IDEAL model for finding solutions to educational problems.
Deno (2002) explains the acronym IDEAL represents: Identify
the problem, Define the problem, Explore alternative solutions,
Apply a solution, and Look at the effects of the application.
Tilley et al. (1998) have implemented the Problem
Solving Model in Iowa for a number of years. In their
implementation, the key to successfully helping students is
answering the following questions, which are described in detail
in Table 1.
1. What is the problem?
2. Why does the problem exist?
3. What should be done to address the problem?
4. Did the intervention work and what’s next?
Table 1. Critical Procedural Components of Problem Solving
Systems (Tilly, Reschly, & Grimes, 1999)
What is the problem? • All appropriate team members participate, including parents
and the student as appropriate.
• All relevant existing information is considered during
problem identification.
• The problem is clearly defined directly and environmentally
(typically as the difference between environmental expec-
tations and current performance) in addition to factoring in
relevant characteristics about the individual student.
• An appropriate level of resources and precision is chosen for
the assessment based on the intensity, severity, and
durability of the problem.
Why does the problem exist? • A multi-method, multi-informant assessment is completed
that results in the development of plausible hypotheses
regarding (1) whether the problem represents a skill or
performance problem (2) why the problem is occurring in
measurable and observable terms and (3) the circumstances
and factors that are associated with both the occurrence and
nonoccurrence of the problem.
• Testable hypotheses are written regarding problem etiology.
What should be done to address the problem? • A intervention plan is written that:
• Is goal directed and focused on measurable objectives;
• Is based directly on the results of the assessment and the
hypotheses regarding problem etiology;
• Identifies who will do what, when, and how;
• Contains specific methodologies for monitoring the
effectiveness of the supports and interventions attempted;

R E S P O N S E T O I N T E R V E N T I O N ______________________________________________________________________________________________
8
• Contains all specific forms, documents, and personnel
support that will be required for implementation of the plan;
• Fits the resources, values, and skills of the people in the
setting.
Did the intervention work and what’s next? • Progress is monitored frequently and repeatedly across time.
• Trends in performance are used to gauge the effectiveness
of the supports and interventions.
• Ineffective intervention plans are changed in a timely
manner.
• Intervention plans are modified as appropriate to address
emerging needs.
Adapted from Tilly, Knoster, Koveleski, Bambara, Dunlap, and Kinkaid (1998). Functional behavior assessment: Policy develop-ment in light of emerging research and practice. National Assoc-iation of State Directors of Special Education: Alexandria, VA.
An important point to be made about the Response to
Intervention approach is that it is not specifically a special edu-
cation eligibility tool, rather it is a data-based decision-making
system that can be used for all students within the school.
In addressing how school psychologists might use the
model, Deno (2002) explains “…problem solving is not a term
reserved for activities that focus only on atypical development.
Instead, problem solving is defined as the approach to
intervention rather than by a focus on failure or deviance.
Problem solving is the effort to eliminate the difference
between “what is” and “what should be” with respect to student
development. Such a difference exists, for example, whenever
we consider a student’s current level of development relative to
a desirable goal.
Any discrepancy between where a student is currently
functioning and how we might like that student to function at
some point in the future automatically provides a focus for
problem solving and can be adopted as the purpose of school
psychology” (p. 38).
Deno (2002) reduces the major phases in the Problem
Solving process to three; identifying and defining the problem,
developing and selecting alternative solutions, and progress
evaluation.
Identifying and defining the problem The first step in the Problem Solving cycle is clearly
defining the difficulties experienced by the student. Clarity and
precision in this description is essential for developing
hypotheses about interventions to try with the student. Too often
referrals can be vague and ambiguous.
For example a referral identifying a student as “having
reading problems” offers little information for staff to use in
developing alternative solutions. A description such as “student
knows letter sounds and some consonant blends, but can not
decode words with long vowel sounds or read with fluency,”
however tells a more complete story. In the latter case, staff can
begin to generate ideas that are specific to the student’s
difficulty.
How can we add clarity to the process of problem
definition? Relying on observable events helps lend validity and
objectivity to the process. Maynard Reynolds, Professor
Emeritus in Special Education at the University of Minnesota
writes, “In general, behavioral assessments should be based
heavily on direct observations rather than on presumed pre-
dispositional or underlying traits.”
An important point to make is that the reliability of
assessments of underlying or unseen behaviors is typically low.
However, observable events have a tendency to be perceived
more accurately. A further point that Reynolds makes that
highlights the importance of linking assessment to instruction is,
“Assessments of school progress should be highly specific to the
domains of instruction and so designed that individuals have
clear opportunities to become aware of their own progress…”
Developing and selecting alternative solutions
Once the student’s problem area is identified and
defined the teacher needs to alter the current instructional
intervention. Changes in interventions can take many forms,

R E S P O N S E T O I N T E R V E N T I O N ______________________________________________________________________________________________
9
including curriculum, grouping, allocated time, and motivation.
In the area of reading, a good place to start is the findings of the
National Reading Panel, which reviewed current research on
effective reading instruction.
The National Reading Panel website states, “In 1997,
Congress asked the Director of the National Institute of Child
Health and Human Development (NICHD) at the National In-
stitutes of Health, in consultation with the Secretary of Educa-
tion, to convene a national panel to assess the effectiveness of
different approaches used to teach children to read.”
The report addresses five important areas of reading
instruction: alphabetic understanding, phonics and phonemic
awareness, fluency, vocabulary and comprehension. To view
the National Reading Panel report refer to its website:
www.nationalreadingpanel.org.
Another site that addresses scientifically based inter-
ventions in this area sponsored by the Partnership for Reading.
This group, which is a coalition of national groups focused on
better reading instruction in this country, has set the four goals:
• To increase access to evidence-based reading research by
providing information in non-technical language that is
easily understood by non-researchers, including educators,
parents, and policymakers.
• To improve professional development for reading
instruction by providing teachers and others with tools that
help them translate research into practice.
• To assist families in providing home environments that
support children's learning to read and encourage parents to
strengthen their own literacy skills.
• To promote replication of evidence-based reading programs
and tutorial services that have been evaluated and found to
be effective.
The website for the National Institute for Literacy is,
www.nifl.gov/nifl/pfr.html. As part of the website the
Partnership provides a summary of teaching activities that
address the critical elements of beginning reading (see The
Research Building Blocks for Teaching Children to Read). In
addition, there is a link to activities that parents can use at home
for improving the reading skills of their children (see Helping
Your Child Learn to Read).
Another resource is the What Works Clearinghouse.
This organization is sponsored by the U. S. Department of
Education and addresses effective interventions across academic
domains. According to its website, “On an ongoing basis, the
What Works Clearinghouse (WWC) gathers studies of the
effectiveness of educational interventions (programs, products,
practices, and policies).
We review the studies that have the strongest design,
and report on the strengths and weaknesses of those studies
against the WWC Evidence Standards so that you know what the
best scientific evidence has to say.” This site is at
www.WhatWorks.ed.gov.
There are many books addressing reading instruction
that should be consulted. Preventing Reading Difficulties in
Young Children edited by Catherine E. Snow, Susan Burns and
Peg Griffin, and published in 1998 by the National Research
Council is an excellent resource. Another important book is
Marilyn Adams’ Beginning to Read: Thinking and Learning
about Print which was published by MIT Press in 1990.
Progress evaluation One of the most important components of the Response
to Intervention model is the collection of data that allows staff to
evaluate whether the treatment is effective. As Dr. Maynard
Reynolds wrote, “In general, assessment processes in the schools
should be oriented to instructional decisions: that is, the
assessments should help to design appropriate instructional
programs for students.”
For the most part, norm-referenced (NRT) standardized
tests are not helpful in this regard. NRTs are problematic for
several reasons.
First, many of the NRTs we use do not provide
adequate information that informs instruction (Thurlow and
Ysseldyke, 1980).
Second, most NRTs are not sensitive to measuring
change over a short period of time. Carver (1974) makes the
distinction between psychometric and edumetric tests.

R E S P O N S E T O I N T E R V E N T I O N ______________________________________________________________________________________________
10
Psychometric assessments, which are the NRTs, are not
designed to measure growth but to instead measure individual
differences. These tests are good for peer comparisons, but may
not be helpful for measuring change. Carver argues that
educators also need edumetric tests, or assessments that are valid
for monitoring student growth.
A third problem is that NRTs typically can only be
administered once, or at most, perhaps twice a year. However,
teachers need more immediate feedback than waiting several
months to evaluate student growth. What is needed is an
approach that can be used to measure pupil progress over a few
days or weeks, not months.
Finally, NRT’s are costly to administer frequently and
take considerable amounts of time.
It would appear that the progress evaluation require-
ments of the Response to Intervention model cannot be fulfilled
by the NRT approach. Fortunately, there exists a measurement
model that can provide educators with a means of evaluating the
effectiveness of instruction. That model is known as the Cur-
riculum-Based Measurement model (CBM).
Curriculum-Based Measurement (Deno, 1986) was
designed specifically to measure student growth. The studies
have documented the validity of the measures (Deno et. 1983;
Fuchs et. al. 1986; Tindal & Marston, 1996), their reliability
(Marston, 1989), and their utility in evaluating student growth
and making instructional changes (Fuchs, Deno, & Mirkin,
1984), setting goals for students (Deno et al., 2002), and
predicting performance on high stakes tests (Fuchs, et al. 1997;
Muyskens et al., 2004).
Over the past 25 years, more than 400 studies have
been published on the technical adequacy and use of Curricu-
lum-Based Measurement (Espin & Wallace, 2004).
The CBM model has three major characteristics: direct
measurement, repeated measurement, and time series analysis.
Direct measurement refers to observation of specific student
skills and behavior.
In the area of reading the teacher listens to the student
read a passage and counts the number of words read correctly
and incorrectly. The teacher may also rate the student’s reading
expression and ask follow-up comprehension questions. A
variety of early literacy skills can be measured including letter
sound fluency and phoneme segmentation fluency.
Repeated measurement is a mainstay of the CBM
model. Materials are typically designed so that students may be
able to read equivalent passages on a frequent basis throughout
the school year. Repeated measurement involves monitoring
students anywhere from three times per week to three times per
year.
Time series analysis involves graphing the direct,
repeated measurement data, recording instructional interventions
on the graph, and looking at the students response to instruction.
An example of this is shown in the figure below. As can be
seen, the student learning rate, or response to instruction, is
minimal in Phase A. However, an instructional change is made
and in Phase B the student’s growth rate increases.
0
10
20
30
40
50
60
1 3 5 7 9 11 13 15 17 19
Weeks
Wor
ds R
ead
Cor
rect
ly
Phase A Phase B
An example of school-wide Curriculum-Based
Measurement monitoring is shown in the figure below. In this
model, all students are measured in the fall, winter, and spring at
each grade level.
The figure below shows an example of how CBM data
can be reported at a grade level and compared to oral reading
standards. When disaggregating these data to the individual
student level, those students not making adequate growth toward
reading standards may be candidates for the Response to
Intervention model.

R E S P O N S E T O I N T E R V E N T I O N ______________________________________________________________________________________________
11
Important elements of the curriculum-based measure-
ment approach to progress evaluation are the setting of student
goals, graphing student data and reviewing progress toward
pupil goals. Research on typical growth of students in general
education shows that students in grades 1 and 2 average a
growth rate increase of about 2.5 words correct per week. For
general education students in grades 3 to 6 the average gain is
1.5 correct words per week (Marston & Magnusson, 1985).
Using these data teachers can set goal lines for students.
As shown in the figure below, student baseline data is 38 words
read correct during the first week. For the purposes of
illustration, the figure below sets a goal for a twenty week
interval.
If we choose a 1.5 word gain per week over a 20 week
period we intend to make a goal of 68 words correct. The
accelerating goal line in the figure below represents growth of
1.5 words per week and a 68 words correct goal at the end of this
period. A review of the data shows the student is not on course
to make the necessary gains.
0
10
20
30
40
50
60
70
80
1 3 5 7 9 11 13 15 17 19 21 23
Wor
ds R
ead
Cor
rect
ly
For students not making adequate progress a change in
intervention is recommended. By cycling through the process of
problem definition, selecting interventions, evaluating response
to interventions, the educator will either find an effective
approach for the student or has built a strong case for providing
more intensive instructional services found in special education.
VI. RTI Research Model Implementation Research
University of Texas Model. A three-tier RTI model
that was used for primary students struggling in reading was
researched by Sharon Vaughn at the University of Texas
(Vaughn, 2003). Her study focused on the performance of 45
second grade students who reached the second tier of the RTI
model. These students, who did not respond to reading
instruction in Tier I, received intensive reading interventions that
addressed the five major areas delineated in the National
Reading Panel.
After ten weeks of instruction 10 students had improved
enough to gain “early exit,” at the 20 weeks another 14 students
were exited, at 30 weeks ten more students had improved
enough for returning to Tier I. Vaughn concluded most students
who reach Tier II need a minimum of 20 weeks of intervention
for determining if a Tier III intervention is necessary.
University of Pittsburgh Model. O’Connor (2003)
also studied the three-tier RTI model. In the control group of
this study 15% of the students were identified as needing special
education. However, at the experimental schools using a 3 Tier
RTI model, only 8% of the students were later identified as
needing special education.
Iowa Model. David Tilley of the Iowa State
Department of Special Education examined the implementation
of the Problem Solving Model across a large number of school
districts in the state. The Iowa model has four levels of
Problem Solving where there is an increase in the intensity of the
problem and the amount of resources needed to address the
problem with each level.
0
20
40
60
80
100
Fall
Winter
Spring
School
Standard

R E S P O N S E T O I N T E R V E N T I O N ______________________________________________________________________________________________
12
Level I involves consultation between teachers and
parents to address the concerns for the student. At Level II there
is consultation with other resources that exist in the school
environment. Consultation with an extended Problem Solving
Team is the focus of Level III. Level IV involves IEP
consideration and eligibility for special education. In Tilly’s
(2003) research the frequency of students identified for special
education was reduced by 39% in kindergarten, 32% in the first
grade, 21% in the second grade, and 19% in the third grade.
Minneapolis Model. The Minneapolis Public Schools
have used an RTI model for the last ten years (Marston, 2001;
Marston, Muyskens, Lau, and Canter, 2003). In their three stage
process student interventions are monitored and response to
intervention data is used to determine whether students are
eligible for special education.
At Stage I Classroom Interventions are implemented.
At this stage the classroom teacher, after determining that the
pupil is struggling, begins to collect frequent data and
implements a change in teaching strategy. The change could be
curricular, motivational, organizational, or modification of other
instructional variables. Certainly, another key variable is the
amount of time provided the student. If the child does not
respond to this intervention he or she moves to Stage 2.
At Stage 2 the school’s Problem Solving Team reviews
the case. The Problem Solving Team, ideally, is composed of
general education teachers, Title I staff, Special Education staff,
and other specialists in the building. The goal of this team is
identify resources and interventions available in the building, but
not part of special education, that can be implemented for the
struggling student. Data is collected and the response to
intervention cycle continues.
If the student does not respond to the intervention at
this stage, he or she moves to Stage 3, which is special education
evaluation. At this stage, in addition to continued monitoring of
response to intervention, the formal due process activities
required for special education evaluation are conducted,
including: parent notification, evaluation planning, and
evaluation reports.
The approach is also non-categorical in that students are
not labeled as “learning disabled” or “mild mentally impaired”
but instead “students needing alternative programming” (SNAP).
Program evaluation data reported shows that even
though the student demographics in the district changed
significantly during this time period in terms of race and
ethnicity, increased poverty, and increased percentages of
English Language Learners, the percentages of students with
mild/moderate academic based disabilities did not change.
In other words, the RTI model did not significantly
increase or reduce the numbers of students with high incidence
disabilities found eligible for special education. The “flood
gates” did not open allowing high numbers of students to access
academic-based special education programs which is sometimes
a concern regarding the RTI model.
• Marston, Muyskens, Lau and Canter (2003) report that
before implementation of the Problem Solving Model in
1992, the percentage of the enrollment that was Learning
Disabled or Mild Mentally Impaired was 7.13%. In 1997,
the percentage of students that were Learning Disabled,
Mild Mentally Impaired or Students Needing Alternative
Placement (SNAP) was approximately the same at 6.91%.
In 2001, the percentage again did not change significantly
with 7.12% of the population identified as Learning
Disabled, Mild Mentally Impaired, or Student Needing
Alternative Placement (SNAP).
In addition, an independent evaluation of the
Minneapolis model by Iowa State University staff and funded by
the Minnesota Department of Children, Families and Learning
(Reschly & Starkweather, 1997), showed the following:
• In the RTI model, pre-referral interventions were better than
those interventions used with the traditional approach.
• Students needing special education services were provided
these interventions earlier than with the traditional
approach.
• A review of the students found eligible for special education
using RTI and then compared to traditional special
education criteria showed an overlap of 75%.

R E S P O N S E T O I N T E R V E N T I O N ______________________________________________________________________________________________
13
• In the RTI model “an equal treatment conception of non-
discrimination” was evident in comparisons of African
American and White American students
• Attitudes of teachers, administrators, social workers, and
school psychologists using RTI were typically supportive.
In Minnesota’s St. Croix River Education District
(SCRED), implementation of a Response to Intervention model
produced a decrease in the number of students identified as
learning disabled (McHugh, 2004).
As shown in the figure below, over a nine year period
the percentage of LD students dropped from about 4.4% to
2.5%. Meanwhile, state LD percentages remained constant at
approximately 4%.
Therefore, when this model is adopted as whole school
reform such as it was in the SCRED districts, the percentages of
students identified in the category of “learning disabilities” is
significantly reduced.
Percentage of Students Receiving Services for a Specific Learning
Disability - St. Croix Education District (SCRED) vs. Region and MN
State Totals
0.0%
0.5%
1.0%
1.5%
2.0%
2.5%
3.0%
3.5%
4.0%
4.5%
5.0%
Percent of Students
SCRED
Region 7
STATE
SCRED 4.35 3.93 3.78 3.67 3.71 3.61 3.31 3.20 2.51
Region 7 3.95 3.97 4.02 3.91 3.93 3.96 3.99 3.83 3.71
STATE 4.11 4.23 4.24 4.21 4.16 4.13 4.12 4.21 4.02
1995
-96
1996
-97
1997
-98
1998
-99
1999
-00
2000
-01
2001
-02
2002
-03
2003
-04
The model used by SCRED is based on the Schoolwide
Beginning Reading Model written about by Kame’enui and
Simmons et.al. (2003). The Schoolwide Model helps schools
translate scientifically-based reading research into effective
practices. Its main tenet is that the unit for instructional change
is the school. An effective school is organized to deliver
powerful instruction to all of its students. Non-discriminatory assessment Reschly, Kinglighter and McKee (1988) addressed
issues of over-representation in special education and made the
point that assessments, in order to be nondiscriminatory, must be
linked to instruction if they are to be justified.
Ortiz (2002) concludes nondiscriminatory assessments
“should be multifaceted and guided by a comprehensive
framework that integrates efforts to reduce bias in a cohesive
and systematic manner. Such a system contains many best
practice features, including:
• Evaluate, revise, and re-test hypotheses.
• Reduce bias in traditional testing practices.
• Utilize authentic and alternative assessment procedures.
• Evaluate and interpret all data within the context of the
learning ecology.
• Link assessment to intervention.
The response to intervention model is consistent with many
of these features. Data provided by Marston et al. (2003) show
“odds ratios” (a measure of disproportion) for Minneapolis were
below reported statewide ratios. Common Ground Report The Common Ground Report reflects the results of
eight professional organizations working together to address
the essential components of an RTI model for this model to be
considered as a viable alternative to traditional LD criteria
(National Research Center for Learning Disabilities, 2002).
From that conference fourteen statements emerged to form a
consensus on what an effective RTI model would look like.
These statements were clustered by Identification,
Eligibility and Intervention and are presented in Table 2. A
careful reading of these statements shows that the elements of
the RTI model presented in this paper are consistent with the
Common Ground Report. (Table 2. Fourteen consensus
statements from Common Ground Report regarding
Identification, Eligibility and Interventions in RTI model.) Identification 1. “Identification should include a student-centered,
comprehensive evaluation and problem-solving approach
that ensures students who have a specific learning disability
are efficiently identified.”

R E S P O N S E T O I N T E R V E N T I O N ______________________________________________________________________________________________
14
2. “Regular education must assume active responsibility for
delivery of high-quality instruction, research-based
interventions, and prompt identification of individuals at
risk while collaborating with special education and related
services personnel.”
Eligibility
3. “The ability-achievement discrepancy formula should not be
used for determining eligibility.”
4. “Decisions regarding eligibility for special education
services must draw from information collected from a
comprehensive individual evaluation using multiple
methods and sources of relevant information.”
5. “Decisions on eligibility must be made through an
interdisciplinary team, using informed clinical judgment,
directed by relevant data, and based on student needs and
strengths.”
6. “Decisions on eligibility must be made in a timely manner.”
7. “Based on an individualized evaluation and continuous
progress monitoring, a student who has been identified as
having a specific learning disability may need different
levels of special education and related services under IDEA
at various times during the school experience.”
Intervention
8. “The field should continue to advocate for the use of
scientifically based practices. However, in areas where an
adequate research base does not exist, data should be
gathered on the success of promising practices.”
9. “Schools and educators must have access to information
about scientifically based practices and promising practices
that have been validated in the settings where they are to be
implemented.”
10. “Students with specific learning disabilities require
intensive, iterative (recursive), explicit scientifically based
instruction that is monitored on an ongoing basis to achieve
academic success.”
11. “Students with specific learning disabilities require a
continuum of intervention options through regular and
special education across all grades and ages.”
12. “Interventions must be timely and matched to the specific
learning and behavioral needs of the student.”
13. “An intervention is most effective when it is implemented
consistently, with fidelity to its design, and at a sufficient
level of intensity and duration.”
14. “Regular and special education must be coordinated as part
of a coherent system which is held accountable for the
educational outcomes of students with specific learning
disabilities.”
VII. Implementation of the Response to Intervention (RTI) Model
This section of the report describes how staff can
implement the Response to Intervention Model. A Response to
Intervention Documentation form used for describing student
data and response to intervention is in Appendix A.
Typically, later interventions are more intensive than
initial interventions and often involve a building team where
several school staff discuss the student and generate ideas for
effective school interventions. In this section we explain how
staff would utilize this form to help guide their use of the model.
Identifying and defining the student’s problem
The first part of the form provides staff with prompts for
describing the student’s needs and baseline data.
1. Description of the problem In this section the teacher describes the difficulties the
student is having. This information should be specific in nature.
For example, “Student is reading poorly” is too general and
vague.
A better example would be “Student has difficulty
decoding words in second grade text and retelling the events that
occurred in the story. The student reads 27 words correct in a

R E S P O N S E T O I N T E R V E N T I O N ______________________________________________________________________________________________
15
one minute sample from a second grade passage and answers
only one of five questions correctly about the story.”
In this section the teacher should also include other data
such as state test scores, local achievement test data, attendance
information and other relevant academic data. The teacher
should also keep in mind that baseline information is recorded
here.
2. Student strengths and weaknesses A review of the student’s difficulties is not enough for
making a decision about how to intervene with the student. By
describing the child’s strengths and weaknesses, not necessarily
linked directly to the academic problem, the teacher may be able
to identify skills (or lack of skills) that will enable the student to
improve.
For example, knowing the child is highly motivated is a
strength the teacher can build upon in designing the intervention.
Similarly, knowing the student has low self-confidence should
signal the teacher to create instructional situations where the
child experiences success and minimizes failure.
3. Relevant health or other issues Often there are physical or health concerns that impede
learning. Visual difficulties, chronic fatigue, hearing problems
all contribute to student academic problems. Such issues need to
be addressed and can be as much a part of the intervention
strategy as the reading curriculum.
Developing alternative interventions for the student
The second part of the intervention form guides staff
through the process of selecting an intervention for the student.
4. Hypothesis regarding student needs Once the first section is completed the teacher has a
good idea of what the specific problem is for the student and has
some type of data to back up this description. In addition, other
non-academic variables that may be contributing to the academic
difficulties have been considered.
The teacher may now begin generating ideas on why
the student isn’t learning and possible solutions. This is the
hypothesis and it should help us identify an intervention that
specifically addresses our concern.
For example, we might hypothesize that a student who
is having trouble decoding may need a reading program that
provides more explicit instruction on alphabetic understanding
and phonemic awareness.
5. Type of intervention selected The hypothesis helps guide the selection of an
intervention. In the previous example we hypothesized the
student needs more explicit instruction and practice with
phonemic awareness. The teacher must now find reading
interventions that fit these characteristics.
6. Length of time of intervention In this section, staff report the length of time that the
intervention will be implemented. Intervention length can vary
due to publisher recommendations, research data, student
scheduling factors, availability of resources and student
attendance.
While evidence on what constitutes optimal intervene-
tion length is not available, it is fair to say that staff will need to
assure that interventions are neither too short nor too long.
Either circumstance creates an obvious downside. Interventions
that are not implemented for a sufficient period of time will of
course have minimal impact on student learning.
Conversely, interventions carried out for too long,
without student gains, will only delay effective instruction being
provided to the pupil. The absence of hard data on length of
intervention reinforces the importance of collecting frequent data
on the student.
By continually reviewing student progress in response
to the intervention, the teacher will improve his or her
understanding of whether the treatment is succeeding.
7. Student goal Setting a goal for the student to achieve is critical to the
Response to Intervention process. For setting goals in reading
staff should refer to research by Fuchs (2002). University of
Oregon researchers also provide data that can be used for goal
setting.

R E S P O N S E T O I N T E R V E N T I O N ______________________________________________________________________________________________
16
These researchers observed that for oral reading fluency
first grade students who do well on state-wide assessments are
reading approximately 60 words correct by the end of 1st grade,
90 words correct by the end of 2nd grade, and 110 words correct
by the end of 3rd grade. Muyskens et al. (2004) have shown
that 7th graders who read approximately 150 words correct have
about an 85% chance of passing Minnesota statewide reading
assessments at 8th grade.
Evaluation of response to intervention 8. Measures used for progress monitoring and decision rules
The Curriculum-Based Measurement model is very
useful to help educators evaluate the effectiveness of instruction
and student growth (Deno, 1986, Fuchs & Shinn, 1989).
As shown earlier in this paper, in the area of reading,
graphing the number of words read correctly on a repeated basis
provides educators with a way of determining whether the
student is responding to intervention (Fuchs, Deno, & Mirkin,
1984).
As Deno has described the approach, CBM procedures
provide educators with “vital signs” of education health of the
student.
9. Evidence of response or non-response to intervention
The teacher or team now reviews the data to determine
response or lack of response. Once a goal and goal line have
been established on the student’s reading graph it is fairly easy
to ascertain whether the pupil is making sufficient progress to
judge the intervention as effective or not effective. This
evidence becomes critical to making the decision to continue or
modify instruction.
10. Decision Finally, after all data and interventions are considered a
decision about the effectiveness is provided. The teacher or
team summarizes the interventions that were implemented and
the extent to which the student made gains on the CBM
procedures.
For students showing improvement toward the stated
goal the decision would be to continue with implementation of
the instructional change in the current school environment.
However, for students who show a trend that is not high
enough to attain the goal, the teacher or team should try an
intervention of high intensity. In those cases where several
general education interventions have not been effective, there is
evidence the student needs more intensive service in special
education.

R E S P O N S E T O I N T E R V E N T I O N ______________________________________________________________________________________________
17
VIII. Conclusions Educators have long known that there are no “silver
bullets” when it comes to teaching…but there are some “silver
tools” which educators simply cannot ignore. The sound
research in support of Response to Intervention (RTI) and
Curriculum Based Measurement (CBM), in addition to other
scientifically based strategies must be acknowledged and put to
widespread use.
Educators have long complained about the onerous
special education procedures required by law and those
complaints are indeed meritorious. These required procedures
are not only time consuming and immensely expensive but they
provide minimal information that is actually useful for
instructional decision-making which should be the real purpose
of initiating these processes in the first place.
The reauthorized IDEIA goes a long way to address
many of these issues. With RTI, the requirement to have
“regular class interventions” which must consist of research
based interventions rather than the “refer out” process is a huge
improvement.
In some cases, because of the success of these
interventions verified with data, the child will not need special
education services at all. The use of the regular classroom data
coupled with additional observation information, CBM data and
other data determined to be necessary provides a clear and
nondiscriminatory picture of “present levels of performance.”
Goals for students using CBM are clear and rational and easily
measured for progress reports and IEP modification purposes.
With the reauthorized IDEIA and the use of RTI will
come a new relationship between classroom teachers and special
education teachers, between NCLB and IDEIA and most
important, will result in improved learning for children and
youth with disabilities.

R E S P O N S E T O I N T E R V E N T I O N ______________________________________________________________________________________________
18
References Adams, M. (1994). Beginning to Read: Thinking and Learning
about Print. Boston: MIT Press. Algozzine, B., Ysseldyke, J. E., & McGue, M. (1995).
Differentiating low achieving students: Thoughts on setting the record straight. Learning Disabilities Research and Practice, 10 (3), 140-145.
Bransford, J. D., & Stein, B. S. (1984). The IDEAL problem
solver. New York: W. H. Freeman. Carver, R. P. (1974). Two dimensions of tests: Psychometric and
edumetric. American Psychologist. Deno, S. L., Mirkin, P., & Chiang, B. (1982). Identifying valid
measures of reading. Exceptional Children, 49, 36-45. Deno, S. L. (1985). Curriculum-based measurement: The
emerging alternative. Exceptional Children, 52 (3) 219-232.
Deno, S. L., Fuchs, L. S., Marston, D., & Shinn, M. (2001).
Using curriculum-based measurement to establish growth standards for students with learning disabilities. School Psychology Review, 30(4), 507-524.
Deno, S. L. (2002). Problem Solving as “Best Practice.” In A.
Thomas & J. Grimes (Eds.), Best Practices in School Psychology IV, Vol. 1, 37-56. Washington, DC: National Association of School Psychologists.
Education for All Handicapped Children Act of 1975, 20 U. S. C.
Sec. 401 (1975). Espin, C. & Wallace, T. (2004). Research Institute for Progress
Monitoring. Minneapolis, MN: University of Minnesota. Fletcher, J. M., Francis, D. J., Shaywitz, S. E., Lyon, G. R.,
Foorman, B. R., Stuebing, K. K., & Shaywitz, B. A. (1998). Intelligent testing and the discrepancy model for children with learning disabilities, Learning Disabilities Research and Practice, 13, 186-203.
Fuchs, L. (2002). Best practices in defining student goals and
outcomes. In A. Thomas & J. Grimes (Eds.), Best practices in school psychology IV. Vol. 1, 553-564. Washington, DC: National Association of School Psychologists.
Fuchs, L., & Fuchs, D. (1986). Effects of systematic formative
evaluation: A meta-analysis. Exceptional Children, 53, 199-208.
Fuchs, L., Deno, S. L., & Marston, D. (1997). Alternative
measures of student progress and state standards testing. Pacific Coast Research Conference, February 7, 1997.
Fuchs, L., Deno, S. L., & Mirkin, P. K. (1984). The effects of
frequent Curriculum-Based Measurement and evaluation on pedagogy, student achievement and student awareness of learning. American Education Research Journal, 21, 449-460.
Fuchs, L. S., & Shinn, M. R. (1989). Writing CBM IEP
objectives. In M. R. Shinn (Ed.), Curriculum-based measurement: Assessing special children (pp. 130-152). New York: Guilford Press.
Galagan, J. E. (1985) Psychoeducational testing: Turn out the
lights, the party’s over. Exceptional Children, 52 (3), 288-299.
Gresham, F. (2001, August). Response to Intervention: An
Alternative Approach to the Identification of Learning Disabilities. Paper presented at the Learning Disabilities Summit: Building a Foundation for the Future (Washington, DC, August 27-28, 2001).
Gresham, F. H., MacMillan, D. L., & Bocian, K. M. (1996).
Learning disabilities, low achievement, and mild mental retardation: More alike than different? Journal of Learning Disabilities, 29 (6), 570-581.
Heller, K., Holtzman, W., & Messick, S. (1982). National
Research Council Special Task Force Report. Washington, DC: National Academy Press.
House Committee on Education and the Workforce (Report 108-
077) To accompany H. R. 1350, Filed April 29, 2003. Pages 107-108.
Individuals with Disabilities Act, 20 U. S. C. Sec. 1400 (1990). Individuals with Disabilities Act, 20 U. S. C. Ch. 33, Sec. 1400 (1997). Iowa Department of Education. (1992). Renewed Service
Delivery System Des Moines, IA: Department of Education.
Larry P. v. Riles. (1984). Supra, 495 F. Supp. at 951-52, aff'd 83-
84 EHLR 555:304, 307 (CA9 1984).
MacMillan, D. L., Gresham, F. M., & Bocian, K. L. (1998). Discrepancy between definitions and school practices: An empirical investigation. Journal of Learning Disabilities, 31(4), 314-326.
Marston, D., Muyskens, P., Lau, M., & Canter, A. (2003). Problem- Solving Model for Decision Making with High-Incidence Disabilities: The Minneapolis Experience Learning Disabilities Research and Practice, 18 (3), 187-200.

R E S P O N S E T O I N T E R V E N T I O N ______________________________________________________________________________________________
19
Marston, D. (2001). A functional and intervention-based assessment approach to establishing discrepancy for students with learning disabilities. Paper presented at LD Summit, Washington DC, August 28, 2001.
Marston, D. (1989). Curriculum-based measurement: What it is
and why do it? In M. R. Shinn (Eds), Curriculum-based measurement: Assessing special children (pp. 18-78. New York: Guilford.
Marston, D., & Magnusson, D. (1988). Curriculum-based
assessment: District level implementation. In J. Graden, J. Zins, & M. Curtis (Eds.), Alternative educational delivery systems: Enhancing instructional options for all students (pp. 137-172). Washington, DC: National Association of School Psychologists.
McHugh, C. (2004). Personal communication. National Academy of Sciences (2002). Minority Students in
Special and Gifted Education. Washington, DC: National Academy Press.
NRCLD Learning Disability Policy Roundtable. (2002). Specific
learning disabilities: Finding common ground. O’Connor, R. (2003). Tiers of Intervention in Kindergarten
Through Third Grade. Presented at National Research Center on Learning Disabilities RTI Symposium, Kansas City, MO, December 5, 2003.
Ortiz, S. O. (2002). Best practices in nondiscriminatory
assessment. In A. Thomas and J. Grimes (Eds.), Best Practices in School Psychology IV. Bethesda, MD: National Association of School Psychologists. Pages 1321-1336.
Prasse, D. P. (2002). Best practices; in school psychology and
the law. In A. Thomas and J. Grimes (Eds.), Best Practices in School Psychology IV. Bethesda, MD: National Association of School Psychologists.
Public Law 94-142, Education of the Handicapped Act of 1975,
Federal Register, 42, 163, (August 23, 1977). Reschly, D. J. & Ysseldyke, J. E. (2002). Paradigm shift: The
past is not the future. In A. Thomas & J. Grimes (Eds.), Best practices in school psychology IV. Bethesda, MD: National Association of School Psychologists.
Reschly, D. J., Kicklighter, R., and McKee, P. (1988). Recent
placement litigation part II, minority EMR overrepresentation: Comparison of Larry P. with Marshall and S-1. School Psychology Review, 17, 22-38.
Reschly, D. & Starkweather, A. (1997). Evaluation of an
alternative special education assessment and classification
program in the Minneapolis Public Schools. Ames, IA: Iowa State University.
Senate HELP Committee, Report 108-185). To accompany S. 1248, Filed November 3, 2003, Pages 26-28. Siegal, L. S. (1989). IQ is irrelevant to the definition of learning
disabilities. Journal of Learning Disabilities, 22 (8), 469-486.
Snow, C. E., Burns, S., & Griffin, P. (1998). Preventing reading
difficulties in Young children. Washington, DC: National Research Council.
Thurlow, M. & Ysseldyke, J. E. (1980). Instructional planning:
Information collected by school psychologists vs. information considered useful by teachers. Journal of School Psychology, 20, (1), 3-10.
Tilly, W.D., Reschly, D. J., & Grimes, J. (1999). Disability
determination in problem-solving systems: Conceptual foundations and critical components. In Reschly, D., Tilly, W., & J. Grimes (Eds.) Special Education in Transition (Chapter 12). Longmont, CO: Sopris West.
Tilly, D. (2003). How Many Tiers Are Needed for Successful
Prevention and Early Intervention?: Heartland Area Education Agency’s Evolution from Four to Three Tiers. Presented at National Research Center on Learning Disabilities RTI Symposium, Kansas City, MO, December 5, 2003.
Vaughn, S. (2003). How Many Tiers Are Needed for Response
to Intervention to Achieve Acceptable Prevention Outcomes. Presented at National Research Center on Learning Disabilities RTI Symposium, Kansas City, MO, December 5, 2003.
Vellutino, F. R., Scanlon, D. M., & Lyon, G. R. (2000).
Differentiating between Difficult-to-Remediate and Readily Remediated Poor Readers: More Evidence against the IQ-Achievement Discrepancy Definition of Reading Disability. Journal of Learning Disabilities, (33)3, 223-238.
Ysseldyke, Algozzine, B., & Epps, S. (1983). A logical and
empirical analysis of current practice in classifying stu- dents as handicapped. Exceptional Children, 67, 295-309.
Ysseldyke, J. E. & Marston, D. (1999). Origins of categorical
special Education services in schools and a rational for changing them. In Reschly, D., Tilly, W., & J. Grimes (Eds.) Special Education in Transition (Chapter 1). Longmont, CO: Sopris West.


ABOUT EDUCATION|EVOLVING
Millions of America’s students head off to school each morning sporting brightly colored backpacks and determined to make this their “best school year yet.” At the same time, federal and state poli-cymakers are making tough new demands that our schools change and improve – so that “All stu-dents learn at high levels.” New standards, tests, timelines and consequences are all being put in place to make sure that “No child is left behind.”
Yet, all across the country, many policymakers, journalists, teachers, parents and students them-selves are troubled by a haunting feeling that all this effort may not really produce the degree of change and improvement that we need. At a minimum, we are now taking a series of risks that are neither wise nor necessary to be making with other people’s children. These are, after all, de-mands and results well-beyond what we’ve ever expected of American public education – all at a time of severe budgetary pressures on states, districts and individual public schools.
That, at least is the serious concern of a small group of Minnesota-based public policy veterans who have come together as Education|Evolving… a joint venture of the Center for Policy Studies and Hamline University. The individuals behind this initiative believe…
… it’s an unwise and unnecessary risk for the state and nation to be trying to get the results we need solely by changing the schools we now have…
… the issues about teachers and teaching should not be debated only in the old employer/worker framework…
… the solution to maintaining financially viable public education in rural areas may not lie in the three old 'solutions' of excess levies, consolidation and state aid…
… today’s schools should not go on largely failing to take advantage of new electronic technologies and other substantially different ways of teaching and learning…
… and the critical discussion about the future of K-12 education in Minnesota and nationally must not proceed solely as a discussion among adults, with students largely left on the outside looking in.
Education|Evolving is undertaking a number of initiatives during the current year. They include a national initiative to convince policy makers, education reform leaders, journalists and others that creating new schools should be an essential element in achieving needed changes and improve-ments in teaching and learning – at least equal in importance to changing the schools we now have.
One focus of this initiative is to introduce the concept of an “Open Sector” – to help create the kind of legal and political environments in which new schools can be created and succeed. Another is designed to challenge the fundamental premise that teachers in schools must always be “employ-ees.” Another initiative is looking at the premises used in asking the critical question, “How are chartered schools doing?” Other ongoing Education|Evolving projects focus on strengthening and enhancing the role of the agencies and organizations that sponsor chartered schools – and on how policymakers, journalists and others can more routinely and substantively tap into the experiences and perspectives of students and of young people not now attending school.
Education|Evolving’s leadership is provided by two Minnesota public policy veterans: Ted Kolderie, senior associate at the Center for Policy Studies, and Joe Graba, a senior policy fellow at Hamline University. Its coordinator is Jon Schroeder, former director of Charter Friends National Network. Education|Evolving’s activities are regularly updated on the initiative’s unique and continually re-freshed web site www.educationevolving.org. To receive print and electronic updates of Educa-tion|Evolving initiatives, contact [email protected].

Nonprofit organization
U.S. Postage
PA
IDSaint Paul, M
NPerm
it No. 5242
telephone: 651-644-6115e-m
ail: [email protected]
web site: w
ww
.educationevolving.org
1295 Bandana Boulevard / Suite 165Saint Paul, M
innesota 55108
A joint venture of the Center for
Policy Studies and Ham
line University