Embed Size (px)
Citation preview

Response to Draft Determination
National Environment Programme – Phase 5
Issue
This programme of work covers the expected requirements under Phase 5 of the Environment Agency’s National Environment Programme (NEP5). Making adequate provision for the activities expected in the 2015-20 plan period under NEP5 is a requirement of PR14, as set out in DEFRA’s Statement of Obligations. The main cost element within this programme of work addresses the obligations under the Water Framework Directive (WFD), to support significant progress towards ‘good’ water body status. Early delivery of the WFD measures is essential if England is to deliver the necessary improvements by 2027. Table 1: Summary of Ofwat Draft Determination information for NEP5.
Company Proposal
Assessment DD Allowance
Claim Amount Sought
Implicit Allowance
Need CBA Robust Costs
Customer Protection
Assessment Amount Allowed
NEP5 £138.2m £9.5m Pass Partial Pass
Pass Pass Accept £128.6m
Southern Water’s programme of work was accepted by Ofwat in the Draft Determination. The work is supported by the Environment Agency and they provided their feedback (dated 1 November 2013) on our proposal noting: “ …[it] is a logical approach with the proviso that your programme….needs to be sufficiently ambitious to mitigate from having a large number of WFD actions to complete in AMP7 and AMP8.” The acceptance of this programme of work within the Draft Determination was conditional upon the presentation of Cost Benefit Analysis (CBA) to demonstrate that we have not proposed to proceed with schemes that are disproportionately costly. The June 2014 update to our Business Plan did not include a full cost benefit assessment at scheme level, as the proposals within our submission represent just one part of the overall bundle of measures required for us to ensure that waterbodies achieve ‘good’ status. The economic appraisal for the full bundle of measures continues to be updated by the Environment Agency, and was only partially available at the time of the June 2014 update. In our representation response to the Draft Determination, we have provided the following additional information:
i) our own cost benefit assessment at catchment level, for 10 of the 11 catchments, carried out since June 2014, which has been subject to an independent assurance;
ii) results of the latest Environment Agency cost benefit assessment at sub-catchment level for 27 sub-catchments in our area. (Received by us in September 2014, which was not available at the time of our June 2014 update); and
1
iii) cost benefit assessment for each of the schemes included in our NEP5 programme.
Our own assessments (carried out at catchment level for 10 catchments) show that, with the exception of the Test and Itchen catchment, our proposals are cost beneficial. The Test and Itchen catchment has unique contributory factors, and is shown to be cost beneficial within the more holistic Environment Agency assessment. As a result, we are continuing with inclusion of the Test and Itchen in our proposed NEP programme. The Environment Agency assessments (available at sub-catchment level for 27 sub-catchments) show all sub-catchments to be cost beneficial, with the exception of East Kent Coast sub-catchment. However, the element of the catchment improvement work allocated to Southern Water is cost beneficial in its own right. The Environment Agency has provided us with clear guidance from Defra not to exclude the catchment from our plan. The guidance received on 19 September 2014 states: “We have been asked to advise water companies not to remove measures from business plans based on the outcome of the EA’s economic appraisal work. This will pre-empt the minister’s decision on affordability and identifying measures required for alternative objectives and leave companies at risk on not delivering future statutory obligations.” As a result, and in compliance with Defra guidance, noted above, we are continuing with inclusion of West Kent Coast in our NEP5 programme. When considering our cost benefit assessments at scheme level, it should be noted that some schemes may not be considered cost beneficial in isolation from the overall catchment solutions. Cost benefit assessment at catchment, or sub-catchment level, is the most appropriate level to consider improvements to the water environment. These individual schemes are required to enable the overall bundle of measures to achieve the river quality objective of ‘good’ status. We are providing the CBA results within this submission but request that Ofwat recognise that:
The individual schemes presented here are just part of the bundle of measures required to achieve the ‘good’ status required. Other elements within these bundles would be delivered through other stakeholders.
Although we have applied our independently assured CBA methodology, we cannot replicate the more holistic economic appraisals currently being led by the Environment Agency. This work is still to be fully concluded.
Remedy
We request that the proposed WFD catchment proposals are acknowledged as cost beneficial, based on the results of our own CBA analysis and the results from the latest Environment Agency appraisals.
We request that the NEP5 programme of work is recognised in full in the Final Determination totex baseline.
2

Summary of the evidence
1. Justification
The Water Framework Directive (WFD) requirements have been determined through a review of river needs by the Environment Agency, and the schemes and standards required included in the NEP5 part of the Business Plan. In the Draft Determination, Ofwat states that we did not consider options around which river lengths should be included in AMP6. Schemes included within the WFD programme have been identified through an evidenced based review of river catchment needs and potential solutions. Our integrated approach to developing the NEP5 programme was set out in the special case for NEP5 (June 2014 Business Plan update, Chapter 6). We have worked with the Environment Agency to ensure a common understanding of the river lengths should be excluded from AMP6. We challenged proposals which had a low benefit or low confidence of delivery. As a proxy for disproportionate costs, we also re-phased river lengths that required a phosphorus consent lower than standard technology can currently achieve. This was based on the premise that non-standard technology would be disproportionately expensive. This joint approach ensured that high cost or low benefit river lengths were deferred to AMP7, allowing more time to assess alternative options for these river lengths. Overall, our programme delivers benefits as early as possible in the planning cycle, demonstrating the pace required by the Environment Agency1; through delivery of a combination of end of pipe, hybrid and catchment schemes. The approach also recognises the benefits of improvements at small works, or through the reduction of diffuse pollution loads to avoid the need for very stringent permit conditions which would be unachievable or could only be delivered at high cost. In the Draft Determination, Ofwat acknowledged that alternative options had been considered for each river length. Southern Water used a cost benefit assessment as part of this option development. We undertook a technical evaluation of the most cost beneficial phosphate removal process and our scheme costs were benchmarked by Mott MacDonald. Our detailed costing at the site level was shown to be efficient and indeed Ofwat recognised that our costs were at the frontier of efficiency for the industry. This means that the most cost beneficial options have been included within the WFD programme. We have now completed an assessment of the cost benefit based on our customers’ willingness to pay for improving river lengths to ‘good’ status. In line with the principles of the Environment Agency cost benefit assessment, the cost benefit results were assessed at catchment level. Nine out of our ten catchments are shown as cost beneficial. The exception is the small catchment of the Test and Itchen. However, the Environment Agency’s economic appraisal for this catchment shows that it is cost beneficial once the full bundle of measures is taken into account.
1 The Environment Agency confirmed our programme as ‘a logical approach with the proviso
that your programme of delivery for AMP6 needs to be sufficiently ambitious to mitigate having a large number of WFD actions to complete in AMP7 and AMP8. Early delivery of Water Framework Directive measures is essential if England is to make progress towards the necessary improvements by 2027’. (Letter to Matthew Wright, dated 1 November 2013).
3
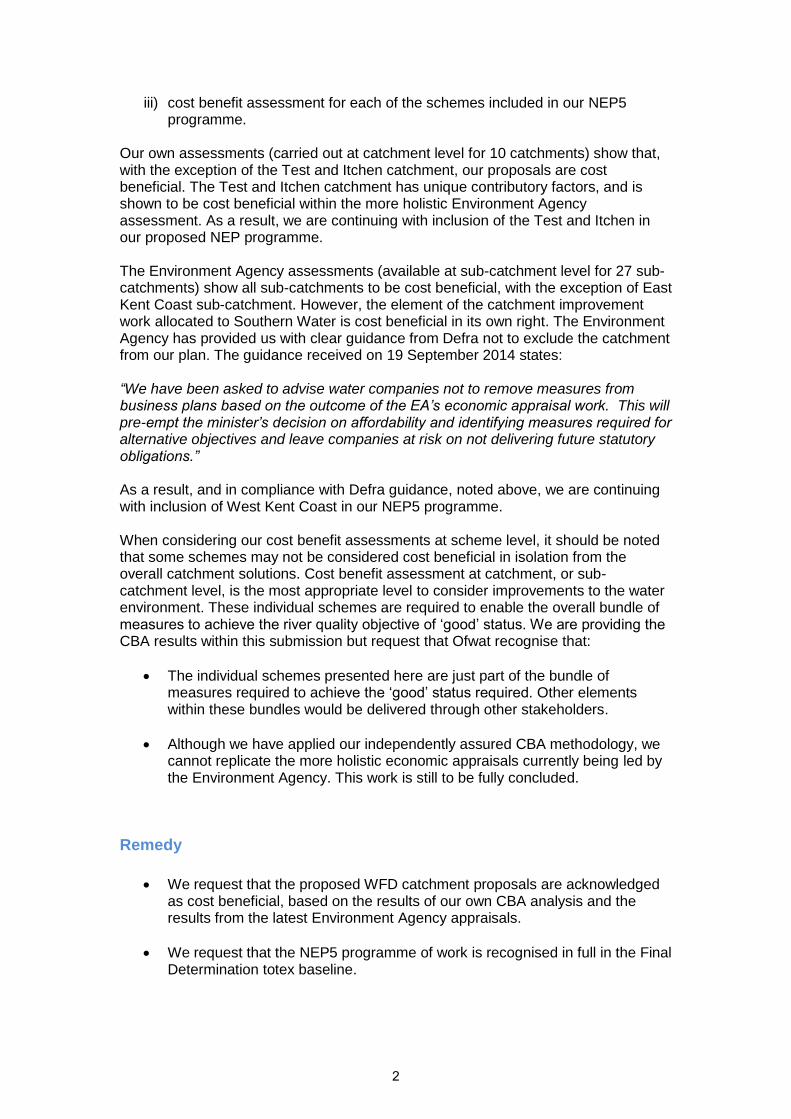
The Environment Agency economic appraisals remain on-going and they have requested that we do not remove any schemes based on their information. However, their results for the 27 available sub-catchments are likely to be cost beneficial. Only the East Kent Coast sub-catchment is shown as non-cost beneficial. However, our own results indicate that the Southern Water measures within this bundle of work are cost beneficial. We have provided the individual scheme results in Annex 1, which show that 70% of the schemes are assessed as cost beneficial. Although we have followed the principles of the Environment Agency cost benefit methodology, our assessment does not replicate their more holistic approach. This is explained further in section 2.1. An individual scheme may not be seen as cost beneficial in the results presented here but due to the joined up nature of the programme these schemes contribute to the successful delivery of the overall cost beneficial programme. It should to be noted that our scheme level cost benefit assessment of improvement in water quality does not represent an assessment of WFD disproportionate cost. Disproportionate cost assessment takes into account the cost of the full bundle of measures required to deliver all aspects of achieving good status, as well as accounting for benefits both monetised and non-monetised for all aspects of improvement of river quality. Our assessment of scheme level cost benefit is limited compared to a disproportionate cost assessment and cannot be used as a proxy for the disproportionate cost assessment being undertaken by the Environment Agency. The Environment Agency is assessing the cost benefits of the bundle of measures required to meet WFD requirements and they will use this to assess disproportionate costs as part of reviewing the River Basin Management Plan. This will inform the Minister’s decision on scheme inclusion within NEP5. The updated River Basin Management Plan is due for submission to the Minister in September 2015; a summary of this timescale is included at Annex 2. Therefore, funding should not be removed from NEP5 based on our scheme level cost benefit assessment, or before formal disproportionate cost assessment has taken place and the overall plans have been reviewed and confirmed by the Minister.
2. Evidence
Ofwat has already accepted the need, the cost robustness, and the customer protection case for NEP5. Ofwat has partially accepted our case on Cost Benefit Analysis, but has required that cost benefit assessment is completed at a scheme level to ensure schemes which may be disproportionately costly are removed from the programme. The Environment Agency is leading the economic appraisal of the full bundle of measures required to meet river quality objectives for each catchment. In response to the request for cost benefit analysis in the Draft Determination, we have carried out our own assessment. We are not able to replicate the more holistic analysis used by the Environment Agency, although we have taken account of the principles they have adopted.
4

Our approach to customer engagement and cost benefit analysis was set out in the December 2013 submission. Each outcome had a supporting document explaining the customer engagement approach. An independent review of our cost benefit methodology was carried out by Jacobs in August 2013, their main conclusion was: “The cost benefit analyses appeared to have been undertaken in a fair and unbiased manner using established discounting standards”. Our methodology is summarised in Annex 3. 2.1 The principles supporting development of the WFD programme and cost benefit assessment 2.1.1 A catchment-based approach In May 2013, DEFRA published a policy framework setting out a catchment-based approach, based on the premise that catchments are the natural scale to consider the water environment. It promotes the establishment of Catchment Partnerships, with all key stakeholders supporting the achievement of the Water Framework Directive (WFD) objectives and to address issues at the catchment level. How we have applied this principle:
We have developed our proposed WFD programme and intend to feed this back in to Catchment Partnerships once it has been fully agreed.
By considering options across a whole catchment, and taking account of phasing across AMP6 and AMP7, we have developed a fully efficient way of working.
This is supported within the Ofwat deep dive assessment which concludes that our costs are now at the frontier of efficiency for the industry.
Our catchment based cost benefit assessment shows that nine of the ten catchments are cost beneficial, with the tenth catchment supported by Environment Agency cost benefit assessment.
2.1.2 Improvement actions are assessed in bundles As part of the water industry and river basin management planning update in July 2014, the Environment Agency set out their approach to cost benefit analysis. The appraisal process includes all improvement measures and assesses them in bundles, at a catchment or sub-catchment2 level. Measures for the catchment include, habitat improvement actions, diffuse pollution actions, point source actions and water regulation actions. Water companies have an important part to play but their actions need to be assessed as part of the wider package. How we have applied this principle:
2 Referred to as operational catchments in the Environment Agency
5

Although we have assessed cost benefit for each scheme, as requested in the draft determination, the results cannot be used in isolation. An individual scheme may appear non-cost beneficial but may be essential to the bundle of measures achieving ‘good’ status.
Until the full cost benefit assessment has been completed by the Environment Agency and the full catchment requirements are understood, an individual wastewater treatment works scheme cannot be assessed based on just the information provided through our own cost benefit assessment.
Our results do support the Environment Agency approach of cost beneficial catchments and therefore give confidence that the programme is not disproportionately costly.
2.1.3 Both quantitative (monetised) and qualitative benefits are considered as part of the appraisals The approach has been set out in the Environment Agency external briefing note ‘valuing environmental benefits’. Benefits are monetised through the use of willingness to pay research (using the National Water Environment Benefits Survey or ‘NWEBS’ values) and applied per km of water body improved within a catchment. The Environment Agency assesses which measures are required to enable a catchment to achieve the WFD ‘good’ status. In addition to the quantitative approach, a qualitative approach is used where benefits and dis-benefits are described qualitatively in text and, where significant, their impact will also be quantified. The resulting Appraisal Summary Table (AST) will be summarised in the Final Appraisal Report (FAR) and will form part of the overall reporting and recommendations. How we have applied this principle:
Our cost benefit assessment follows the same approach as that used by the Environment Agency. Our willingness to pay benefit values are in line with the NWEBS values used by the Environment Agency, see Annex 3. The river lengths are consistent with those used by the Environment Agency; the same data sets are used by all Catchment Partners.
The non-monetised benefits are used by the Environment Agency to add weight to the assessment. More weight may be attributed to the non-monetised benefits for biodiversity benefits from agricultural schemes and for increasing abstraction for public supply.
As our cost benefit assessments provide just the monetised benefits, the results are likely to be an underestimate of the catchment total benefit in the disproportionate cost assessment.
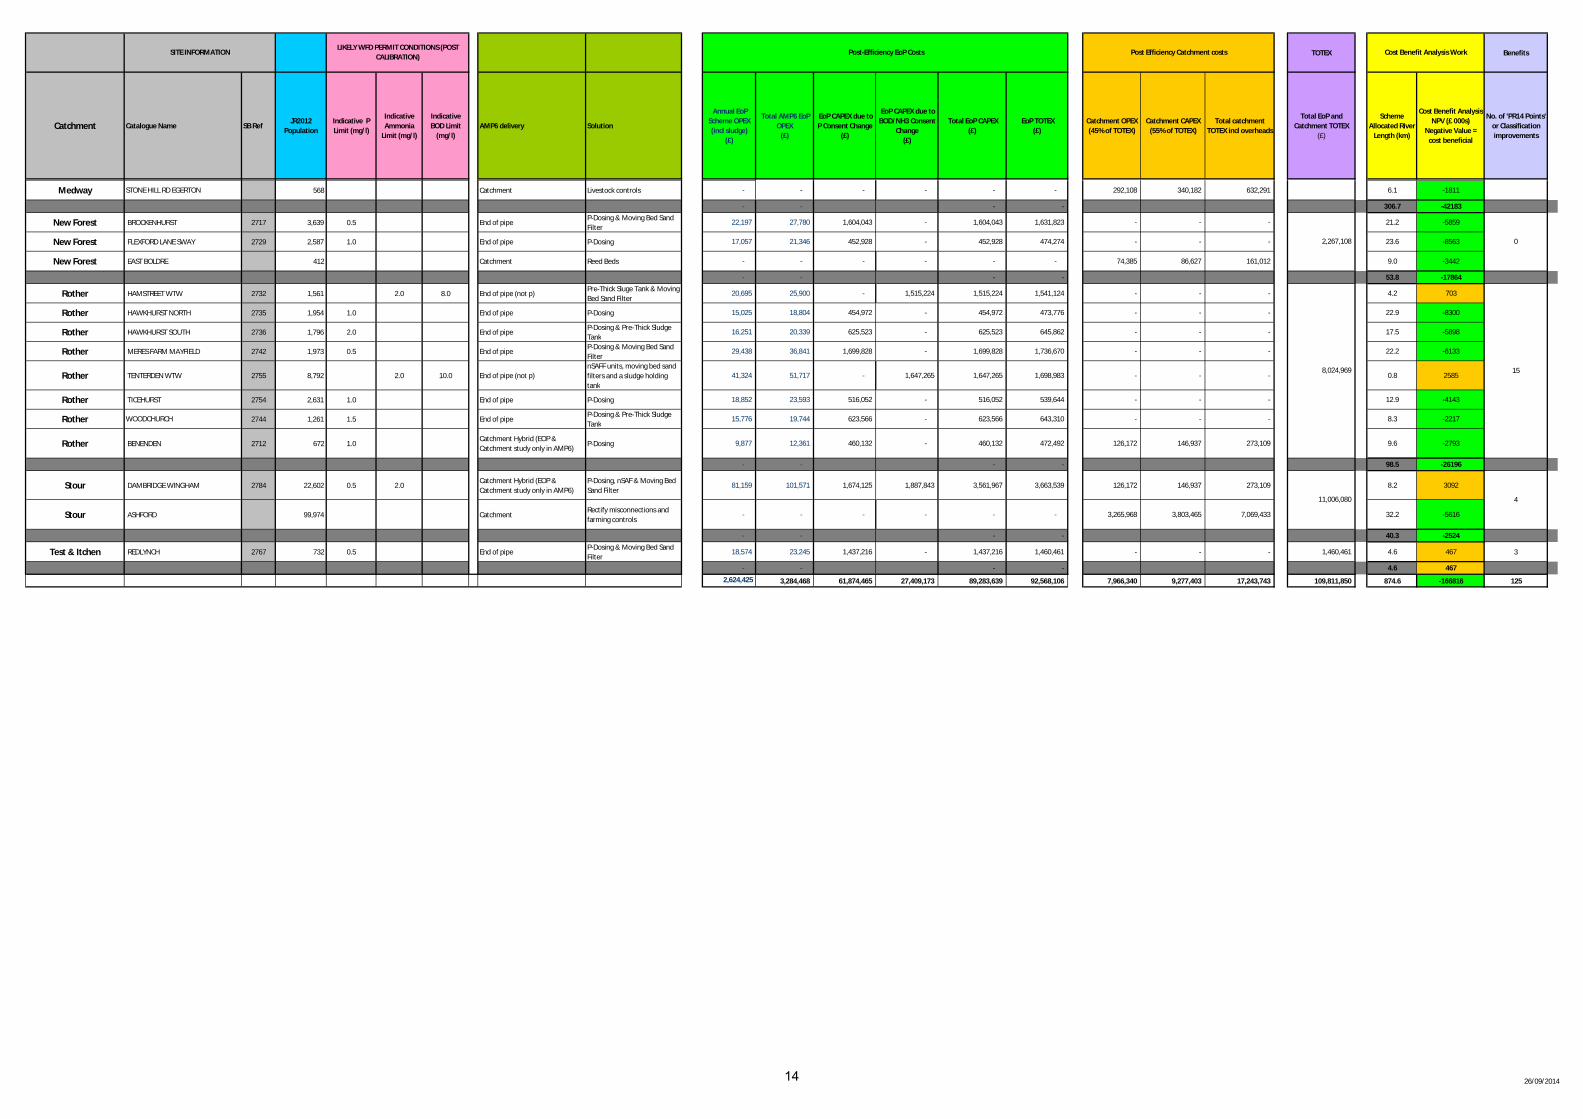
2.2 Results The scheme schedule has been updated to include the cost benefit results and is included in Annex 1.
6

At the overall level, it is clear that the programme of schemes that have been identified as required to meet the WFD ‘good’ status is cost beneficial. The table below details the catchment level cost benefits. Table 2: Summary of cost benefit analysis data.
3
Catchment Totex (£k) Benefit Allocation of
River Length (km)
Cost Benefit (NPV Total)
(£k)
Adur and Ouse 13,415 124 -21,866
Arun and Western 16,366 152 -33,053
Cuckmere & Pevensey 5,081 67 -18,962
East Hants 1,344 12 -2,470
Isle of Wight 2,681 16 -2,165
Medway 48,166 307 -42,183
New Forest 2,267 54 -17,864
Rother 8,025 99 -26,196
Stour 11,006 40 -2,524
Test and Itchen 1,460 5 467
Total 109,812 875 -166,816
Nine out of the ten river catchments have been confirmed as cost beneficial. The Test and Itchen improvement is not cost beneficial, based on our assessment of the work required at Redlynch sewage treatment works to improve river quality. This result cannot be taken in isolation of the wider situation:
Although relatively short, the river is currently at ‘bad’ status, which is quite rare in the South East outside the Medway region. Works will improve it to ‘good’ status, an improvement of 3 classification bands.
The reason for failure has been confirmed as water industry continuous sewage discharge with Redlynch being the only works.
Phosphorus is the only determinand currently failing, so the entire the river would improve to full ‘Good Ecological Status’ with works.
The Environment Agency economic appraisal for this catchment shows that the full bundle of measures is cost beneficial.
The Environment Agency has used the higher willingness to pay value which may be why their results have it as cost beneficial, their appraisal for this catchment states: “.. the chalk streams are a highly valued and rare habitat (approximately 200 chalk streams exist globally). In this operational catchment, the rivers and streams are highly valued by local people and land owners (much revolving around angling), and is responsible for significant contributions to the local economy (e.g. agriculture, aquaculture and angling). It is for these reasons that the higher value has been used.” It is likely that on review of the full programme of measures and benefits the Environment Agency will not consider the improvement in this high status catchment to ‘good’ status as disproportionately costly.
3 For alignment with our optimisation tool (Pioneer), cost benefit is expressed as a net cost. A
negative result means the scheme is cost beneficial.
7

In Table 3, our own catchment results are compared to the Environment Agency results based on their Final Appraisal Reports for economic appraisals - South East River Basin Management Plan. These were received in September 2014 and draw upon December 2013 PR14 submission costs. The refined June 2014 PR14 submission costs have been shared with the Environment Agency, but they have stated that these will only be used further down the line in any further work that they undertake to revise their CBAs. Our reduced costs should have a positive effect upon the resulting cost benefit. Recognising these evaluations have not been completed, the Environment Agency included the following advice with the reports. “We have been asked to advise water companies not to remove measures from business plans based on the outcome of the EA’s economic appraisal work. This will pre-empt the minister’s decision on affordability and identifying measures required for alternative objectives and leave companies at risk on not delivering future statutory obligations.” There are 11 WFD catchments in our area, with 40 sub-catchments. At this stage we have received information for 27 sub-catchments. They have been aligned in Table 3, with the mapping of the catchments shown in Annex 4
8

Table 3: A comparison of Southern Water’s CBA results with the Environment Agency Final Appraisal Reports
Catchment Totex (£)Benefit allocation of
River Length (km)
Southern
Water cost
benefit
(£k NPV)
EA Assessment
2014
Adur and Ouse 13,415,061 124 -21,866 Cost Beneficial
Adur Cost Beneficial
Ouse Cost Beneficial
Teville Cost Beneficial
Arun and Western 16,365,891 152 -33,053 Cost Beneficial
Lower Arun Cost Beneficial
Lower Greensand Arun & Western Streams Cost Beneficial
Western Rother Cost Beneficial
Western Streams Cost Beneficial
Upper Arun Cost Beneficial
Cuckmere & Pevensey 5,081,454 67 -18,962 Cost Beneficial
Combe Haven Cost Beneficial
Cuckmere Cost Beneficial
Pevensey Cost Beneficial
East Hants 1,343,552 12 -2,470 Cost Beneficial
East Hants Cost Beneficial
Isle of Wight 2,681,127 16 -2,165 Cost Beneficial
Isle of Wight Cost Beneficial
Medway 48,166,145 307 -42,183 No data available
New Forest 2,267,108 54 -17,864 Cost Beneficial
Bartley Water Cost Beneficial
Hatchet and Sowley Cost Beneficial
Lymington/Beaulieu Cost Beneficial
Urban Costal Cost Beneficial
North Kent no schemes No data available
Rother 8,024,969 99 -26,196 Cost Beneficial
Brede and Tilingham Cost Beneficial
Reading, Cradlebridge & Royal Military Canal (RMC) Cost Beneficial
Romney Marsh South Cost Beneficial
Rother Levels Cost Beneficial
Upper Rother Cost Beneficial
Stour 11,006,080 40 -2,524 Not Cost Beneficial
East Kent Coast Not Cost Beneficial
Test and Itchen 1,460,461 5 467 Cost Beneficial
Itchen Cost Beneficial
Test Groundwater Cost Beneficial
The Lower Test & Southampton Streams Cost Beneficial
Upper & Middle Test Cost Beneficial
Total 109,811,848 875 -166,816
In the Environment Agency results, the only operational catchment not shown to be cost beneficial is East Kent Coast, in the Stour catchment. However, the Southern Water element of this bundle is shown to be cost beneficial. It should be noted that the Environment Agency results are using the December 2013 Business Plan costs which have since reduced significantly.
9

At the individual scheme level, some schemes are non-cost beneficial but deliver benefit to the river system and are necessary to meet the overall WFD objective for the catchment. Without these schemes the WFD requirement would not be delivered but the need to deliver these schemes through the Managing Uncertainty element of the NEP would remain. The full results are shown in Annex 1 2.3 Other elements of the NEP5 managing uncertainty programme In addition to the WFD programme, the NEP5 Managing Uncertainty Programme included costs for other drivers. For the sake of completeness, these are considered here. 2.3.1 CSO investigations Our June 2014 update to our Business Plan explained the need for this work. In July 2013 Richard Benyon MP (the Minister for Natural Environment and Fisheries at the time) wrote to all water companies regarding discharges from Combined Sewer Overflows (CSOs). He expressed concern on a number of issues, including the nuisance and pollution from the persistent operation of CSOs. The Minister believed that water companies needed to introduce monitoring for the vast majority of CSOs by 2020. Our Business Plan includes the provision of event and duration monitors at all but the lowest amenity water catchments. In addition, we made provision for the biological sampling that is likely to be required under the WFD guidelines. The purpose of the CSO investigations programme is to enable us to assess where remedial actions may be required and inform the development of solutions for AMP7. No remedial actions have been included in our Business Plan for AMP6 and therefore cost benefit assessments are not appropriate. The results of the investigation work feed into the cost benefit assessments required as part of the planning for AMP7. 2.3.2 Habitats and Shellfish schemes Similarly it is not possible to use the same cost benefit methodology as WFD schemes for Habitats and Shellfish related NEP5 schemes; as these schemes do not directly seek to improve the water body to WFD ‘good’ status. These schemes have other related environmental drivers that have not been quantified through willingness to pay. As detailed in our June 2014 submission the Environment Agency fully support the inclusion of these Shellfish and Habitats schemes in our AMP6 Programme under NEP5. Therefore, these schemes also remain fully funded as detailed in our June 2014 submission. We have set out the customer support for this area of the programme in the December 2013 submission, Annex 15, Supporting Document 15.2 Looking after the environment (wastewater) – customer engagement support. In summary:
As a strategic priority, this was identified as an area that needed improvement. Customers supported delivery of improvements required by the Water Framework Directive and other legal standards.
10

The plan acceptability for the Looking after the environment outcome was 91% / 92% (household / non-household).
3. Board Engagement
The Board has supported the case as part of our overall DD representations.
4. CCG
The Environment Agency has confirmed via our Customer Challenge Group that they continue to support our NEP5 programme.
5. External Assurance
This representation has been independently assured by Halcrow Management Sciences Limited, a subsidiary of CH2M HILL. Their ‘Review and Assurance of Draft Determination Representations, Summary Report’ dated 2 October stated: “Our sample checks on data presented in the Company’s representation has confirmed satisfactory trails to both internal and external information sources. On this basis we conclude that the evidence base for the representation is robust. The cost benefit methodology adopted was consistent with the methodology used for the Business Plan submission and that the representation appropriately references the Environment Agency's cost benefit approach and current results where this is feasible”
6. Annexes
1 Scheme Results 2 River Basin Management Plan timescales 3 Summary of cost benefit assessment methodology 4 Map of Catchment Areas
11

NEP5 - WFD Summary Sheet
TOTEX Benefits
Catchment Catalogue Name SB RefJR2012
Population
Indicative P
Limit (mg/l)
Indicative
Ammonia
Limit (mg/l)
Indicative
BOD Limit
(mg/l)
AMP6 delivery Solution
Annual EoP
Scheme OPEX
(incl sludge)
(£)
Total AMP6 EoP
OPEX
(£)
EoP CAPEX due to
P Consent Change
(£)
EoP CAPEX due to
BOD/NH3 Consent
Change
(£)
Total EoP CAPEX
(£)
EoP TOTEX
(£)
Catchment OPEX
(45% of TOTEX)
Catchment CAPEX
(55% of TOTEX)
Total catchment
TOTEX incl overheads
Total EoP and
Catchment TOTEX
(£)
Scheme
Allocated River
Length (km)
Cost Benefit Analysis
NPV (£ 000s)
Negative Value =
cost beneficial
No. of 'PR14 Points'
or Classification
improvements
Adur & Ouse BARCOMBE NEW 2710 3,420 1.0 End of pipeP-Dosing & Pre-Thick Sludge
Tank23,249 29,096 518,396 - 518,396 547,492 - - - 11.2 -3360
Adur & Ouse BARNS GREEN 2711 1,084 1.0 End of pipe P-Dosing 9,893 12,381 567,363 - 567,363 579,744 - - - 18.3 -6422
Adur & Ouse BLACKBOYS 2716 1,014 2.0 End of pipe P-Dosing 8,094 10,129 456,296 - 456,296 466,425 - - - 5.3 -1364
Adur & Ouse BUXTED 2718 1,845 2.0 End of pipe P-Dosing 11,023 13,795 474,538 - 474,538 488,333 - - - 10.5 -3388
Adur & Ouse DITCHLING 2723 1,580 1.0 End of pipeP-Dosing & Moving Bed Sand
Filter11,525 14,423 411,274 - 411,274 425,697 - - - 6.0 -1656
Adur & Ouse NEAVES LANE RINGMER 2773 5,096 1.5 End of pipeP-Dosing & Pre-Thick Sludge
Tank36,597 45,802 681,021 - 681,021 726,822 - - - 13.1 -3640
Adur & Ouse NEWICK 2772 3,103 2.0 End of pipe P-Dosing 16,920 21,175 464,864 - 464,864 486,040 - - - 2.9 -207
Adur & Ouse SCAYNES HILL 2766 36,073 0.5 End of pipeP-Dosing, Pre-ThickSludge
Tank & Disc Filters293,943 367,870 3,165,458 - 3,165,458 3,533,328 - - - 21.3 1649
Adur & Ouse SMALL DOLE 2763 769 1.0 End of pipeP-Dosing & Pre-Thick Sludge
Tank10,936 13,686 742,581 - 742,581 756,267 - - - 7.9 -1996
Adur & Ouse STEYNING WTW 2760 10,164 3.0 End of pipe (not p) Biofilters and nSAFF units. 24,687 30,896 - 2,739,993 2,739,993 2,770,889 - - - 4.5 1614
Adur & Ouse UCKFIELD 2750 20,792 0.5 End of pipeP-Dosing, Pre-ThickSludge
Tank & Deep Bed Sand Filters160,048 200,301 1,728,572 - 1,728,572 1,928,873 - - - 13.2 292
Adur & Ouse FULKING 137 Catchment Study AMP7 Catchment scheme - - - - - - 126,172 146,937 273,109 0.4 -39
Adur & Ouse HALLAND 399 Catchment Study AMP7 Reed Beds - - - - - - 73,425 85,508 158,933 0.2 13
Adur & Ouse MONKS GATE 172 Catchment Study AMP7 Catchment scheme - - - - - -
Adur & Ouse NUTHURST 30 Catchment Study AMP7 Catchment scheme - - - - - -
- - - - 123.5 -21866
Arun & Western
StreamsBILLINGSHURST 2714 7,569 2.0 2.0 8.0 End of pipe P-Dosing, nSAF & Disc Filter 61,832 77,383 583,446 2,487,321 3,070,766 3,148,149 - - - 17.9 -1992
Arun & Western
StreamsCHEPHURST COPSE RUDGWICK 2719 2,266 1.0 End of pipe P-Dosing 16,174 20,241 573,517 - 573,517 593,758 - - - 3.5 -323
Arun & Western
StreamsFERNHURST 2727 1,885 2.0 End of pipe
P-Dosing & Pre-Thick Sludge
Tank15,881 19,875 696,238 - 696,238 716,113 - - - 41.0 -15281
Arun & Western
StreamsLOXWOOD 2740 3,304 1.0 End of pipe P-Dosing 22,457 28,105 575,690 - 575,690 603,794 - - - 2.3 267
Arun & Western
StreamsSLINFOLD 2764 1,254 2.0 End of pipe
P-Dosing & Pre-Thick Sludge
Tank11,768 14,728 674,249 - 674,249 688,976 - - - 0.8 805
Arun & Western
StreamsSTORRINGTON 2759 7,824 1.0 End of pipe P-Dosing 48,263 60,401 605,196 - 605,196 665,597 - - - 4.8 -116
Arun & Western
StreamsSUMMER LANE PAGHAM 2758 8,182 0.5 End of pipe P-Dosing & Disc Filter 78,098 97,740 2,261,779 - 2,261,779 2,359,519 - - - 18.1 -2655
Arun & Western
StreamsSIDLESHAM 2785 29,053 2.0 7.0 End of pipe (not p)
second stage plastic media
filtration and additional
moving bed sand filters.
48,138 60,245 - 3,809,182 3,809,182 3,869,427 - - - 3.3 4562
Arun & Western
StreamsLIDSEY 2738 24,835 0.5 Catchment Hybrid
Pre-Thick Sluge Tank/Livestock
controls, rectify
misconnections
53,437 66,876 255,140 - 255,140 322,016 8.2 -962
Arun & Western
StreamsTANGMERE 2756 4,786 0.5 Catchment Hybrid
P-Dosing & Moving Bed Sand
Filter/ Livestock controls,
rectify misconnections
39,405 49,316 1,201,464 - 1,201,464 1,250,779 8.2 -77
Arun & Western
StreamsBURITON 495 Catchment Study AMP7 Catchment - - - - - - 126,172 146,937 273,109 28.3 -11109
Arun & Western
StreamsMANNINGS HEATH 1,004 Catchment Study AMP7 Reed Beds - - - - - - 114,223 133,021 247,244 16.0 -6172
- - - - 152.4 -33053
Cuckmere & Pevensey WINDMILL HILL HERSTMONCEUX 2745 2,318 1.5 End of pipeP-Dosing & Pre-Thick Sludge
Tank32,695 40,918 660,882 - 660,882 701,800 - - - 11.1 -2907
Cuckmere & Pevensey VINES CROSS 2748 13,750 0.6 Catchment HybridP-Dosing, PFT & Disc
Filters/Livestock controls57,115 71,479 2,410,995 - 2,410,995 2,482,474 455,271 530,197 985,468 42.1 -11630
Cuckmere & Pevensey CATSFIELD 1,504 Catchment Reed Beds - - - - - - 176,897 206,010 382,907 8.5 -3014
Cuckmere & Pevensey HOOE 512 Catchment Reed Beds - - - - - - 244,300 284,505 528,805 4.9 -1411
- - - - 66.5 -18962
East Hants BISHOPS WALTHAM 2715 13,944 0.7 End of pipeP-Dosing & Moving Bed Sand
Filter29,558 36,991 1,033,451 - 1,033,451 1,070,443 - - - 4.3 558
East Hants SOUTHWICK 1,102 Catchment Study AMP7 Catchment - - - - - - 126,172 146,937 273,109 8.2 -3028
- - - - 12.5 -2470
Isle of Wight HAZELY COMBE ARRETON WTW 2737 100 15.0 End of pipe (not p)
Storm Tank , Biofilter Recirc PS,
Auto Desludge, Pre-Thick
Sludge Tank & Liquor Return
6,961 8,712 - 960,051 960,051 968,763 - - - 0.0 1452
LIKELY WFD PERMIT CONDITIONS (POST
CALIBRATION)SITE INFORMATION Post-Efficiency EoP Costs
16,365,891
751,837 875,571
5,081,454
2
8
13,415,061
8.7 -3362
17
Cost Benefit Analysis Work
1,627,409
Post Efficiency Catchment costs
126,172 146,937 273,109
17
1,343,552
26/09/201412

TOTEX Benefits
Catchment Catalogue Name SB RefJR2012
Population
Indicative P
Limit (mg/l)
Indicative
Ammonia
Limit (mg/l)
Indicative
BOD Limit
(mg/l)
AMP6 delivery Solution
Annual EoP
Scheme OPEX
(incl sludge)
(£)
Total AMP6 EoP
OPEX
(£)
EoP CAPEX due to
P Consent Change
(£)
EoP CAPEX due to
BOD/NH3 Consent
Change
(£)
Total EoP CAPEX
(£)
EoP TOTEX
(£)
Catchment OPEX
(45% of TOTEX)
Catchment CAPEX
(55% of TOTEX)
Total catchment
TOTEX incl overheads
Total EoP and
Catchment TOTEX
(£)
Scheme
Allocated River
Length (km)
Cost Benefit Analysis
NPV (£ 000s)
Negative Value =
cost beneficial
No. of 'PR14 Points'
or Classification
improvements
LIKELY WFD PERMIT CONDITIONS (POST
CALIBRATION)SITE INFORMATION Post-Efficiency EoP Costs Cost Benefit Analysis WorkPost Efficiency Catchment costs
Isle of Wight SHALFLEET 2765 630 2.0 End of pipeP-Dosing & Pre-Thick Sludge
Tank9,278 11,611 682,359 - 682,359 693,970 - - - 2.2 182
Isle of Wight WROXALL 2743 2,915 1.0 End of pipeP-Dosing & Pre-Thick Sludge
Tank21,867 27,366 717,920 - 717,920 745,286 - - - 7.2 -1520
Isle of Wight NORTH VIEW THORLEY 105 Catchment Study AMP7 Catchment - - - - - - 126,172 146,937 273,109 6.4 -2279
- - - - 15.8 -2165
Medway BIDDENDEN 2713 2,460 1.0 2.0 7.0 End of PipeP opex. NH3/BOD additional
biofilter volume6,827 8,544 0 527,159 527,159 535,703 - - - 10.7 -3454
Medway COXHEATH 2720 7,580 1.0 End of Pipe P-Dosing 27,971 35,006 520,936 - 520,936 555,942 - - - 8.8 -2287
Medway CRANBROOK 2721 6,886 0.5 End of Pipe P-Dosing 12,696 15,889 92,521 - 92,521 108,410 - - - 29.8 -11581
Medway FOREST ROW 2728 4,397 0.5 End of PipeP-Dosing & Moving Bed Sand
Filter41,687 52,172 1,650,297 - 1,650,297 1,702,468 - - - 0.4 2860
Medway HADLOW 2731 3,376 2.0 End of Pipe P-Dosing 17,197 21,521 468,675 - 468,675 490,196 - - - 18.1 -6321
Medway HARTFIELD 2733 953 1.0 End of PipeP-Dosing & Pre-Thick Sludge
Tank12,410 15,531 699,566 - 699,566 715,097 - - - 0.5 969
Medway LUXFORDS LANE EAST GRINSTEAD 2741 9,298 0.5 End of Pipe
P-Dosing, Pre-ThickSludge
Tank & Moving Bed Sand
Filters
38,850 48,621 1,901,361 - 1,901,361 1,949,983 - - - 4.3 1514
Medway PADDOCK WOOD 2770 9,879 1.0 2.0 7.0 End of Pipe
P additional chemical (opex),
NH3/BOD Bio Filtration, nSAF
& Moving Bed Sand Filter
45,831 57,358 0 2,136,170 2,136,170 2,193,528 - - - 22.4 -5500
Medway PEMBURY 2769 5,530 0.5 End of Pipe P-Dosing 38,129 47,718 557,539 - 557,539 605,257 - - - 10.2 -2591
Medway REDGATE MILL CROWBOROUGH 2768 21,114 0.5 End of Pipe P-Dosing, PFT & Disc Filters 73,323 91,764 2,641,862 - 2,641,862 2,733,626 - - - 19.1 -2643
Medway SPELDHURST 2762 3,213 1.0 3.0 End of Pipe
addition of ferric dosing plant,
biofilter, humus tank and
nitrifying sand filters.
80,888 101,231 497,125 4,022,196 4,519,322 4,620,553 - - - 2.7 5990
Medway ST JOHNS CROWBOROUGH 2761 2,320 1.0 End of Pipe P-Dosing 16,570 20,738 563,620 - 563,620 584,357 - - - 0.9 706
Medway SUTTON VALENCE 2757 885 1.0 End of Pipe Opex only 1,272 1,592 0 - 0 1,592 - - - 4.8 -1916
Medway TONBRIDGE 2753 46,382 0.5 End of Pipe P-Dosing & Disc Filter 122,237 152,979 3,596,425 - 3,596,425 3,749,404 - - - 11.3 2909
Medway TUNBRIDGE WELLS NORTH 2752 27,585 0.5 2.0 7.0 End of Pipe
Mulitpoint ferric dosing plant
and nitrifying Submerged
Aerated Flooded Filter (nSAFF).
60,630 75,879 592,422 1,662,558 2,254,980 2,330,859 - - - 12.7 -1171
Medway TUNBRIDGE WELLS SOUTH 2751 30,139 0.5 3.0 8.0 End of Pipe
Multipoint ferric dosing ,
extension of the existing deep
bed sand filter TT.
59,664 74,669 1,029,006 686,004 1,715,010 1,789,679 - - - 20.8 -4809
Medway UNDERHILL GOUDHURST 2749 641 1.0 End of Pipe P-Dosing 6,999 8,759 463,592 - 463,592 472,352 - - - 4.2 -948
Medway WATERINGBURY 2747 9,626 4.0 End of Pipe P-Dosing 42,662 53,392 524,930 - 524,930 578,322 - - - 0.3 1456
Medway WHITEGATES LANE WADHURST 2746 2,919 1.0 End of Pipe P-Dosing 17,846 22,334 559,033 - 559,033 581,368 - - - 9.4 -2654
Medway BIDBOROUGH 2734 8,169 Catchment TransferPumping Station & Force Main
(6.5km)103,569 129,616 6,438,460 - 6,438,460 6,568,077 - - - 9.5 5352
Medway EDEN VALE EAST GRINSTEAD 2724 13,659 0.5 Catchment Hybrid
P-Dosing, PFT & Moving Bed
Sand Filter/Livestock control,
remedy misconections
34,283 42,906 1,070,618 - 1,070,618 1,113,524 19.0 -5234
Medway EDENBRIDGE 2725 11,281 0.5 Catchment Hybrid
P-Dosing & PFT/Delivered
through upstream end of pipe
and catchment controls -
livestock control and rectify
misconnections
59,080 73,939 82,053 - 82,053 155,992 6.2 -662
Medway FELBRIDGE 2726 6,467 0.5 Catchment Hybrid
P-Dosing & Disc
Filter/Livestock control,
remedy misconections
64,231 80,385 2,366,494 - 2,366,494 2,446,879 3.6 3426
Medway GODSTONE 2730 5,327 0.5 Catchment Hybrid
P-Dosing & Moving Bed Sand
Filter/Livestock control,
remedy misconections
40,479 50,659 1,681,993 - 1,681,993 1,732,652 11.2 -1040
Medway LINGFIELD 2739 10,900 0.5 3.0 10.0 Catchment Hybrid
nitrifying Submerged Aerated
Filter (nSAFF) units, sludge
thickening, additional moving
bed sand filters and additional
ferric dosing. Livestock
control, remedy misconections
87,098 109,003 1,109,403 3,328,209 4,437,612 4,546,615 16.8 1027
Medway OXTED 2771 13,883 0.5 Catchment Hybrid
P-Dosing, PFT & Moving Bed
Sand Filter/Livestock control,
remedy misconections
45,928 57,479 1,075,463 - 1,075,463 1,132,941 18.7 -4805
Medway HIGH HALDEN 1,117 3.0 10.0 Catchment p + Ammonia eopLivestock controls. Nil cost
output for NH3/BOD0 0 - 0 0 0 8.4 -3108
Medway SMARDEN 859 Catchment Livestock controls - - - - - - 1.6 -368
Medway BETHERSDEN 914 Catchment Livestock controls - - - - - - 14.4 -5489
384,538 447,824
1,250,184 1,455,934 2,706,118
12,681,127
832,362
48,166,145 58
26/09/201413
TOTEX Benefits
Catchment Catalogue Name SB RefJR2012
Population
Indicative P
Limit (mg/l)
Indicative
Ammonia
Limit (mg/l)
Indicative
BOD Limit
(mg/l)
AMP6 delivery Solution
Annual EoP
Scheme OPEX
(incl sludge)
(£)
Total AMP6 EoP
OPEX
(£)
EoP CAPEX due to
P Consent Change
(£)
EoP CAPEX due to
BOD/NH3 Consent
Change
(£)
Total EoP CAPEX
(£)
EoP TOTEX
(£)
Catchment OPEX
(45% of TOTEX)
Catchment CAPEX
(55% of TOTEX)
Total catchment
TOTEX incl overheads
Total EoP and
Catchment TOTEX
(£)
Scheme
Allocated River
Length (km)
Cost Benefit Analysis
NPV (£ 000s)
Negative Value =
cost beneficial
No. of 'PR14 Points'
or Classification
improvements
LIKELY WFD PERMIT CONDITIONS (POST
CALIBRATION)SITE INFORMATION Post-Efficiency EoP Costs Cost Benefit Analysis WorkPost Efficiency Catchment costs
Medway STONE HILL RD EGERTON 568 Catchment Livestock controls - - - - - - 292,108 340,182 632,291 6.1 -1811
- - - - 306.7 -42183
New Forest BROCKENHURST 2717 3,639 0.5 End of pipeP-Dosing & Moving Bed Sand
Filter22,197 27,780 1,604,043 - 1,604,043 1,631,823 - - - 21.2 -5859
New Forest FLEXFORD LANE SWAY 2729 2,587 1.0 End of pipe P-Dosing 17,057 21,346 452,928 - 452,928 474,274 - - - 23.6 -8563
New Forest EAST BOLDRE 412 Catchment Reed Beds - - - - - - 74,385 86,627 161,012 9.0 -3442
- - - - 53.8 -17864
Rother HAMSTREET WTW 2732 1,561 2.0 8.0 End of pipe (not p)Pre-Thick Sluge Tank & Moving
Bed Sand Filter20,695 25,900 - 1,515,224 1,515,224 1,541,124 - - - 4.2 703
Rother HAWKHURST NORTH 2735 1,954 1.0 End of pipe P-Dosing 15,025 18,804 454,972 - 454,972 473,776 - - - 22.9 -8300
Rother HAWKHURST SOUTH 2736 1,796 2.0 End of pipeP-Dosing & Pre-Thick Sludge
Tank16,251 20,339 625,523 - 625,523 645,862 - - - 17.5 -5898
Rother MERES FARM MAYFIELD 2742 1,973 0.5 End of pipeP-Dosing & Moving Bed Sand
Filter29,438 36,841 1,699,828 - 1,699,828 1,736,670 - - - 22.2 -6133
Rother TENTERDEN WTW 2755 8,792 2.0 10.0 End of pipe (not p)
nSAFF units, moving bed sand
filters and a sludge holding
tank
41,324 51,717 - 1,647,265 1,647,265 1,698,983 - - - 0.8 2585
Rother TICEHURST 2754 2,631 1.0 End of pipe P-Dosing 18,852 23,593 516,052 - 516,052 539,644 - - - 12.9 -4143
Rother WOODCHURCH 2744 1,261 1.5 End of pipeP-Dosing & Pre-Thick Sludge
Tank15,776 19,744 623,566 - 623,566 643,310 - - - 8.3 -2217
Rother BENENDEN 2712 672 1.0Catchment Hybrid (EOP &
Catchment study only in AMP6)P-Dosing 9,877 12,361 460,132 - 460,132 472,492 126,172 146,937 273,109 9.6 -2793
- - - - 98.5 -26196
Stour DAMBRIDGE WINGHAM 2784 22,602 0.5 2.0Catchment Hybrid (EOP &
Catchment study only in AMP6)
P-Dosing, nSAF & Moving Bed
Sand Filter81,159 101,571 1,674,125 1,887,843 3,561,967 3,663,539 126,172 146,937 273,109 8.2 3092
Stour ASHFORD 99,974 Catchment Rectify misconnections and
farming controls- - - - - - 3,265,968 3,803,465 7,069,433 32.2 -5616
- - - - 40.3 -2524
Test & Itchen REDLYNCH 2767 732 0.5 End of pipe P-Dosing & Moving Bed Sand
Filter18,574 23,245 1,437,216 - 1,437,216 1,460,461 - - - 1,460,461 4.6 467 3
- - - - 4.6 467
2,624,425 3,284,468 61,874,465 27,409,173 89,283,639 92,568,106 7,966,340 9,277,403 17,243,743 109,811,850 874.6 -166816 125
4
15
0
11,006,080
8,024,969
2,267,108
26/09/201414

Annex 2 River Basin Management Plan timescales Extracted from the “Water industry and river basin management planning update” meeting, 22nd July 2014. Table 4: Summary of River Basin Management Plan timescales
Process Stage Indicative Date
Challenges and choices consultation ends December 13
Cost benefit analysis completed (but not available) April 14
Impact assessment Summer 14
Proposed updated River Basin Plan consultation September 14 to March 15
Updated River Basin Plan submitted to Minister September 15
For sign off by December 15
15
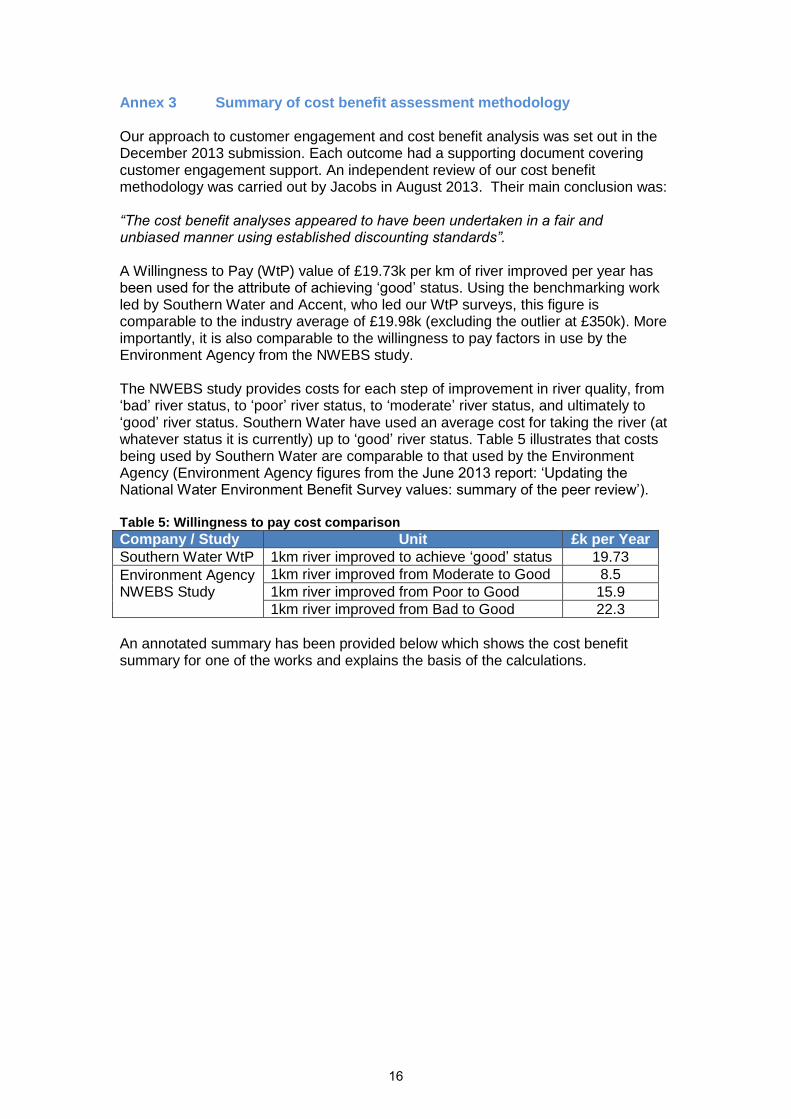
Annex 3 Summary of cost benefit assessment methodology Our approach to customer engagement and cost benefit analysis was set out in the December 2013 submission. Each outcome had a supporting document covering customer engagement support. An independent review of our cost benefit methodology was carried out by Jacobs in August 2013. Their main conclusion was: “The cost benefit analyses appeared to have been undertaken in a fair and unbiased manner using established discounting standards”. A Willingness to Pay (WtP) value of £19.73k per km of river improved per year has been used for the attribute of achieving ‘good’ status. Using the benchmarking work led by Southern Water and Accent, who led our WtP surveys, this figure is comparable to the industry average of £19.98k (excluding the outlier at £350k). More importantly, it is also comparable to the willingness to pay factors in use by the Environment Agency from the NWEBS study. The NWEBS study provides costs for each step of improvement in river quality, from ‘bad’ river status, to ‘poor’ river status, to ‘moderate’ river status, and ultimately to ‘good’ river status. Southern Water have used an average cost for taking the river (at whatever status it is currently) up to ‘good’ river status. Table 5 illustrates that costs being used by Southern Water are comparable to that used by the Environment Agency (Environment Agency figures from the June 2013 report: ‘Updating the National Water Environment Benefit Survey values: summary of the peer review’). Table 5: Willingness to pay cost comparison
Company / Study Unit £k per Year
Southern Water WtP 1km river improved to achieve ‘good’ status 19.73
Environment Agency NWEBS Study
1km river improved from Moderate to Good 8.5
1km river improved from Poor to Good 15.9
1km river improved from Bad to Good 22.3
An annotated summary has been provided below which shows the cost benefit summary for one of the works and explains the basis of the calculations.
16

Figure 1: Cost Benefit Analysis Methodology Summary
Whole Life Cost Benefit Model
£000's -1,992
£000's 5,209
139%
Scheme Name
PRN £000's 3,071
Date £000's 1,198
£000's/yr 62
£000's/yr 0
3.70% £000's/yr 353
3.50%
40
ANNUAL PROFILE (all costs in £000's)
Costs are shown as positive values and benefits as negative for consistency with Pioneer
Overall
Opex Income Avoided Total Health costs Env Costs Customer Total Total
NPV (£000's) 3,658 3,904 1,261 0 0 5,209 0 0 -7,201 -7,201 -1,992
Year
1 3,071 177 0 0 0 177 0 0 0 0 177
2 0 177 62 0 0 238 0 0 -353 -353 -115
3 0 177 62 0 0 238 0 0 -353 -353 -115
4 0 177 62 0 0 238 0 0 -353 -353 -115
5 0 177 62 0 0 238 0 0 -353 -353 -115
6 0 177 62 0 0 238 0 0 -353 -353 -115
7 0 177 62 0 0 238 0 0 -353 -353 -115
8 0 177 62 0 0 238 0 0 -353 -353 -115
9 0 177 62 0 0 238 0 0 -353 -353 -115
10 0 177 62 0 0 238 0 0 -353 -353 -115
11 123 177 62 0 0 238 0 0 -353 -353 -115
12 0 177 62 0 0 238 0 0 -353 -353 -115
13 0 177 62 0 0 238 0 0 -353 -353 -115
14 0 177 62 0 0 238 0 0 -353 -353 -115
15 0 177 62 0 0 238 0 0 -353 -353 -115
16 0 177 62 0 0 238 0 0 -353 -353 -115
17 0 177 62 0 0 238 0 0 -353 -353 -115
18 0 177 62 0 0 238 0 0 -353 -353 -115
19 0 177 62 0 0 238 0 0 -353 -353 -115
20 0 177 62 0 0 238 0 0 -353 -353 -115
21 952 177 62 0 0 238 0 0 -353 -353 -115
22 0 177 62 0 0 238 0 0 -353 -353 -115
23 0 177 62 0 0 238 0 0 -353 -353 -115
24 0 177 62 0 0 238 0 0 -353 -353 -115
25 0 177 62 0 0 238 0 0 -353 -353 -115
26 0 177 62 0 0 238 0 0 -353 -353 -115
27 0 177 62 0 0 238 0 0 -353 -353 -115
28 0 177 62 0 0 238 0 0 -353 -353 -115
29 0 177 62 0 0 238 0 0 -353 -353 -115
30 0 177 62 0 0 238 0 0 -353 -353 -115
31 123 177 62 0 0 238 0 0 -353 -353 -115
32 0 177 62 0 0 238 0 0 -353 -353 -115
33 0 177 62 0 0 238 0 0 -353 -353 -115
34 0 177 62 0 0 238 0 0 -353 -353 -115
35 0 177 62 0 0 238 0 0 -353 -353 -115
36 0 177 62 0 0 238 0 0 -353 -353 -115
37 0 177 62 0 0 238 0 0 -353 -353 -115
38 0 177 62 0 0 238 0 0 -353 -353 -115
39 0 177 62 0 0 238 0 0 -353 -353 -115
40 0 177 62 0 0 238 0 0 -353 -353 -115
Capex - Maintenance
Annual Opex Change
Annual Avoided Costs
Annual Customer WtP
Capex
WACC
STPR
Planning Horizon (Years)
Financial Costs and Benefits Economic Costs and Benefits
Results Summary
16/09/2014
DISCOUNT RATES
Overall NPV
Financial only NPV
Benefit/Cost Ratio
Capex - Construction
Billingshurst
SB 2714
Costs (£000's in Base Year Prices)
Capex spend in year 1. Matches the capex shown in Appendix 4 of the June 2014 submission.
Capex is converted into an annualised value based on a WACC of 3.7%
Capex spend in subsequent years for capital maintenance work (using the capex spend in year 1 as the main reference):- M&E Equipment Work = 20 yr life- ICA & Telemetry = 10 yr life- Civils works = 60 yr life
Each scheme has their own specific capex split between M&E, ICA, and Civil work.
So, for example, Billingshurst has a split of 69% civils, 27% M&E, and 4% ICA&T. These costs appear at the correct life intervals to ensure whole life costs remain accurate.
Opex arising from capex figures come from Appendix 4 of the June 2014 submission.
Customer Willingness to Pay (WtP) value taken from SW research information. We use scheme allocated river length data and the customer WtP value (£19.73K per km of river improved) to work out the annual WtP benefit amount.
40 year horizon discounted using standard STPR values
Overall NPV is worked out by adding the Financial Costs and Benefits Total with the Economic Costs and Benefits Total.
As a net cost, a negative result means this is a customer backed cost beneficial scheme.
Summary of the key inputs, outputs, costs, and benefits.
Direct financial costs and benefits, discounted using the WACC value of 3.7%.
17

Annex 4 Map of Catchment Areas
18