Embed Size (px)
Citation preview
F:\Projects\2013\20133007 - Exide Vernon Interim Status (Post BR)\Sec Files\Reports\Off-Site Soil Sampling\Revised\Response to comments Off-Site Soil Sampling Report.docx
March 21, 2014 2013-3007-01 Mr. Peter Ruttan California Department of Toxic Substances Control (DTSC) 8800 Cal Center Drive Sacramento, CA 95826-3200 RE: Response to March 10, 2014 Comments Off-Site Soil Sampling Report Exide Technologies Vernon, California Dear Mr. Ruttan: Advanced GeoServices, on behalf of Exide Technologies (Exide), submits these two work plans as directed by DTSC in its March 10, 2014 letter to Exide. The first work plan calls for additional soil sampling in the Northern and Southern Assessment Areas along with sampling and research intended to provide information related to source attribution. The second work plan addresses Interim Measures to be taken in the Assessment Areas. In addition, this letter provides responses to DTSC’s comments on the February 18, 2014 Off-Site Soil Sampling Report prepared by Advanced GeoServices. The Off-Site Soil Sampling Report will be revised to incorporate these responses and the results of the proposed soil sampling and data evaluation after completion of the proposed sampling and source attribution exercise. During your review of these work plans, our responses to the DTSC comments on the Off-Site Soil Sampling Report and data generated as part of the off-site investigations, it is important to remember several critical factors:
This project represents the first application of the 2010 residential soil CHHSL for lead on a major investigation in a heavily industrialized area.
With a lower screening value such as 80 mg/kg for soil lead, the effects from localized sources become more significant (i.e. alternate sources contributing 50 or 100 mg/kg at a screening level of 400 mg/kg typically did not tip a background level over the screening level, but that same contribution from an alternate source easily results in exceedance of an 80 mg/kg screening level). For this study area, the likelihood for alternate sources is very high, even probable, given the heavily industrialized nature of the area, proximity to highways, age of housing stock, and documented presence of at least four other lead smelters, over several dozen brass foundries and numerous other facilities handling metals.
Mr. Peter Ruttan 2013-3007-01 March 21, 2014 Page 2 of 20
f:\projects\2013\20133007 - exide vernon interim status (post br)\sec files\reports\off-site soil sampling\revised\response to comments off-site soil sampling report.docx
Lead strongly adheres to soil particles and is not easily removed. This means that the concentrations observed during soil sampling represent an accumulation over the past 100 +/- years or at least since the last time the area being sampled was significantly disturbed, possibly when the house was built. In addition, we know that lead emissions throughout the LA basin have declined significantly over the past 40 years suggesting that the majority of the lead observed in sampling was contributed many decades ago.
To the extent lead in soil may be attributable to the Exide facility, the contribution is more a reflection of historic operations versus current/recent contributions.
For your convenience, your comment is provided in bold followed by our response. TECHNICAL REVIEW FROM GEOLOGICAL SERVICES UNIT General Comments Comment 1: Exide's Report seems to attribute much of the lead detected in the residential
areas to lead-based-paint (LBP) and to a lesser degree on lead from leaded gasoline. In fact, very little discussion focuses on stack emissions from the Facility, or what contributions to lead in residential soil have occurred from Exide. Given the overall nature of the urban environment for the Greater Los Angeles (GLA) area, the GSU never expected Exide to be the only source of lead to the Northern and Southern Assessment Areas (or, for the purposes of this memorandum; MEIRs). However, the results of our evaluation of their data do suggest that Exide is a major contributor. Our opinion is based on the following factors:
The sampling protocol appeared to have been consistently
followed between the Background Area (BA) and the two MEIRs.
The sampling protocol was specifically designed to be sensitive to avoiding soils that could be tainted by LBP (i.e., five-feet away from housing drip-lines, entry-ways, and paved surfaces to the extent practicable).
In general, lead concentrations are significantly greater in the two MEIRs than in the BA.
In nearly all instances, lead detections exceeded the soil screening level for lead (80 mg/kg) at the two MEIRs. In one residence in the Northern MEIR, lead was detected at a maximum concentration of 2,030 mg/kg. Note: as stated

Mr. Peter Ruttan 2013-3007-01 March 21, 2014 Page 3 of 20
f:\projects\2013\20133007 - exide vernon interim status (post br)\sec files\reports\off-site soil sampling\revised\response to comments off-site soil sampling report.docx
above, Exide re-analyzed this sample and re-reported this sample at a much lower concentration. However, Exide has failed to adequately rationalize in the Report why the initial sampling effort is not representative.
For the MEIRs, the average lead concentration was 187 mg/kg for soil samples that were sieved. For unsieved samples, the average lead concentration was lower at 168 mg/kg. By comparison, the average lead concentration in the BA was 82 mg/kg for sieved samples, and slightly lower at 80 mg/kg for unsieved samples.
Leaded gasoline (tetraethyl lead or TEL) was banned in early 1996 by the U.S.EPA. The use of TEL was being steadily phased out well before then and was already banned for sale in California by January 1, 1994 by the California Air Resources Board. Therefore, it is highly unlikely that lead impacts from TEL, particularly in surface and near-surface soil, would still show significant impacts after more than two decades. Regardless, we would consider any residual TEL to already be part of the urban lead footprint or background lead.
The Relative Percent Differences (RPD) for the average lead value between
the BA and the MEIRs is also significant for samples that were sieved. The RPD for the BA was calculated at 2.5 while the RPD for the MEIRs was 10.7. The higher RPD at the MEIRs suggests that a larger proportion of lead occurs in the finer fraction (i.e., the fraction that passes through a No. 60 sieve) in soil samples collected from the MEIRs than in the BA.
Furthermore, comparing the sieved to the unsieved samples using linear
regression analysis and adding a 'best-fit' line to data points plotted on an x,y graph, the r-squared value for the slope-intercept line was 0.54 for the MEIR samples verses an r-squared of 0.98 for the BA samples. The difference in r-squared results show a poor correlation between the MEIR sieved verses unsieved lead results while the BA results clearly show excellent correlation between the two data sets. This provides another line of evidence that the MEIRs are significantly more contaminated by fine lead than in the BA.
The data also seems to suggest that a greater proportion of fine lead dust
occurs in the upper inch of soil. This can be seen at composite soil sample 'SS-MEIR'N-04-1' where the sieved lead result was 338 mg/kg and the unsieved result was only 164 mg/kg. The %RPD between these two values is
Mr. Peter Ruttan 2013-3007-01 March 21, 2014 Page 4 of 20
f:\projects\2013\20133007 - exide vernon interim status (post br)\sec files\reports\off-site soil sampling\revised\response to comments off-site soil sampling report.docx
69 percent. In contrast, the next lower sample interval (1-3 inches) reported a higher lead result in the unsieved sample (330 mg/kg) than in the sieved sample (243 mg/kg) with a %RPD of 30 percent.
The data shows greater difference between the Northern MEIR sieved verses
unsieved lead results and the Southern MEIR. In the Southern MEIR, the highest %RPD is 24 ('SS-MEIR-S-13-3') whereas, as already mentioned above, the highest %RPD for the Northern MEIR (and for the study in general) was 69 percent ('SS-MEIR-N-04-1'). This suggests that a greater proportion of lead dust occurs to the north of the Facility than to the south. This is not unexpected since the predominant wind direction for most of the GLA area is from the southwest (SW) to the northeast (NE). The data also suggests that a significant contribution of fine lead dust being deposited on the MEIR soil is relatively recent and likely ongoing. However, these are preliminary findings only and additional data will be needed before a more definitive assessment can be made. Exide is free to utilize various lead-fingerprinting techniques to help determine if the lead came from sources other than stack emissions (e.g., LBP, TEL). Without this kind of level of effort, we cannot agree that the lead is not coming from Exide.
Response: We appreciate DTSC's acknowledgement that the Exide facility is not the only
source of lead in the area; however, we believe DTSC incorrectly states that Exide is a "major contributor to lead in soil" and we are certain that ongoing historical research and the results of proposed sampling will demonstrate that Exide's contributions are minor and that multiple other sources have combined to create soil lead concentrations above the current residential soil screening levels. We also offer the following specific responses to arguments raised by DTSC in this comment.
The evaluation by DTSC of the relative percent differences (RPD) and
correlations between select sieved and unsieved sample results is incomplete. The full data sets need to be compared, not selected results, in order to draw conclusions. Comparing all of the RPDs for the each data set in the background area and the Northern and Southern Assessment Areas using hypothesis testing demonstrates that there is not a statistically significant difference between the background area and either of the Northern or Southern Assessment areas at a 95% confidence level. In addition, hypothesis testing shows that there is not a statistically significant difference in RPDs between the Northern and Southern areas at a 95% confidence level, nor is there a statistically significant difference between the RPDs in the 0-1” and 1-3” depth interval sample results. This
Mr. Peter Ruttan 2013-3007-01 March 21, 2014 Page 5 of 20
f:\projects\2013\20133007 - exide vernon interim status (post br)\sec files\reports\off-site soil sampling\revised\response to comments off-site soil sampling report.docx
evaluation shows that attempting to draw conclusions for source attribution based on differences in RPDs in the three areas is not supportable by the data.
We disagree with the conclusion that the correlation between the sieved and unsieved sample results in the Assessment Areas is poor. The attached figure shows separate correlations for each of the background and two assessment areas. The background area shows that the sieved results are about 96% of the unsieved results with an R2 of 0.92, meaning that the majority of the lead is in the larger particles. Both the Northern and the Southern Assessment Areas show that the sieved results are about 7% higher than the unsieved with an R2 for the Southern Area of 0.91 and 0.74 for the Northern Area. Both indicate a good fit for the correlation. The correlation does indicate that the Assessment Areas have slightly more lead in the fines or smaller particles than the Background Area. The statement that it is highly unlikely that lead impacts from tetra-ethyl lead in surface and near surface soils would still be distinguishable more than two decades after it was banned is not supported in the literature. A 2010 paper in the journal Environmental Research titled “Spatial analysis of bioavailable soil lead concentrations in Los Angeles, CA” concludes “Total and bioavailable Pb concentrations near freeways and major arterials were significantly higher than those collected elsewhere.” Other studies have drawn similar conclusions. DTSC does not provide support for its statement that the data suggest that there is a significant contribution of fine lead dust being deposited on the MEIR soil is relatively recent and likely ongoing. We do not see anything in the data that would provide a basis for that conclusion. In fact, the dust data obtained by ENVIRON show that ongoing contributions to soil lead are very small. Two of the lead in dust measurements taken by ENVIRON in the first phase of step-out dust sampling at the 4500-foot ring fall within the Assessment Areas: sample SWK-40A and B is located within the Northern Area and sample SWK-32A and B is within the Southern. Assuming that the same dust fell on a residential property and all of the lead measured in the dust remained in the uppermost 1-inch of soil, the increase in the soil lead concentration would be on the order of 0.01 to 0.04 mg/kg, a minuscule change in the soil lead concentrations. This low of a concentration is below the reporting limit for soil lead by the laboratory.
Comment 2: In their Report, Exide appears to discount the background data by
attributing much of the lead detected in the soil in the MEIRs to LBP. Exide selected the Background Area (BA) on the basis of, as described in Section 2.4 ('Define the Study Boundaries') of the approved Work Plan, "proximity to major freeways, a historically industrial area absent the Exide Facility or
Mr. Peter Ruttan 2013-3007-01 March 21, 2014 Page 6 of 20
f:\projects\2013\20133007 - exide vernon interim status (post br)\sec files\reports\off-site soil sampling\revised\response to comments off-site soil sampling report.docx
other secondary lead smelter, and a sizable rail yard with intermodal facility and switching yard. The housing stock is similar in age, size and density to the assessment areas and was constructed on areas that were previously farmland".
Despite following the same sampling protocol for both the BA and the
MEIRs, (i.e., staying away from drip-lines, downspouts, entry-ways, paved surfaces, etc.), Exide states that the LBP content in the soil is likely higher in the MEIRs than it is for the BA due to the difference in the median age of the houses. We believe that this evaluation should be made on a case-by-case (i.e., house-by-house) basis, and not by using the median age. Our reasons for this are as follows:
Not all houses in the BA were built after World War II
(WWII). In fact, the oldest residence in the BA was built in 1929, and the highest lead detected there was only 64 mg/kg ('SS-BG-06-6'). In contrast, the most recent house in the two MEIRs is dated 1991 (Northern MEIR), or more than a decade after the U.S. Consumer Product Safety Commission (USCPSC) banned the use of LBP for residences (1978). The highest lead detected there was 109 mg/kg ('SS-MEIR-N-15-6'). Given the remote possibility that LBP was used at this property, we believe that most of the lead detected here came from lead dust particulate.
Unfortunately, neither of the above-mentioned samples was
sieved to determine the concentration of the fine lead fraction. However, composite sample 'SS-MEIR-N-09-1' was collected from a post-WWII residence (built in 1951) and sieved. The sieve lead result was 202 mg/kg and the unsieved result was 163 mg/kg, with a %RPD of 21 percent. For the BA, 'SS-BG-08-1' was collected from a residence built in 1938 and this sample was also sieved. The sieved lead result was 136 mg/kg and the unsieved lead result was 132 mg/kg. The RPD between these two results is approximately 3 percent. These results suggest that there's very little difference between the lead concentrations in the sieved sample verses the unsieved at this background location with a pre-WWII-constructed house.
Mr. Peter Ruttan 2013-3007-01 March 21, 2014 Page 7 of 20
f:\projects\2013\20133007 - exide vernon interim status (post br)\sec files\reports\off-site soil sampling\revised\response to comments off-site soil sampling report.docx
The data also shows that the MEIR sample has a significantly greater amount of fine lead particulate, which, given the sample depth (0-1 inch), was probably recently deposited, and is more likely related to fallout from stack emissions from Exide than it is from LBP or TEL.
The highest detection of lead in the BA was 195 mg/kg ('SS-
BG-08-3') at a residence with a house built in 1929. In contrast, the highest lead detected in the two MEIRs was 2,030 mg/kg ('SS-MEIR-N-14-6') at a residence with a house that was built in 1922, or not much older than the background house with the highest lead result.
In conclusion, comparing the sieved to unsieved sample results seem to lend
further credence that the area selected to represent background for Exide was appropriate. It also suggests that there is little evidence in this case to support Exide's argument regarding using the median age of the housing as a basis for attributing the presence of lead detected in soil in the MEIRs to LBP.
Response: As discussed previously, the data do not support using RPDs to draw distinctions
between the different sampling areas. Further, when any individual RPD is discussed, it needs to also be considered in light of the RPDs for the duplicate samples that were taken. These RPDs range from 4.4 to 47.6% and provide an indication of the variability in the results that can be expected in an individual sample. A RPD of 20% as discussed in the comment may be attributable to variability in the sample results; no meaningful conclusion can be drawn from the RPD of a single sample unless it is much larger than the RPDs observed in the duplicate samples. It is problematic overall to draw conclusions regarding source attribution on an individual property basis since little to nothing is known about what a property owner has done to the house and yard. New topsoil could have been placed on a property with an older house in order to improve grass cover which would also have the effect of lowering the soil lead concentrations. Conversely, improvement projects on relatively newer homes can result in increased soil lead concentrations when items such as painted window frames that were removed from the house are staged on the ground surface and left exposed to the elements. Trend analysis using sets of data is required to draw conclusions similar to what was done in the report. The comparison of median soil lead concentrations to median year of home construction in the three sample areas is a

Mr. Peter Ruttan 2013-3007-01 March 21, 2014 Page 8 of 20
f:\projects\2013\20133007 - exide vernon interim status (post br)\sec files\reports\off-site soil sampling\revised\response to comments off-site soil sampling report.docx
valid comparison to make. It does not imply that every property will be illustrative of the trend but overall, the comparison and conclusion remain valid.
Comment 3: According to Section 2.2, 'Identify the Decision' in Exide's Work Plan, "If the
comparison shows that detected COPCs in soil exceed background and the applicable RSL or LAUSD arsenic soil screening level, and are consistent with emissions from the Exide Vernon facility, then the next phase of sampling will be conducted as defined in an amendment to this Work Plan to determine the lateral extent of impact. If the comparison shows that the constituents in the soil are below background or the applicable RSL or LAUSD arsenic soil screening level, then no further sampling is required". since the data clearly shows lead above the 80 mg/kg background/SL, and, as discussed in the above comment, appears to be generally consistent with stack emissions from the Facility, then it stands to reason that the next step would be for Exide to proceed with the next phase of sampling. Therefore, we request that Exide submit a Work Plan amendment to the department that addresses this next phase.
Response: A work plan to perform additional sampling is attached to this letter. Comment 4: In addition to the individual property sketches (already included in
Appendix B), Exide should include, for each MEIR and the BA, new figures that more clearly show the sampled areas. These figures should show, at a minimum, the major streets, the sample locations, the sample location identifications, and boxes presenting the analytical results (presenting lead concentrations only is acceptable) detected in the soil samples for each sample depth interval.
Response: Street names were intentionally excluded from the property sketches to protect
owner privacy. The additional information requested can be provided on the sketches for the additional sampling; since the samples were composited, subsample locations were not numbered and there is no data to present at the subsample locations.
Comment 5: The Report is missing a section that discusses quality analysis/quality control
(QA/QC) procedures that were followed. The Report only states (Section 5.0, 'Sampling Results and Data Evaluation') that they performed a Level I review and data validation, but did not provide any detail on the data review. Report is also missing a discussion on how the project DQOs listed in the Work Plan were met.

Mr. Peter Ruttan 2013-3007-01 March 21, 2014 Page 9 of 20
f:\projects\2013\20133007 - exide vernon interim status (post br)\sec files\reports\off-site soil sampling\revised\response to comments off-site soil sampling report.docx
Response: The procedures specified in Section 2, Data Quality Objectives, in the Work Plan were followed and the resulting data presented in the report. The data were validated as per the Work Plan, and the validation reports that provide the detail of the data review were presented in Appendix C along with the laboratory data packages. The Work Plan Addendum attached to this letter presents a refinement of the sampling design based on the review of the initial results in satisfaction of Section 2.7 of the Work Plan.
Comment 6: The Report should also discuss any deviations from the Work Plan. For
instance, Figure 5 in the Work Plan, titled 'Northern School Sample Locations', shows six proposed sample locations while the Report shows only four. Figure 6 in the Work Plan, titled 'Southern School Sample Locations', shows a different distribution of proposed soil sample locations on the property than is shown in the Report. The Work Plan also states that five subsamples will be collected at each school (Section 3.0, 'Sample Location and Frequency', page 3-1) when only four samples were composited at the Northern School ('Volunteers of America, Salazar park Head Start Pre-School'). We request that Exide provide supporting documentation indicating prior concurrence from DTSC for these apparent deviations from the Work Plan in the revised Report.
Response: Five subsamples were collected at each school as stated in the Work Plan. The
preliminary locations shown in the Work Plan were selected from aerial photographs. The actual locations sampled were biased towards areas where children congregate and play and where soil was present as opposed to mulch. DTSC was notified of the school sampling prior to it taking place but was not able to provide personnel to participate in the sampling.
Specific Comments Comment 1: Section 1, Introduction, Page 1: The date for the approved Work Plan
appears to be a typographical error. The actual date of the approved plan is November 15, 2013, not November 13.
Response: Agreed – the date of the approved Work Plan was November 15, 2013.
Comment 2: Section 5.2.1, Inorganic Constituents, Page 5-5: Exide states only that, for
hexavalent chromium, all results "were below the detection limit". The SL for hexavalent chromium is 0.29 mg/kg. To be clear, Exide should identify the laboratory detection limit in the text and/or table or state in the text that

Mr. Peter Ruttan 2013-3007-01 March 21, 2014 Page 10 of 20
f:\projects\2013\20133007 - exide vernon interim status (post br)\sec files\reports\off-site soil sampling\revised\response to comments off-site soil sampling report.docx
all hexavalent chromium results were below the 0.29 mg/kg SL in the revised Report.
Response: The reporting limit for the hexavalent chromium results was 2 mg/kg; the
laboratory reported that the reporting limit was elevated due to matrix interference. Subsequent to the report submission, the laboratory evaluated the results relative to the method detection limit of 0.150 mg/kg. The results were below the method detection limit and thus below the residential soil screening value of 0.29 mg/kg. The revised laboratory reports and comparison to the method detection limit will be included in the revised report.
Comment 3: Section 6.0, Conclusions, Pages 6-1 to 6-5: We have several comments on this
section of the Report. These are as follows: Item No 3, Page 6-1: Exide states that no lead in the top one-inch
exceeded the California Department of Public Health (CDPH) "hazard level for bare soils where children play of 400 mg/kg". As a result, Exide states, there is "no need for immediate action based on the observed results". GSU defers to the project toxicologist as far as the cleanup level, and if immediate action, are warranted. However, we still recommend that additional investigations occur to determine the lateral and vertical extent of lead in soil above the SL.
Response: The Work Plan attached to this letter spells out the scope of the additional
investigation.
Item No. 5, Page 6-2: We disagree with Exide's rejection of the 2,030 mg/kg lead result, which they refer to as 'anomalous'. An outlier, certainly, but Exide provides no reason why this result is not representative of 3-6 inch depth soil conditions at this property. There were no issues reported by the analytical laboratory with this sample result. In our experience, it is not uncommon, given the general heterogeneous nature of inorganics in soil, to produce widely-varied results from the same sample interval. Therefore, we recommend that this result be included in the data evaluation. As stated earlier in this memorandum, we also recommend that lead in soil at the residence where this detection occurred be immediately mitigated so it no longer poses a human-health hazard.
Mr. Peter Ruttan 2013-3007-01 March 21, 2014 Page 11 of 20
f:\projects\2013\20133007 - exide vernon interim status (post br)\sec files\reports\off-site soil sampling\revised\response to comments off-site soil sampling report.docx
Response: The results for this sample location were tested using four different statistical tests for outliers (Dixon test, Grubbs univariate MD based outlier test, univariate Biweight outlier analysis and the modified Z score), and all four tests concluded that the 2030 mg/kg result is an outlier. Consequently, it should not be used in data analysis.
Item No 6, Pages 6-2 to 6-3: As previously noted, GSU disagrees with
Exide's use of median home age as an indicator of the source of lead in soils. In addition, Exide's statement that the Northern MEIR has "more heavily trafficked secondary roads" is confusing since they do not state what areas are being comparing to the Northern MEIR. This also appears to be purely speculative since they do not support this statement with data.
Item No. 7, Page 6-3 (1st and 2nd Bullets): As previously noted in the above comment (please see General Comment No. 2, above), when comparing the BA sample data to the MEIRs, lead does appear to accumulate in the finer fraction or the fraction that passes through a No. 60 sieve. The data also suggests that fine lead particles are more prevalent in the surface (0-1 inch) than at deeper sample intervals. We recommend that Item No. 7 be revised as a result.
Response: See previous response on the comparison of soil lead results to the year of house construction. With respect to the relative traffic volume, the report presented the observations of the sampling crew during the period of time they were present in each sampling area. The report language will be clarified. As previously discussed in response to General Comment #1, hypothesis testing of the data do not support the conclusion that more fine lead particles are present in the 0 to 1” depth interval samples than in the 1 to 3” depth interval samples.
Item No. 7, Page 6-3 (3rd Bullet): We disagree with Exide's
conclusion that there is no discernable pattern to the data. Instead, our evaluation of the data shows that lead concentrations do decrease with distance from the Facility. As presented on Figure 6 ('Relationship between Surface soil lead and Distance from the Facility') in the Report, the Northern MEIR, located between 3,500 and 4,000 feet north of the Exide Facility, reported several detections of surficial lead significantly greater (up to 342 mg/kg) than reported for the Southern MEIR (no detections greater than 174 mg/kg), located between 3,500 and 4,500 feet to the south. The Northern

Mr. Peter Ruttan 2013-3007-01 March 21, 2014 Page 12 of 20
f:\projects\2013\20133007 - exide vernon interim status (post br)\sec files\reports\off-site soil sampling\revised\response to comments off-site soil sampling report.docx
MEIR reported a median lead concentration of 162 mg/kg. The Northern School, located approximately 6,400 feet to the north, reported lead less than 100 mg/kg. The Southern MEIR reported median lead level at 134 mg/kg. The Southern School, San Antonio Elementary School, located 9,500 feet south-southwest, reported lead less than 80 mg/kg.
Taking into account the spread in distances of four sample areas
relative to the Facility, the prevailing wind direction (SW-NE), and the soil sample results for lead collected during the prior off-site dust and soil investigation (ongoing) from several sample points strung out between the Facility and the MEIRs, the data does show decreasing concentrations overall with distance from Exide.
Response: Both the northern and southern school locations are highly disturbed due to
construction on the properties and should not be used for comparison to the residential results in an evaluation of lead concentrations versus distance. The presence of PCBs and PAHs in the northern school sample in particular shows indication of fill or other sources impacting the soil quality that would preclude the use of this result in such an evaluation. The additional sampling proposed in the attached work plan will assist in further evaluation of the relationship between residential soil lead concentrations and distance from the Exide facility.
To conclude, we disagree with Exide's request to postpone addition
residential soil sampling until the step-out sampling and risk assessment calculations are completed. Exide's statement that there is no "clear relationship between the observed soil concentrations and the facility" is unsupported by the data. The residential areas north and south of the Facility have not been adequately characterized for lead above the SL. Therefore, the current data set is insufficient and does not satisfy the project DQOs. Until additional sampling occurs, GSU considers the completion of a risk assessment to be premature. Instead, we believe that Exide should proceed with the next step; which, as shown on Exide's 'Decision Tree for Evaluation of MEIR Data' (Figure 4 of the Work Plan), is to prepare an amendment to the Work Plan for additional work.
Response: The work plan for further sampling is attached to this letter.
Mr. Peter Ruttan 2013-3007-01 March 21, 2014 Page 13 of 20
f:\projects\2013\20133007 - exide vernon interim status (post br)\sec files\reports\off-site soil sampling\revised\response to comments off-site soil sampling report.docx
Comment 4: Table 10, Sieved and Unsieved Samples Soil Lead Results: Rather than lumping data sets from the BA study with the MEIRs into one table and the calculating one set of average and median concentrations for lead, GSU recommends separating these two data sets and determining individual averages and median values for the BA and the two MEIRs. Likewise, Figure 4 of the Report, 'Sieved vs. Unsieved Sample Lead Concentrations', should probably be split into two figures showing the distribution of each individual data set.
Response: A revised Table 10 is attached and will be added to the report. Figure 4 has been
modified to show the correlations between the sieved and unsieved results for each area.
Human and Ecological Risk Office Comments from the Review of an Off-Site Soil Sampling Report The following comments by the Human and Ecological Risk Office of DTSC were provided in separate correspondence on March 6, 2014. General Comments Comment 1: Comparison of soil lead concentrations to screening levels: We do not concur
with the approach used to evaluate soil lead concentrations found on the residential properties. The report states that the 80 mg/kg value (derived by California EPA's Office of Environmental Hazard Health Assessment (OEHHA) is strictly a screening number for lead in soils and went on to compare lead levels found on the sampled residential properties to California Department of Public Health (CDPH) hazard levels of 400 mg/kg for play areas and 1000 mg/kg for non-play areas, to determine if people on these properties are being exposed to unacceptable levels of lead. The two screening values (80 mg/kg vs. 400 mg/kg) for lead were derived using different end points. The 400 mg/kg value is USEPA's residential screening level for lead and is based on a "threshold" predicted blood level of 10 ug/dl, where it is assumed that when children are exposed to this level of lead in the environment, there is a less than 5% probability that the blood lead levels of those children will exceed 10 ug/dl. USEPA used the Integrated Exposure Uptake Biokinetic (IEUBK) model to derive their screening value. This is based on observations that children may experience adverse neurological effects (decreased cognitive ability), when blood lead levels exceed 10 ug/dl. On the other hand, the 80 mg/kg level was developed (by OEHHA) using

Mr. Peter Ruttan 2013-3007-01 March 21, 2014 Page 14 of 20
f:\projects\2013\20133007 - exide vernon interim status (post br)\sec files\reports\off-site soil sampling\revised\response to comments off-site soil sampling report.docx
leadspread (a biokinetic model similar to IEUBK) where a "benchmark change" in blood lead level of 1 ug/dl is expected to occur when children are exposed to this level of lead in soils/dust in a residential setting. In 2009, OEHHA published this value based on more recent studies showing that children are affected by exposures to lead at lower levels than were previously believed. The Center for Disease Control and Prevention has recently revised the blood lead level that would require notification (to parents, doctors, public health officials), from 10 ug/dl to 5 ug/dl.
Response: The California Department of Public Health website states “The table below
shows the hazard levels of lead in paint, soil and dust, as determined by the California Department of Public Health (CDPH) (emphasis added). The U.S. Environmental Protection Agency (EPA) and U.S. Department of Housing and Urban Development (HUD) may have different hazard level definitions.” http://www.cdph.ca.gov/programs/CLPPB/Pages/LRCHomeLeadTest.aspx. The table presents 400 mg/kg as the hazard level in bare soils where children play. Since this is the stated position and conclusion of the California Department of Public Health, the comparison in the report is valid. We also note that the EPA Region 9 screening level is still 400 mg/kg in tables dated November 2013.
Comment 2: Maximum Exposed Individual Resident: The January 2013 AB2588 HRA
report approved by SCAQMD mentions only one MEIR area, which is clearly shown in Figure ES-1. That reports does not mention one MEIR to the north of the facility and another MEIR located to the south of the facility, as described in the current report. MEIR, by definition, can only be in one location. Communications with SCAQMD's Pierre Sycip indicated that the AB2588 HRA was performed to determine the cumulative risks and hazard for all contaminants emitted from the facility, where arsenic was the risk driver. Separate air dispersion modeling was not performed for arsenic and lead. Furthermore, Mr. Sycip commented that "it does not make sense" that maximum concentrations of arsenic and lead would be in opposite directions. DTSC requested sampling of the closest residential areas located north and south of the facility, to determine if emissions from the facilities have impacted these communities. The report should be modified to remove verbiage on the southern MEIR area. Alternatively, include a letter from SCAQMD approving basis for the southern MEIR area.
Response: The January 2013 AB2588 HRA indeed designates a single Maximum Exposed
Individual Resident (MEIR) for cumulative cancer risk from all carcinogens, which is marked on Figure ES-1 of the HRA report. The modeling performed for
Mr. Peter Ruttan 2013-3007-01 March 21, 2014 Page 15 of 20
f:\projects\2013\20133007 - exide vernon interim status (post br)\sec files\reports\off-site soil sampling\revised\response to comments off-site soil sampling report.docx
that HRA, however, did produce the data necessary for identifying the MEIR for arsenic or lead. It turns out that they are not in the same location and that is not surprising. By far the largest emission source of arsenic from the facility, based on the 2010 and 2012 emission data used in generating the January 2013 AB2588 HRA, is the Hard Lead stack. Thus, the dispersion patterns and characteristics of that single stack dominate the modeling results and ambient concentration predictions for arsenic. Lead is, however, emitted from several stacks at the facility with no one stack dominating the emissions. These stacks vary in height, release temperature, and relationships to facility buildings and orientation. Accordingly, and not surprisingly, the predicted MEIR for lead is in a different location than the MEIR for arsenic. As shown on Figure 1 of the approved Work Plan, the Northern and Southern Assessment Areas were selected based on the MEIR for lead and arsenic. They are also the closest residential areas north and south of the facility in the downwind direction so they satisfy DTSC’s request.
Comment 3: Surface soils: USEPA recognizes soils located at 0 to 6 inches below ground
surface, as surface soils. The report is differentiating between results of soil samples collected from 0-1 inches and those collected from deeper depths. The purpose of collecting surface soil samples in three different increments is to determine if contaminants have been leaching to deeper depths and to what extent. It can also be potentially used to evaluate differential lead deposition from past activities and legacy lead contamination.
Response: Comment noted. No response or revision to the report is required. Comment 4: Exposure unit: We recommend that each residential property be evaluated
separately, since each house represents a separate exposure unit. The composite soil samples taken from each property provides an estimate of the average concentration of lead in soils and can be used to evaluate effects to people residing in those houses. The report calculated median values for each of the two residential areas and compared these median values to the screening levels. Area-wide statistical comparisons are not appropriate for evaluating effects of contaminated soils to residents on the individual properties.
Response: The comparisons between the areas in the report were made consistent with the
approved Work Plan. In addition, use of average concentrations over an area is appropriate when evaluating potential impacts from air deposition since they would not be expected to vary greatly from location to location. The type of

Mr. Peter Ruttan 2013-3007-01 March 21, 2014 Page 16 of 20
f:\projects\2013\20133007 - exide vernon interim status (post br)\sec files\reports\off-site soil sampling\revised\response to comments off-site soil sampling report.docx
evaluation on a property specific basis described in the comment is more appropriate as a follow-up evaluation in conjunction with the results of the risk assessment.
Comment 5: Source of lead in soils at residential properties: According to Exide, other
sources of lead such as the historic use of leaded paint and gasoline are contributing factors to lead found in soils on the residential lots. While it is true that there are other sources of lead in the environment, various precautions were taken to minimize interference from these sources. For example, following USEPA's recommendations, soil samples were taken at least two feet away from roads and five feet away from structures, so as to avoid potentially sampling for lead from roadways (remnants of leaded gasoline) and lead-based paint on the structures. A "background" area, which is located in an urban area with a similar housing stock, proximity to freeways, railways and industrial area, was specifically chosen to address these anthropogenic sources of lead. A review of the lead data indicates that a majority of the houses in the "background" area have concentrations of lead below 80 mg/kg (with the exception of five houses). In contrast, only one house in each of the assessment areas (northern and southern) had lead concentration below 80 mg/kg. The average concentration of lead in the background area for the 0-1 inch depth is 63 mg/kg vs. 175 mg/kg (Northern assessment area) and 131 mg/kg (Southern Assessment Area).
The fact that (a) lead concentrations in the two residential areas in the
vicinity of Exide are on average 2 to 3 times higher than lead concentrations in the "background" residential area, (b) the Exide facility is the only major secondary smelter in the neighborhood, and (c) concentrations of lead in soils and dust (collected up to 4,500 ft) from the facility is roughly inversely related to distance from the facility, suggests that facility may be a contributor to lead contamination in soils on these properties.
Response: The report concludes that the lead concentrations in the two Assessment Areas are
higher than in the background area. The discussion on the relationship to distance from the facility was confined to an evaluation of the residential soil data only and did not address the dust sampling. Those data are being evaluated as part of the step-out dust sampling being performed by ENVIRON, and the additional data being collected along transects from the facility will assist in the evaluation of lead concentrations with distance from the facility. Collection of additional residential soil data at greater distances from the facility along the transects as
Mr. Peter Ruttan 2013-3007-01 March 21, 2014 Page 17 of 20
f:\projects\2013\20133007 - exide vernon interim status (post br)\sec files\reports\off-site soil sampling\revised\response to comments off-site soil sampling report.docx
provided in the attached work plan will also provide further information on this subject.
It should be noted that while Exide may be the only secondary lead smelter currently operating in the vicinity of the Assessment Areas, there are numerous other metals related industries in the area with either current or historical operations. It is premature to conclude that Exide is the only industrial contributor to the observed lead concentrations.
Comment 6: Vertical extent of lead contamination: The fact that the uppermost surface
soils data (0-1 inch bgs) have similar concentrations of lead as the deeper surface soils samples (1 to 3 inches bgs; and 3 to 6 inches bgs) indicates that historic releases of lead (the facility has been operating as a smelter since 1922) have affected the surrounding areas, and that the contamination has traveled to depths just below the surface, either through mixing of soils over the decades, through leaching of the contaminants from the surface and/or through differential deposition of lead over the decades. According to Exide, soils collected from the topmost layer should have significantly higher concentrations of lead than the deeper surface soils.
Response: Studies at numerous smelter sites support the conclusion in the report that soils
affected by aerial deposition show elevated concentrations in the topmost layer, even for smelters that operated for longer periods of time and processed much larger quantities of lead than the one at the Exide facility. The primary lead smelter at Omaha, Nebraska, operated for over a century from the mid-1800’s, and the soil lead results there showed a 20% decrease in soil lead between samples taken over a 0 to 2” depth interval and those taken over a 0 to 8” depth interval, a trend which is not observed here. As stated in the comment #10 below, lead may become tightly bound in the soils; this binding of the lead to the organic matter in the topsoil limits its downward movement. The statements in the report remain valid.
Comment 7: Contamination in Northern vs. Southern assessment areas: The results of
the AB2588 HRA (the MEIR area located to the north of Exide) was used as a guide to identify areas that may be more heavily impacted by Exide's emissions, and to keep preliminary investigations to a manageable level. Emissions data collected from Exide in 2010 and 2012 were used conduct dispersion modeling and estimate risks/hazards to the surrounding community. It did not account for historic releases or impacts from the facility. Therefore, the results of the dispersion modeling and risk
Mr. Peter Ruttan 2013-3007-01 March 21, 2014 Page 18 of 20
f:\projects\2013\20133007 - exide vernon interim status (post br)\sec files\reports\off-site soil sampling\revised\response to comments off-site soil sampling report.docx
assessment of the most recent AB2588 HRA should not be used to evaluate the results of the soils/dust data, since those most likely reflect the fall out of contaminants (primarily lead) from facility, which has been operating as such for many decades. In the report, Exide states that "The air modeling would indicate that the lead concentrations in the Northern and Southern Assessment Area would also be about the same which is not observed in the data."
Response: While operations at the facility may have changed over time with varying level of
lead emissions, the wind patterns have not changed significantly to affect the distribution and pattern of the lead emissions. As stated previously, lead emissions came from many sources, not documented by the emissions from a single stack like the arsenic emissions. Review of the historic operations and the sources of lead emissions support the conclusion in the report that the lead impacts from the facility in the Northern and Southern Assessment areas can be expected to be of comparable magnitude.
Comment 8: Age of housing: The concentration of lead detected on the properties does
not always correlate well with the age of the house. Many of the older homes in the background and assessment areas had concentrations of lead at or below 80 mg/kg. For example, SS-BG-06-1 (1929), SS-BG-09-1 (1940), SS-BG-17-1 (1947), SS-MEIR-N-02-1 (1920) had lead concentration of 54.8 mg/kg, 81.1 mg/kg, 51.1 mg/kg, and 81.8 mg/kg. According to the report, the concentrations of lead in soils is related to the median age of the houses in the residential areas that were sampled, and therefore, leaded paint is the most likely source of higher concentrations in the Northern assessment area (median house age is 1923), followed by the Southern residential areas (median house age is 1937), compared to the background area (median house age is 1950).
Response: As discussed previously, actions taken by the property owner can affect the soil
lead concentrations at an individual property. Overall trends in the data should be considered, and the fact that certain individual properties do not fit the overall trend does not negate the conclusion. No revisions to the report are required.
Comment 9: Lateral extent of contamination: A review of the soil and dust data collected
around the facility (going 4,500 feet out, radially) indicates that the concentrations of lead are highest in areas closest to the facility (concentrations of lead are in the thousands of milligrams per kilogram of dust) and lower at distances further away from the facility (Step-out dust and
Mr. Peter Ruttan 2013-3007-01 March 21, 2014 Page 19 of 20
f:\projects\2013\20133007 - exide vernon interim status (post br)\sec files\reports\off-site soil sampling\revised\response to comments off-site soil sampling report.docx
soil sampling report, November 2013). The data does not support the statement that "There is no spatial relationship or pattern to the results that would tie them to the facility such as higher concentrations in samples closer to the facility."
Response: The conclusion in the report related to the residential soil lead concentrations, not
the dust sampling. The language in the report will be clarified. Comment 10: Lead in fine fraction of soils: The lead levels in the sieved fractions are
generally higher, than in the unsieved fractions (Table 10). However, it should be noted that the lead deposited onto surfaces many years ago may become tightly bound to soils and not necessarily be available for analysis in the finer fractions. In this situation, lead may not be concentrated at significantly higher level in the finer fractions of soils. The report states that "Lead did not concentrate significantly in the fine fraction passing the #60 sieve. This also is not typical of impacts from airborne emissions, which are comprised of very small particles".
Response: No response required. Comment 11: Arsenic vs. lead concentrations: We do not concur with the statements that
arsenic and lead should be present in similar amounts in soils. Dust and soil samples collected from areas immediately around Exide demonstrate that concentrations of lead are much higher (in the thousands of milligrams per kilogram of soil/dust), while arsenic concentrations are well below 100 mg/kg. For example, concentration of lead and arsenic in dust samples collected at SWK-08 are 2,700 mg/kg and 47 mg/kg, respectively. Concentrations of lead and arsenic in soil samples collected at 500 NE-5 (0-1 inch bgs) are 3,100 mg/kg and 19 mg/kg, respectively. Communications with SCAQMC reveal that arsenic is a relatively recent addition to the smelting process at the facility. As discussed above, the AB2588 HRA only evaluated emissions data collected from the facility in 2010 and 2012. It does not account for historic emissions of lead (from the facility), that have been occurring for decades.
Response: Arsenic is not a relatively recent addition to the smelting process at the facility as
stated in the comment. Arsenic has always been a component of the hard lead alloy that is used to make battery grids and posts. Consequently, it has always been part of the recycling process for used automotive batteries and thus the feed stock to the smelting furnaces. Dust samples that were taken close to the facility may well show contributions from multiple sources of lead while there are far
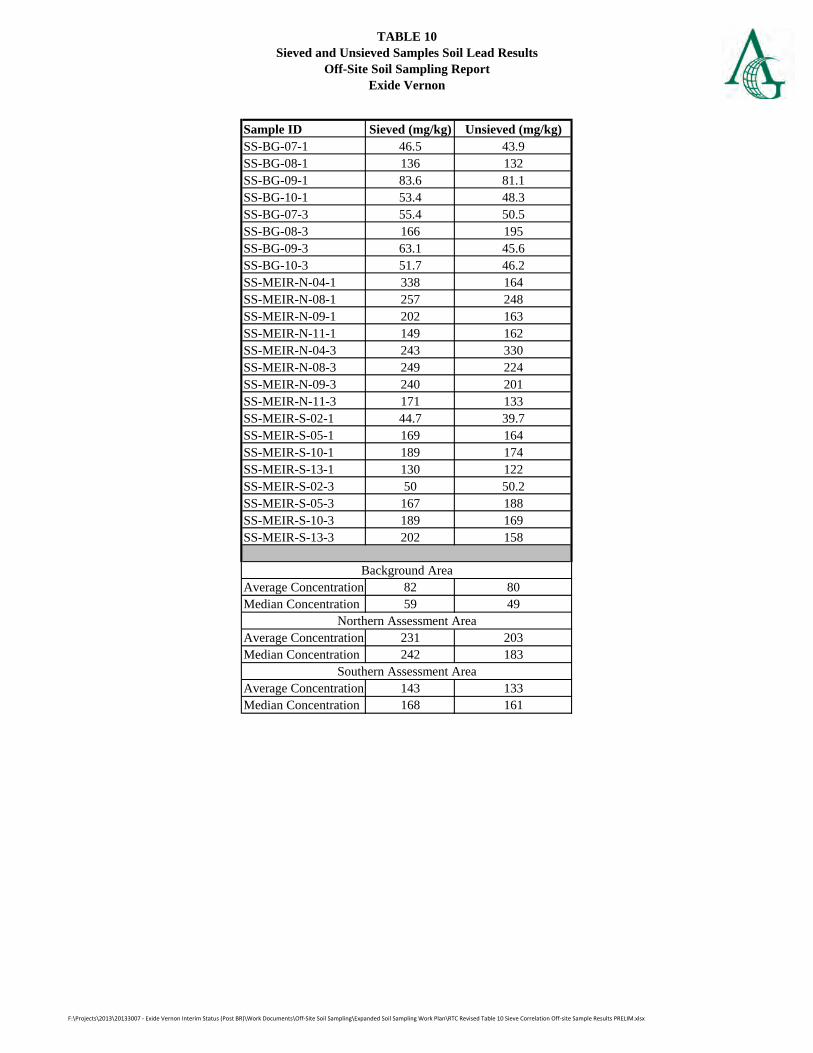
TABLE 10Sieved and Unsieved Samples Soil Lead Results
Off-Site Soil Sampling ReportExide Vernon
Sample ID Sieved (mg/kg) Unsieved (mg/kg)SS-BG-07-1 46.5 43.9SS-BG-08-1 136 132SS-BG-09-1 83.6 81.1SS-BG-10-1 53.4 48.3SS-BG-07-3 55.4 50.5SS-BG-08-3 166 195SS-BG-09-3 63.1 45.6SS-BG-10-3 51.7 46.2SS-MEIR-N-04-1 338 164SS-MEIR-N-08-1 257 248SS-MEIR-N-09-1 202 163SS-MEIR-N-11-1 149 162SS-MEIR-N-04-3 243 330SS-MEIR-N-08-3 249 224SS-MEIR-N-09-3 240 201SS-MEIR-N-11-3 171 133SS-MEIR-S-02-1 44.7 39.7SS-MEIR-S-05-1 169 164SS-MEIR-S-10-1 189 174SS-MEIR-S-13-1 130 122SS-MEIR-S-02-3 50 50.2SS-MEIR-S-05-3 167 188SS-MEIR-S-10-3 189 169SS-MEIR-S-13-3 202 158
Average Concentration 82 80Median Concentration 59 49
Average Concentration 231 203Median Concentration 242 183
Average Concentration 143 133Median Concentration 168 161
Background Area
Northern Assessment Area
Southern Assessment Area
F:\Projects\2013\20133007 ‐ Exide Vernon Interim Status (Post BR)\Work Documents\Off‐Site Soil Sampling\Expanded Soil Sampling Work Plan\RTC Revised Table 10 Sieve Correlation Off‐site Sample Results PRELIM.xlsx
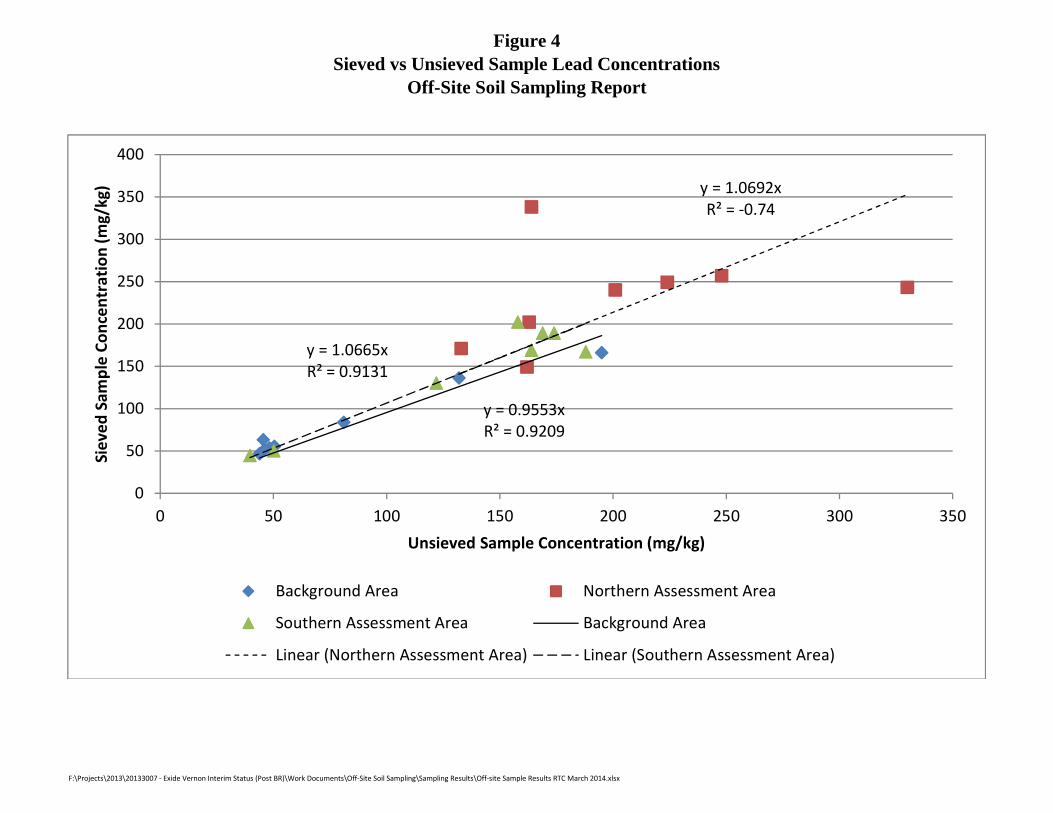
Figure 4Sieved vs Unsieved Sample Lead Concentrations
Off-Site Soil Sampling Report
F:\Projects\2013\20133007 ‐ Exide Vernon Interim Status (Post BR)\Work Documents\Off‐Site Soil Sampling\Sampling Results\Off‐site Sample Results RTC March 2014.xlsx
y = 0.9553xR² = 0.9209
y = 1.0692xR² = ‐0.74
y = 1.0665xR² = 0.9131
0
50
100
150
200
250
300
350
400
0 50 100 150 200 250 300 350
Sieved
Sam
ple Co
ncen
tration (m
g/kg)
Unsieved Sample Concentration (mg/kg)
Background Area Northern Assessment Area
Southern Assessment Area Background Area
Linear (Northern Assessment Area) Linear (Southern Assessment Area)