Embed Size (px)
Citation preview

Response Surface Methodology for The Optimization of Avocado WoodFiller (AWF)-high Density Polyethylene (HDPE) Composites Using
Surface Modification1Government Rabboni Mike , 2 Onukwuli Okechukwu Dominic and 3 Onoh Ikechukwu Maxwell
1Chemical Engineering Department, Nnamdi Azikiwe University, Awka, Nigeria, E-mail:[email protected]
2Chemical Engineering Department, Nnamdi Azikiwe University, Awka, Nigeria,Email:[email protected]
3Chemical Engineering Department, Enugu State University of Science and Technology, Enugu,Nigeria, E-mail:[email protected]
ABSTRACT:
Response surface methodology was used to optimize the preparation of avocado wood filler (AWF)- high densitypolyethylene (HDPE) composites using surface modification. The effects of particle size and filler content onmechanical and water absorption properties were investigated. Central composite design was used to determine theoptimum preparation condition of the composites to obtain the maximum tensile strength, elongation, tensilemodulus, flexural strength, flexural modulus, hardness, impact strength and water absorption. Regression modelswere developed for predicting the mechanical and water absorption properties based on central composite design. Itwas observed that the regression model developed by the properties of the composites exhibit a high coefficient ofdetermination (R2) value. The optimum process parameters were 100 mesh partcle size and 23.27wt% filler content.Under the optimum condition, the tensile strength, elongation, tensile modulus, flexural strength, flexural modulus,hardness, impact strength and water absorption were 29.34671MPa, 3.542048%, 1.018416GPa, 76.2366MPa,0.922318GPa, 1022.276Pa, 74.01456KJ/m2 and 1.230679%, respectively.
Keywords: optimization, surface modification, HDPE, avocado wood flour, polymer composites, mechanicalproperties, response surface methodology
1. INTRODUCTION In the world today, much emphasis has been given to natural filler for the replacement of inorganic fillers in theproduction of organic filler thermoplastic composites due to its comparative advantages; these natural fillers ifproperly harnessed will add significant value to the Nigeria economy as a result of her large vegetation and foresttrees. These organic fillers have been used for polymer composites as a result of the following merits; low cost,renewability, low density and high specific mechanical properties [1]. However, the enormous advantages of thetrees in sub-Sahara Africa have been under utilized for the provision of fillers for the production of compositeswhich can be further used in the manufacturing of various products like; automobile parts and house-hold furniture. Avocado pear wood has not been used by many researchers for the production of polymer composites as organicfillers. Apart from the aforementioned merits of organic fillers have in the production of composites, there are alsosome demerits associated with its applications, such as; high moisture absorption, weak adhesion between the fillerand polymer matrix, thermal instability during processing and the low wet ability [2,3]. These poor bonding leads toincompatibility between the filler and polymer which is influenced by the intermolecular hydrogen bonding of thewood flour [4, 5]. These problems can be reduced by the chemical treatment of fillers. Cellulose is the major constituent of organic fillers. It is a homo-polysaccharide that is mostly comprised of β-1,4- glocosidic which is joined by glucose monomers. It has a large degree of polymerization more than 10000, as itforms the largest component of natural fibers [6]. Due to its linear bond, it leads to the formation of entering andextra molecular hydrogen bonds. This hydrogen bond also leads to 36 glucose chains which are inside the crystallineconstituent of the fibers. Almost 50-90% of the cellulose is crystalline which proportional to the source of natural
International Journal of Scientific & Engineering Research, Volume 7, Issue 2, February-2016 ISSN 2229-5518
750
IJSER © 2016 http://www.ijser.org
IJSER

fibers [8]. In natural fibers, the nature of the structure and intermolecular hydrogen bonds provides high tensilestrength, resistance to attack of micro-organisms and insoluble in several solvents. Other constituents of the organicfiller such as; lignin, hemicelluloses and impurities have to be reduced by chemical treatment in order to boast thecellulose content. The chemical treatments are alkylation, cyanoethethylation and acetylation, treated with couplingagent such as maleated polyethylene further improves the bonding between the fillers and polymer to increase themechanical properties of composites. Thermoplastics are often used in the production of composites. These include; polyethylene, polypropylene,polyvinyl chloride and polystyrene [13]. These materials provide excellent matrix for the production of polymer-organic filler composites for various purposes. The effect of input variable (filler content) on the mechanical and water absorption properties (tensile strength,elongation, tensile modulus, flexural strength, flexural modulus, hardness, impact strength and water adsorption)was studied on a one factor plot. Also the optimization of the conditions of the input variable to maximize themechanical and water absorption properties was carried out.
2. Material and Methods
2.1 Collection and Preparation of avocado wood flour.The avocado palm wood was obtained in Federal Housing Estate Trans Ekulu in Enugu State of Nigeria.
The fiber was sun dried for 14 days during the Harmattan season, after which the bark was removed. It was cut usinga cutlass to small pieces to enable the grinding machine to take the feed. The fiber was later ground. The grindingoperations were done in Kenyetta Timber market Agbani Road, Enugu. It was finally sieved using particle sizes of100-20 mesh.
2.2 Collection and Preparation of PolyethyleneThe HDPE was manufactured from Indorama Petrochemical Limited Eleme, Port Harcourt, Rivers State and
bought at Awada, Onitsha in Anambra State of Nigeria.
2.3 Collection of Maleated Polyethylene This was obtained from Sigma-Aldrich chemical corporation.
2.4 Collection of Sodium Hydroxide and Acetic Acid These were obtained in Main Market, Enugu.
2.5 Treatment of the organic filler The filler was soaked in a 6wt% sodium hydroxide solution for 16hrs and 4vol% acetic acid for 1hour. Thefiller was finally washed with distilled water, filtered and sun-dried for 10hrs. The treated filler was mixed with5wt% maleated polyethylene.
2.6 Composite PreparationsThe avocado wood filler at different weight percent were filled in HDPE. The treated filler was mixed with
the HDPE.The avocado wood filler was filled at 5, 10, 15, 20, and 25% by weight of the filler content. The variouscompositions of the filler and the HDPE were moulded using an injection moulding machine that was carried out inEkenedilichukwu workshop Onitsha.The composites were prepared, cooled and cut to machine size in order tosubject them for mechanical test for determination of tensile, flexural, hardness,impact and water absorptionproperties.
2.7 Testing of Tensile Properties of CompositesThis test was carried in the University of Nigeria Civil Engineering Workshop, Nsukka Enugu State of
Nigeria using a universal tensometer BSS1610 model no 8889 manufactured by Hounsfield tensometer limited. Thistest was carried using ASTM D638. The equipment has a cross-head speed between10-100cm.The dimensions of tensile test sample size for ASTM used were 3.2mm x 19mm x 160mm. The samples wereinserted into the griping chucks of the tensometer and placed firmly. A continuous load was applied to the sampleand till fracture occurs. The ultimate tensile strength, elongation and modulus were calculated.
International Journal of Scientific & Engineering Research, Volume 7, Issue 2, February-2016 ISSN 2229-5518
751
IJSER © 2016 http://www.ijser.org
IJSER

2.8 Testing of Flexural Sample Properties The equipment used for this was universal tensometer used in a tensile test above. The dimension of flexuraltest sample size for ASTM D790 used were 3.2mm x 19mm x 300mm. The test sample was placed and fixed firmlyon 3-point support span. A continuous load was applied in the centre of the sample until fracture and constantdeflection occurred. The test was stopped at this condition. The flexural strength and modulus were obtained.
2.9 Testing of Hardness Properties SampleThe equipment used for this test was also universal tensometer. The dimension of hardness sample size for
ASTM E103 used was 3.2 mm × 19mm× 19mm.The sample was clamped into the machine. A steel Brinnel bulbof diameter of 10mm was picked to obtain the indentation for this test. The sample was fixed in the equipment afterwhich the indentation test connections were placed in the tensometer testing machine. The sample was subject to aspecific load in the machine, the indentation which corresponded to the depth of indentation was measured. TheBrinnel hardness was evaluated using this formula
= (1)
Where BHN is the Brinnel Hardness Number (Pa), D is the diameterof the steel ball, d is the depth of indentation(m) and F is the load (N).
2.10 Testing of Impact SpecimenThe equipment used for this test was impact tester machine located at the University of Nigeria, Nsukka,
Mechanical Engineering Department Workshop, Enugu State.The dimension of impact testing specimen size for ASTM D610-02M used was 3.2 mm × 19 mm×80mm. Thespecimen was clamped into the machine. The pendulum from the impact tester was released and allowed to strikethrough the specimen. The impact strength was determined.
2.11 Water Absorption TestThe test was carried out at Divine Chemical and Analytical Laboratory, Nsukka, Enugu state. The
composite sample was cut to dimension of 3.2mm x 19mm x19mm oven dried for 50oC for 30 minutes [14]according to ASTM specification and initially weighed (B1). The sample was immersed in water for 12 weeks atroom temperature using ASTM D96 – 06 and weighed again (B2) after the left over water on the surface wasremoved. The percentage of water absorption was calculated using the formula:
= × (2)Where M is water absorption percentage of the composite, B1 is the initial weight and B2 is the weight afterimmersing in water.
2.12 Experimental Design
Response surface methodology was utilized to determine the optimum conditions for the preparation of thecomposites. The design of experiments was carried out using the software design expert 7.0. version. Twoindependent variables were applied using central composite design. The variables used were particle size (X1) andfiller content (X2). The design consisted of 13 runs. The five levels (lowest, low, centre, high, highest) and thecoding (-α, -1, 0, +1 and +α), and factors: particle size (100-20 mesh) and filler content (5 to 25%) were shown inTable 1. The response surface functions measured were tensile strength, elongation, tensile modulus, flexuralstrength, flexural modulus, hardness, impact strength and water absorption. These can be represented by theequation, as a function of Xi and Xj as follows:
= +∑ +∑ +∑ ∑ + (3)Where Yi is the predicted response, Bo is the constant coefficient, Bi the linear coefficients, Bii is the quadraticcoefficients, Bij is the interactive coefficients, Xi Xj are the coded values of the variables, n is the number ofindependent test variables and ε is the random error.
International Journal of Scientific & Engineering Research, Volume 7, Issue 2, February-2016 ISSN 2229-5518
752
IJSER © 2016 http://www.ijser.org
IJSER
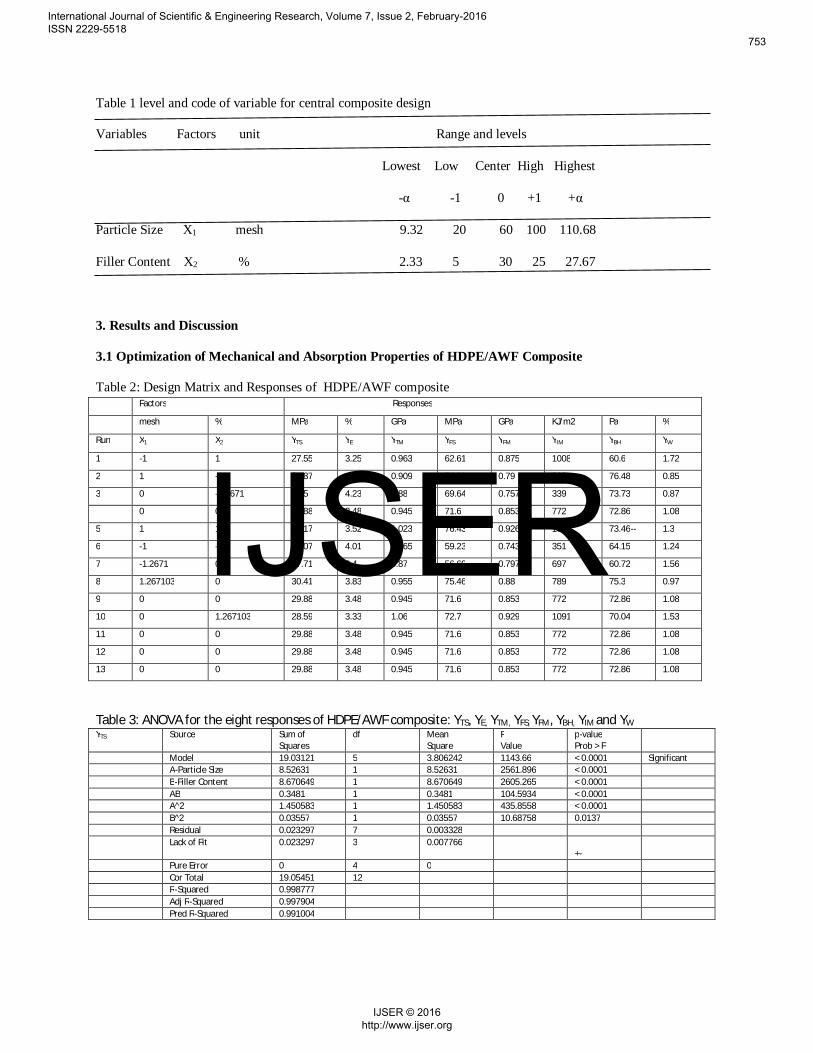
Table 1 level and code of variable for central composite design
Variables Factors unit Range and levels
Lowest Low Center High Highest
-α -1 0 +1 +α
Particle Size X1 mesh 9.32 20 60 100 110.68
Filler Content X2 % 2.33 5 30 25 27.67
3. Results and Discussion
3.1 Optimization of Mechanical and Absorption Properties of HDPE/AWF Composite
Table 2: Design Matrix and Responses of HDPE/AWF compositeFactors Responses
mesh % MPa % GPa MPa GPa KJ/m2 Pa %
Run X1 X2 YTS YE YTM YFS YFM YIM YBH YW
1 -1 1 27.55 3.25 0.963 62.61 0.875 1008 60.6 1.72
2 1 -1 31.87 4.32 0.909 74.11 0.79 398 76.48 0.85
3 0 -1.2671 31.5 4.23 0.88 69.64 0.757 339 73.73 0.87
0 0 29.88 3.48 0.945 71.6 0.853 772 72.86 1.08
5 1 1 29.17 3.52 1.023 76.43 0.926 1074 73.46-- 1.3
6 -1 -1 29.07 4.01 0.865 59.23 0.743 351 64.15 1.24
7 -1.2671 0 27.71 3.4 0.87 56.69 0.797 697 60.72 1.56
8 1.267103 0 30.41 3.83 0.955 75.46 0.88 789 75.3 0.97
9 0 0 29.88 3.48 0.945 71.6 0.853 772 72.86 1.08
10 0 1.267103 28.59 3.33 1.06 72.7 0.929 1091 70.04 1.53
11 0 0 29.88 3.48 0.945 71.6 0.853 772 72.86 1.08
12 0 0 29.88 3.48 0.945 71.6 0.853 772 72.86 1.08
13 0 0 29.88 3.48 0.945 71.6 0.853 772 72.86 1.08
Table 3: ANOVA for the eight responses of HDPE/AWF composite: YTS, YE, YTM, YFS, YFM, YBH, YIM and YWYTS Source Sum of
Squaresdf Mean
SquareFValue
p-valueProb > F
Model 19.03121 5 3.806242 1143.66 < 0.0001 SignificantA-Particle Size 8.52631 1 8.52631 2561.896 < 0.0001B-Filler Content 8.670649 1 8.670649 2605.265 < 0.0001AB 0.3481 1 0.3481 104.5934 < 0.0001A^2 1.450583 1 1.450583 435.8558 < 0.0001B^2 0.03557 1 0.03557 10.68758 0.0137Residual 0.023297 7 0.003328Lack of Fit 0.023297 3 0.007766
+-Pure Error 0 4 0Cor Total 19.05451 12R-Squared 0.998777Adj R-Squared 0.997904Pred R-Squared 0.991004
International Journal of Scientific & Engineering Research, Volume 7, Issue 2, February-2016 ISSN 2229-5518
753
IJSER © 2016 http://www.ijser.org
IJSER

YE Source Sum ofSquares
Df MeanSquare
FValue
p-valueProb > F
Model 1.427491 5 0.285498 482.7017 < 0.0001 Significant
A-Particle Size 0.175465 1 0.175465 296.6652 < 0.0001
B-Filler Content 1.011236 1 1.011236 1709.731 < 0.0001
AB 0.0004 1 0.0004 0.676294 0.4380
A^2 0.044015 1 0.044015 74.41733 < 0.0001
B^2 0.196375 1 0.196375 332.0182 < 0.0001
Residual 0.00414 7 0.000591
Lack of Fit 0.00414 3 0.00138
Pure Error 0 4 0
Cor Total 1.431631 12
R-Squared 0.997108
Adj R-Squared 0.995042
Pred R-Squared 0.978722
YTM Source Sum ofSquares
df MeanSquare
FValue
p-valueProb > F
Model 0.036504 5 0.007301 75.11491 < 0.0001 Significant
A-Particle Size 0.006215 1 0.006215 63.945 < 0.0001
B-Filler Content 0.026857 1 0.026857 276.3184 < 0.0001
AB 6.4E-05 1 6.4E-05 0.658462 0.4438
A^2 0.002136 1 0.002136 21.97896 0.0022
B^2 0.001232 1 0.001232 12.67368 0.0092
Residual 0.00068 7 9.72E-05
Lack of Fit 0.00068 3 0.000227
Pure Error 0 4 0
Cor Total 0.037185 12
R-Squared 0.981703
Adj R-Squared 0.968634
Pred R-Squared 0.864054
YFS Source Sum ofSquares
df MeanSquare
FValue
p-valueProb > F
Model 453.761 5 90.75221 2604.671 < 0.0001 Significant
A-Particle Size 381.9834 1 381.9834 10963.27 < 0.0001
B-Filler Content 12.72002 1 12.72002 365.0763 < 0.0001
AB 0.2809 1 0.2809 8.062087 0.0251
A^2 58.57597 1 58.57597 1681.184 < 0.0001
B^2 0.200772 1 0.200772 5.762344 0.0474
Residual 0.243895 7 0.034842
Lack of Fit 0.243895 3 0.081298
Pure Error 0 4 0
Cor Total 454.0049 12
R-Squared 0.999463
Adj R-Squared 0.999079
Pred R-Squared 0.996056
International Journal of Scientific & Engineering Research, Volume 7, Issue 2, February-2016 ISSN 2229-5518
754
IJSER © 2016 http://www.ijser.org
IJSER

YFM Source Sum ofSquares
df MeanSquare
FValue
p-valueProb > F
Model 0.039348 5 0.00787 366.5063 < 0.0001 Significant
A-Particle Size 0.005724 1 0.005724 266.5904 < 0.0001
B-Filler Content 0.032747 1 0.032747 1525.09 < 0.0001
AB 4E-06 1 4E-06 0.18629 0.6790
A^2 0.000568 1 0.000568 26.45274 0.0013
B^2 0.000305 1 0.000305 14.21169 0.0070
Residual 0.00015 7 2.15E-05
Lack of Fit 0.00015 3 5.01E-05
Pure Error 0 4 0
Cor Total 0.039498 12
R-Squared 0.996195
Adj R-Squared 0.993477
Pred R-Squared 0.971962
YBH Source Sum ofSquares
df MeanSquare
FValue
p-valueProb > F
Model 742358.5 5 148471.7 389.905 < 0.0001 Significant
A-Particle Size 7308.73 1 7308.73 19.19363 0.0032
B-Filler Content 724599.9 1 724599.9 1902.889 < 0.0001
AB 90.25 1 90.25 0.237008 0.6412
A^2 2439.852 1 2439.852 6.407353 0.0392
B^2 7919.725 1 7919.725 20.79818 0.0026
Residual 2665.526 7 380.7894
Lack of Fit 2665.526 3 888.5086
Pure Error 0 4 0
Cor Total 745024 12
R-Squared 0.996422
Adj R-Squared 0.993867
Pred R-Squared 0.973497
YIM Source Sum ofSquares
df MeanSquare
FValue
p-valueProb > F
Model 338.5645 5 67.71291 442.5728 < 0.0001 significant
A-Particle Size 264.3947 1 264.3947 1728.088 < 0.0001
B-Filler Content 17.53737 1 17.53737 114.6246 < 0.0001
AB 0.070225 1 0.070225 0.458992 0.5199
A^2 53.25809 1 53.25809 348.0959 < 0.0001
B^2 3.304167 1 3.304167 21.5961 0.0023
Residual 1.070988 7 0.152998
Lack of Fit 1.070988 3 0.356996
Pure Error 0 4 0
Cor Total 339.6355 12
R-Squared 0.996847
Adj R-Squared 0.994594
Pred R-Squared 0.977048
International Journal of Scientific & Engineering Research, Volume 7, Issue 2, February-2016 ISSN 2229-5518
755
IJSER © 2016 http://www.ijser.org
IJSER

YW Source Sum ofSquares
df MeanSquare
FValue
p-valueProb > F
Model 0.871716 5 0.174343 391.868 < 0.0001 significant
A-Particle Size 0.336438 1 0.336438 756.2055 < 0.0001
B-Filler Content 0.432635 1 0.432635 972.425 < 0.0001
AB 0.000225 1 0.000225 0.505728 0.5000
A^2 0.071578 1 0.071578 160.8834 < 0.0001
B^2 0.030841 1 0.030841 69.32056 < 0.0001
Residual 0.003114 7 0.000445
Lack of Fit 0.003114 3 0.001038
Pure Error 0 4 0
Cor Total 0.874831 12
R-Squared 0.99644
Adj R-Squared 0.993897
Pred R-Squared 0.973583
The design matrix and the experimental values of responses (tensile strength, elongation, tensile modulus, flexuralstrength, flexural modulus, hardness, impact strength and water absorption) for HDPE/AWF composites is shown inTable 2 .The predicted values of the response were quadratic model fitting. The statistical model was generated by aregression analysis process using experimental data for the mechanical and absorption properties of HDPE/AWFcomposites. These were given as:
YTS = 28.22772+0.078030 -0.090323 -7.37500E-004 -3.31522E-004 +8.30616E-004 (4)
YE = 4.43043-2.65508E-003 -0.094497 +5.77484E-005 +1.95166E-003 (5)
YTM = 0.80742+2.11064E-003 +8.65569E-004 -1.27224E-005 +1.54574E-004 (6)
YFS = 50.05079+0.44469 +0.23177 -6.62500E-004 -2.10669E-003 -1.97339E-003 (7)
YFM = 0.67130+1.45408E-003 +8.89683E-003 -6.56012E-006 -7.69342E-005 (8)
YBH = 123.12046+2.24934 +42.74480 -0.013596 -0.39194 (9)
YIM = 57.42403+0.38746 +0.064343 -2.00879E-003 -8.00556E-003 (10)
YW= 1.45828-0.013956 +2.41592E-003 +7.36426E-005 +7.73436E-004 (11)
3.1.1 ANOVA Analysis for HDPE/AWF compositeIt was observed in From Table 3 , that the model displayed high F-value(F models = 1143.66, 480.7, 75.11, 2604.67,366.51, 389.9, 442.57 and 391.87) for tensile strength (YTS), elongation (YE), tensile modulus (YTM), flexuralstrength (YFS), flexural modulus (YFM), hardness (YBH), impact strength (YIM) and water absorption (YW),respectively. The probability values were low (P models = 0.0001, 0.0001, 0.0001, 0.0001, 0.0001, 0.0001, 0.0001and 0.0001) for tensile strength, elongation, tensile modulus, flexural strength, flexural modulus, Brinell hardness,impact strength and water absorption, respectively. The linear, the second order particle size and the filler contentwere the significant model terms. The interactive term (AB) shows no significant effect on, YE, YTM, YFM, YBH, YIMand YW, respectively.The fitting of the models was checked by the determination coefficient values (R2 values = 99.88%, 99.71%,99.17%, 99.95%, 99.62%, 99.64%, 99.68% and 99.64%), for tensile strength, elongation, tensile modulus, flexuralstrength, flexural modulus, hardness, impact strength, and water absorption, respectively. The value of R2 andadjusted R2 are not significantly different as shown in Table 3.
International Journal of Scientific & Engineering Research, Volume 7, Issue 2, February-2016 ISSN 2229-5518
756
IJSER © 2016 http://www.ijser.org
IJSER

These also gave the high significance of the models [15]. These showed that there is good precision and reliability ofthe experiment [16].
Fig 1 Fig 2
Fig 3 Fig 4
Fig 5 Fig 6
Fig 7 Fig 8
Fig(1-8): normal probability plots of residual for YTS, YE, YTM, YFS, YFM, YBH, YIM and YW of HDPE/AWF composite.
International Journal of Scientific & Engineering Research, Volume 7, Issue 2, February-2016 ISSN 2229-5518
757
IJSER © 2016 http://www.ijser.org
IJSER

Fig 9 Fig 10
Fig 11 Fig 12
Fig 13 Fig 14
Fig 15 Fig 16
Fig(9-16): Predicted vs actual plots of residual for YTS, YE, YTM, YFS, YFM, YBH, YIM and YW of HDPE/AWF composite.
International Journal of Scientific & Engineering Research, Volume 7, Issue 2, February-2016 ISSN 2229-5518
758
IJSER © 2016 http://www.ijser.org
IJSER
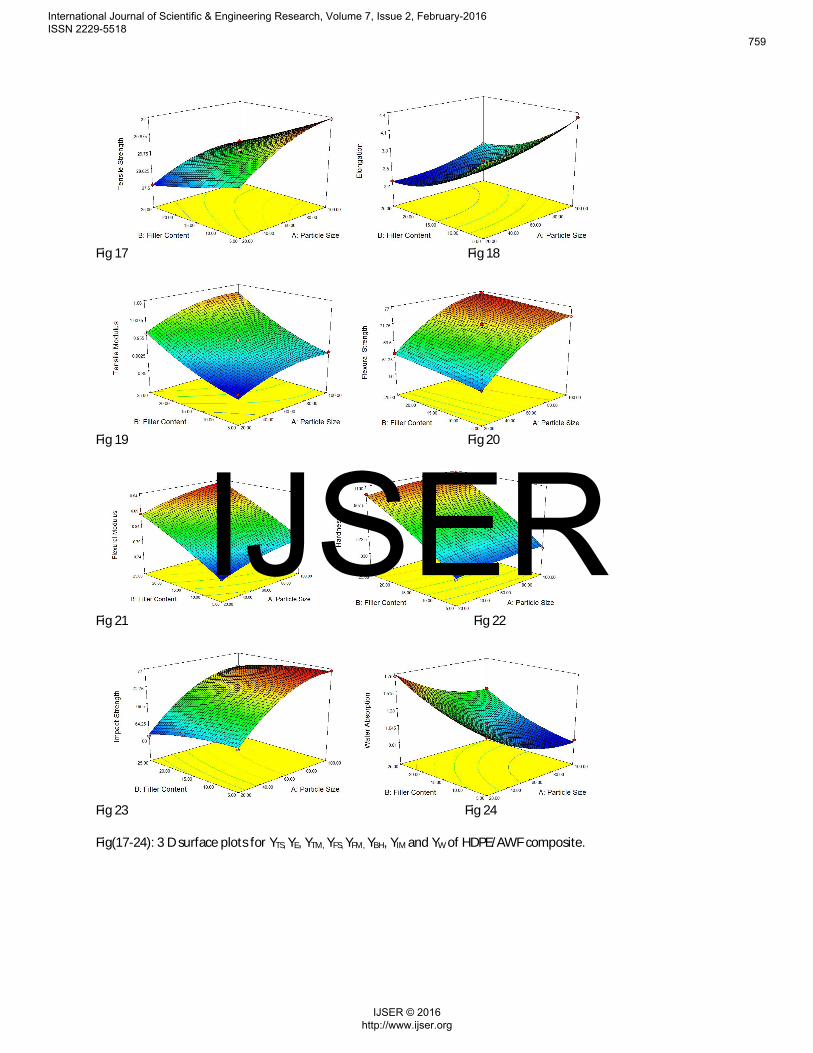
Fig 17 Fig 18
Fig 19 Fig 20
Fig 21 Fig 22
Fig 23 Fig 24
Fig(17-24): 3 D surface plots for YTS, YE, YTM, YFS, YFM, YBH, YIM and YW of HDPE/AWF composite.
International Journal of Scientific & Engineering Research, Volume 7, Issue 2, February-2016 ISSN 2229-5518
759
IJSER © 2016 http://www.ijser.org
IJSER

The normal probability plots of residual for HDPE/AWF composite are shown in Fig (1-8). These plots arealso used to determine the adequacy of the final model. These indicate whether the residuals followed a normaldistribution, in which case the points will follow a straight line. Therefore, the points on the plots lie reasonablyclose to a straight line, confirming that the errors were normally dispersed.The plot of predicted versus actual showed that there were proper correlations between actual and predictedmechanical and water absorption properties. These were indicated in Fig (9-16)The Fig (17-24) described the 3D-surface plots of the models, showing the interactions between the independentvariable (particle size and filler content) and the actual dependent variables (responses). The factors in these plotsare the interaction between the particle size and filler content, and the output factors. The output factors are tensilestrength, elongation, tensile modulus, flexural strength, flexural modulus, hardness, impact strength and waterabsorption, respectively as was observed.
Table 4: Optimum parameters for the mechanical and water absorption properties of HDPE/AWF compositeProperties Particle Size (mesh) Filler Content (%) Prediction Experiment Percentage Error (%)
HDPE/AWF Composite
YTS (MPa) 100 23.27 29.34671 29.318 0.097935
YE (%) 100 23.27 3.542058 3.533 0.256376
YTM (GPa) 100 23.27 1.018416 1.015 0.336573
YFS (MPa) 100 23.27 76.2366 76.123 0.149232
YFM (GPa) 100 23.27 0.922318 0.917 0.579954
YBH (Pa) 100 23.27 1022.276 1001.892 2.034562
YIM (KJ/m2) 100 23.27 74.01456 73.856 0.214686
YW (%) 100 23.27 1.230679 1.271 3.17241
3.1.2 Validation of the modelsIt was observed in Table 4, that the optimum condition for HDPE/AWF composite in terms of the particle
size and filler content is 100 mesh and 23.27%, respectively. The mechanical and water absorption properties atthese conditions were 29.347MPa for tensile strength, 3.542058% for percentage elongation, 1.018416GPa fortensile modulus, 76.2366MPa for flexural strength, 0.922318GPa for flexural modulus, 1022.276Pa for Brinellhardness, 74.01456KJ/m2 for impact strength and 1.230679% for water absorption respectively. These optimizedvalues were in very close agreement with experimental values which include 29.318MPa tensile strength, 3.533%percentage elongation, 1.018418GPa tensile modulus, 76.123MPa for flexural strength, 0.917GPa flexuralmodulus, 1001.892Pa Brinell hardness, 73.856KJ/m2 impact strength and 1.271% water absorption respectively.The percentage errors between the predicted and experiment values were less than 3.2%.
ConclusionThe statistical variables showed that the models for the optimization of mechanical and absorption
properties of HDPE/AWF composites were significant. From the results, the optimization values using responsesurface methodology were in agreement with one obtained in the experimental data.
References[1] A.K. Bledzki and J. Gassan, composites reinforced with cellulose based fibres’. Journal of Progress in PolymerScience, 24: 221-274, 1999.
[2] V. Haristov and S. Vasileva, “Dynamic mechanical and thermal properties of modified polypropylenecomposites wood fiber composites”. Macromolecular Materials and Engineering, 288,798-806, 2003.
[3]A.J.Nunez ,J.M.Kenny,M.M. Reboredo,M.I.Aranguren and N.E.Marcovich, “Thermal and dynamic mechanicalcharacterization of polypropylene wood-wood flour composites”.Polymer Engineering and science,42,733-742,2002.
International Journal of Scientific & Engineering Research, Volume 7, Issue 2, February-2016 ISSN 2229-5518
760
IJSER © 2016 http://www.ijser.org
IJSER

[4]S.E.Selke and I. Wichman,”Wood fiber/polyolefin composites.Composites”:Part A:Applied Science andManufacturing,35,321-326,2004.
[5] M. Kaci,S. Cimmino,C.silvestre,D. Duraccio, A. Benhamida and L.Zaidi,”Ethylene butyl acrylateglycidylmethacrylate terpolymer as an interfacial agent for isotactic polypropylene/wood flourcomposites”.Macromolecular Materials and engineering,291,869-876,2006.
[6]S.N. Walford, “Sugarcane bagasse: How easy is it to measure its constituents” ?Proceedings South Africa Sugar Technology Association , 81: 266 – 273,2008.
[7] S.Y. Ding and M.E. Himmel, The maize primary cell wall microfibril: a new model derived from direct visualisationJournal Agric Food Chemistry, 54: 597-606, 2006.
[8] S.E. Jacobsen and C.E Wyman, Cellulose and hemicelluloses hydrolysis models for application to current andnovel pretreatment proceeees’’. Applied Biochemistry Biotechnology, 84-86: 81-96,2000.
[9] A.K. Mohanty, M. Misra and L.T. Drzal, Evaluation of interphase properties in fiber reinforced polymercomposite using contact resonance force microscopy’’. Composite Interfaces, 8: 313, 2001.
[10] B. Netral, T. Sabu, K.D. Chapal and A. Rameshwa, “Analysis of morphology and mechanical behaviors ofbamboo flour reinforced polypropylene composites”. Nepal Journal of Science and Technology 13(1): 95-100, 2012.
[11] M.Tajvidi and G. Ebrahimi, “Water uptake and mechanical characteristics of natural-polypropylenecomposites”. Journal of Applied Polymer Science, 88:941-946, 2003.
[12] M. E. Malainine, M. Mahrouz, A.Dufresne, “lignocellulosic flour from cladodes of opuntia ficus–indicareinforced polypropylene composites”, Macromolecular Materials and Engineering, 289: 855-863, 2004.
[13] Q. Li and L. M. Matuana, Surface of cellulosic materials modified with functionalized polyethylene couplingagent.Journal of Applied Polymer Science, 88: 278-286, 2003.
[14] A.G. Supri and .B.Y Lim, “Effect of treated and untreated filler loading on the mechanical, morphological,and water absorption properties of water hyacinth fibers low density polyethylene composites”. Journal of PhysicalScience, 20(2): 85-96, 2009.
[15] A.I. Khuri and J.A. Cornell, Dekker M. Response surfaces: design and analysis. New York: Dekker; 1987.
[16] K.Kuchi, “Hopped delay for multiply process power control and handover procedure and optimization”, IrvingUSA, Wiley, 2000.
International Journal of Scientific & Engineering Research, Volume 7, Issue 2, February-2016 ISSN 2229-5518
761
IJSER © 2016 http://www.ijser.org
IJSER