Embed Size (px)
Citation preview

Adv Plants Agric Res 2014, 1(5): 00030Submit Manuscript | http://medcraveonline.com
Advances in Plants & Agriculture Research
These imply that the outflow of nutrients in most smallholder farms far exceeds inflows.
The crops that are commonly grown on Vertisols in Ethiopia are teff, barley, bread wheat, chickpea, lentil and noug [2]. Teff (Eragrostis tef (Zucc) Trotter) is a small-grained cereal that has been grown as food crop in East Africa for thousands of years [3]. Teff is adapted to a large variety of environmental conditions and widely grown from sea level up to 2800 masl under various rainfall, temperature and soil conditions [4]. According to CSA [5], the total teff cultivated area in Ethiopia in the Meher (main rainy) season of the 2010/2011 was 2,761,190 ha. The national total production of teff for the same season was 3,483,488 tons, with national mean teff yield of 1.26 tons ha-1 which is still considerably below the yield level obtained from experimental fields. Therefore, the yield gap suggests that there is a potential for increasing its total production and productivity per unit area through improved crop and soil management practices, particularly by means of increased use of mineral and/or organic fertilizers.
AbbreviationsSRU: Slow Release Urea; CU: Conventional Urea; TSP: Triple
Super Phosphate; AE: Agronomic Efficiencies; PE: Physiological Efficiencies; ANOVA: Analysis of Variance; LSD: Least Significant Difference; OM: Organic Matter; N: Nitrogen; P: Phosphorus; HI: Harvest Index; SE: Standard Error; CV: Coefficient of Variation; TGW: Thousand Grain Weight; GY: Grain Yield; SY: Straw Yield; TBY: Total Biomass Yield; GN: Grain Nitrogen; SN: Straw Nitrogen; TNU: Total Nitrogen Uptake; AR: Apparent Recovery
IntroductionDeclining soil fertility has continued to be a major constraint
to food production in many parts of the tropical region. The low soil fertility in the tropics has been attributed to the low inherent soil fertility, loss of nutrients through erosion and crop harvests and little or no addition of external inputs in the form of organic or inorganic fertilizers [1]. This is particularly evident in the intensively cultivated areas, traditionally called high potential areas that are mainly concentrated in the highlands of Ethiopia.
Response of Teff (Eragrostis tef) to Different Rates of Slow Release and Conventional Urea Fertilizers in Vertisols of
Southern Tigray, EthiopiaResearch Article
Volume 1 Issue 5 - 2014
Okubay Giday1*, Heluf Gibrekidan2 and Tareke Berhe3 1Department of Soil Science, Wollo University, Ethiopia2Department of Soil Sciences, Haramaya University, Ethiopia3Department of Rice and Teff Research Advisor, Agriculture Transformation Agency, Ethiopia
*Corresponding author: Okubay Giday, Department of Soil Science, Wollo University, P.O Box 708 Addis Ababa, Ethiopia, Tel: 0912730379; E-mail:
Received: August 04, 2014 | Published: November 18, 2014
Abstract
A field experiment was conducted during the main rainy season of the 2011 at Ofla testing site to determine the optimum rates and overall performance of slow release urea (SRU) fertilizer over conventional urea (CU) fertilizer for teff production. The field experiments comprised of 5 treatments, i.e three rates of slow release urea at 23, 46 and 69 kg N ha-1, recommended rate 46 kg N ha-1 of conventional urea fertilizer and control (without any N fertilizer) laid down in a randomized complete block design with three replications. All experimental units were supplied with a uniform rate of 46 kg P2O5 ha-1 in the form of triple super phosphate (TSP) at planting time. At harvest, the crop was partitioned in to straw and grain for the determinations of N concentrations, uptakes and calculation of N fertilizer recoveries and use efficiencies. Application of different rates and sources of N fertilizer significantly (P≤0.01) affected most the crop parameters tested. The significantly different and maximum plant height (112.33 cm), fertile tillers per plant (22.67), and panicle length (52.00 cm) were obtained from the application of the highest SRU rate (69 kg N ha-1) whereas the lowest records were obtained from the control plot of the teff crops. Similarly, the maximum grain yield (3443.67 kg ha-1), straw yield (6208.33 kg ha-1), total biomass (9652.00 kg ha-1) and 1000 grains weight (0.35 g) were obtained from the application of the highest SRU rate showing a decreasing trend with declining N rate with the lowest obtained from the control plots of wheat. Application of SRU fertilizer has also affected the grain and straw N contents and uptakes. These showed increasing trend with increasing N rate where the maximum record were obtained at the highest rate of SRU (69 kg N ha-1). The application of 46 kg N ha-1 of SRU fertilizer has yield advantage of 462.00 kg ha-1
over the application of 46 kg N ha-1 of CU fertilizer for teff crop. This shows that SRU can reduce N losses by leaching in the form of NO3
-, fixation as NH4, volatilization as NH3 and atmospheric emission in the form of N2O or N2. The application of 46 kg N ha-1
SRU was the optimum rate.
KeywordsSlow release urea; Conventional urea; Teff; Vertisols

Response of Teff (Eragrostis tef) to Different Rates of Slow Release and Conventional Urea Fertilizers in Vertisols of Southern Tigray, Ethiopia
Citation: Giday O, Gibrekidan H, Berhe T (2014) Response of Teff (Eragrostis tef) to Different Rates of Slow Release and Conventional Urea Fertilizers in Vertisols of Southern Tigray, Ethiopia. Adv Plants Agric Res 1(5): 00030. DOI: 10.15406/apar.2014.01.00030
Copyright: 2014 Giday et al. 2/8
Soil degradation and depletion of soil nutrients are among the major factors threatening sustainable cereal production in the Ethiopian highlands. Among the major plant nutrients, N is the most limiting factor calling for external inputs in the form of fertilizer for profitable cereal crop production in most agro-ecological zones. However, conventional N fertilizers are highly soluble and, once applied to the soil may be lost from the soil-plant system or made unavailable to the plants through the processes of leaching, NH3 volatilization, denitrification and immobilization and fixed in the soil solids as NH4-N form [6]. The N recovery by crops from the soluble N fertilizers such as urea is often as low as 30–40%, with a potentially high environmental cost associated with N losses via NH3 volatilization, NO3
- leaching and N2O emission to the atmosphere [7].
In order to improve urea-N recovery and reduce its loss, many forms of slow-release urea fertilizers have been developed and applied to different plant species under a range of environmental conditions. The products may be coated, chemically and biochemically modified, or are granular [8]. Such slow release urea fertilizers can increase the efficiency of applied urea-N and are environmentally friendly because their N release is in synchrony with plant N uptake, and in a single application, can provide sufficient N to satisfy plant N requirements while maintaining very low concentrations of mineral N in soil throughout the growing season [9].
The use of slow-release urea fertilizer sources is a common strategy to reduce N losses in horticultural crops, but its agronomic performance and cost-effectiveness for field crops has not been well established particularly in Ethiopia. Therefore, this study was conducted to evaluate the overall performance of applying slow-release urea fertilizer over the conventional urea fertilizer for teff production, and to determine optimum rates of slow-release urea fertilizer for teff productivity.
Materials and MethodsGeneral description of the study area
The field experiment was conducted during the 2011 main cropping season under rainfed conditions in Ofla District, Southern Zone of Tigray Regional State. Ofla District, one of the six districts of the Southern Zone, is located about 620 km north of Addis Ababa and about 150 km south of Mekelle city. The study District has about 133,296 ha of land area and the altitude varies between 1700 and 2800 masl whilst the slope ranges from 2 to 35% [10].
The study area is characterized by a bimodal rainfall pattern with the main wet season (kiremt) extending from July to September and the small wet season (Belg) which extends from March to May. The area is characterized by heavy and erratic rainfall distribution. The ten years (2002-2011) mean annual rainfall is 980.5 while the annual rainfall in 2011 was 1050 mm. Similarly, the mean maximum and minimum temperatures were 22.28 and 7.69 °C, respectively. Vertisols are the dominant soil types in the area. The area has crop-dominated mixed crop-livestock farming system. The dominant crops growing around
the experimental area are wheat (Triticum aestivum L.), maize (Zea mays L.), barley (Hordeum vulgare), teff (Eragrostis tef) and some species of legume crops [10].
Experimental materials, treatments and design
The field experiment comprised of 5 treatments, i.e. three rates of slow release urea fertilizer at 50 kg (23 kg N ha-1), 100 kg (46 kg N ha-1) and 150 kg (69 kg N ha-1) kg ha-1, recommended N rate at 100 (46 kg N ha-1) from conventional urea fertilizer and control (without any N fertilizer). The field experiment was laid down in a randomized complete block design with three replications. All experimental unites were treated with a uniform rate of 46 kg P2O5 ha-1in the form of triple super phosphate (TSP) at planting time. An improved teff variety known as DZ-cr-387 (kuncho teff) was sown by hand drilling at a rate of 5 kg seed ha-1
and was used as test crop.
Experimental procedures and field management
The experimental plot was prepared using local plow (maresha) pulled by oxen according to farmers’ conventional practice. Accordingly, the field was plowed three times before sowing. The plot size was 4 m x 3 m (12 m2) each containing 15 planting rows of 4 m length at a spacing between rows of 20 cm. The plots within a block were separated by 0.5 m whereas the blocks were separated by 1 m wide open space area. The net plot size was 3 m x 2.6 m (7.8 m2) leaving one outer row on both sides of each plot and 0.5 m row length at both ends of the rows to avoid possible border effects. The slow release urea fertilizer was incorporated 3-4 cm deep into the soil with 5 cm distance from the planting raw at the time of sowing while the conventional urea fertilizer was applied in two equal splits, the first half at the time of sowing and the second half was top-dressed at the mid tillering stage of the crop. Furthermore, during the different growth stages of the crop, all the necessary agronomic practices were carried out accordingly.
Soil sampling, sample preparation and analysis
Before sowing, surface soil samples (0-15 cm depth) were collected using Auger from eight to ten spots from each block to form one composite soil sample per block for initial soil fertility evaluation.
Crop data collection
Numbers of fertile and non fertile tillers per plant were counted from 10 main stands which were tagged before tillers appeared, at the period of heading and at maturity, respectively. The average height of main stems of teff was measured at heading and physiological maturity by measuring using measuring tape from the ground level to the tip of the panicle.
The weight of thousand kernels was determined by measuring the weight of 1000 kernels randomly taken from the total grains harvested from each experimental plot and it was adjusted at 12.5% moisture content by using Dicky John hand moisture tester instrument. Grain yield was determined by harvesting the crop of the entire net plot area (inclusive of plant sample for

Response of Teff (Eragrostis tef) to Different Rates of Slow Release and Conventional Urea Fertilizers in Vertisols of Southern Tigray, Ethiopia
Citation: Giday O, Gibrekidan H, Berhe T (2014) Response of Teff (Eragrostis tef) to Different Rates of Slow Release and Conventional Urea Fertilizers in Vertisols of Southern Tigray, Ethiopia. Adv Plants Agric Res 1(5): 00030. DOI: 10.15406/apar.2014.01.00030
Copyright: 2014 Giday et al. 3/8
yield components and laboratory analysis) and was adjusted to 12.5% moisture content. The total above ground biomass was determined by weighing the straw and grain yields for each plot. Harvest index was calculated as a ratio of grain yield to the total above ground biomass multiplied by 100% at 12.5% moisture content [11].
Plant tissue sampling and analysis for nitrogen content
Plant samples were collected from each plot at harvest and partitioned into vegetative and grain for the determinations of N concentrations in grain and straw and calculation of N fertilizer recoveries and use efficiencies. The samples collected from each replication of a treatment were bulked to give one composite plant tissue sample per treatment. The straw samples were washed with distilled water to clean the samples from contaminants such as dust. Then the samples were oven dried at 70 °C for 24 hours or to constant weight and ground and sieved through 0.1 mm size sieve and saved for laboratory analysis. The N contents of the grain and straw samples were determined following the wet digestion method, which involves the decomposition of the plant tissues and grain using various combinations of HNO3, H2SO4 and HClO4. From the digest, N was measured using the Kjeldahl procedure.
Total N uptakes in straw and grains were calculated by multiplying the N contents by the respective straw and grain yields per hectare. Total N uptakes by the whole plant were determined by summing up the respective grain and straw N uptakes on hectare basis. Finally, apparent fertilizer N recoveries (AR) were calculated by the procedure described by Pal [12] as:
AR= 100n oU Un− ×
Where Un stands for nutrient uptake at ‘n’ level of fertilizer nutrient and Uo stands for nutrient uptake at the control or ‘no fertilizer’ case. Similarly, agronomic use efficiencies (AE) and physiological use efficiencies (PE) of N fertilizers were calculated using the procedures described by Mengel and Kirkby [13] and Woldeyesus et al. [14] as follows:
AE= n o
nG G−
n o
n o
PE G GU U
−= −
Where Gn stands for grain yield of the plot fertilized at ‘n’ fertilizer rate and Go for grain yield of the unfertilized plot. The notations Un and Uo stand for the N nutrient uptake in the two fertilization cases as described earlier.
Statistical analysis
The yield and other crop data were subjected to analysis of variance (ANOVA) appropriate to randomized complete block design using SAS software program [15]. The analysis results of the soil and tissue samples were interpreted using descriptive statistics. Comparisons of means were performed using the least significant difference (LSD). Pearson’s simple linear correlation coefficient (r) values were computed to examine the magnitude and direction of relationships between the different crop yield and yield components.
Results and DiscussionSelected physical and chemical properties of the experimental site
In the present study, the texture of the average of the composite surface (0-15 cm) soil samples was clay loam (Table 1). According to the soil pH rating established by Tekalign [16], the mean pH values of the composite surface soil samples of the experimental site was categorized under the slightly acidic soil reaction class and according to the same rating, organic matter content was categorized under low rating. The mean total N contents of the composite surface soil sample of the study area were rated as medium based on the classification. Moreover, According to Olsen et al. [17] rating, the average available P contents of the composite surface soil samples of the experimental site fall under the high P status implying that response of crops to P fertilization at such P level may not be very high.
Effects of N fertilization on teff growth parameters
Plant height: Application of different rates and sources of N fertilizer affected teff plant heights highly significantly (P < 0.01). Regardless of the rate of application, the teff plant on the plots which received N fertilizer was taller significantly as compared to their respective plant heights on the control plots (Table 2). Generally, plant height increased consistently with increasing rates of N where the maximum plant heights of 112.33 cm was obtained from the application of the highest N rate (69 kg N ha-1 SRU) and the lowest of 85.67 cm was obtained from the control plot of teff crop. In accordance with the response observed for the phenological parameters, the plant heights of teff crop recorded due to application of 23 kg N ha-1 from SRU and 46 kg N ha-1 from CU were statistically similar while there was significant differences between plots which received 46 kg N ha-1 of SRU and 46 kg N ha-1 of CU fertilizers.
Simple correlation coefficient also showed that N was strongly and positively correlated (r = 0.98**) with plant height of teff crop.
Depth (0-15 cm)Particle size (%)
Textural class pH (H2O) OM (%) Total N (%) AP ( mg kg-1)Sand Silt Clay
Block 1 23 47 30 Clay loam 6.6 2.20 0.19 13.68Block 2 27 43 30 Clay loam 6.5 2.33 0.10 13.52Block 3 25 45 30 Clay loam 6.6 2.24 0.10 15.80Mean 25 45 30 Clay loam 6.6 2.26 0.13 14.33
Table 1: Selected physical and chemical properties of the experimental site before planting.

Response of Teff (Eragrostis tef) to Different Rates of Slow Release and Conventional Urea Fertilizers in Vertisols of Southern Tigray, Ethiopia
Citation: Giday O, Gibrekidan H, Berhe T (2014) Response of Teff (Eragrostis tef) to Different Rates of Slow Release and Conventional Urea Fertilizers in Vertisols of Southern Tigray, Ethiopia. Adv Plants Agric Res 1(5): 00030. DOI: 10.15406/apar.2014.01.00030
Copyright: 2014 Giday et al. 4/8
In agreement with this result, Amsal et al. [18] reported a positive and linear response of plant height of wheat to increasing N fertilizer application in the central highlands of Ethiopia. Several other studies [19-21] have also revealed remarkable plant height enhancement in reaction to each incremental dose of N fertilizer. Moreover, plant height of teff was significantly increased by N application on Vertisols on farmer’s fields [21].
Number of tillers per plant of teff: The effects of application of different rates and sources of N fertilizer on the number of productive tillers were statistically significant (P < 0.01). Number of fertile tillers per plant increased linearly with increasing rate of applied SRU from 9 in the plots without N (control) to 22.67 in the plots supplied with 69 kg N ha-1 (Table 2). The number of fertile tillers per plant for those plots supplied with 46 kg N ha-1 of SRU was 20 while it was 15 for those plots supplied with 46 kg N ha-1 of CU. The differences in mean number of fertile tillers obtained due to the application of different rates of applied N were significant (P < 0.05) between each other. It can also be observed from the highly significant and positive correlation coefficient that the increasing N rate had enhanced the development and growth of new productive tillers.
Marschner [22] reported that N stimulates tillering probably due to its effect on cytokinin synthesis. Batey [23], Archer [24] and Mossedaq and Smith [25] revealed that tillering is enhanced by increased light and N availability during the vegetative growing period and wheat reacts to N application by producing more tillers per plant and by exhibiting a higher percentage survival of tillers. Ayoub et al. [26] also reported that the spike population of wheat increased with increasing level of N fertilization which is mainly because of increased fertile tillers than the control plots.
Effects of N fertilizer on teff yield and yield components
Panicle length: Panicle length of teff was significantly (P < 0.01) affected by the application of different rates and sources of N fertilization. The highest and lowest panicle length of teff (52.00 and 29.67 cm) was recorded at the highest rate of SRU and the control plots, respectively. In line with the other parameters, there were no significant differences in panicle length due to the application of 23 kg N ha-1 of SRU and 46 kg N ha-1 of CU fertilizers (Table 3). Panicle length is one of the yield attributes of teff which could lead to high increment of grain, straw and biomass yields.
Panicle length exhibits positive and highly significant correlation with culm length, plant height, number of internodes and grain [27]. Thus, crops with high panicle length could have higher grain, straw and biomass yields. Application of higher amount and efficient utilization of N leads to high photosynthetic efficiency and accumulation of high dry matter which ultimately increases yield. Highly significant and positive coefficient of correlation (r = 0.98**) was observed between panicle length of teff and applied N rate indicating an increase in the rate of N resulted in a longer panicle length.
Thousand grains weight: Thousand grains weight responded significantly (P < 0.01) to the application of different rates and sources of N fertilizer and increased consistently with the increase
in applied N rate. Like most of the other crop parameters, there were no significant differences in 1000 grain weight between the applications of 23 kg N ha-1 of SRU and 46 kg N ha-1 of CU fertilizers. The maximum and minimum thousand grains weight of teff (0.35 and 0.25 g) was obtained at the application of 69 kg N ha-1 of SRU and control plots (Table 3).
Significant and positive correlations (r = 0.98**) was observed between thousand grains weight and applied N rates indicating an increase in the rate of N resulted in a more weight of teff grains. This result is in line with the findings of Tilahun et al. [20] who indicated that 2.2 to 10.0% higher grain weights were obtained from 120 over 60 kg N ha-1 depending on the location and climatic condition of the growing season. Amsal et al. [18] also reported a positive and linear response of thousand grains weight to N fertilization where the subsequent decline in grains weight was attributed to sub-optimal assimilation of nutrients and, hence, shriveled seeds of wheat. In contrast, Gooding and Davis [28] have shown either no improvement or reduced kernel weight due to N fertilization even when yields increased. Zewdu et al. [19] has also reported no significant response of 1000 grains weight to application of N fertilizer in the highlands of Ethiopia.
Grain yield: Grain yield responded significantly (P < 0.01) to
Table 2: Effect of N on wheat and Teff growth parameters.
Means of the respective parameters of crop within a column sharing common letter(s) are not significantly different at P > 0.05SRU: Slow Release Urea; CU: Conventional Urea; LSD: Least Significant Difference; SE: Standard Error; CV: Coefficient of Variation
N rates (kg ha-1)Teff
Plant height (cm)Number of tillers plant-1
Fertile Non Fertile0 (Control) 85.67c 9.00e 1.33
23 (SRU) 103.67b 13.00d 1.3346 (SRU) 112.33a 20.00b 1.0069 (SRU) 112.33a 22.67a 1.6746 (CU) 104.00b 15.00c 1.67
LSD (0.05) 3.08 1.65 NSSE (±) 0.89 0.53 0.26CV (%) 1.58 5.50 5.48
Table 3: Effect of N fertilization on yield components of wheat and teff.
Means within a column sharing common letter(s) are not significantly different at P > 0.05 SRU: Slow Release Urea; CU: Conventional Urea; LSD: Least Significant Difference; SE: Standard Error; CV: Coefficient of Variation
N rates (kg ha-1)Teff
Panicle length (cm)0 (Control) 29.67c
23 (SRU) 42.00b46 (SRU) 49.67a69 (SRU) 52.00a46 (CU) 43.33b
LSD (0.05) 2.65SE (±) 0.72CV (%) 3.25

Response of Teff (Eragrostis tef) to Different Rates of Slow Release and Conventional Urea Fertilizers in Vertisols of Southern Tigray, Ethiopia
Citation: Giday O, Gibrekidan H, Berhe T (2014) Response of Teff (Eragrostis tef) to Different Rates of Slow Release and Conventional Urea Fertilizers in Vertisols of Southern Tigray, Ethiopia. Adv Plants Agric Res 1(5): 00030. DOI: 10.15406/apar.2014.01.00030
Copyright: 2014 Giday et al. 5/8
the application of different rates (SRU) and sources (SRU and CU) of N fertilizer. The highest mean grain yield of teff (3443.67 kg ha-1) was obtained from 69 kg N ha-1 of SRU with 1332.34 kg ha-1 yield advantage over and the control plot. The next highest mean grain yield (3379.67 kg ha-1) was obtained from 46 kg N ha-1 SRU with no statistically significant difference (P > 0.05) compared to the yield obtained with the application of 69 kg N ha-1 of SRU and the least teff grain yield (2111.33 kg ha-1) was obtained from the control plot (Table 3). Generally, grain yield exhibited a linear increase with increasing rate of application of N fertilizer in both wheat and teff crops.
The application of 46 kg N ha-1 of SRU fertilizer has yield advantage of 462.00 kg ha-1 over the application of 46 kg N ha-1 of CU fertilizer (Table 3). This shows that SRU can reduce N losses by leaching in the form of NO3
-, fixation as NH4, volatilization as NH3 and atmospheric emission in the form of N2O or N2. Similarly, it is reported that N fertilizer application rates on cotton have reduced by 40% if controlled release rather than conventional fertilizers are used [29].
Highly significant and positive correlation of N fertilizer with grain yield and other yield components teff crop also indicates that N is the principal factor that controls the growth and development of the crop. Moreover, grain yield of teff was highly and positively correlated with most of the growth parameters and yield components such as straw yield (r = 0.99**), total biomass yield (r = 0.99**), thousand grains weight (r = 0.89**), plant height (r = 0.98**), fertile tillers (r = 0.95) and panicle length (r = 0.98**).
Several other studies also indicated positive and linear responses of grain yield to increasing levels of N fertilizer [18,20]. Tilahun et al. [20] reported that application of 120 kg N ha-1 showed yield advantage ranging from 19 to 49% over the yield obtained from 60 kg N ha-1 depending on the inherent N status of the soil and the amount and distribution of rainfall during the growing season of the respective locations. Similar to the present results, Mulugeta [30] reported that grain yield of teff was affected significantly by N fertilization. According to the DZARC [31] report, application of N fertilizer beyond 60 kg ha-1 produced the highest yield of teff.
Straw and total biomass yields: The application of different rates and sources of N fertilizer on the straw yield was significant at P < 0.01. The highest mean straw yield of teff (6208.33 kg ha-1) was obtained from the application of 69 kg N ha-1 of SRU with an increment of 1135.66 and 2600.66 kg ha-1 straw yield advantage over the application of 23 kg N ha-1 and the control plot, respectively (Table 3). The next highest mean straw yield (6011.67 kg ha-1) was obtained from 46 kg N ha-1 of SRU and the least straw yield (3607.67 kg ha-1) was obtained from the control plot. The response of straw yield of teff for the application of 23 kg N ha-1 of SRU was not significantly different (P > 0.05) from the application of 46 kg N ha-1 of CU responded while the application of 46 kg N ha-1 of SRU were significantly different from 46 kg N ha-1 of CU with a straw yield advantage of 892 kg ha-1. Generally, straw yield showed a sharp increase with increasing the rates of N fertilizer, following the same trend as grain yield (Table 3).
Highly significant positive relationships was also observed between straw yield of teff and growth parameters and yield components such as plant height (r = 0.97**), fertile tillers (r = 0.94**), and panicle length (r = 0.97**). Application of 69 kg N ha-1 of SRU gave the highest straw yield (6208.33 kg ha-1) which was superior by (22.40%) and (72.00%) as compared to the control and application 23 kg N ha-1 of SRU (Table 3).
In agreement with this result, Tilahun et al. [20] showed straw yield increments of 24 to 29% for 120 over 60kg N ha-1 from experiments conducted in the central and southeastern Ethiopia. Moreover, the result from the experiment done on Vertisols of the central highlands of Ethiopia by Selamyihun et al. [32] showed that straw yield of durum wheat increased significantly with each incremental dose of N.
In accordance with the grain and straw yields, total biomass yield was also significantly (P < 0.01) affected by the application of different rates and sources of N fertilizer. The highest total biomass yield (9652.00 kg ha-1) was obtained from the application of the highest rate of SRU (69 kg N ha-1), with 1748.67 kg ha-1 total biomass yield advantage over the lowest N rate (23 kg N ha-1). The next highest mean biomass yield was obtained from 46 kg N ha-1 of SRU with a difference of (4618.33) and (3152.33) kg ha-1 yield advantages over the application of 23 kg N ha-1 SRU and the control plot. The application of 46 kg N ha-1 of SRU had 1354 kg ha-1 biomass yield advantage over 46 kg N ha-1 of CU (Table 3).
Generally, total biomass yield increased with increasing rate of N which is also expressed by the positive and highly significant correlation (r = 0.99**) (Table 4). Other essential relationships were also observed between biomass yield of teff and pertinent yield and yield components such as grain yield (r = 0.99**), straw yield (r = 0.99**), plant height (r = 0.98**), fertile tillers (r = 0.95**) and panicle length (r = 0.98**).
Harvest index: The application of different rates and sources of N fertilizer on teff harvest index (HI) was highly significant (P < 0. 01). Harvest indices of teff for all N rates were higher and significantly different from control plots. Except for the control, the lowest harvest indices was recorded from plots which receive 69 kg ha-1 of SRU and this could be due to higher straw yield obtained from highest N fertilization (69 kg ha-1). The mean HI values varied from 33.83 to 36.27% for the effect of N on teff (Table 3).
Mengel and Kirkby [13] also reported that harvest indices
Table 4: Effects of N fertilizer application on N apparent recovery, agronomic &physiological efficiencies of teff.
AR: Apparent Recovery; AE: Agronomic Efficiency; PE: Physiological Efficiency
N rates N (kg ha-1)Teff
AR (%) AE (kg kg-1 N) PE (kg grain kg-1
N)0 (control) - - -23 (SRU) 185 31.27 16.8646 (SRU) 196 27.57 14.0469 (SRU) 187 19.31 10.3246 (CU) 118 17.51 14.74
Response of Teff (Eragrostis tef) to Different Rates of Slow Release and Conventional Urea Fertilizers in Vertisols of Southern Tigray, Ethiopia
Citation: Giday O, Gibrekidan H, Berhe T (2014) Response of Teff (Eragrostis tef) to Different Rates of Slow Release and Conventional Urea Fertilizers in Vertisols of Southern Tigray, Ethiopia. Adv Plants Agric Res 1(5): 00030. DOI: 10.15406/apar.2014.01.00030
Copyright: 2014 Giday et al. 6/8
of modern wheat cultivars normally range from 35.0 to 40.0%, whereas older cultivars have indices in the range of 23.0 to 30.0%, which agreed with the present observation. Similar to the present results, Mulugeta [30] also found the lowest harvest index when the highest N rate was applied as compared to the control treatment in teff. Moreover, it is also in agreement with the results of Marschner [22] that excess nitrogen application resulted in a reduction of harvest index in cereal crops.
Nitrogen uptake and utilization of teff crop
Grain and straw N contents and uptakes of teff
The grain and straw N contents and their uptakes were affected by the application of different rates and sources of N fertilizer. Both the grain and straw N contents increased with each successive addition of N fertilizer. Accordingly, the highest grain N (2.68%) and straw N (1.83%) contents of teff was obtained at the rate of 69 kg N ha-1 of SRU while the least was obtained from the control plots. Furthermore, grain N, straw N and total N uptake parameters linearly increased in response to the increased N fertilization where the maximum uptakes were recorded at the highest N rate (69 kg N ha-1 of SRU) and the minimum was at the control plots (Table 5).
The grain N and straw N uptakes of teff were increased by 273% and 148%, respectively and while total N uptake increased by 168% in response to 69 kg N ha-1 of SRU relative to the control. The result clearly showed the positive effects of N on teff grain and straw yields and the improvement of grain and straw N contents by application of SRU fertilizer. The grain N uptake of all N rates was much higher than that of the straw uptake due to higher grain N content than the straw. The total N uptake recorded in the current study due to N fertilization is much higher compared with results of the previous studies in Ethiopia, [18,32,33] which showed total N uptakes of wheat ranging from 23.3 to 83.4 kg N ha-1 for Vertisols. Moreover, the results are in line with the findings of Tekalign et al. [34] that grain nitrogen content increased with an increase in the rate of nitrogen fertilization in teff. Similarly, Genene [35] reported a positive correlation between nitrogen fertilization and grain and straw nitrogen contents in wheat.
The application of 46 kg N ha-1 of SRU has improved the grain,
straw and total N uptakes of the fertilizer nitrogen by 23.50, 31.24 and 27.08% over application of 46 kg N ha-1 of CU (Table 5). The results indicated that grain; straw and total N uptake of the fertilizer nitrogen was significantly enhanced by the application of SRU than CU fertilizer.
Apparent recovery, agronomic and physiological efficiencies of N
The mean apparent fertilizer recovery (nutrient use efficiency) of SRU recorded was 191%. Apparent recoveries of N increased inconsistently with increasing rate of SRU application (Table 6). The application of 23 kg N ha-1 of SRU has improved the apparent recovery of the fertilizer nitrogen by 56.78 % over 46 kg N ha-1 of CU. Such low AR of N in CU might be attributed to the susceptibility of N to different losses through leaching or denitrification, and, hence, exhibits low recovery under conditions of high rainfall or impeded drainage.
In contrast to the current result, Wuest and Cassman [36] found recovery of N applied at planting ranged from 30 to 55%, while the recovery of N applied at anthesis ranged from 55 to 80% in irrigated wheat. In the present study, an average of agronomic efficiency of SRU obtained was 25.29 kg grain per kg of N. Maximum agronomic efficiency of N (31.27) was obtained at application rate of 23 kg N ha-1 of SRU fertilizer. Meanwhile the minimum value of 19.31 was recorded at the rate of 69 kg N ha-1 of SRU (Table 6).
The application of 23 kg N ha-1 of SRU has improved the agronomic efficiency of the fertilizer nitrogen by 78.58% over 46 kg N ha-1 of CU. The AE was too high compared with the results of previous studies in the country i.e. 22.48 and 20.68 kg grain per kg applied N for the Vertisol and Nitisol zones, respectively [18] and 9.5 to 18.3 kg grain per kg applied N on waterlogged Vertisols in central Ethiopia [33].
The physiological efficiency (PE) responded to the application of SRU with an apparent decreasing trend i.e. the efficiency declined with each successive addition of SRU fertilizer rates (Table 6). Thus, the maximum and minimum physiological efficiencies of N (15.03 and 10.32) kg grain per kg total N uptake were recorded at the lowest and highest SRU rates, respectively. Genene [35] in the study conducted on bread wheat in southeastern Ethiopia,
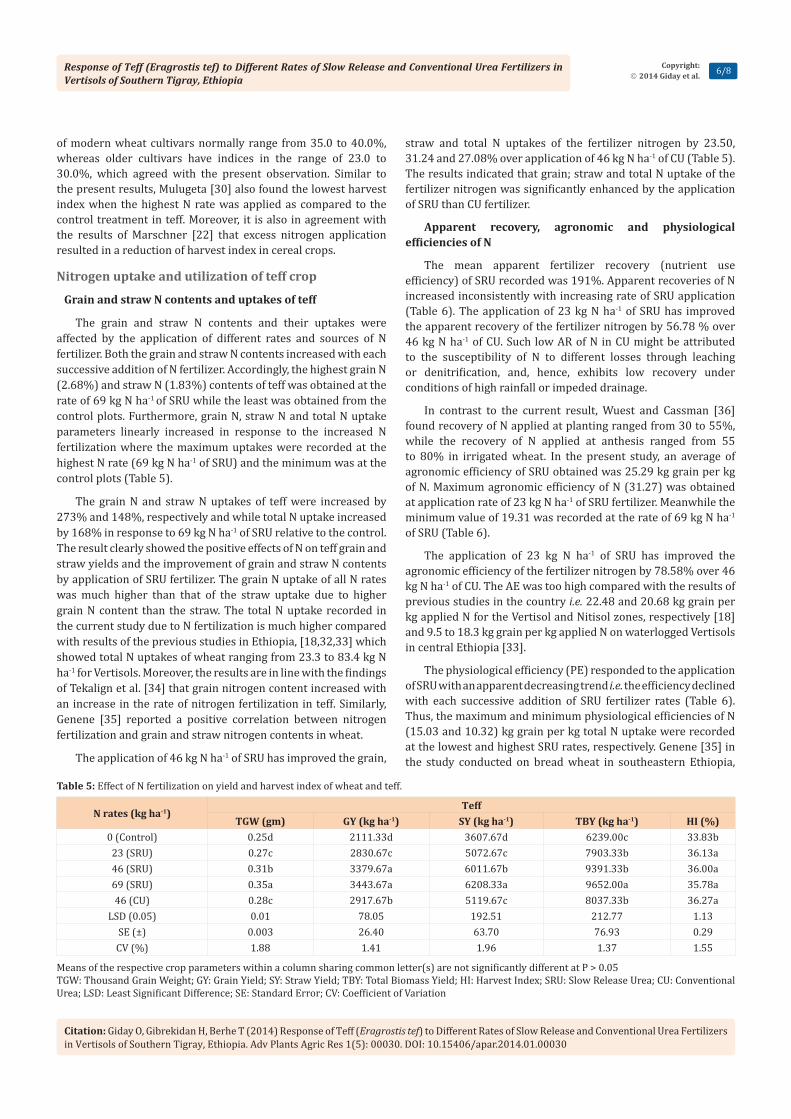
Table 5: Effect of N fertilization on yield and harvest index of wheat and teff.
Means of the respective crop parameters within a column sharing common letter(s) are not significantly different at P > 0.05 TGW: Thousand Grain Weight; GY: Grain Yield; SY: Straw Yield; TBY: Total Biomass Yield; HI: Harvest Index; SRU: Slow Release Urea; CU: Conventional Urea; LSD: Least Significant Difference; SE: Standard Error; CV: Coefficient of Variation
N rates (kg ha-1)Teff
TGW (gm) GY (kg ha-1) SY (kg ha-1) TBY (kg ha-1) HI (%)0 (Control) 0.25d 2111.33d 3607.67d 6239.00c 33.83b
23 (SRU) 0.27c 2830.67c 5072.67c 7903.33b 36.13a46 (SRU) 0.31b 3379.67a 6011.67b 9391.33b 36.00a69 (SRU) 0.35a 3443.67a 6208.33a 9652.00a 35.78a46 (CU) 0.28c 2917.67b 5119.67c 8037.33b 36.27a
LSD (0.05) 0.01 78.05 192.51 212.77 1.13SE (±) 0.003 26.40 63.70 76.93 0.29CV (%) 1.88 1.41 1.96 1.37 1.55
Response of Teff (Eragrostis tef) to Different Rates of Slow Release and Conventional Urea Fertilizers in Vertisols of Southern Tigray, Ethiopia
Citation: Giday O, Gibrekidan H, Berhe T (2014) Response of Teff (Eragrostis tef) to Different Rates of Slow Release and Conventional Urea Fertilizers in Vertisols of Southern Tigray, Ethiopia. Adv Plants Agric Res 1(5): 00030. DOI: 10.15406/apar.2014.01.00030
Copyright: 2014 Giday et al. 7/8
reported mean PE of N as low as 2.74. On the other hand, Amasl and Tanner [18] reported 47.33 kg grain per kg total N for bread wheat grown on Vertisols in central Ethiopia.
The application of 23 kg N ha-1 of SRU has improved the apparent recovery, agronomic efficiency and physiological efficiency of the fertilizer nitrogen by 56.78, 78.58 and 14.38% over 46 kg N ha-1 of CU (Table 6). Generally, the results indicated that agronomic efficiency, apparent recovery and physiological efficiency was significantly enhanced by the application of SRU fertilizer than CU fertilizer. Moreover, the application of 23 kg N ha-1 of SRU improved the agronomic efficiency and physiological efficiency of the fertilizer nitrogen than 46 and 69 kg N ha-1 of SRU. However, effectiveness of fertilizers in increasing crop yields and optimizing farmer profitability should not be sacrificed for the sake of efficiency alone. There must be a balance between optimal nutrient use efficiency and optimal crop productivity.
Summary and ConclusionsSoil degradation and depletion of soil nutrients are among
the major factor threatening sustainable cereal production in the Ethiopian highlands. Among the major plant nutrients, N is the most limiting factor calling for external inputs in the form of fertilizer. However, conventional N fertilizers are highly soluble and may be lost through the processes of leaching, NH3 volatilization, denitrification and immobilization and fixed in the soil solids as NH4-N form. Therefore, the use of slow-release urea fertilizer is a common strategy to reduce N losses.
Application of different rates and source of N fertilizer significantly (P ≤ 0.01) affected most of the crop parameters tested such as panicle length, 1000 grains weight, grain yield, straw, biomass and harvest index. Accordingly, the maximum mean grain yield of teff (3443.67 kg ha-1) was obtained at the highest rate of SRU (69 kg N ha-1) with a yield advantage of 613 and 2332.34 kg ha-1 over the 23 kg N ha-1 of SRU and the control plots, respectively, followed with SRU rate of 46 kg N ha-1 and a yield advantage of 549 and 1268.34 kg ha-1 over the 23 kg N ha-1 and the control plots, respectively. This response was mainly attributed to the medium and low OM and total N contents of the soils of the study area which demand for external N input to support proper growth and development of crops in the short run and improvements of soil OM for sustainable and/or long term productivity.
The application of 46 kg N ha-1 of SRU fertilizer has yield advantage of 462.00 kg ha-1 over the application of 46 kg N ha-1 of
CU fertilizer (Table 3). This shows that SRU can reduce N losses by leaching in the form of NO3
-, fixation as NH4, volatilization as NH3 and atmospheric emission in the form of N2O or N2. Similarly, it is reported that N fertilizer application rates on cotton have reduced by 40% if controlled release rather than conventional fertilizers are used.
The plant total N content and uptakes were linearly increased in response to the application of different rates of SRU fertilizer where the maximum values for grain and straw N contents and uptakes was obtained at the highest N rate. It was also apparent that much of the nutrients applied were assimilated by the grain than that achieved by the straw. Nitrogen apparent recovery and Physiological efficiency were decreased in response to applied SRU rates where the maximum records were observed at the lowest rate of SRU.
As a general conclusive remark, the results of the current study provide a significant indication as the application of SRU can influence yield and quality of crop residues on teff. Despite the need for verification of this study results over several locations and soil types, direct application of the findings by farmers at the study area will remain beneficial than the application of CU fertilizer provided that this SRU fertilizer is available.
References1. Mureithi JG, Mwaura PM, Nekesa CO (2000) Introduction of legume
cover crops to smallholder farms in Gatanga, Central Kenya. In: Proceedings of the Second Scientific Conference of the Soil Management and Legume Research Network Projects, pp.98-102.
2. Desta Beyene (1986) The response of pulse crops to nitrogen and phosphorus fertilizers. Paper Presented at the Workshop on Review of Soil Science Research in Ethiopia, Addis Ababa, Ethiopia, pp.11-14.
3. D’Andrea AC (2008) T’ef (Eragrostis tef) in ancient agricultural systems of Highland Ethiopia. Econ Bot 62(4): 547-566.
4. Seyfu Ketema (1997) Tef [Eragrostis tef (Zucc) Trotter]. Promoting the conservation and use of underutilized and neglected crops.12. Institute of plant Genetics and crop plant Research, Gatersleben/ International plant Genetic resources Institute, Rome, Italy.
5. CSA (Central Statistical Authority) (2011) Agricultural Sample Survey 2010/2011. Reports on area under cultivation, yield and production of major crops for 2009/10-2010/11 main (Meher) season, Ethiopia.
6. Bock BR (1984) Efficient use of nitrogen in cropping systems. In: Hauck RD (eds.), Nitrogen in crop production. ASA-CSSA-SSSA, Madison, WI, USA, pp.273-294.
7. Zhou L, Chen L, Li R, Wu Z (2003) Behavior of soil urea N and its regulation through incorporating with inhibitors hydroquinone and
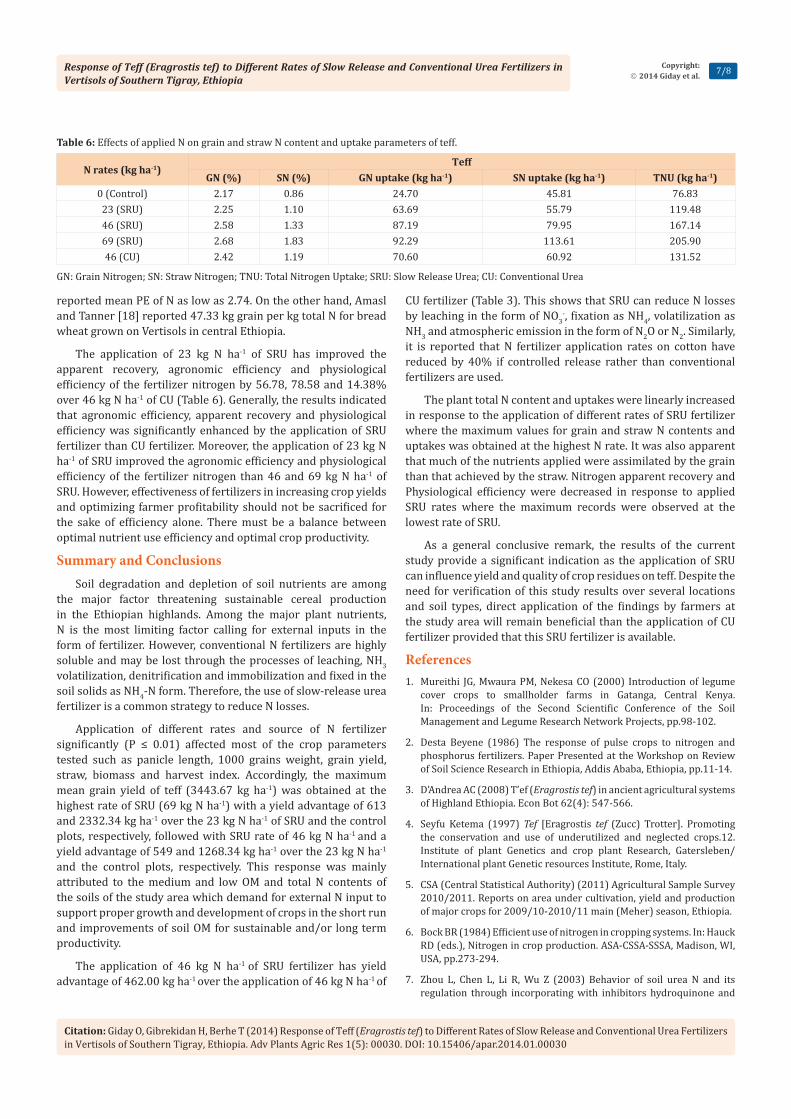
Table 6: Effects of applied N on grain and straw N content and uptake parameters of teff.
GN: Grain Nitrogen; SN: Straw Nitrogen; TNU: Total Nitrogen Uptake; SRU: Slow Release Urea; CU: Conventional Urea
N rates (kg ha-1)Teff
GN (%) SN (%) GN uptake (kg ha-1) SN uptake (kg ha-1) TNU (kg ha-1)0 (Control) 2.17 0.86 24.70 45.81 76.83
23 (SRU) 2.25 1.10 63.69 55.79 119.4846 (SRU) 2.58 1.33 87.19 79.95 167.1469 (SRU) 2.68 1.83 92.29 113.61 205.9046 (CU) 2.42 1.19 70.60 60.92 131.52

Response of Teff (Eragrostis tef) to Different Rates of Slow Release and Conventional Urea Fertilizers in Vertisols of Southern Tigray, Ethiopia
Citation: Giday O, Gibrekidan H, Berhe T (2014) Response of Teff (Eragrostis tef) to Different Rates of Slow Release and Conventional Urea Fertilizers in Vertisols of Southern Tigray, Ethiopia. Adv Plants Agric Res 1(5): 00030. DOI: 10.15406/apar.2014.01.00030
Copyright: 2014 Giday et al. 8/8
dicyandiamide. In: Ji L, Chen GX, Schnug E, Hera C, Hanklaus S (Eds.), Fertilization in the Third Millenium Fertilizer, Food Security and Environmental Protection, Proceedings, vol. II. Liaoning Science and Technology Publishing House, China, pp.1175-1192.
8. Jiao XG, Liang W, Chen L, Zhang HJ, Li Q, et al. (2004) Effect of slow-release urea fertilizers on urease activity, microbial biomass, and nematode communities in an aquic brown soil. Sci China C Life Sci 48(Suppl 1): 26-32.
9. Bacon PE (Ed.), (1995) Nitrogen Fertilization in the Environment. Marcel Dekker, Inc., CRC Press, New York, USA, pp.608.
10. Ofla District office of agriculture and rural development (ODOARD) (2011).
11. Singa SK (1977) Food legume distribution, adaptability and biology of yield. FAO, plant production and plant protection paper 3: 124.
12. Pal UR (1991) Effect of source and rate of nitrogen and phosphorus, on yield and nutrient uptake and apparent fertilizer recovery by maize in southern Guinea Sananna of Nigeria. Journal of Agricultural Science and Technology 1: 21-24.
13. Mengel K, Kirkby EA (1996) Principles of plant nutrition. Panima Publishing Corporation, New Delhi, India, pp.314.
14. Sinabo W, Gretzmacher R, Edelbauer A (2004) Genotypic variation for nitrogen use efficiency in Ethiopian barley. Field Crop Research 85(1): 43-60.
15. SAS Institute (2000) SAS User’s Guide, Statistics version 8.2 (Ed.). SAS Inst., Cary, NC, USA.
16. Tadese T, Haque I, Aduayi EA (1991) Soil, plant, water, fertilizer, animal manure and compost analysis. International Livestock Research Center for Africa, Addis Ababa, Ethiopia, B13.
17. Olsen SR, Cole CV, Watanabe FS, Dean LA (1954) Estimation of available phosphorus in soils by extraction with sodium bicarbonate. USDA Circular 939: 1-19.
18. Tarekegn A, Tanner DG (2001) Effects of fertilizer application on N and P uptake, recovery and use efficiency of bread wheat grown on two soil types in Central Ethiopia. Ethiopian Journal of Natural Resources 3(2): 219-244.
19. Yilma Z, Zewdie L, Tanner DG (1992) A study of several factors limiting wheat yields on farmers’ fields and on-station in Bale region of Ethiopia. In: Tanner, D.G. and W. Mwangi (Eds.). The Seventh Regional Wheat Workshop for Eastern, Central and Southern Africa. Nakuru, Kenya: CIMMYT, pp.510-516.
20. Geleto T, Tanner DG, Mamo T, Gebeyehu G (1996a) Response of rainfed bread and durum wheat to source, level and timing of nitrogen fertilizer at two Vertisol sites. In: The Ninth Regional Wheat Workshop for Eastern, Central and Southern Africa. Addis Ababa, Ethiopia, pp.127-147.
21. Liben M, Assefa A, Tadese T, Marye A (2004) Fertilizer response of tef
[Eragrostis tef (Zucc.)Trotter] in the different agro ecologies on Nitosol areas of northwestern Ethiopia, Adet, Ethiopia.
22. Marschner H (1995) Mineral nutrition of higher plants (2nd edn), Academic press. London, UK.
23. Batey T (1984) Plant growth and composition as predictors of N requirements. In: Nitrogen Requirement of Cereals. MOA, Fisheries and Food, Reference 385, London, UK, pp.227-232.
24. Archer J (1988) Crop Nutrition and Fertilizer Use. Farming Press Ltd. Suffolk.
25. Mossedaq F, Smith DH (1994) Time of nitrogen fertilizer application to enhance spring wheat yields in a Mediterranean climate. Agron J 86(2): 221-226.
26. Ayoub M, Guertin S, Lussier S, Smith DL (1994) Timing and levels of nitrogen fertility effects on spring wheat. Crop Science 34(3): 748-756.
27. Legesse Amsalu (2004) Responce of teff (Eragrostis Tef (Zucc.) Troffer) to applied nitrogen and phosphorus in Sirinka, North eastern Ethiopia. An Msc. Thesis, Alemaya University, pp.25-58.
28. Gooding MJ, Davies WP (1997) Wheat production and utilization system, quality and environment. CAB International, USA, pp.355.
29. Howard DD, Oosterhuis DM (1997) Programmed soil fertilizer release to meet crop nitrogen and potassium requirements in Proc. Beltwide Cotton Conferences, New Orleans, LA, pp.576.
30. Mulugeta Gezehagn (2003) Response of tef [Eragrostis tef (Zucc.) Trotter] to applied nitrogen and phosphorus in Vertisols of Raya, Tigray. An M.Sc.Thesis, Alemaya University, pp.1-60.
31. DZARC (Debre Zeit Agricultural Research Center) (1989) Annual research achievement report. Debre Zeit Ethiopia, pp.271.
32. Selamyihun K, Tanner DG, Tekalign M (1999) Effect of nitrogen fertilizer applied to teff on the yield and N response of succeeding teff and durum wheat on a highland Vertisol. African J Crop Sci 7(1): 35-46.
33. Geleto T, Tanner DG, Mamo T, Gebeyehu G (1996b) Response of rainfed bread and durum wheat to source, level and timing of nitrogen fertilizer on two Ethiopian Vertisols. II. N uptake, recovery and efficiency. Fertilizer Research 44(3): 195-204.
34. Tekalign Mamo, Teklu Erkossa (2000) Review of soil fertility and plant nutrition research on Conducted on tef. In: proceeding of the International work shop tef genetic and improvement. Addis Ababa, Ethiopia, pp.37-38.
35. Genene Gezu (2003) Yield and quality response of bread wheat (Triticum Aestivum L.) varieties to rate and time of nitrogen fertilizer application in Kulumsa, southern eastern Ethiopia. An M.Sc. Thesis, Alemaya University, pp.80-83.
36. Wuest SB, Cassman KG (1992) Fertilizer nitrogen use efficiency of irrigated wheat: Uptake efficiency of preplant versus late-season application. Agron J 84(4): 682-688.