Embed Size (px)
Citation preview
Response of iron overload to deferasirox in raretransfusion-dependent anaemias: equivalent effects onserum ferritin and labile plasma iron for haemolytic orproduction anaemiasJohn B. Porter1, Kai-Hsin Lin2, Photis Beris3*, Gian Luca Forni4, Ali Taher5, Dany Habr6,Gabor Domokos7, Bernard Roubert7, Swee Lay Thein8, on behalf of the EPIC study investigators�
1University College London, London, UK; 2National Taiwan University Hospital, Taipei, Taiwan; 3Geneva University Hospital, Geneva, Switzerland;4Ospedale Galliera, Genoa, Italy; 5American University of Beirut, Beirut, Lebanon; 6Novartis Pharmaceuticals, East Hanover, NJ, USA; 7Novartis
Pharma AG, Basel, Switzerland; 8Kings College Hospital, London, UK
Regular red blood cell (RBC) transfusions are the prin-
cipal supportive therapy for many rare anaemias.
Although transfusion requirements may vary according
to diagnosis, chronic transfusion therapy inevitably leads
Abstract
Objectives: It is widely assumed that, at matched transfusional iron-loading rates, responses to chelation
therapy are similar, irrespective of the underlying condition. However, data are limited for rare transfusion-
dependent anaemias, and it remains to be elucidated if response differs, depending on whether the anae-
mia has a primary haemolytic or production mechanism. Methods: The efficacy and safety of deferasirox
(Exjade�) in rare transfusion-dependent anaemias were evaluated over 1 yr, with change in serum ferritin
as the primary efficacy endpoint. Initial deferasirox doses were 10–30 mg ⁄ kg ⁄ d, depending on transfusion
requirements; 34 patients had production anaemias, and 23 had haemolytic anaemias. Results: Patients
with production anaemias or haemolytic anaemias had comparable transfusional iron-loading rates (0.31 vs.
0.30 mL red blood cells ⁄ kg ⁄ d), mean deferasirox dosing (19.3 vs. 19.0 mg ⁄ kg ⁄ d) and baseline median
serum ferritin (2926 vs. 2682 ng ⁄ mL). Baseline labile plasma iron (LPI) levels correlated significantly with
the transfusional iron-loading rates and with serum ferritin levels in both cohorts. Reductions in median
serum ferritin levels were initially faster in the production than the haemolytic anaemias, but at 1 yr, similar
significant reductions of 940 and 617 ng ⁄ mL were attained, respectively ()26.0% overall). Mean LPI
decreased significantly in patients with production (P < 0.0001) and haemolytic (P = 0.037) anaemias after
the first dose and was maintained at normal mean levels (<0.4 lm) subsequently. The most common
drug-related, investigator-assessed adverse events were diarrhoea (n = 16) and nausea (n = 12). Conclu-
sions: At matched transfusional iron-loading rates, the responses of rare transfusion-dependent anaemias
to deferasirox are similar at 1 yr, irrespective of the underlying pathogenic mechanism.
Key words rare anaemias; iron overload; iron chelation therapy; serum ferritin; safety
Correspondence John Porter, UCL Cancer Institute, Department of Haematology, University College London, Paul O’Gorman Building,
72 Huntley Street, WC1E 6BT London, UK. Tel: +44 207 679 6224; Fax: +44 207 679 6222; e-mail: [email protected]
*Present address: Laboratory Unilabs, Geneva, Switzerland.
�All remaining investigators who participated in the EPIC (Evaluation of Patients’ Iron Chelation with Exjade�) study are listed in the
Appendix in alphabetical order.
Accepted for publication 3 June 2011 doi:10.1111/j.1600-0609.2011.01660.x
Re-use of this article is permitted in accordance with the Terms and
Conditions set out at http://wileyonlinelibrary.com/onlineopen#Online
Open_Terms
ORIGINAL ARTICLE
European Journal of Haematology 87 (338–348)
338 ª 2011 John Wiley & Sons A/S
to iron overload that can cause significant damage to the
heart, liver and endocrine glands (1, 2). In regularly
transfused patients with b-thalassaemia, there are sub-
stantial data reporting the efficacy and safety of iron
chelation therapy to treat iron overload (3–5). Data
supporting the use of iron chelation therapy in other
transfusion-dependent anaemias such as myelodysplastic
syndromes (MDS), aplastic anaemia (AA) and sickle cell
disease (SCD) are also accumulating (4–8) and suggest
that response with respect to iron balance is mainly
dependent on chelator dose and transfusional iron-load-
ing rate (4, 9). Studies in patients with rare anaemias
related to decreased RBC production or ‘production
anaemias’ [including Diamond-Blackfan anaemia (DBA)
and pure red cell aplasia] as well as those in patients with
haemolytic anaemias have been limited (4), and response
has not been analysed with respect to the underlying
mechanism of anaemia. The 1-yr Evaluation of Patients’
Iron Chelation with Exjade� (EPIC) study enrolled a
large number of patients with a variety of transfusion-
dependent anaemias (5), thereby allowing the investiga-
tion of disease-specific considerations that might affect
iron chelation therapy with deferasirox (Exjade�; Novar-
tis Pharma AG, Basel, Switzerland). Data from patients
with rare transfusion-dependent anaemias recruited into
the EPIC study were included in these analyses.
The question as to whether the response to iron chela-
tion therapy differs if the anaemia results primarily from
decreased red cell production vs. when there is an under-
lying haemolytic mechanism remains to be answered.
The rationale for the potentially variable response is that
iron pools available for chelation may differ in haemo-
lytic anaemias from those of production anaemias as a
result of a greater rate of RBC catabolism. One
approach to interrogating the access of chelators to iron
pools is by the measurement of labile plasma iron (LPI);
a directly chelatable redox-active subfraction of plasma
non-transferrin bound iron (NTBI) (10). Cellular uptake
of NTBI, through mechanisms including calcium chan-
nels (11) and zinc transporters (12), contributes to the
iron-mediated cell damage (10, 13). NTBI and LPI are
known to increase not only as a result of iron overload
(14, 15) but also from ineffective erythropoiesis (16, 17)
and when erythropoiesis is abrogated such as following
myeloablation (18). LPI levels and the response to iron
chelation may thus differ, depending on the underlying
pathological mechanisms of anaemia. Therefore, in addi-
tion to assessing response of serum ferritin levels to
deferasirox, LPI levels have been measured before and
during iron chelation therapy. LPI levels have been com-
pared between patients with haemolytic and production
anaemias and related to the rates of transfusional iron
loading and to serum ferritin levels.
Methods
EPIC was a prospective, 1-yr, multicenter, open-label
study that enrolled 1744 iron-overloaded patients with
various transfusion-dependent anaemias, conducted across
23 countries. A full description of the study design and
overall inclusion ⁄ exclusion criteria has been published
previously (5).
Key inclusion and exclusion criteria
Patients with rare transfusion-dependent anaemias from
the EPIC study included in this study were male or
female aged ‡2 yrs and with iron overload defined as
serum ferritin levels of ‡1000 or <1000 ng ⁄mL with a
history of multiple transfusions (>20 transfusions or
1000 mL ⁄kg of RBCs) and R2 magnetic resonance imag-
ing-confirmed liver iron concentration (LIC) ‡2 mg Fe ⁄ gdry weight. These anaemias were classified as production
or haemolytic in aetiology. Production anaemias were
those where decreased red cell production was the under-
lying mechanism and included DBA and pure red cell
aplasia. Patients with AA (19), MDS (8), thalassaemia or
SCD (5) from the EPIC study were excluded from this
analysis as they have been reported elsewhere. A defini-
tion of haemolysis was not included in the EPIC study
protocol, and in this analysis, investigators have attrib-
uted haemolysis as the underlying mechanism on the
basis of either a clear diagnosis [e.g. pyruvate kinase
(PK) deficiency or autoimmune haemolytic anaemia
(AIHA)] or the presence of one or more of the following
features of haemolysis: raised reticulocyte count, raised
lactate dehydrogenase (LDH), raised bilirubin, deleted
plasma haptoglobin in addition to the absence of haem-
orrhage or production aetiology for the anaemia. Patients
(or parents ⁄ guardians) provided written informed con-
sent before entering the study, which was conducted in
accordance with Good Clinical Practice guidelines and
the Declaration of Helsinki. The study was approved
by an Institutional Review Board ⁄ Independent Ethics
Committee ⁄Research Ethics Board at each participating
site.
Deferasirox dosing
Deferasirox starting dose was individualised, based on
the frequency of blood transfusions; a starting dose of
20 mg ⁄kg ⁄d was recommended for patients receiving 2–4
RBC units ⁄month (7–14 mL ⁄kg ⁄month), 30 mg ⁄kg ⁄dfor patients receiving more frequent transfusions and
10 mg ⁄kg ⁄d for patients receiving less frequent transfu-
sions. Protocol-specified dose adjustments were made in
steps of 5–10 mg ⁄kg ⁄d (range 0–40 mg ⁄kg ⁄d), based on
3-monthly trends in serum ferritin and safety markers
Porter et al. Iron chelation therapy in rare anaemias
ª 2011 John Wiley & Sons A/S 339
[including serum creatinine, transaminases and adverse
events (AEs)]. Dose increases were recommended in
patients with baseline serum ferritin values of
>500 ng ⁄mL who had an upward trend, or in patients
with baseline serum ferritin values of >1000 ng ⁄mL who
had no downward trend after 3 months. Dose escalation
above 40 mg ⁄kg ⁄d was permitted in exceptional circum-
stances and had to be approved individually by the
Study Monitoring Committee. If serum ferritin levels fell
to £500 ng ⁄mL on two consecutive study visits, deferasi-
rox treatment was suspended until levels increased to
>500 ng ⁄mL once more.
Assessments
Serum ferritin levels were assessed every 4 wks. The
primary efficacy endpoint was the change in serum
ferritin levels from baseline to 1 yr. Secondary efficacy
endpoints included evaluation of the relationship
between dose adjustment regimens and transfusional iron
overload. Blood samples to assess changes in levels of
LPI using methods described previously (10) were taken
preadministration (i.e. at predicted daily peak) and 2 h
postdeferasirox administration, at baseline and Weeks
12, 28 and 52. Safety was evaluated throughout the study
by regular monitoring and recording of AEs, routine lab-
oratory testing and physical examination.
Statistical methods
The efficacy population included all screened patients
who had started deferasirox treatment; analysis was
based upon the intent-to-treat principle. If no serum
ferritin value was available at 1 yr, the last available
observation was used as an end-of-study assessment to
calculate the change from baseline (last-observation-
carried-forward analysis). The safety population included
all patients who had received at least one dose of study
medication. Correlations were assessed using Pearson
correlation coefficients. The reported P-values were
based on two-sided paired tests at a 5% significance level
(Student’s t-test).
Results
Patient characteristics
Of the 57 patients with rare transfusion-dependent anae-
mias, 34 had anaemia resulting from decreased red cell
production [production anaemias – pure red cell aplasia
(n = 20) and DBA (n = 14)]. Twenty-three patients had
anaemias resulting from a haemolytic process (haemo-
lytic anaemias) including: haemolytic anaemia of unchar-
acterised cause (n = 11), pyruvate kinase deficiency
anaemia (n = 5), autoimmune haemolytic anaemia (n =
4), congenital erythropoietic protoporphyria (n = 2),
hereditary haemolytic anaemia (n = 1)]. Patient charac-
teristics at baseline are shown in Table 1.
Prior chelation history
Overall, more than two-thirds of patients had received
prior chelation therapy for an approximate mean period
of 6 yrs. Deferoxamine was the most frequently used
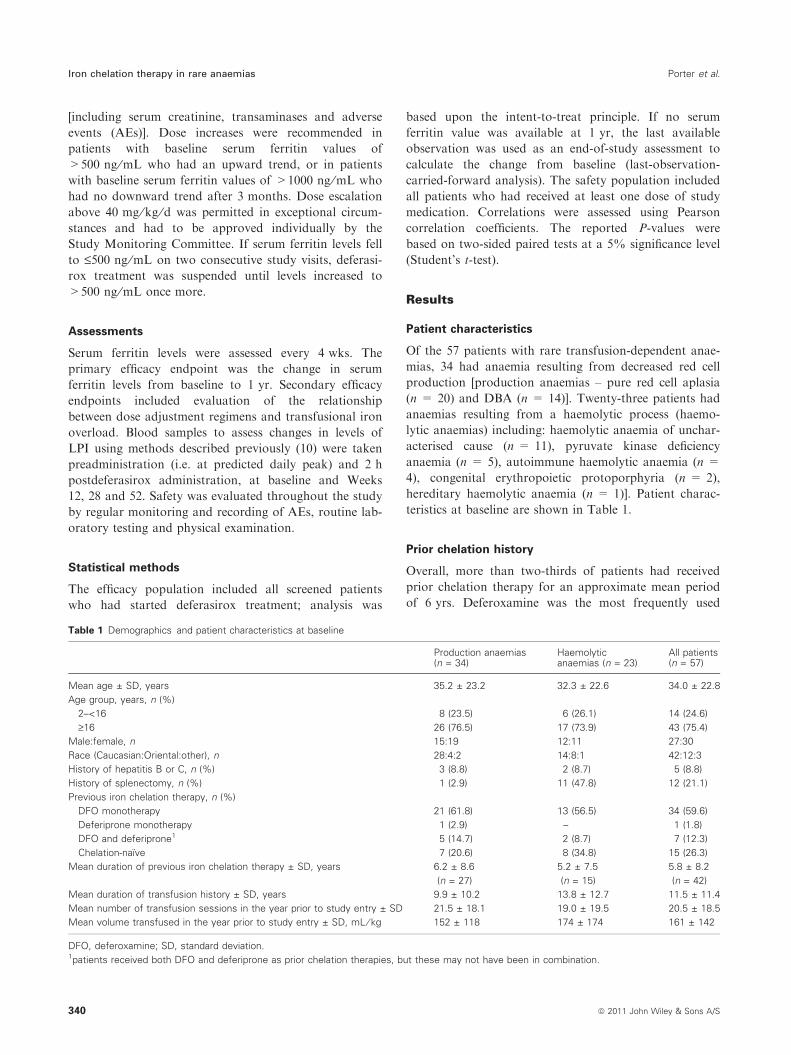
Table 1 Demographics and patient characteristics at baseline
Production anaemias(n = 34)
Haemolyticanaemias (n = 23)
All patients(n = 57)
Mean age ± SD, years 35.2 ± 23.2 32.3 ± 22.6 34.0 ± 22.8
Age group, years, n (%)
2–<16 8 (23.5) 6 (26.1) 14 (24.6)
‡16 26 (76.5) 17 (73.9) 43 (75.4)
Male:female, n 15:19 12:11 27:30
Race (Caucasian:Oriental:other), n 28:4:2 14:8:1 42:12:3
History of hepatitis B or C, n (%) 3 (8.8) 2 (8.7) 5 (8.8)
History of splenectomy, n (%) 1 (2.9) 11 (47.8) 12 (21.1)
Previous iron chelation therapy, n (%)
DFO monotherapy 21 (61.8) 13 (56.5) 34 (59.6)
Deferiprone monotherapy 1 (2.9) – 1 (1.8)
DFO and deferiprone1 5 (14.7) 2 (8.7) 7 (12.3)
Chelation-naıve 7 (20.6) 8 (34.8) 15 (26.3)
Mean duration of previous iron chelation therapy ± SD, years 6.2 ± 8.6
(n = 27)
5.2 ± 7.5
(n = 15)
5.8 ± 8.2
(n = 42)
Mean duration of transfusion history ± SD, years 9.9 ± 10.2 13.8 ± 12.7 11.5 ± 11.4
Mean number of transfusion sessions in the year prior to study entry ± SD 21.5 ± 18.1 19.0 ± 19.5 20.5 ± 18.5
Mean volume transfused in the year prior to study entry ± SD, mL ⁄ kg 152 ± 118 174 ± 174 161 ± 142
DFO, deferoxamine; SD, standard deviation.1patients received both DFO and deferiprone as prior chelation therapies, but these may not have been in combination.
Iron chelation therapy in rare anaemias Porter et al.
340 ª 2011 John Wiley & Sons A/S
therapy prior to study (Table 1). In previously chelated
patients, the mean duration of previous iron chelation
therapy was similar for production and haemolytic
anaemias (Table 1).
Deferasirox dosing and adjustments
Forty-eight patients (84.2%) started deferasirox at
20 mg ⁄kg ⁄d; 31 (91.2%) with production anaemias and
17 (73.9%) with haemolytic anaemias. The overall mean
planned dose was not different in production anaemias
(20.3 ± 3.0 mg ⁄kg ⁄d) compared with haemolytic anae-
mias (17.6 ± 4.2 mg ⁄kg ⁄d), neither was the median time
to dose increment (20 wks, range 4–48 and 20 wks, range
9–48, respectively). Final daily doses of 10, 20, 25, 30
and 40 mg ⁄kg ⁄d occurred in four, 10, five, five and one
patient in the production group and seven, seven, zero,
four and one patient in the haemolytic group. The num-
ber of patients requiring dose reductions because of
laboratory abnormalities was higher among patients with
production anaemia (n = 9, 26.5%) compared with
patients with haemolytic anaemia (n = 2, 8.7%). Simi-
larly, dose interruptions for AEs were more common in
the production (n = 14, 41.2%) than the haemolytic
cohorts (n = 6, 26.1%). The mean actual dose over 1 yr
was similar in the production (19.3 ± 5.3 mg ⁄kg ⁄d) andhaemolytic (19.0 ± 5.7 mg ⁄kg ⁄d) cohorts.
Transfusional iron loading
The mean durations of previous transfusion history were
similar for the production anaemias and haemolytic
anaemias (Table 1). The mean transfusion requirements
in the year prior to the study were also similar (Table 1)
with comparable iron-loading rates during the study
(Table 2). This is also similar to mean rates reported for
MDS and thalassaemia major in the EPIC study (5). The
rates and patient numbers differ from rare anaemias
reported in the previous EPIC paper (5) because some
patients previously classified as ‘other’ have been
included in the current analysis of rare anaemias.
Effect of deferasirox on absolute and relative serumferritin levels
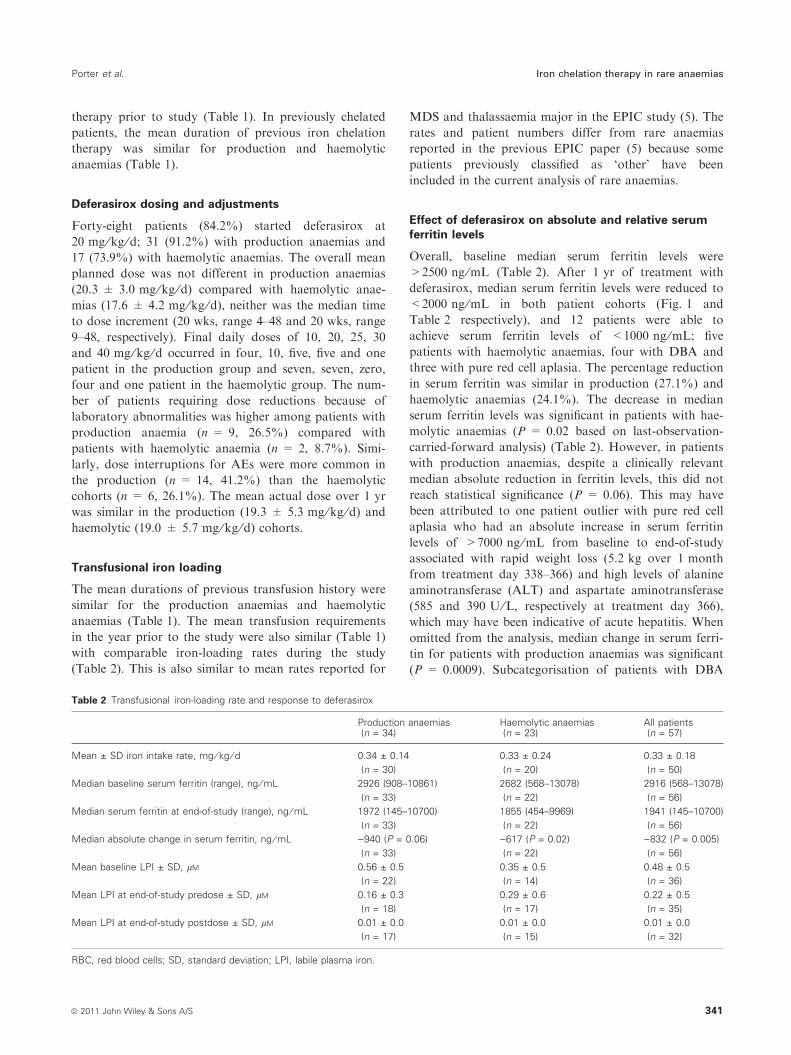
Overall, baseline median serum ferritin levels were
>2500 ng ⁄mL (Table 2). After 1 yr of treatment with
deferasirox, median serum ferritin levels were reduced to
<2000 ng ⁄mL in both patient cohorts (Fig. 1 and
Table 2 respectively), and 12 patients were able to
achieve serum ferritin levels of <1000 ng ⁄mL; five
patients with haemolytic anaemias, four with DBA and
three with pure red cell aplasia. The percentage reduction
in serum ferritin was similar in production (27.1%) and
haemolytic anaemias (24.1%). The decrease in median
serum ferritin levels was significant in patients with hae-
molytic anaemias (P = 0.02 based on last-observation-
carried-forward analysis) (Table 2). However, in patients
with production anaemias, despite a clinically relevant
median absolute reduction in ferritin levels, this did not
reach statistical significance (P = 0.06). This may have
been attributed to one patient outlier with pure red cell
aplasia who had an absolute increase in serum ferritin
levels of >7000 ng ⁄mL from baseline to end-of-study
associated with rapid weight loss (5.2 kg over 1 month
from treatment day 338–366) and high levels of alanine
aminotransferase (ALT) and aspartate aminotransferase
(585 and 390 U ⁄L, respectively at treatment day 366),
which may have been indicative of acute hepatitis. When
omitted from the analysis, median change in serum ferri-
tin for patients with production anaemias was significant
(P = 0.0009). Subcategorisation of patients with DBA
Table 2 Transfusional iron-loading rate and response to deferasirox
Production anaemias(n = 34)
Haemolytic anaemias(n = 23)
All patients(n = 57)
Mean ± SD iron intake rate, mg ⁄ kg ⁄ d 0.34 ± 0.14
(n = 30)
0.33 ± 0.24
(n = 20)
0.33 ± 0.18
(n = 50)
Median baseline serum ferritin (range), ng ⁄ mL 2926 (908–10861)
(n = 33)
2682 (568–13078)
(n = 22)
2916 (568–13078)
(n = 56)
Median serum ferritin at end-of-study (range), ng ⁄ mL 1972 (145–10700)
(n = 33)
1855 (454–9969)
(n = 22)
1941 (145–10700)
(n = 56)
Median absolute change in serum ferritin, ng ⁄ mL )940 (P = 0.06)
(n = 33)
)617 (P = 0.02)
(n = 22)
)832 (P = 0.005)
(n = 56)
Mean baseline LPI ± SD, lM 0.56 ± 0.5
(n = 22)
0.35 ± 0.5
(n = 14)
0.48 ± 0.5
(n = 36)
Mean LPI at end-of-study predose ± SD, lM 0.16 ± 0.3
(n = 18)
0.29 ± 0.6
(n = 17)
0.22 ± 0.5
(n = 35)
Mean LPI at end-of-study postdose ± SD, lM 0.01 ± 0.0
(n = 17)
0.01 ± 0.0
(n = 15)
0.01 ± 0.0
(n = 32)
RBC, red blood cells; SD, standard deviation; LPI, labile plasma iron.
Porter et al. Iron chelation therapy in rare anaemias
ª 2011 John Wiley & Sons A/S 341
also showed a significant reduction in median serum
ferritin levels from a median baseline of 2289 to
1521 ng ⁄mL at end-of-study (median absolute reduction
of 790 ng ⁄mL; P = 0.0121). It should be noted
from Fig. 1 that patients with haemolytic anaemia
experienced a transient increase in serum ferritin levels at
3 months, which subsequently decreased resulting in
comparable serum ferritin values to the production
anaemia at 1 yr.
Effect of deferasirox on labile plasma iron levels
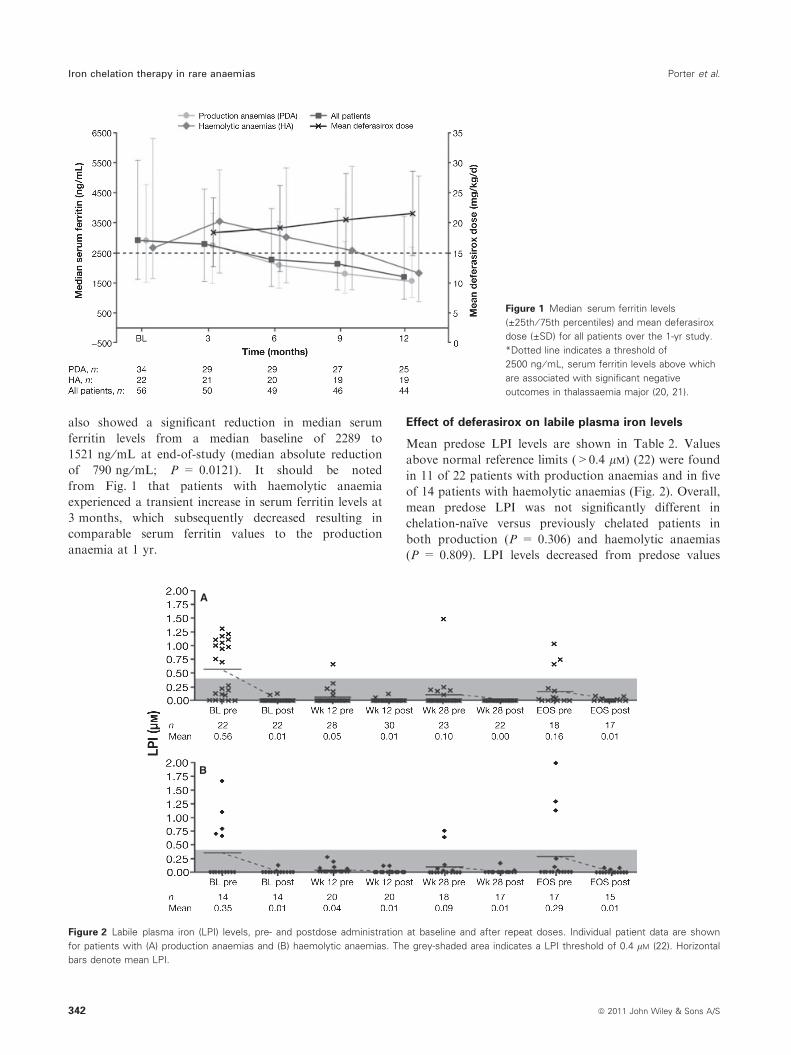
Mean predose LPI levels are shown in Table 2. Values
above normal reference limits (>0.4 lm) (22) were found
in 11 of 22 patients with production anaemias and in five
of 14 patients with haemolytic anaemias (Fig. 2). Overall,
mean predose LPI was not significantly different in
chelation-naıve versus previously chelated patients in
both production (P = 0.306) and haemolytic anaemias
(P = 0.809). LPI levels decreased from predose values
Figure 1 Median serum ferritin levels
(±25th ⁄ 75th percentiles) and mean deferasirox
dose (±SD) for all patients over the 1-yr study.
*Dotted line indicates a threshold of
2500 ng ⁄ mL, serum ferritin levels above which
are associated with significant negative
outcomes in thalassaemia major (20, 21).
A
B
Figure 2 Labile plasma iron (LPI) levels, pre- and postdose administration at baseline and after repeat doses. Individual patient data are shown
for patients with (A) production anaemias and (B) haemolytic anaemias. The grey-shaded area indicates a LPI threshold of 0.4 lM (22). Horizontal
bars denote mean LPI.
Iron chelation therapy in rare anaemias Porter et al.
342 ª 2011 John Wiley & Sons A/S
for both cohorts, with normalisation (<0.4 lm) of the
mean for all patients at all points in the study (Fig. 2).
For patients with production anaemias, the reduction in
predose LPI levels was significant after the first dose
(P < 0.0001), and at Weeks 12 (P = 0.0002), 28
(P = 0.006) and 52 (end-of-study) (P = 0.014) com-
pared with baseline. When excluding the patient with a
reported absolute increase from baseline in serum ferritin
level to >7000 ng ⁄mL, the results remained significant
(P < 0.0001, P = 0.0005, P = 0.012 and P = 0.029,
respectively). A ‘rebound’ effect was noted in some
patients at Week 52 (end-of-study) predose assessments.
Of the patients with production anaemias with predose
LPI levels >0.4 lm at Week 52 (end-of-study) (n = 3),
all had pure red cell aplasia; one patient had an increase
in serum ferritin level >7000 ng ⁄mL from baseline at
the end-of-study as previously discussed; one patient
achieved a reduction in serum ferritin levels of
1709 ng ⁄mL at end-of-study compared with baseline,
despite having a higher than average transfusion rate
(0.53 mL RBC ⁄kg ⁄d); and the third patient achieved a
reduction in serum ferritin level of 1658 ng ⁄mL and
had a lower than average transfusion rate (0.33 mL
RBC ⁄kg ⁄d). Mean deferasirox dose at end-of-study in
these three patients was 29.8, 10.6 and 28.4 mg ⁄kg ⁄d,respectively. All three patients completed the study.
For patients with haemolytic anaemias, the reductions
in predose LPI levels were significant after the first dose
(P = 0.037) and at Week 12 (P = 0.048) compared with
baseline. As with production anaemias, some patients
with haemolytic anaemia (n = 3) demonstrated a recur-
rence of LPI predose at Week 52 (end-of-study) with pre-
dose LPI levels >0.4 lm; these had underlying diagnoses
of hereditary haemolytic anaemia, acute porphyria and
pyruvate kinase deficiency, respectively. The patient with
hereditary haemolytic anaemia achieved a reduction in
serum ferritin levels of 771 ng ⁄mL but discontinued the
study because of withdrawal of consent. The remaining
two patients with end-of-study LPI values >0.4 lm com-
pleted the study, and both had increases in serum ferritin
levels compared with baseline (+1254 and +1079 ng ⁄mL, respectively) with transfusion rates lower than aver-
age (0.23 and 0.18 mL RBC ⁄kg ⁄d, respectively). Mean
deferasirox dose at end-of-study in these three patients
was 25.1, 18.9 and 28.4 mg ⁄kg ⁄d, respectively.
Relationship of baseline LPI to iron-loading rate andserum ferritin
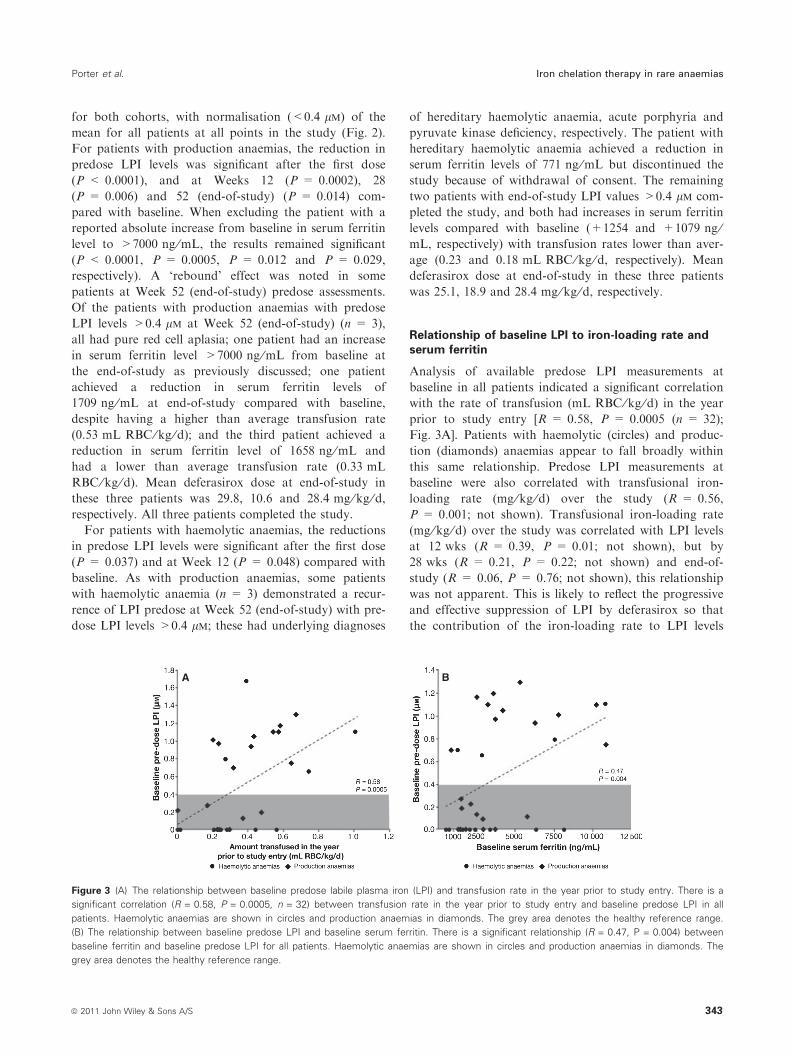
Analysis of available predose LPI measurements at
baseline in all patients indicated a significant correlation
with the rate of transfusion (mL RBC ⁄kg ⁄d) in the year
prior to study entry [R = 0.58, P = 0.0005 (n = 32);
Fig. 3A]. Patients with haemolytic (circles) and produc-
tion (diamonds) anaemias appear to fall broadly within
this same relationship. Predose LPI measurements at
baseline were also correlated with transfusional iron-
loading rate (mg ⁄kg ⁄d) over the study (R = 0.56,
P = 0.001; not shown). Transfusional iron-loading rate
(mg ⁄kg ⁄d) over the study was correlated with LPI levels
at 12 wks (R = 0.39, P = 0.01; not shown), but by
28 wks (R = 0.21, P = 0.22; not shown) and end-of-
study (R = 0.06, P = 0.76; not shown), this relationship
was not apparent. This is likely to reflect the progressive
and effective suppression of LPI by deferasirox so that
the contribution of the iron-loading rate to LPI levels
A B
Figure 3 (A) The relationship between baseline predose labile plasma iron (LPI) and transfusion rate in the year prior to study entry. There is a
significant correlation (R = 0.58, P = 0.0005, n = 32) between transfusion rate in the year prior to study entry and baseline predose LPI in all
patients. Haemolytic anaemias are shown in circles and production anaemias in diamonds. The grey area denotes the healthy reference range.
(B) The relationship between baseline predose LPI and baseline serum ferritin. There is a significant relationship (R = 0.47, P = 0.004) between
baseline ferritin and baseline predose LPI for all patients. Haemolytic anaemias are shown in circles and production anaemias in diamonds. The
grey area denotes the healthy reference range.
Porter et al. Iron chelation therapy in rare anaemias
ª 2011 John Wiley & Sons A/S 343
progressively decreased. Abnormal predose LPI values at
baseline were found only in patients with transfusional
iron-loading rates >0.2 mg ⁄kg ⁄d.Pretreatment LPI also shows a significant correlation
with baseline serum ferritin levels [R = 0.47, P = 0.0043
(n = 35); Fig. 3B]. Patients with haemolytic (circles) and
production (diamonds) anaemias appear to fall broadly
within this same relationship. This relationship of pre-
dosing LPI and serum ferritin also correlated signifi-
cantly at end-of-study (R = 0.47, P = 0.004; not
shown). However, unlike the relationship to transfusional
loading rate, there was no serum ferritin value below
which abnormal LPI values were absent (Fig. 3B).
Tolerability of deferasirox over 1 yr
Overall, 44 ⁄ 57 (77.2%) patients completed 1 yr of treat-
ment. In patients with production anaemias, six discon-
tinued (all with pure red cell aplasia) because of AEs
(increased serum creatinine, oedema, abdominal pain,
chronic renal failure, hyperpyrexia and dyspepsia), two
died (one as a result of cardiac and respiratory failure
and one as a result of bladder neoplasm, neither of
which were considered related to study drug) and one
discontinued because of a protocol violation. Two
patients from the cohort with haemolytic anaemias dis-
continued because of an AE (angioedema and choleli-
thiasis, respectively), one patient withdrew consent and
one patient discontinued because of unsatisfactory ther-
apeutic effect. The most common drug-related AEs as
assessed by investigators were gastrointestinal: diarrhoea
(28.1%), nausea (21.1%), abdominal pain (12.3%),
upper abdominal pain (10.5%), vomiting (7.0%),
abdominal distension (5.3%) and constipation (5.3%).
Other AEs assessed by the investigators were as follows:
increased serum creatinine (12.3%), rash (10.5%), ALT
increases (8.8%), fatigue (8.8%), pruritus (5.3%) and
dizziness (5.3%). There were no serious AEs considered
by the investigators to be drug-related in either patient
cohort.
When strict criteria of a > 33% creatinine increase
and a value greater than upper limit of normal on two
consecutive occasions were used, eight patients had such
an increase, three with production anaemias and five
with haemolytic anaemias. For the patients with haemo-
lytic anaemias, three received dosing reductions as a
result, from 20 to 10 mg ⁄kg ⁄d (n = 2) and from 30 to
20 mg ⁄kg ⁄d (n = 1). Serum creatinine levels then
decreased and these patients completed the study. The
other two patients completed the study without any dose
alterations. Of the three patients with production anae-
mias (all with pure red cell aplasia), one continued the
study without any dose alterations (although serum cre-
atinine levels remained high but subsequently discontin-
ued because of dyspepsia). For the other two patients,
the deferasirox dose was initially reduced from 20 to
10 mg ⁄kg ⁄d. Following dose reduction, serum creatinine
levels decreased in one of these, but remained high com-
pared with baseline levels, resulting in eventual discontin-
uation from the study.
In total, four patients received cyclosporine. Two
patients completed the study without drug discontinua-
tion; one (described above) received a dose reduction
because of serum creatinine levels (>33% above baseline
and greater than upper limit of normal on two consec-
utive visits); the other patient had a stable serum creati-
nine level throughout the study (baseline serum
creatinine of 57 lm; range throughout the study 55–
65 lm). Two of the four patients receiving concomitant
cyclosporine discontinued, one discontinued because of
chronic renal failure having experienced elevated creati-
nine (105 and 146 lm on study days 1 and 196, respec-
tively). This patient also experienced multiple AEs
during the study including pancytopenia, bronchitis, pos-
tallograft lymphoproliferative syndrome and persistent
fever that were not considered to be related to chelation
therapy by the study investigator. The second patient
discontinued because of cardiac ⁄ respiratory failure.
ALT levels >10· upper limit of normal on two con-
secutive visits were seen in two patients with DBA. These
patients also had elevated ALT levels at baseline (301
and 130 U ⁄L) but had no reported history of hepatitis
B ⁄C. The investigators did not adjust dose and both
patients completed the study, with end-of-study ALTs of
154 and 92 U ⁄L. One patient with pure red cell aplasia,
who also had a raised baseline ALT (254 U ⁄L), devel-
oped ALT levels >10· upper limit of normal on two
consecutive visits and subsequently discontinued because
of abdominal pain.
Discussion
This is the first study to examine how responses of rare
transfusion-dependent anaemias to deferasirox chelation
are affected by the underlying production or haemolytic
mechanisms. Because of their rarity, such patients may
not be monitored or treated as consistently as those with
thalassaemia major (23). In this study, even though many
patients had received prior chelation, in over half of the
patients, baseline serum ferritin values were at levels typi-
cally associated with negative outcomes in thalassaemia
major (20, 21). Reductions in serum ferritin levels were
clinically relevant for both production and haemolytic
anaemias, supporting a dosing approach tailored to base-
line serum ferritin measurements with subsequent dose
adjustment, based on serum ferritin trend analysis every
3 months. Overall, the mean transfusional iron-loading
rates, doses of deferasirox received and final serum ferri-
Iron chelation therapy in rare anaemias Porter et al.
344 ª 2011 John Wiley & Sons A/S
tin responses were similar in production and haemolytic
anaemias, suggesting no fundamental difference in chela-
tion response.
The delayed serum ferritin response in the haemolytic
group relative to the production group is of interest. The
mechanism is not clear but may relate to a higher propor-
tion of iron being present in the reticuloendothelial com-
partment in haemolytic anaemias compared with
production anaemias. Serum ferritin up to values of
4000 lg ⁄L is predominantly derived from macrophages of
the reticuloendothelial system (24). The higher rate of red
cell catabolism within macrophages of haemolytic patients
may result in continued high ferritin synthesis in this com-
partment, even when iron is being effectively chelated
within hepatocytes. There is also some evidence using liver
biopsies which suggests faster iron chelation by deferasi-
rox from hepatocytes compared with macrophages in the
initial stages of chelation therapy (Yves Deugnier, per-
sonal communication). Both of these effects would mean
that serum ferritin decrements would tend to lag behind
decrements in LIC, particularly with haemolytic anae-
mias. However, the similar serum ferritin values in the
haemolytic and production anaemias at 1 yr suggest that
macrophage iron is eventually accessed as effectively in
haemolytic anaemias as in production anaemias.
In patients with DBA, the reduction in serum ferritin
was comparable to other anaemias in the EPIC study,
but in a previous Phase II study, serum ferritin decre-
ments were less than in other patients (including patients
with b-thalassaemia and MDS) (4). This was previously
attributed to comparatively higher transfusional iron
intake for DBA patients (4), but here, the iron-loading
rates for DBA (0.37 ± 0.12 mg ⁄kg ⁄d) are similar
to other rare anaemias and may explain why the serum
ferritin response is also similar.
The measurement of LPI may give insights into the
effectiveness and duration of action of chelation therapy
(22), but its value in the routine monitoring of iron over-
load and chelation therapy remains unclear. Deferasirox
produces sustained decrements in LPI in b-thalassaemia
(25) and MDS (26–28), but this is the first time that LPI
levels have been assessed in rare transfusion-dependent
anaemias. The correlation of LPI with the transfusional
rate has not been previously reported in any form of
transfusional iron overload and suggests that the transfu-
sional loading rate may be an important factor in deter-
mining plasma levels of iron species responsible for
pathological iron distribution. Once deferasirox chelation
is ongoing, LPI is largely determined by the plasma levels
of chelator (22); thus, no correlation between LPI and
iron intake rate was observed at later time points. Previ-
ous studies have provided indirect evidence linking chelat-
able iron (as assessed by urine iron with deferoxamine
therapy) and myocardial iron (29). As LPI is a key chelat-
able form of plasma iron, the findings here suggest a link
could also exist between transfusional loading rates and
the risk of myocardial iron loading from LPI or other
NTBI species. As myocardial T2* was not measured in
this study, this merits systematic investigation.
The correlation of baseline LPI with serum ferritin is
consistent with findings in untransfused b-thalassaemia ⁄haemoglobin E (15) but has not been previously demon-
strated in transfusion-dependent anaemias. Despite the
relationship of LPI with serum ferritin, there was no clear
ferritin ‘cut-off’ below which LPI was always in the nor-
mal range (Fig. 3B). Conversely, LPI was often within
the normal range (<0.4 lm) even though ferritin values
exceeded 1000 ng ⁄mL (Fig. 3B). It is noteworthy that in
a previous study of AA (19), LPI was not increased at
baseline, despite similar mean iron-loading rates to the
production anaemias described in this study. The reason
is unclear and requires further investigation. As with thal-
assaemia major (25), there was an immediate postdosing
decrease in LPI, but unlike thalassaemia major patients
in the EPIC study (30), all rare transfusion-dependent
anaemias had values in the normal range after the first
dose. The predosing trough levels are clearly decreased at
12 wks, but at end-of-study assessments, there was a
‘rebound’ in some patients. As the removal of LPI by
deferasirox correlates with drug concentrations (25), the
measurement of trough levels in patients with unex-
plained late LPI resurgence may be helpful in establishing
whether inadequate drug exposure, either from reduced
compliance or drug absorption, is responsible.
Deferasirox was generally well tolerated with predomi-
nantly gastrointestinal and rash-related AEs, consistent
with other anaemias such as b-thalassaemia and SCD
(4, 7, 31) as well as the overall EPIC study (5). Renal
and hepatic safety were managed using monitoring rec-
ommendations in line with the product label for deferasi-
rox (4, 5, 32). Increments in serum creatinine levels
>33% above baseline and greater than upper limit of
normal were generally managed with dose decreases
and ⁄or interruptions and without subsequent progressive
increments in plasma creatinine. More patients with pro-
duction anaemias or, more specifically, those with pure
red cell aplasia, discontinued the study as compared with
haemolytic anaemias, and these patients also experienced
a higher frequency of AEs, dose reductions and dose
interruptions. The reasons are not obvious but may
relate to previous treatments and ⁄or drug exposure. For
example, two patients with pure red cell aplasia, requir-
ing discontinuation, were receiving concomitant cyclo-
sporine, which may have contributed to the rise in serum
creatinine (33). A rise in creatinine with deferasirox ther-
apy, more than 33% above baseline and above upper
limit of normal, was previously noted to be three times
as likely in patients with AA also receiving concomitant
Porter et al. Iron chelation therapy in rare anaemias
ª 2011 John Wiley & Sons A/S 345
cyclosporine (19). Careful monitoring is therefore advis-
able for patients receiving concomitant cyclosporine or
other potentially nephrotoxic medications.
In conclusion, these data provide evidence that trans-
fusional iron overload in patients with a variety of rare
anaemias may be effectively managed using a tailored
dosing deferasirox regimen, based on individual blood
transfusion requirements, regular monitoring of serum
ferritin trends and safety parameters. These data also
indicate that, for patients with similar rates of transfu-
sional iron loading, the trends in serum ferritin and LPI
reduction following treatment with deferasirox are essen-
tially the same, irrespective of the underlying condition
requiring chronic blood transfusions.
Acknowledgements
This study was sponsored by Novartis Pharma AG.
Financial support for medical editorial assistance was
provided by Novartis Pharmaceuticals. We thank
Rebecca Helson, PhD for medical editorial assistance
with this manuscript.
Disclosures
J Porter reports receiving consulting fees, research grant
funding and lecture fees from Novartis Pharmaceuticals.
K-H Lin reports receiving lecture fees from Novartis
Pharmaceuticals. P Beris reports receiving research grant
funding and honoraria from Novartis Pharmaceuticals.
GL Forni reports receiving research grant funding from
Novartis Pharmaceuticals. A Taher and SL Thein report
receiving research grant support and lecture fees from
Novartis Pharmaceuticals. D Habr, G Domokos and
B Roubert are full-time employees of Novartis Pharma-
ceuticals.
References
1. Kushner JP, Porter JP, Olivieri NF. Secondary iron over-
load. Hematology Am Soc Hematol Educ Program
2001;47–61http://asheducationbook.hematologylibrary.
org/archive/index.dtl. Accessed July 22, 2011.
2. Takatoku M, Uchiyama T, Okamoto S, et al. Retrospec-
tive nationwide survey of Japanese patients with transfu-
sion-dependent MDS and aplastic anemia highlights the
negative impact of iron overload on morbidity ⁄mortality.
Eur J Haematol 2007;78:487–94.
3. Borgna-Pignatti C, Rugolotto S, De Stefano P, et al. Sur-
vival and complications in patients with thalassemia major
treated with transfusion and deferoxamine. Haematologica
2004;89:1187–93.
4. Porter J, Galanello R, Saglio G, et al. Relative response
of patients with myelodysplastic syndromes and other
transfusion-dependent anaemias to deferasirox (ICL670):
a 1-yr prospective study. Eur J Haematol 2008;80:168–76.
5. Cappellini MD, Porter JB, El-Beshlawy A, et al. Tailoring
iron chelation by iron intake and serum ferritin trends:
the prospective multicenter EPIC study of deferasirox in
1744 patients with various transfusion-dependent anemias.
Haematologica 2010;95:557–66.
6. Park SJ, Han CW. Complete hematopoietic recovery after
continuous iron chelation therapy in a patient with severe
aplastic anemia with secondary hemochromatosis. J
Korean Med Sci 2008;23:320–3.
7. Vichinsky E, Onyekwere O, Porter J, et al. A randomized
comparison of deferasirox versus deferoxamine for the
treatment of transfusional iron overload in sickle cell
disease. Br J Haematol 2007;136:501–8.
8. Gattermann N, Finelli C, Della Porta M, et al. Deferasi-
rox in iron-overloaded patients with transfusion-dependent
myelodysplastic syndromes: Results from the large 1-year
EPIC study. Leuk Res 2010;34:1143–50.
9. Cohen AR, Glimm E, Porter JB. Effect of transfusional
iron intake on response to chelation therapy in b-thalasse-mia major. Blood 2008;111:583–7.
10. Esposito BP, Breuer W, Sirankapracha P, Pootrakul P,
Hershko C, Cabantchik ZI. Labile plasma iron in iron
overload: redox activity and susceptibility to chelation.
Blood 2003;102:2670–7.
11. Oudit GY, Sun H, Trivieri MG, et al. L-type Ca2+
channels provide a major pathway for iron entry into
cardiomyocytes in iron-overload cardiomyopathy. Nat
Med 2003;9:1187–94.
12. Liuzzi JP, Aydemir F, Nam H, Knutson MD, Cousins
RJ. Zip14 (Slc39a14) mediates non-transferrin-bound iron
uptake into cells. Proc Natl Acad Sci USA 2006;103:
13612–7.
13. Porter J. Pathophysiology of iron overload. Hematol
Oncol Clin North Am 2005;19(Suppl 1):7–12.
14. Porter JB, Abeysinghe RD, Marshall L, Hider RC, Singh
S. Kinetics of removal and reappearance of non-transfer-
rin-bound plasma iron with deferoxamine therapy. Blood
1996;88:705–13.
15. Pootrakul P, Breuer W, Sametband M, Sirankapracha P,
Hershko C, Cabantchik ZI. Labile plasma iron (LPI) as
an indicator of chelatable plasma redox activity in iron-
overloaded b-thalassemia ⁄HbE patients treated with an
oral chelator. Blood 2004;104:1504–10.
16. Wickramasinghe SN, Thein SL, Srichairatanakool S,
Porter JB. Determinants of iron status and bilirubin levels
in congenital dyserythropoietic anaemia type 1. Br J
Haematol 1999;107:522–5.
17. Gafter-Gvili A, Prokocimer M, Breuer W, Cabantchik IZ,
Hershko C. Non-transferrin-bound serum iron (NTBI) in
megaloblastic anemia: effect of vitamin B12 treatment.
Hematol J 2004;5:32–4.
18. Bradley SJ, Gosriwitana I, Srichairatanakool S, Hider RC,
Porter JB. Non-transferrin-bound iron induced by myelo-
ablative chemotherapy. Br J Haematol 1997;99:337–43.
Iron chelation therapy in rare anaemias Porter et al.
346 ª 2011 John Wiley & Sons A/S
19. Lee J-W, Yoon S-S, Shen ZX, Ganser A, Hsu H-C, Habr
D, Domokos G, Roubert B, Porter JB. Iron chelation
therapy with deferasirox in patients with aplastic anemia:
a subgroup analysis of 116 patients from the EPIC trial.
Blood 2010;116:2448–54.
20. Olivieri NF, Nathan DG, MacMillan JH, Wayne AS, Liu
PP, McGee A, Martin M, Koren G, Cohen AR. Survival
in medically treated patients with homozygous b-thalasse-mia. N Engl J Med 1994;331:574–8.
21. Olivieri NF, Brittenham GM. Iron-chelating therapy and
the treatment of thalassemia. Blood 1997;89:739–61.
22. Cabantchik ZI, Breuer W, Zanninelli G, Cianciulli P.
LPI-labile plasma iron in iron overload. Best Pract Res
Clin Haematol 2005;18:277–87.
23. Roggero S, Quarello P, Vinciguerra T, Longo F, Piga A,
Ramenghi U. Severe iron overload in Blackfan-Diamond
anemia: a case-control study. Am J Hematol 2009;84:729–
32.
24. Worwood M, Cragg SJ, Jacobs A, McLaren C, Ricketts C,
Economidou J. Binding of serum ferritin to concanavalin A:
patients with homozygous beta thalassaemia and transfu-
sional iron overload. Br J Haematol 1980;46:409–16.
25. Daar S, Pathare A, Nick H, Kriemler-Krahn U, Hmissi
A, Habr D, Taher A. Reduction in labile plasma iron
during treatment with deferasirox, a once-daily oral iron
chelator, in heavily iron-overloaded patients with
b-thalassaemia. Eur J Haematol 2009;82:454–7.
26. List AF, Baer MR, Steensma D, Raza A, Esposito J,
Virkus J, Paley C, Feigert J, Besa EC. Iron chelation with
deferasirox (Exjade�) improves iron burden in patients
with myelodysplastic syndromes (MDS). Blood
2008;112:abst 634.
27. Greenberg PL, Koller CA, Glynos T, Paley C, Schiffer C.
Change in liver iron concentration (LIC), serum ferritin
(SF) and labile plasma iron (LPI) over 1 year of deferasi-
rox (Exjade�) therapy in a cohort of patients with MDS.
Leuk Res 2009;33(Suppl 1):S120 (abst P104).
28. Ghoti H, Fibach E, Merkel D, Perez-Avraham G, Grisariu S,
Rachmilewitz EA. Changes in parameters of oxidative stress
and free iron biomarkers during treatment with deferasirox
in iron-overloaded patients with myelodysplastic syn-
dromes. Haematologica 2010;95:1433–4.
29. Jensen PD, Jensen FT, Christensen T, Eiskjaer H, Baand-
rup U, Nielsen JL. Evaluation of myocardial iron by
magnetic resonance imaging during iron chelation therapy
with deferrioxamine: indication of close relation between
myocardial iron content and chelatable iron pool. Blood
2003;101:4632–9.
30. Porter JB, Cappellini MD, El-Beshlawy A, et al. Effect of
deferasirox (Exjade�) on labile plasma iron levels in heav-
ily iron-overloaded patients with transfusion-dependent
anemias enrolled in the large-scale, prospective 1-year
EPIC trial. Blood 2008;112:abst 3881.
31. Cappellini MD, Cohen A, Piga A, et al. A phase 3 study
of deferasirox (ICL670), a once-daily oral iron chelator, in
patients with b-thalassemia. Blood 2006;107:3455–62.
32. EXJADE� (deferasirox) US Prescribing Information.
2010. Available at: http://www.pharma.us.novartis.com/
product/pi/pdf/exjade.pdf.
33. Burdmann EA, Andoh TF, Yu L, Bennett WM. Cyclo-
sporine nephrotoxicity. Semin Nephrol 2003;23:465–76.
Appendix
Participating centres and investigators
L. Agaoglu, Istanbul University, Medical Faculty, Capa,
Istanbul, Turkey; G. Alimena, Az. Policlinico Umberto
I, Roma, Italy; D. Alonso, Hospital Universitario Vir-
gen del Rocio, Sevilla, Spain; S. Ame, Hopital Hautepi-
erre, Strasbourg, France; E. Angelucci, Ospedale
Oncologico A. Businco, Cagliari, Italy; B. Arrizabalaga,
Hospital de Cruzes, Barakaldo, Spain; M. Athanasiou-
Metaxa, Aristotle University of Thessaloniki, Thessalo-
niki, Greece; B. Augustson, Sir Charles Gairdner
Hospital, Perth, Australia; Y. Aydinok, Ege University,
Medical Faculty, Bornova, Izmir, Turkey; A. Baba,
Hospital University Sains Malaysia, Kota Bahru,
Malaysia; M. Baccarani, Az. Ospedaliera di Bologna,
Malpighi, Bologna, Italy; J. Beck, Klinikum der Univer-
sitat Mainz, Mainz, Germany; O. Beyne-Rauzy, Hopital
Purpan, Toulouse, France; H. Birgens, Amtssygehuset i
Herlev, Herlev, Denmark; D. Bordessoule, CHU
Limoges, Limoges, France; C. Borgna-Pignatti, Az. Osp.
Universitaria Sant’Anna, Ferrara, Italy; A. Bosly,
Cliniques Universitaires U.C.L., Godinne, Belgium; K.
Bouabdallah, CHU Bordeaux, Bordeaux, France; D.
Bowden, Monash Medical Centre, Melbourne, Austra-
lia; D. Bowen, Leeds General Infirmary, Leeds, UK; D.
Bron, Institut Jules Bordet, Brussels, Belgium; M. D.
Cappellini, Universita di Milano, Ca Granda Founda-
tion IRCCS, Milan, Italy; M. Capra, Ospedale Civico
G. di Cristina M. Ascoli, Palermo, Italy; G. Cartron,
Clinique Victor Hugo, Le Mans, France; M. Cazzola,
Policlinico S. Matteo IRCCS, Pavia, Italy; C. Chalkias,
General Hospital of Larissa, Larissa, Greece; L. L.
Chan, University Malaya Medical Centre, Kuala Lum-
pur, Malaysia; S. Chancharunee, Ramathibodi Hospital,
Mahidol University, Bangkok, Thailand; C. Chapman,
Leicester Royal Infirmary, Leicester, UK; P. Charoenk-
wan, Chiang Mai University, Chiang Mai, Thailand; E.
Chasapopoulou, University Hospital of Thessaloniki
AHEPA, Thessaloniki, Greece; S. Cheze, CHR Clemen-
ceau, Caen, France; A. Chuansumrit, Ramathibodi Hos-
pital, Mahidol University, Bangkok, Thailand; P.
Cianciulli, Ospedale S. Eugenio, Roma, Italy; C. Dauri-
ac, CHRU Rennes, Hopital Pontchaillou, Rennes,
France; M. Delforge, UZ Gasthuisberg, Leuven,
Belgium; G. Dolken, Ernst-Moritz-Arndt-Universitat
Greifswald, Greifswald, Germany; H. Dombret, Hopital
Porter et al. Iron chelation therapy in rare anaemias
ª 2011 John Wiley & Sons A/S 347
Saint Louis, Paris, France; J. Duyster, Klinikum rechts
der Isar der TU Munchen, Munchen, Germany; T. Eco-
nomopoulos, Athens University Medical School, Xaidar-
i, Greece; G. Ehninger, Universitatsklinikum Dresden,
Dresden, Germany; M. Elalfy, Ain Shams University,
Cairo, Egypt; A. El-Beshlawy, Cairo University, Cairo,
Egypt; L. Enggaard, Hillerod Sygehus, Hillerod, Den-
mark; P. Fenaux, Hopital Avicenne, Bobigny, France;
G. Fillet, Centre Hospitalier Universitaire Sart Tilman,
Liege, Belgium; A. Filosa, Az. Osp. A. Cardarelli,
Napoli, Italy; R. Galanello, Ospedale Regionale Micro-
citemie, Cagliari, Italy; A. Ganser, Kliniken der Med.
Hochschule Hannover, Hannover, Germany; G. Gastl,
Uni-Klinik Innsbruck, Innsbruck, Austria; N. Gatter-
mann, Heinrich-Heine-University, Dusseldorf, Germany;
S. Giraudier, Hopital Henri Mondor, Creteil, France;
A. Goldfarb, Hadassah Medical Centre, Jerusalem,
Israel; A. Grigg, Royal Melbourne Hospital, Melbourne,
Australia; A. Guerci-Bresler, CHU Nancy, Vandoeuvre
Les Nancy, France; F. Gumruk, Hacettepe University,
Medical Faculty, Sihhiye, Ankara, Turkey; S. Y. Ha,
Queen Mary Hospital, Hong Kong, Hong Kong; D.
Haase, Universitatsklinikum Gottingen, Gottingen, Ger-
many; B. Heinrich, Gemeinschaftspraxis Brudler ⁄Hein-
rich, Ausburg, Germany; M. Hertzberg, Westmead
Hospital, Sydney, Australia; J. Ho, Royal Prince Alfred
Hospital, Sydney, Australia; H-C. Hsu, Taipei Veterans
General Hospital, Taipei, Taiwan; S. Huang, Guang
Zhou Zhong Shan No.2 Hospital, Guangzhou, China;
M. Hunault-Berger, CHU d’Angers, Angers, France; B.
Inusa, Evelina Childrens Hospital, London, UK; D. Ja-
ulmes, Hopital Saint Antoine-Paris, Paris, France; J.
Jensen, Arhus Sygehus, Arhus, Denmark; A. Kattamis,
First Department of Pediatrics, University of Athens,
Athens, Greece; Y. Kilinc, Cukurova University, Medi-
cal Faculty, Balcali, Adana, Turkey; K-H. Kim, Sam-
sung Medical Centre, Seoul, South Korea; S. Kinsey, St
James’ University Hospital, Leeds, UK; L. Kjeldsen,
Rigshospitalet, Copenhagen, Denmark; A. Koren, Ha’e-
mek Medical Centre, Afula, Israel; M. E. Lai, Ospedale
Regionale Microcitemie, Cagliari, Italy; Y. Lai, No.1
hospital of Nanjing Medical University, Nanjing, China;
J-W. Lee, The Catholic University of Korea, Seoul,
South Korea; K-H. Lee, Asan Medical Centre, Seoul,
South Korea; S-H. Lee, Royal Adelaide Hospital, A-
delaide, Australia; L. Legros, Hopital de l’Archet, CHU
de Nice, Nice, France; C. Li, Guang Zhou Nang Fang
Hospital, Guangzhou, China; C-K. Li, Prince of Wales
Hospital, Chinese University of Hong Kong, Hong
Kong; Q. Li, Shanghai No.1 Hospital, Shanghai, China;
W. Linkesch, Med. Univ. Klinik Graz, Graz, Austria;
M. Lubbert, Universitatsklinikum, Freiburg, Germany;
D. Lutz, A.O. Krankenhaus der Elisabethinen, Linz,
Austria; A. J. Mohamed Thalha, Hospital Universiti
Kebangsaan, Kuala Lumpur, Malaysia; G. Mufti,
King’s College Hospital, London, UK; P. Muus, UMC
St. Radboud, Nijmegen, The Netherlands; F. Nobile,
Az. Osp. Bianchi Melacrino Morelli, Reggio Calabria,
Italy; H. Ozsahin, Children’s Hospital, Geneva, Switzer-
land; N. Papadopoulos, Aristotle University of Thessa-
loniki, Thessaloniki, Greece; S. Perrotta, l Policlinico ll
Universita di Napoli, Napoli, Italy; M. Petrini, Az. Osp.
Ospedali Riuniti S. Chiara, Pisa, Italy; M. Pfeilstocker,
Hanusch-Krankenhaus, Wien, Austria; A. Piga, Ospe-
dale Regina Margherita, Torino, Italy; J. Poole, Johan-
nesburg Hospital, Johannesburg, South Africa; E.
Pungolino, Az, Osp. Niguarda Ca’ Granda – Universita
degli Studi di Milano, Milan, Italy; G. Quarta, Ospedale
A. Perrino, Brindisi, Italy; C. Ravoet, H.H. Jolimont
Lobbes (Jolimont), La Louviere, Belgium; A. F. Rema-
cha, Hospital de la Santa Creu i San Pau, Barcelona,
Spain; C. Rose, Hopital Saint-Vincent de Paul (Groupe
Francophone des Myelodysplasies), Lille, France; L.
Roy, Centre Jean Bernard, Poitiers, France; G. Saglio,
Az. Sanitaria Ospedale S. Luigi Gonzaga, Orbassano,
Italy; G. Sanz, Hospital La Fe, Valencia, Spain; M.
Schmid, Universitat Ulm, Ulm, Germany;
M. Schmugge, Kinderspital Zurich, Zurich, Switzerland;
H. Schots, Universitair Ziekenhuis Gent, Gent, Belgium;
G. Secchi, Ospedale Civile, Azienda USL 1, Sassari,
Italy; J. F. Seymour, Peter MacCallum Cancer Centre,
Melbourne, Australia; F. Shah, Whittington Hospital,
London, UK; H. Shah, General Hospital Kuala Lum-
pur, Kuala Lumpur, Malaysia; Z. Shen, Shang Hai Rui
Jin Hospital, Shanghai, China; B. Slama, Centre Hospit-
alier General, Avignon, France; P. Sutcharitchan, Chul-
alongkorn University, Bangkok, Thailand; H. Tamary,
Schneider Children’s Medical Centre, Petach Tikva,
Israel; K. Taylor, Mater Hospital, Brisbane, Australia;
H-J. Tesch, Onkologische Gemeinschaftspraxis, Frank-
furt, Germany; J. Troncy, Hopital Edouard Herriot,
Lyon, France; D. Vassilieff, Hopital Cochin, Paris,
France; A. Villegas, Hospital Clinico Universitario San
Carlos, Madrid, Spain; V. Viprakasit, Siriraj Hospital,
Mahidol University, Prannok, Bangkoknoi, Bangkok,
Thailand; L. Wainwright, Chris Hani Baragwanath Hos-
pital, Johannesburg, South Africa; B. Wassmann, Joh-
ann Wolfgang Goethe Universitat Frankfurt, Frankfurt,
Germany; M. Wettervald, CHU Dunkerque, Dunker-
que, France; A. Will, Manchester Children’s Hospital,
Pendlebury, UK; B. Wormann, Stadt. Klinikum Braun-
schweig, Braunschweig, Germany; J. Wright, Royal
Hallamshire Hospital, Sheffield, UK; S-P. Yeh, China
Medical University Hospital (Taichung), Taichung,
Taiwan; S-S. Yoon, Seoul National University Hospital,
Seoul, South Korea; N. C. Zoumbos, Patras University
Medical School, Patras IRO, Greece; S. Zweegman,
VUMC, Amsterdam, The Netherlands.
Iron chelation therapy in rare anaemias Porter et al.
348 ª 2011 John Wiley & Sons A/S