Embed Size (px)
Citation preview

Response of High-Rise Buildings under Long
Period Earthquake Ground Motions
Taiki Saito Toyohashi University of Technology, Toyohashi, Japan
Email: [email protected]
Abstract—During the 2011 Great East Japan Earthquake,
high-rise buildings in Tokyo, Nagoya and Osaka swayed
vigorously and caused damage to non-structural elements
such as with the falling of ceiling panels. Those cities are
located near deep layers of sediment and such conditions
can create long period ground motions of low frequency
even when far from the epicenter of an earthquake. These
low frequency waves can travel backwards and forwards
through the sediment upon meeting hard obstacles like rock,
creating ground movement that resonates with tall
structures causing them to sway and topple. In this report,
the performance of high-rise buildings during the 2011
Great East Japan Earthquake is presented first. Then, the
safety of high-rise buildings with long period ground
motions in a massive earthquake that may arise in the
future is discussed.
Index Terms—high-rise building, long period earthquake
Earthquake
I. INTRODUCTION
The impact of long period ground motions on large
scale structures was the focus of attention for the first
time nationwide with the 2003 Tokachi-Oki Earthquake.
Severe damage to oil storage tanks due to fires and the
sinking of floating roofs occurred in the city of
Tomakomai, which is 220km from the quake epicenter
[1]. The cause of the damage was due to the resonance
phenomena by matching the liquid sloshing period of a
tank and the long period component of the ground motion
of around 7sec that was generated in the deep
sedimentary plain. In response to this damage, the
seismic design spectra for the liquid sloshing of oil
storage tanks in the Fire Service legislation in Japan was
revised in 2005 by modifying the spectral amplitudes in
the long period range. Damage to high-rise buildings due
to long period ground motions was also reported for the
Mid Niigata Prefecture Earthquake in 2004. Six elevators
were damaged and one of eight main cables in an elevator
was cut in a 54-story high-rise building in Tokyo, located
250km from the epicenter. Since then, many
seismologists have conducted simulations of long period
ground motions in the Tokyo, Osaka and Nagoya areas in
the event of massive earthquakes, such as the Tokai,
Tonankai and Nankai Earthquakes [2]. The intensities of
Manuscript received December 1, 2015; revised February 1, 2016.
some simulated ground motions are much larger than the
level of earthquake ground motion stipulated in the
Building Standard Law in Japan. A number of studies
have been conducted on the safety of large scale
structures relating to long period ground motions. In 2006,
the Japan Society of Civil Engineering (JSCE) and the
Architectural Institute of Japan (AIJ) submitted “Joint
recommendations on earthquake resistance of civil
engineering and building structures against long period
ground motions caused by subduction earthquakes”. AIJ
published a book entitled “Structural Response and
Performance for Long Period Seismic Ground Motions”
in 2007 [3].
Figure 1. Natural period of deep ground by the central disaster
prevention council of the japanese government (2008)
The Central Disaster Prevention Council of the
Japanese Government published a map (Fig. 1) on the
natural period of deep ground and the predominant period
of long period ground motion in 2008. In addition, the
Headquarters for Earthquake Research Promotion
(HERP) of the Japanese government issued Long Period
Ground Motion Hazard Maps in 2009 and 2012. The
Ministry of Land, Infrastructure, Transport and Tourism
(MLIT) started the Promotional Project for Upgrading the
Building Standards in 2009 and one of the primary topics
was the “Study on the effect of long period earthquake
ground motions to the super-high-rise buildings”. In this
308© 2016 Int. J. Struct. Civ. Eng. Res.
International Journal of Structural and Civil Engineering Research Vol. 5, No. 4, November 2016
doi: 10.18178/ijscer.5.4.308-314
ground motion, seismic safety, Great East Japan

project, empirical formulas to evaluate long period
earthquake ground motions for building design were
proposed and a large number of simulation studies were
conducted for high-rise and seismically isolated buildings
under hypothetical Nankai-Tonankai-Tokai connected
earthquakes [4].
II. PERFORMANCE OF HIGH-RISE BUILDINGS AT THE
2011 GREAT EAST JAPAN EARTHQUAKE
The Building Research Institute (BRI) has been
conducting strong motion observation for buildings since
1957. During the 2011 Great East Japan Earthquake,
strong motion records were collected at 54 stations
located throughout Japan from Hokkaido to the Kansai
area (see Fig. 2). Table I shows the list of high-rise
buildings under observation and the maximum
acceleration values observed in the buildings. Fig. 3
shows the velocity response spectra of the horizontal
records at the lowest levels of the high-rise buildings in
Miyagi, Tokyo and Osaka cities [5]. The velocity
response spectra in Miyagi and Tokyo have a strong
component in the wide band period from 0.5 second to 10
seconds. On the other hand, the response spectrum in
Osaka has a peak period of 6-7 seconds. This means that
the long period ground motion was generated in the deep
semimetal soil in the Osaka basin. Since the natural
period of Building H is 6 seconds which is close to the
dominant period of the ground motion, the response was
amplified due to the resonance effect.
Figure 2. Locations of buildings under earthquake response observation by BRI and name of cities with high-rise buildings
Figure 3. Velocity response spectra in different cities in Japan [5]
TABLE I. LIST OF HIGH-RISE BUILDINGS WITH OBSERVED ACCELERATION RECORDS AT THE 2011 GREAT EAST JAPAN EARTHQUAKE (FROM BRI)
Location Structural Type Structural system
Floor Δ (km) Location of Sensors
Acc. (cm/s2)
H1 H2 V
A Miyagi S Normal B2F
15F
175 B2F 163 259 147
15F 361 346 543
B Saitama S Control 26F
P2F
378 B3F 74 63 42
10FS 119 138 62
10FN 118 155 66
P1FS 248 503 107
P1FC 265 686 185
C Tokyo
S Normal
B4F
20F P1F
386 01F 90 86 45
20B 208 148 173
19C 179 133 130
D Tokyo
S Control B4F 21F
386 B4F 75 71 49
13F 137 113 72
21F 121 131 104
E Tokyo RC Normal 37F
385 01F 87 98 41
18F 118 141 64
37F 162 198 108
F Kanagawa S Normal B3F 23F
P1F
412 B2F 60 - 30
23F 162 - 72
G Osaka S Normal B3F 15F
759 B3F 11 9 5
P3F 65 38 7
H Osaka S Normal 52F
P3F
770 01F 35 33 80
18F 41 38 61
38F 85 57 18
52FN 127 88 13
52FS 129 85 12
309© 2016 Int. J. Struct. Civ. Eng. Res.
International Journal of Structural and Civil Engineering Research Vol. 5, No. 4, November 2016

Figure 4. Displacement records of high-rise buildings in Tokyo and Osaka cities (from BRI)
Fig. 4 shows the displacement records observed on
different floors of high-rise buildings in Tokyo and Osaka
cities. Whereas the maximum displacement at the top
floor of Building E in Tokyo, 385 km away from the
epicenter, was 24 cm, the large floor movement of 136
cm amplitude was observed at the 52th floor of Building
H in Osaka, 770 km away from the epicenter.
In Building H, all 32 lifts stopped and a number of
people were trapped in four of them. Damage to non-
structural members such as the falling of gypsum boards
and ceiling panels were observed extensively.
(a) The first natural frequency
(b) The first mode damping factor
Figure 5. Vibration characteristics of the building E (EW direction)
III. VIBRATION CHARACTERISTICS OF A
HIGH-
Using strong motion records captured during the main
shock of the 2011 Great East Japan Earthquake, the
vibration characteristics of a reinforced concrete high-rise
building (Building E) was identified [6]. We obtained
continuous strong motion records for this building from
May 2007 which has provided us with 130 records
including the main shock of the 2011 Great East Japan
Earthquake. Using all of these records, system
identification was performed to obtain a time series of
vibration characteristics such as the first natural
frequency and the first mode damping factor of the
building as shown in Fig. 5. The first natural frequency
declined about 20% and the first mode damping factor
increased 2-4% in EW direction of the building after the
2011 Great East Japan Earthquake. This change is
considered to be due to the cracks of structural elements
that occurred during the main shock. Accordingly, by
analyzing the strong motion observation records, it is
possible to reveal the damage to the building.
Figure 6. Lumped mass model of the building E
The time history analysis of Building E was conducted
using a lumped mass model with a nonlinear shear spring
in each story which represents the nonlinear relationship
between the story shear force Q and the story drift δ by
the tri-linear hysteresis model as shown in Fig. 6. The
values of mass, stiffness and the skeleton curve of
hysteresis were taken from structural design drawings.
The first natural period of this model was calculated as
2.0sec which coincides with the identified natural period
before the 2011 event.
The observation record of the main shock of the 2011
Great East Japan Earthquake at the basement (EW
310© 2016 Int. J. Struct. Civ. Eng. Res.
International Journal of Structural and Civil Engineering Research Vol. 5, No. 4, November 2016
VALUATION OF
ISE UILDINGR B

direction) was adopted as an input ground motion. The
dynamic response of the buildings was calculated using
Newmark’s β method (β = 0.25) for numerical integration
[7]. Regarding the damping matrix, three different
damping types were used for comparison:
Type 1(○): 0KC
Type 2(●): pKC
Type 3(□): MKC 0
Type 1 is the proportional damping to the initial
stiffness matrix 0K , Type 2 is the proportional damping
to the nonlinear stiffness matrix pK , and Type 3 is
Rayleigh damping using the initial stiffness matrix 0K
and the mass matrix M .
For each case of damping type, the maximum absolute
acceleration and the maximum story drift of each story
obtained from the analysis were plotted in Fig. 7. The
observed acceleration values obtained by the
accelerometers on the 18th floor and the 37th floor are
also plotted by the cross mark (×) in the same Figure.
Type 2 damping (●) gives relatively good results for the
maximum acceleration at the 18th floor. On the other
hand, the maximum story drift of Type 2 damping is
larger than those of other damping types and reaches
around 1/250 in the middle stories. The displacement
response on 37th floor in EW direction using Type 2
damping is shown in Fig. 8. The analytical results match
quite well with the observed records. The relationship
between story shear force and story drift is shown in Fig.
9 for the 1st, 18th and 37th stories. The responses
exceeded the crack points in the 1st and 18th stories and
stiffness degradation was observed. This result explains
the reduction of the natural frequency of the building
observed after the 3.11 event as shown in Fig. 5 resulting
from minor cracks in structural members.
Figure 7. Maximum response of building E (EW direction) with different damping types
-30
-15
0
15
30
0 100 200 300 400 500 600
Dis
p. (c
m)
Time (s)
Observed record Analysis
-30
-15
0
15
30
100 110 120 130 140 150 160 170 180 190 200
Dis
p. (c
m)
Time (s)
Observed record Analysis
Figure 8. Displacement response of building E (EW direction, 37 floor) with type 2 damping
311© 2016 Int. J. Struct. Civ. Eng. Res.
International Journal of Structural and Civil Engineering Research Vol. 5, No. 4, November 2016
th

Figure 9. Relationship between story shear and story drift of building E (EW direction) with type 2 damping
Figure 10. Test specimen of a RC high-rise building
Figure 11. Crack distribution and the maximum story drift
IV. E-DEFENSE TEST OF A REINFORCED CONCRETE
HIGH-RISE BUILDING UNDER LONG PERIOD GROUND
EARTHQUAKE
Shaking table tests were carried out at an E-Defense
facility to verify the dynamic response characteristics of a
one fourth scaled 20 story high-rise reinforced concrete
building specimen under long-period ground motions [8],
[9]. Fig. 10 illustrates the elevation of the test specimen.
Table II shows the excitation cases. At the final excitation
(Case 3-5), the maximum story drift angle was 1/35 at the
eighth floor and extensive cracks were observed (Fig. 11).
The seismic design regulation of high-rise buildings in
Japan requires a limit to the maximum story drift angle of
less than 1/100 under the safety level of design
earthquake. Therefore, the test results demonstrate the
damage to the building is far exceeds the safety level.
TABLE II. EXCITATION CASES AND MAXIMUM STORY DRIFT
OBTAINED FROM THE TEST
Case Ratio Max. Story Drift Angle
Observed record at the 2011
Great East Japan earthquake
in Tokyo
1-5 100% 1/234
2-2 200% 1/137
2-6 300% 1/86
Simulation wave at Tokai- Tonankai-Nankai earthquake
3-2 150% 1/64
3-5 200% 1/35
Nonlinear frame analysis was carried out using
STERA_3D to simulate the test results. STERA_3D is
integrated computer software for the seismic analysis of
steel and reinforced concrete buildings in three
dimensional space developed by the author and
distributed for free for research and educational purposes
[10]. STERA_3D has a visual interface to create a
building model and show the results easily and rapidly.
Fig. 12 shows the element models used in STERA_3D.
A beam is modelled as a line element with nonlinear
flexural springs at both ends. The degrading tri-linear slip
model is used for the hysteresis. A column is modelled in
a similar manner, and nonlinear interaction between axial
force and moment is expressed using axial springs of
concrete and steel arranged in sections at both ends.
The purpose of the simulation analysis is to clarify the
effect of the following three factors on the results.
1) Slab contribution to the flexural behavior of a beam:
To consider slab contribution of stiffness and
strength to the flexural behavior of a beam, 10% of
312© 2016 Int. J. Struct. Civ. Eng. Res.
International Journal of Structural and Civil Engineering Research Vol. 5, No. 4, November 2016
the beam length is generally adopted as the effective
slab width (see Fig. 13). However, test results
suggested the contribution of the full slab width to
the flexural strength of the beam.
2) Slip behavior in the flexural hysteresis of a beam:
Fig. 14 shows the shear-rotation relationship of the
6F beam from the test results. The hysteresis loop
contains a slip property.
3) P-Delta effect: Since the story drift angle is limited
to less than 1/100 in the seismic design regulation of
high-rise buildings, the P-Delta effect is generally
neglected in the analysis. However, in the test
results, the maximum story drift reached 1/35 and it
is necessary to examine the effect of P-Delta.
Figure 12. Nonlinear member models used in STERA_3D
Figure 13. Slab contribution to the flexure of beam
Figure 14. Shear-rotation relationship of 6F beam
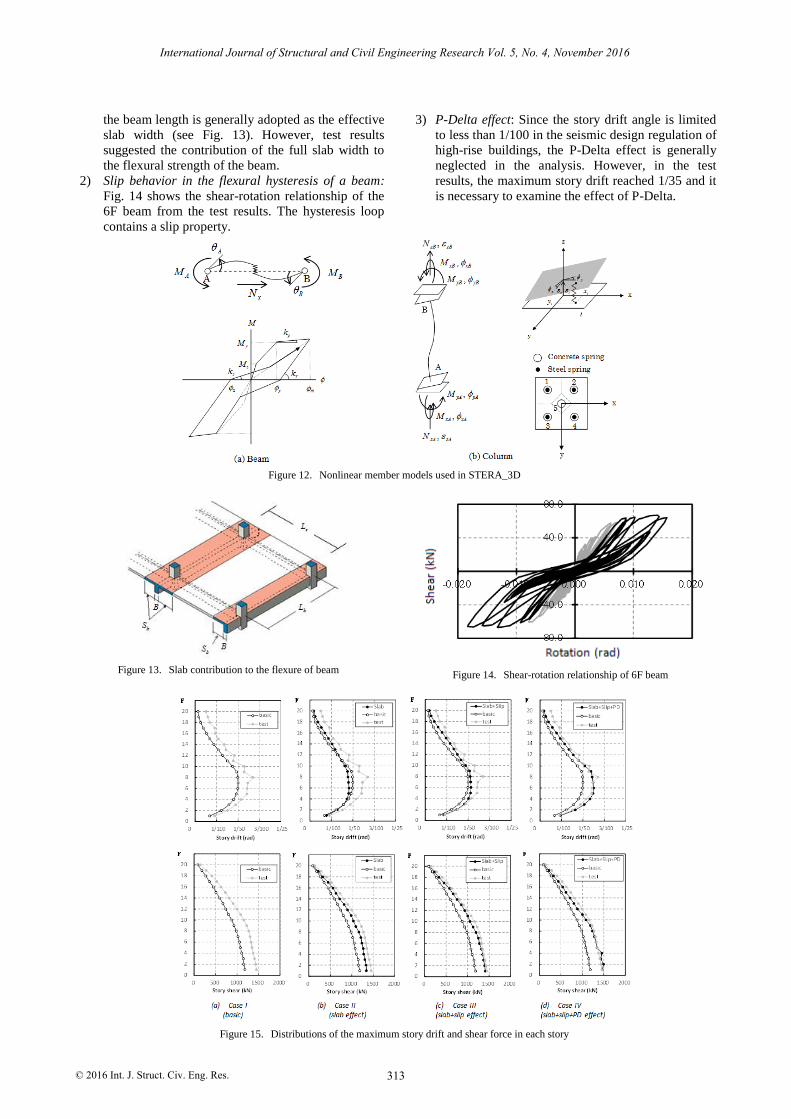
Figure 15. Distributions of the maximum story drift and shear force in each story
313© 2016 Int. J. Struct. Civ. Eng. Res.
International Journal of Structural and Civil Engineering Research Vol. 5, No. 4, November 2016

Distributions of the maximum story drift and story
shear force are compared between test results and
analysis results to examine the effect of the above factors
in Fig. 15. There are four cases in the analyses.
Analysis Case I is the “basic” case with a slab effect of
10% of beam length, no slip behavior, and no P-Delta
effect. As shown in Fig. 15, the results of this case are
shown below the test results.
Analysis Case II is the “Slab” case with a full slab
effect, no slip behavior, and no P-Delta effect. As shown
in Fig. 15, by considering the full slab effect, the story
drift becomes smaller than the “basic” case, however, the
story shear increases.
Analysis Case III is the “Slab+Slip” case with a full
slab effect, slip behavior, and no P-Delta effect. As
shown in Fig. 15, by considering slip behavior, the story
drift becomes larger than the “basic” case.
Analysis Case IV is the “Slab+Slip+PD” case with a
full slab effect, slip behavior, and P-Delta effect. As
shown in Fig. 15, by considering all three factors, the
analysis results become close to the test results.
V. CONCLUSION
The responses of high-rise buildings during the 2011
Great East Japan Earthquake were discussed based on the
strong motion observation records. The responses
calculated by the time history analysis of a 37-story
reinforced concrete high-rise building (Building E) using
a lumped mass model matched quite well with the
observed records. The analytical also explained the
reduction of the natural period of the building after the
2011 event as a result of minor cracks in structural
members. Therefore, in the range of minor damage, it
was successful to simulate the behavior of a high-rise
building by an analytical model.
On the other hand, as demonstrated by the E-defense
shaking table test, it was difficult to simulate the behavior
of a high-rise building in large nonlinear response range
by using a conventional analytical model. From the
parametric studies conducted by STERA_3D, it was
found that several factors in the analysis such as the slab
contribution to the beam flexibility, the slip behavior in
the flexural hysteresis of beam elements, and the P-Delta
effect must be considered to simulate the large nonlinear
response of the high-rise building.
REFERENCES
314© 2016 Int. J. Struct. Civ. Eng. Res.
International Journal of Structural and Civil Engineering Research Vol. 5, No. 4, November 2016
[1] S. Zama, H. Nishi, M. Yamada, and K. Hatayama, “Damage of oil storage tanks caused by liquid sloshing in the 2003 tokachi oki
earthquake and revision of design spectra in the long-period
range,” in Proc. 14th World Conference of Earthquake Engineering, Beijing, China, 2008.
[2] Y. Yamamoto and C. Yoshimura, “Long-period ground motion simulation of tokai-tonankai-nankai coupled earthquake based on
large-scale 3D FEM,” in Proc. 15th World Conference of
Earthquake Engineering, Lisbon, Portugal, 2012.[3] Architectural Institute of Japan, Structural Response and
Performance for Long Period Seismic Ground Motions, 2007.[4] I. Okawa, T. Satoh, T. Sato, and T. Nishikawa, “An empirical
evaluation of long-period earthquake motion for building design,”
in Proc. 15th World Conference of Earthquake Engineering, Lisbon, Portugal, 2012.
[5] T. Saito, K. Morita, T. Kashima, and T. Hasegawa, “Performance of high-rise buildings during the 2011 Great East Japan
Earthquake,” in Proc. 15th World Conference of Earthquake
Engineering, Lisbon, Portugal, 2012.[6] T. Saito, S. Tanaka, and K. Morita, “Identification of vibration
characteristics of a reinforced concrete high-rise building damaged due to an earthquake,” in Proc. Japan Concrete Institute,
Takamatsu, Japan, 2014.
[7] A. K. Chopra, Dynamics of Structures Theory and Applications to Earthquake Engineering, Prentice Hall, 2007.
[8] K. Sugimoto, H. Katsumata, H. Fukuyama, T. Saito, and T. Kabeyasawa, “Earthquake resistant performance of high-rise
reinforced concrete buildings under long-period ground motions,”
in Proc. 15th World Conference of Earthquake Engineering, Lisbon, Portugal, 2012.
[9] K. Sugimoto, et al., “Shaking table test of 1/4 scaled 20 story RC building under long period ground motions,” in Proc. Summaries
of Technical Papers of Annual Meeting Architectural Institute of
Japan, Sapporo, Japan, 2013.[10] T. Saito. STERA_3D Software. [Online]. Available:
http://www.rc.ace.tut.ac.jp/saito/software-e.html