Embed Size (px)
Citation preview
i
RESPONSE OF ASYMMETRIC ISOLATED BUILDINGS UNDER BI-DIRECTIONAL EXCITATIONS OF NEAR-FAULT GROUND MOTIONS
A THESIS SUBMITTED TO THE GRADUATE SCHOOL OF NATURAL AND APPLIED SCIENCES
OF MIDDLE EAST TECHNICAL UNIVERSITY
BY
HATİCE EDA FİTOZ
IN PARTIAL FULFILLMENT OF THE REQUIREMENTS FOR
THE DEGREE OF MASTER OF SCIENCE IN
CIVIL ENGINEERING
FEBRUARY 2012
ii
Approval of the thesis:
RESPONSE OF ASYMMETRIC ISOLATED BUILDINGS UNDER BI-DIRECTIONAL EXCITATIONS OF NEAR-FAULT GROUND MOTIONS
Submitted by HATİCE EDA FİTOZ in partial fulfillment of the requirements for the degree of Master of Science in Civil Engineering Department, Middle East Technical University by,
Prof. Dr. Canan ÖZGEN _____________________ Dean, Graduate School of Natural and Applied Sciences
Prof. Dr. Güney ÖZCEBE _____________________ Head of Department, Civil Engineering
Prof. Dr. Uğurhan AKYÜZ Supervisor, Civil Engineering Dept., METU _____________________
Examining Committee Members:
Assoc. Prof. Dr. Murat Altuğ ERBERİK _____________________ Civil Engineering Dept., METU
Prof. Dr. Uğurhan AKYÜZ _____________________ Civil Engineering Dept., METU
Prof. Dr. Ahmet YAKUT _____________________ Civil Engineering Dept., METU
Assoc. Prof. Dr. Alp CANER _____________________ Civil Engineering Dept., METU
Yük. Müh. Eser REYHANOĞULLARI _____________________ SPM Mühendislik Date: 07.02.2012

iii
I hereby declare that all information in this document has been obtained and presented in accordance with academic rules and ethical conduct. I also declare that, as required by these rules and conduct, I have fully cited and referenced all material and results that are not original to this work.
Name, Last name: Hatice Eda FİTOZ
Signature :
iv
ABSTRACT
RESPONSE OF ASYMMETRIC ISOLATED BUILDINGS UNDER BI-
DIRECTIONAL EXCITATIONS OF NEAR-FAULT GROUND MOTIONS
FİTOZ, Hatice Eda
M.S., Department of Civil Engineering
Supervisor: Prof.Dr. Uğurhan AKYÜZ
February 2012, 72 pages
Isolator displacements, floor accelerations, roof displacements, base shear and
torsional moments are basic parameters that are considered in the design of
seismically isolated structures. The aim of this study is to evaluate the effects of bi-
directional earthquake excitations of near fault records on the response of base
isolated structures in terms of basic parameters mentioned above. These parameters
computed from nonlinear response history analysis (RHA) and they are compared
with the parameters computed from equivalent lateral force procedure (ELF). Effect
of asymmetry in superstructure is also examined considering mass eccentricity at
each floor level. Torsional amplifications in isolator displacements, floor
accelerations, roof displacements and base shear are compared for different level of
eccentricities. Two buildings with different story heights are used in the analyses.
uuuu
v
The building systems are modeled in structural analysis program SAP2000. The
scaling of ground motion data are taken from the study of “Response of Isolated
Structures Under Bi-directional Excitations of Near-fault ground Motions” (Ozdemir,
2010). Each ground motion set (fault normal and fault parallel) are applied
simultaneously for different range of effective damping of lead rubber bearing (LRB)
and for different isolation periods.
Keywords: Seismic isolation, nonlinear response history analysis (RHA), near-fault
ground motion, bi-directional excitation, lead rubber bearing.
vi
ÖZ
SİSMİK İZOLASYON UYGULANAN ASİMETRİK YAPILARIN YAKIN
KAYNAKLI VE ÇİFT DOĞRULTULU DEPREM HAREKETLERİ ALTINDAKİ
DAVRANIŞLARININ İNCELENMESİ
FİTOZ, Hatice Eda
Yüksek Lisans, İnşaat Mühendisliği Bölümü
Tez Yöneticisi: Prof. Dr. Uğurhan AKYÜZ
Şubat 2012, 72 sayfa
İzolatör deplasmanları, kat ivmeleri, çatı ötelenmeleri,taban kesme kuvvetleri ve
burulma momentleri sismik izolatörlü yapıların tasarlanmasında göze alınan önemli
parametrelerdir. Bu çalışmanın amacı, sismik izolasyon uygulanan yapıların yakın
kaynaklı ve her iki doğrultulu deprem hareketleri altındaki davranışlarının yukarıda
bahsedilen parametreler bazında incelenmesidir. Doğrusal olmayan dinamik
analizlerden elde edilen bu parametreler eşdeğer yanal kuvvet yöntemi yardımıyla
hesaplanan değerler ile karşılaştırılmıştır. Üst yapıdaki düzensizliğin kıyaslanan
değerler üzerindeki etkisi, her kat seviyesinde kütle eksenelliğinin olduğu kabul
edilerek verilmiştir. Analizlerde farklı kütle eksenelliği değerleri incelenmiştir. Farklı
kütle eksenellik değerleri için bulunan izolatör deplasmanlarında,kat ivmelerinde,
ssss

vii
çatı ötelenmelerinde ve taban kesme kuvvetlerinde oluşacak burulma etkisi de
incelenmiştir. Analizlerde kat yüksekliği farklı iki betonarme bina, SAP2000 adlı
yapısal analiz programı kullanılarak modellenmiştir. Bu tezde kullanılan deprem
ölçeklendirme değerleri “Response of Isolated Structures Under Bi-directional
Excitations of Near-fault ground Motions” (Ozdemir, 2010) adlı çalışmadan
alınmıştır. Elde edilen sonuçlar farklı etkili sönümlenme değerleri ve izolasyon
periyotları için incelenmiştir.
Anahtar Kelimeler: Sismik izolasyon, doğrusal olmayan dinamik analiz, yakın
kaynaklı depremler, çift doğrultulu analiz, kurşun çekirdekli kauçuk yastık.

viii
DEDICATION
To my beautiful family and my mother…

ix
ACKNOWLEDGMENTS
I would like to express my gratitude to my supervisor Prof. Dr. Uğurhan AKYÜZ for
his guidance, encouragement and friendship throughout this study.
I am very grateful to my friends Fulya ATASOY, Ilknur YILMAZ and the other
member of “EL 15” group for their beautiful friendship. Their help makes things
easier.
I would also like to thank Ferda ALKAN, Berker Yalın İMAMOĞLU, Hasan
Hüseyin BALCI, Özgün İlke SEZGİN and Sülen Nur KİTAPÇIGİL for their support,
encouragement and patience in my work and in my life.
I would like to give my sincere thanks to Ahmet KUŞYILMAZ for his support and
friendship from the high school to now. Also I would like to thank Gökhan
ÖZDEMİR for his comments, help and friendship throughout this study.
Finally, I want to thank to my beautiful family: I drive on my way with the light of
you. It is a big pleasure being a part of my family. No word can explain my respect
and love against you. Thank you, just being there.
x
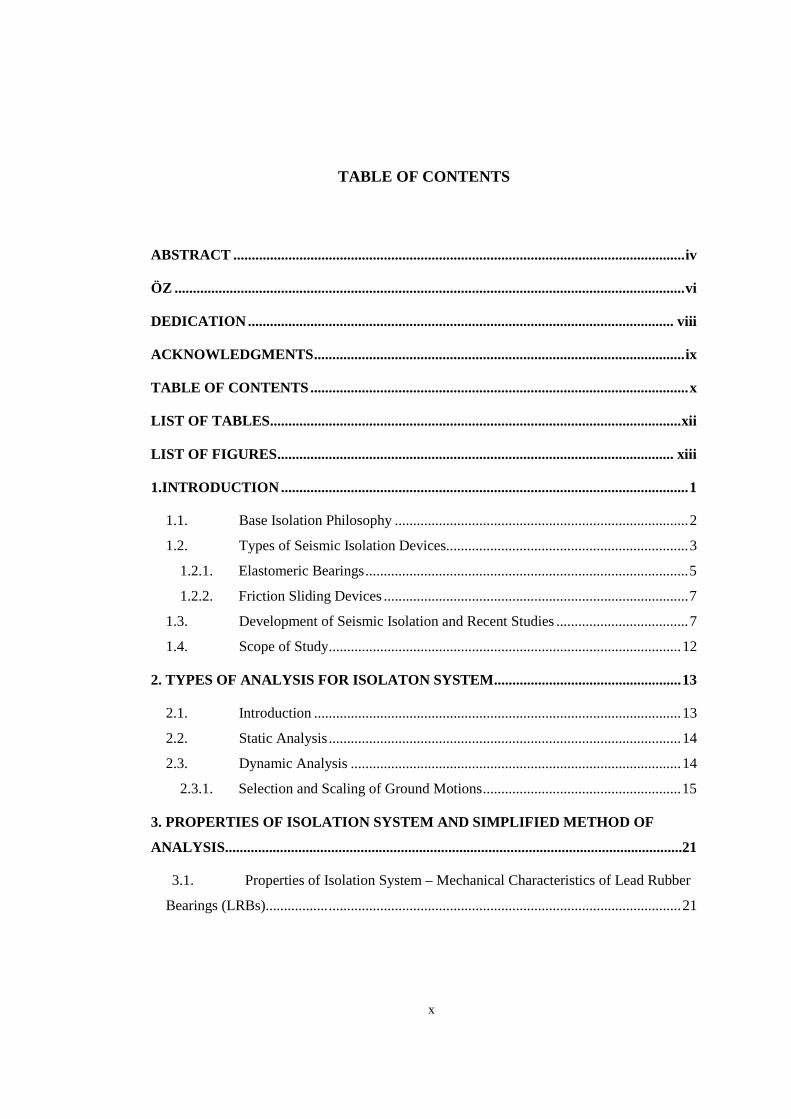
TABLE OF CONTENTS
ABSTRACT ...........................................................................................................................iv
ÖZ ...........................................................................................................................................vi
DEDICATION .................................................................................................................... viii
ACKNOWLEDGMENTS.....................................................................................................ix
TABLE OF CONTENTS.......................................................................................................x
LIST OF TABLES................................................................................................................xii
LIST OF FIGURES............................................................................................................ xiii
1.INTRODUCTION ...............................................................................................................1
1.1. Base Isolation Philosophy ................................................................................2
1.2. Types of Seismic Isolation Devices..................................................................3
1.2.1. Elastomeric Bearings........................................................................................5
1.2.2. Friction Sliding Devices ...................................................................................7
1.3. Development of Seismic Isolation and Recent Studies ....................................7
1.4. Scope of Study................................................................................................12
2. TYPES OF ANALYSIS FOR ISOLATON SYSTEM...................................................13
2.1. Introduction ....................................................................................................13
2.2. Static Analysis................................................................................................14
2.3. Dynamic Analysis ..........................................................................................14
2.3.1. Selection and Scaling of Ground Motions......................................................15
3. PROPERTIES OF ISOLATION SYSTEM AND SIMPLIFIED METHOD OF
ANALYSIS.............................................................................................................................21
3.1. Properties of Isolation System – Mechanical Characteristics of Lead Rubber
Bearings (LRBs).................................................................................................................21
xi
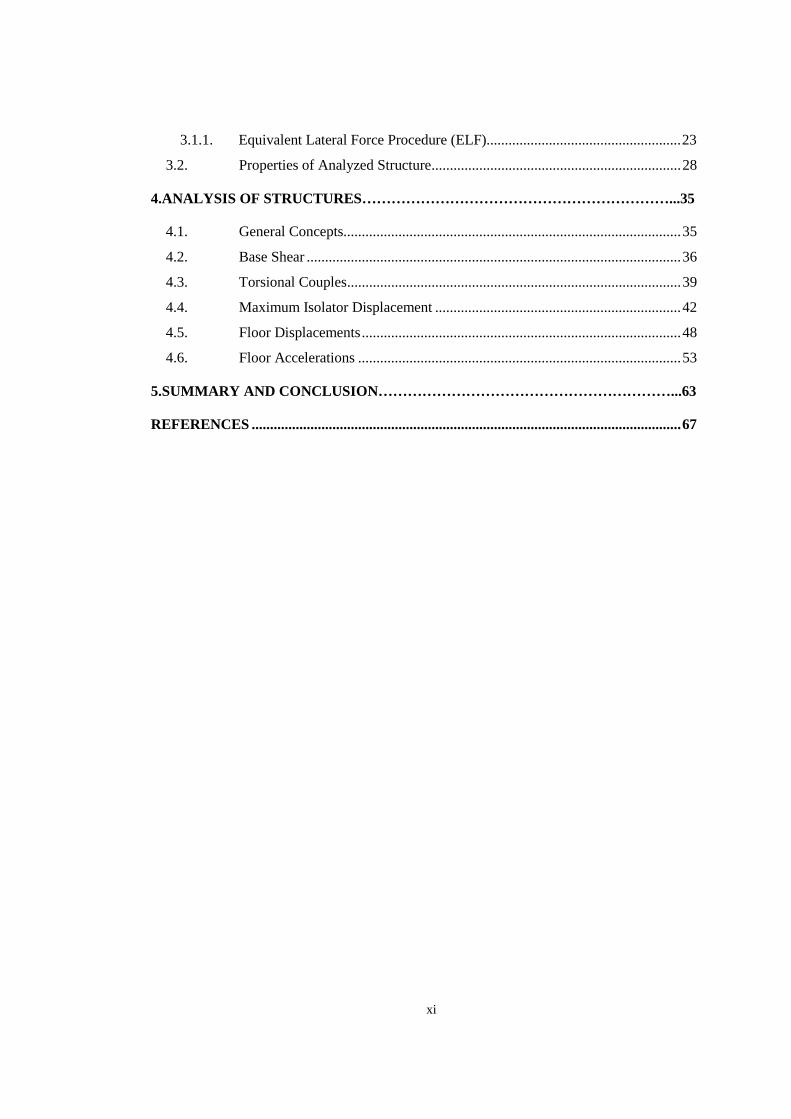
3.1.1. Equivalent Lateral Force Procedure (ELF).....................................................23
3.2. Properties of Analyzed Structure....................................................................28
4.ANALYSIS OF STRUCTURES………………………………………………………...35
4.1. General Concepts............................................................................................35
4.2. Base Shear ......................................................................................................36
4.3. Torsional Couples...........................................................................................39
4.4. Maximum Isolator Displacement ...................................................................42
4.5. Floor Displacements.......................................................................................48
4.6. Floor Accelerations ........................................................................................53
5.SUMMARY AND CONCLUSION……………………………………………………...63
REFERENCES .....................................................................................................................67
xii
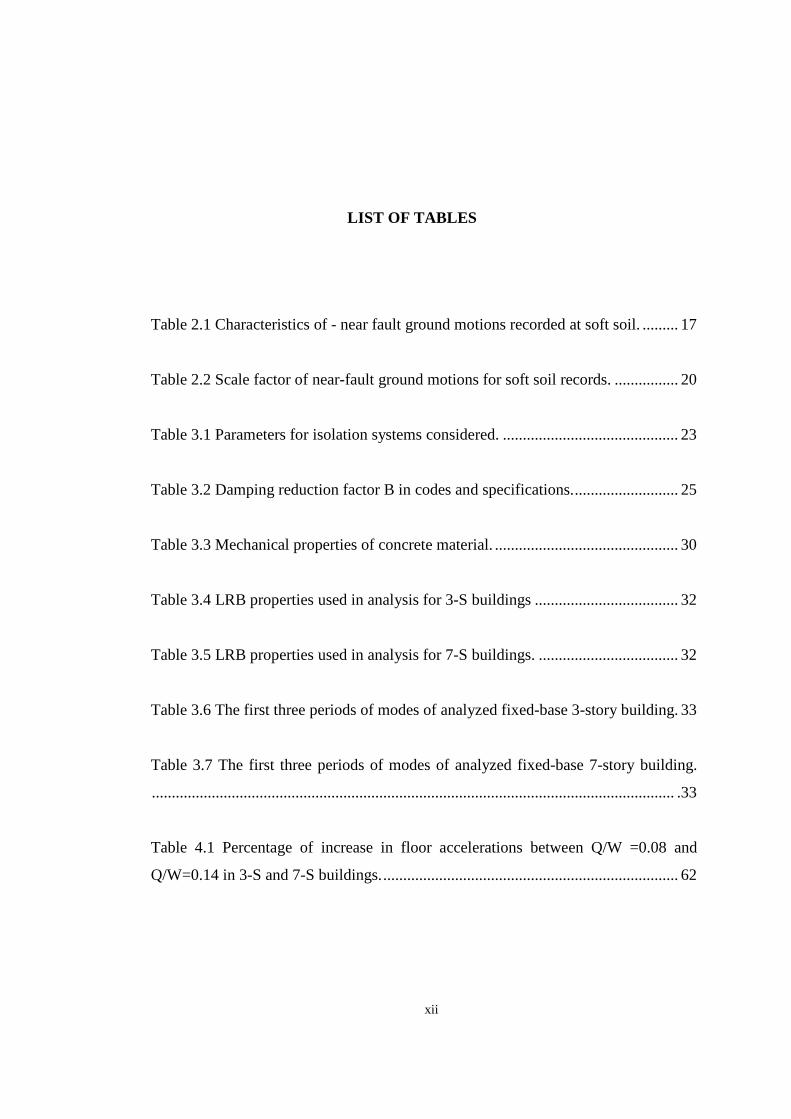
LIST OF TABLES
Table 2.1 Characteristics of - near fault ground motions recorded at soft soil. ......... 17
Table 2.2 Scale factor of near-fault ground motions for soft soil records. ................ 20
Table 3.1 Parameters for isolation systems considered. ............................................ 23
Table 3.2 Damping reduction factor B in codes and specifications........................... 25
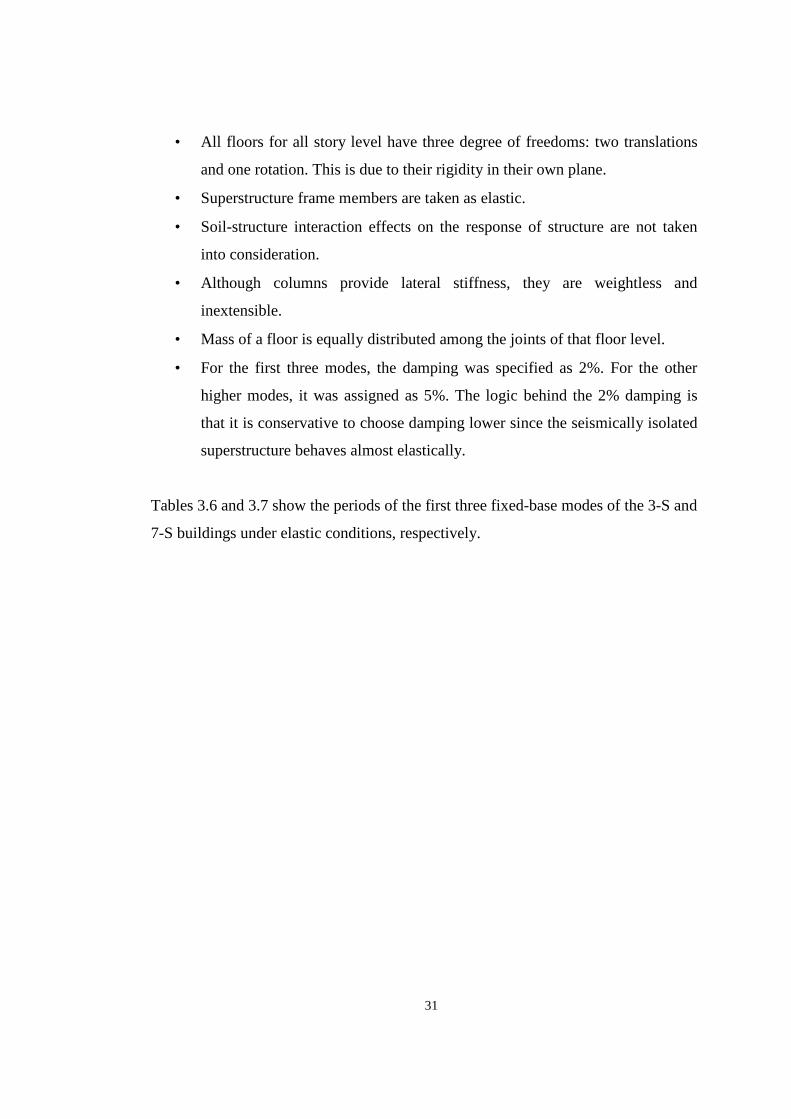
Table 3.3 Mechanical properties of concrete material. .............................................. 30
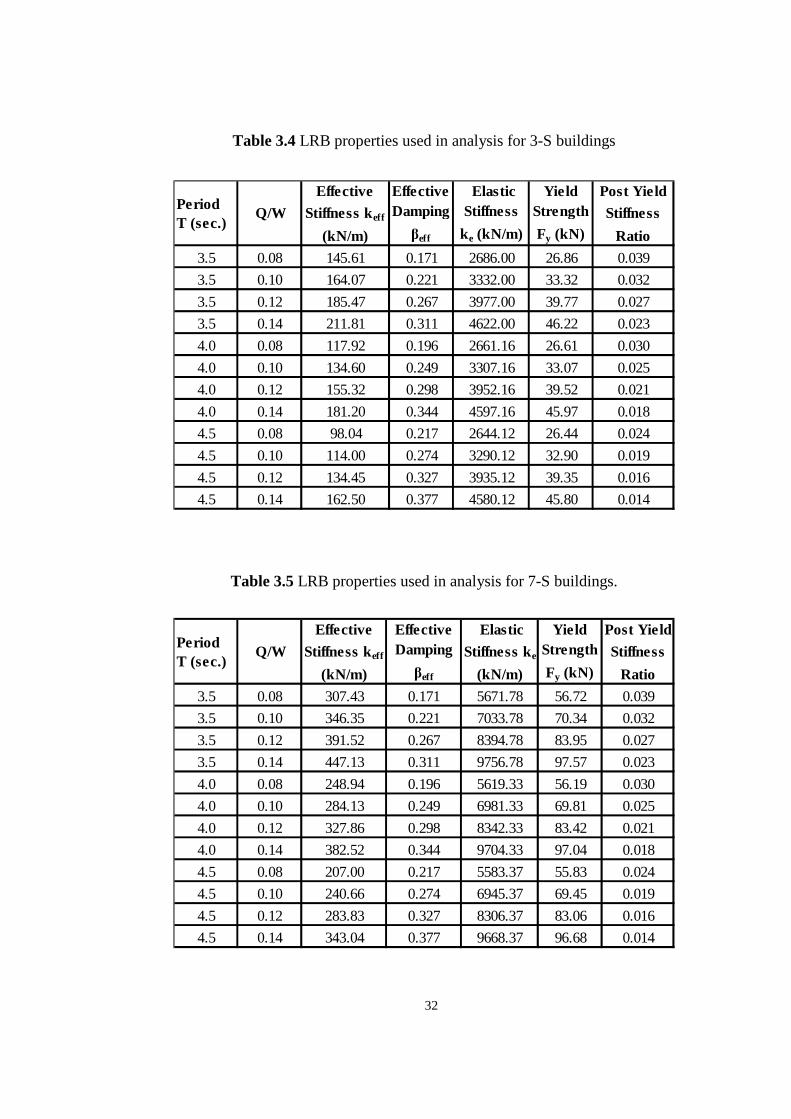
Table 3.4 LRB properties used in analysis for 3-S buildings .................................... 32
Table 3.5 LRB properties used in analysis for 7-S buildings. ................................... 32
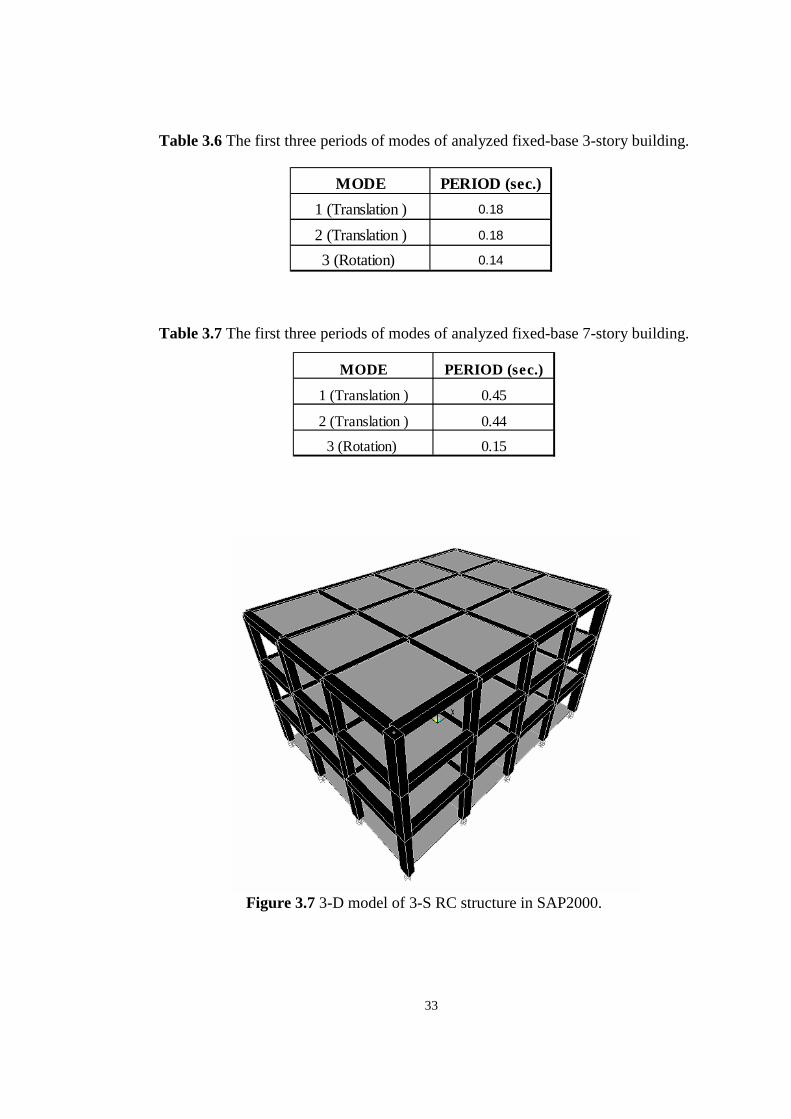
Table 3.6 The first three periods of modes of analyzed fixed-base 3-story building. 33
Table 3.7 The first three periods of modes of analyzed fixed-base 7-story building.
................................................................................................................................... .33
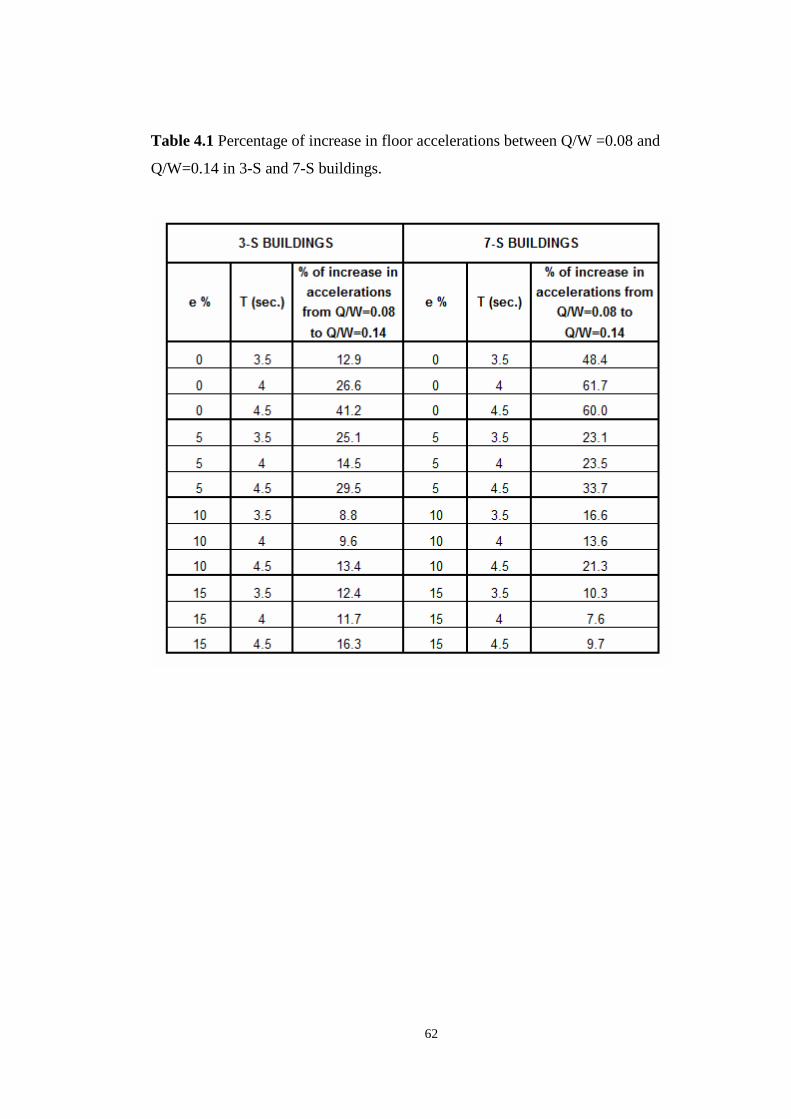
Table 4.1 Percentage of increase in floor accelerations between Q/W =0.08 and
Q/W=0.14 in 3-S and 7-S buildings........................................................................... 62
xiii
LIST OF FIGURES
Figure 1.1 Conventional Structure (Mayes and Naeim, 2001). ................................... 3
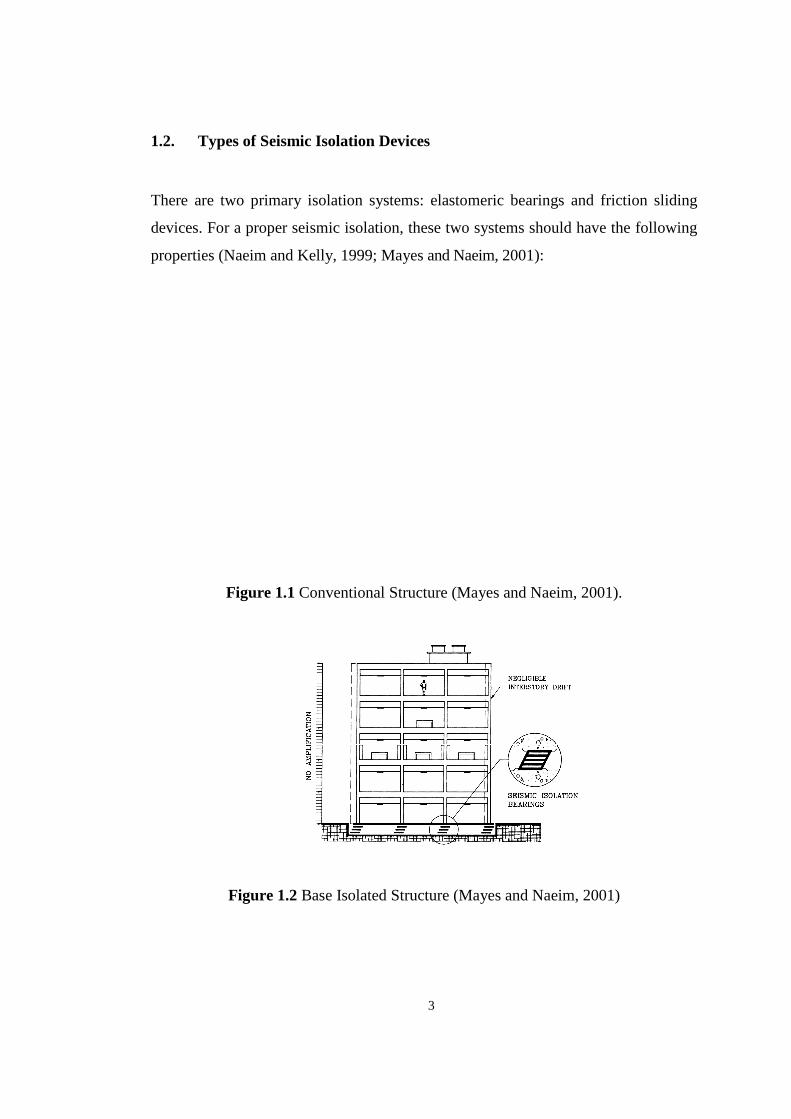
Figure 1.2 Base Isolated Structure (Mayes and Naeim, 2001) .................................... 3
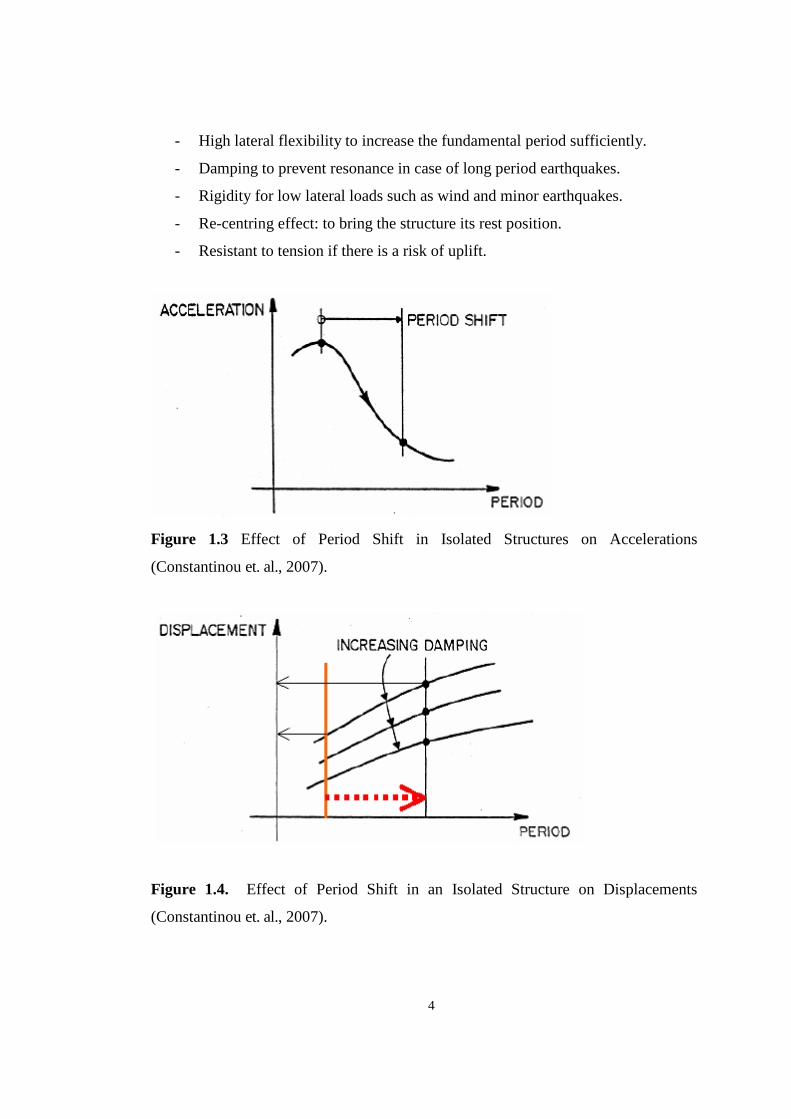
Figure 1.3 Effect of Period Shift in Isolated Structures on Accelerations (Constantinou et. al., 2007). ......................................................................................... 4
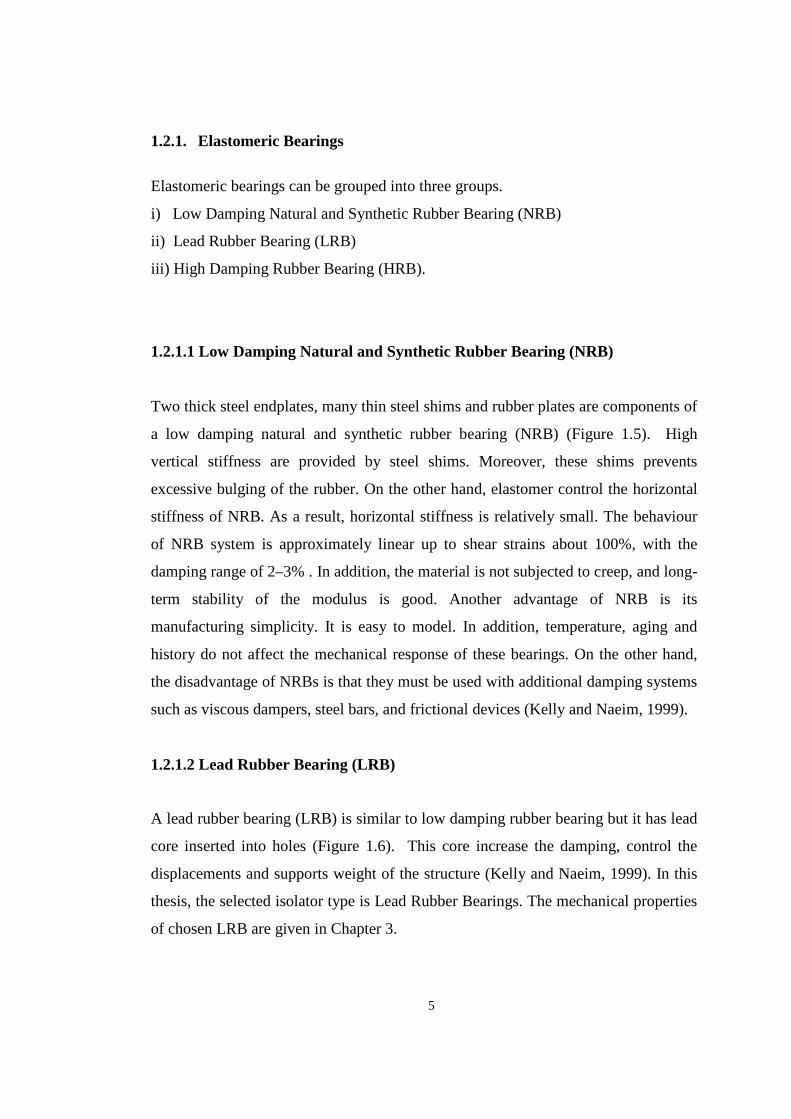
Figure 1.4. Effect of Period Shift in an Isolated Structure on Displacements (Constantinou et. al., 2007). ......................................................................................... 4 Figure 1.5 NRB (Kelly and Naeim, 1999). .................................................................. 6 Figure 1.6 LRB (Kelly and Naeim, 1999).................................................................... 7 Figure 1.7 Touaillon’s proposed isolation system (Tobriner, 2006)............................ 9 Figure 2.1 Ground motion records of fault normal component taken from (a) Rinaldi Receiving Station, 1994 Northridge earthquake and (b) Taft, 1952 Kern County earthquake. (Chintanapakdee and Chopra, 2001). ..................................................... 17
Figure 3.1 Bilinear forces – deformation relation of an isolator (Naeim and Kelly, 1999). ......................................................................................................................... 22
Figure 3.2 Adopted Response Spectra Used in Analysis (TEC(2007)). .................... 26
Figure 3.3 Plan dimensions for calculations of DELF (Naeim and Kelly, 1999). ....... 27
xiv
Figure 3.4 Idealized model of isolated RC building: (a) plan (b) isolation system joint numbering. ................................................................................................................. 29 Figure 3.5 Eccentricity location of superstructure (Ozdemir, 2010). ........................ 30 Figure 3.6 3-D model of 3-S RC structure in SAP2000. ........................................... 33
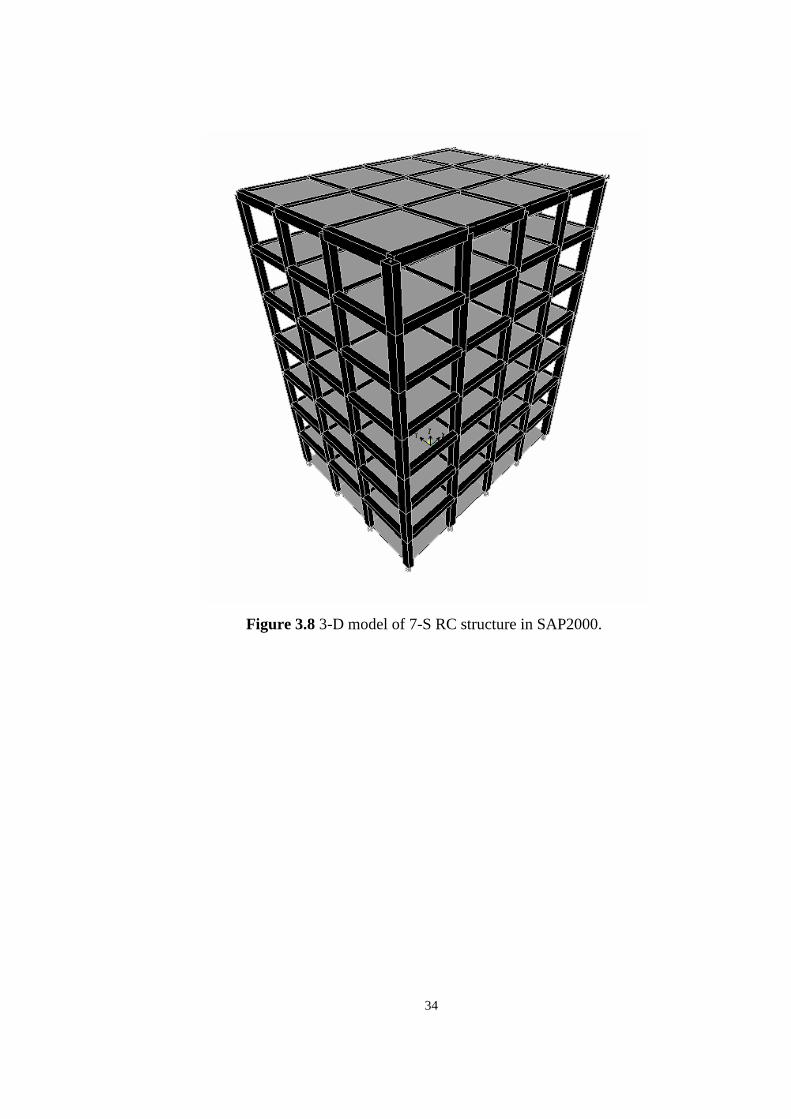
Figure 3.7 3-D model of 7-S RC structure in SAP2000. ........................................... 34
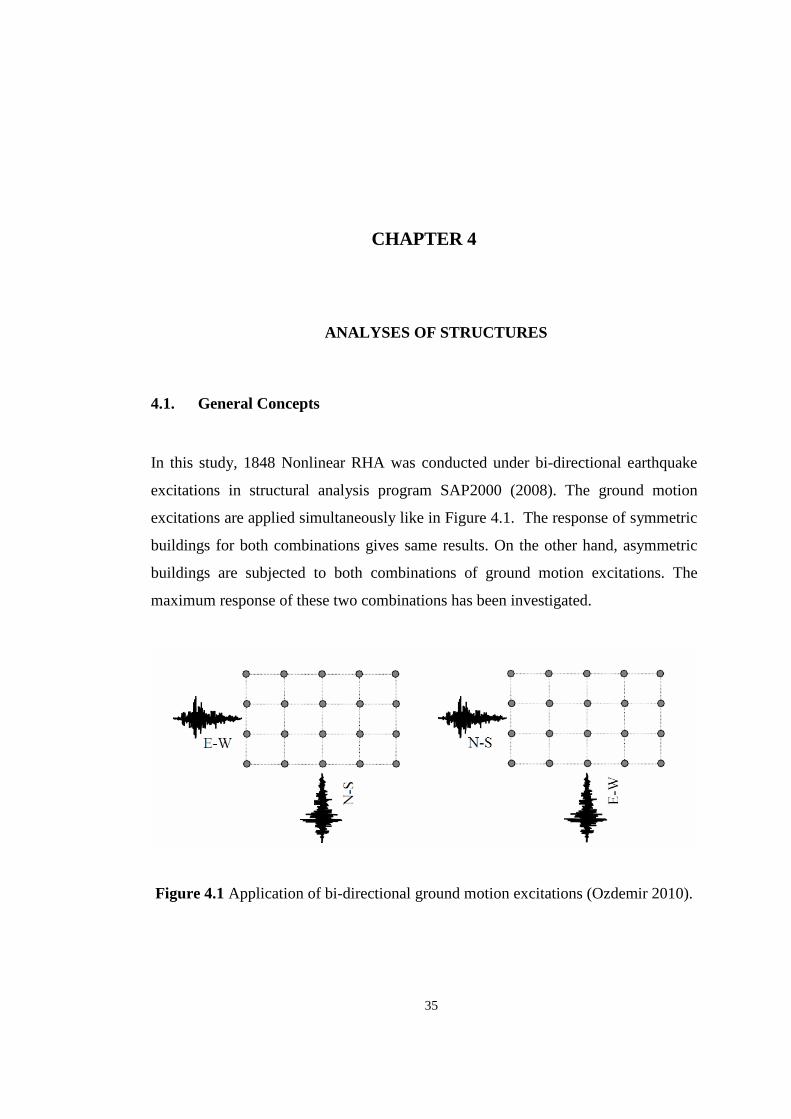
Figure 4.1 Application of bi-directional ground motion excitations (Ozdemir 2010)..................................................................................................................................... 35
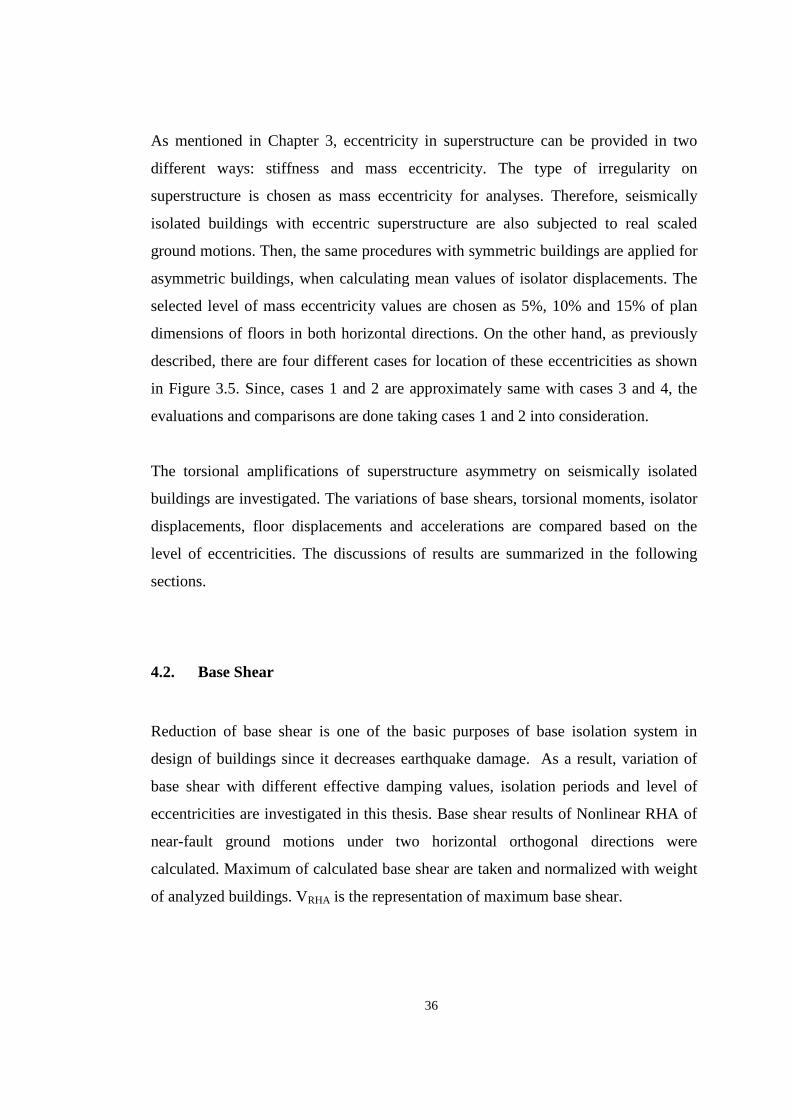
Figure 4.2 Variation of maximum base shears with damping for different level of eccentricities in 3- story superstructure. .................................................................... 37
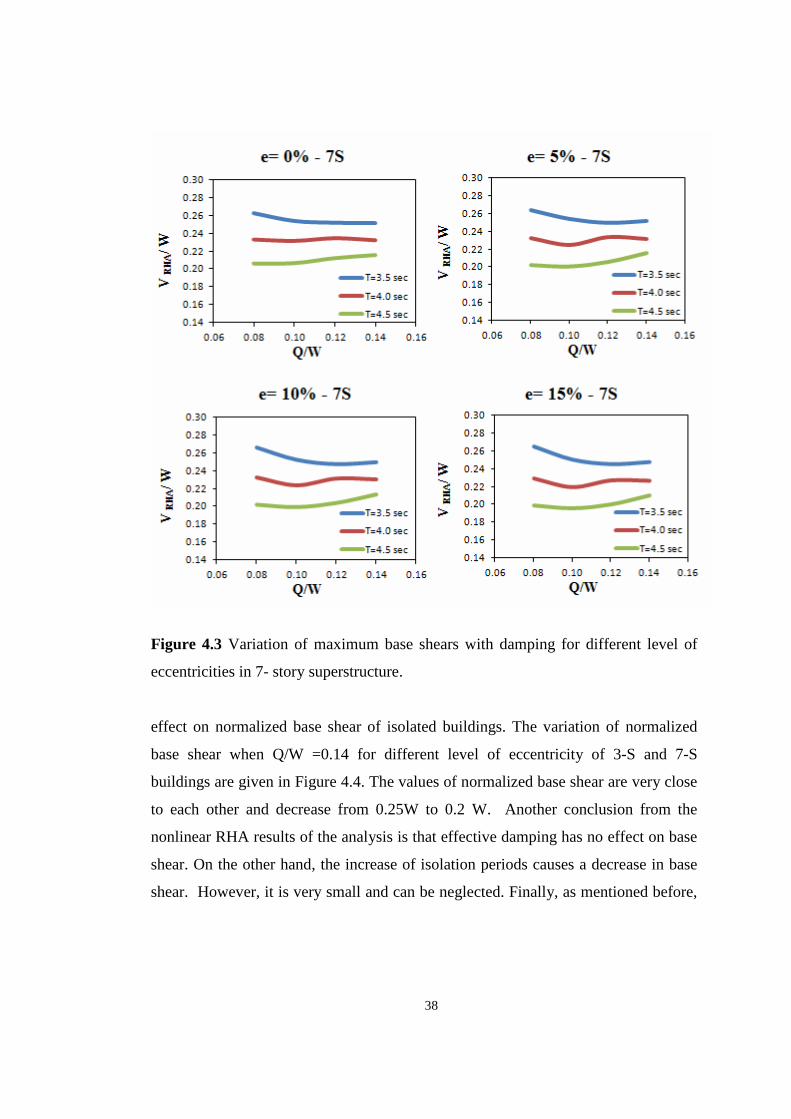
Figure 4.3 Variation of maximum base shears with damping for different level of eccentricities in 7- story superstructure. .................................................................... 38
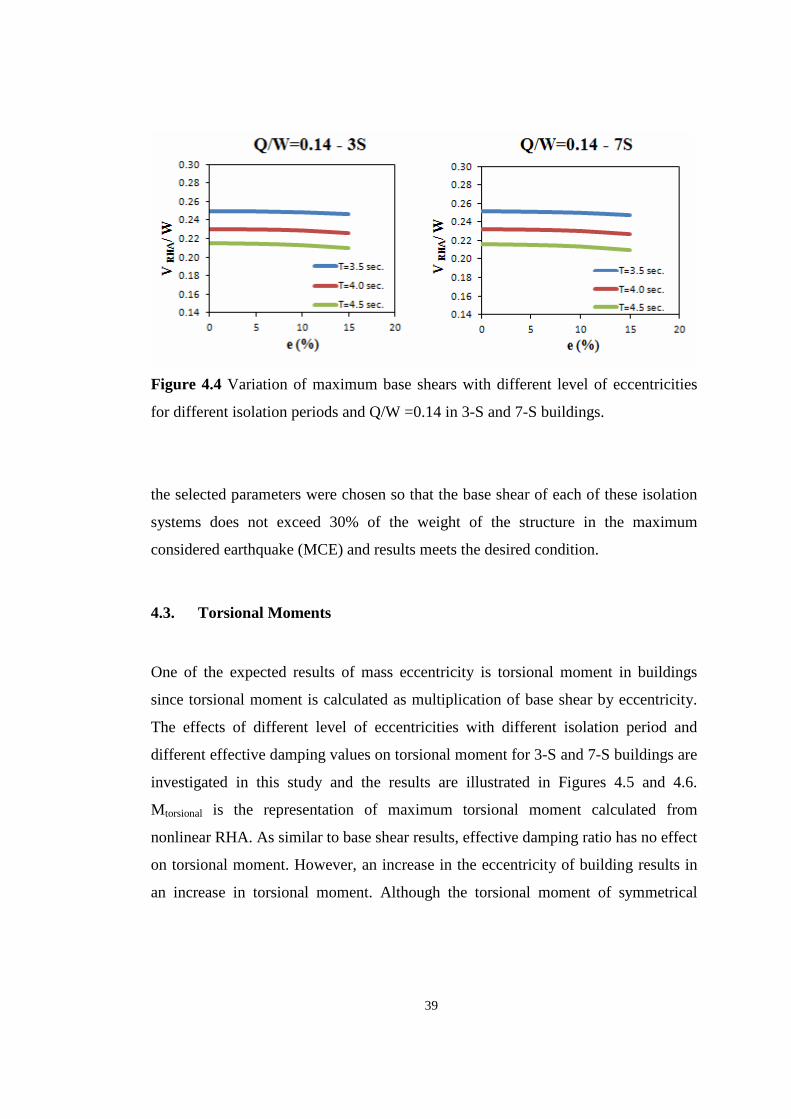
Figure 4.4 Variation of maximum base shears with different level of eccentricities for different isolation periods and Q/W =0.14 in 3-S and 7-S buildings. ................ 39
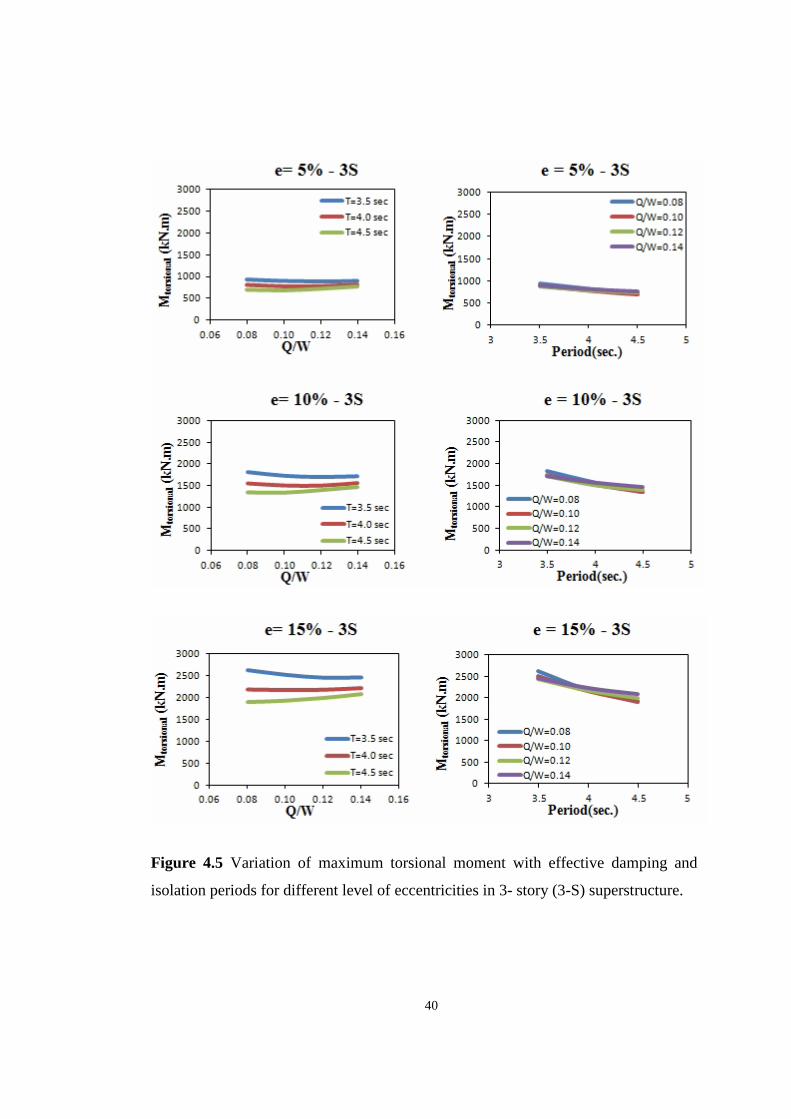
Figure 4.5 Variation of maximum torsional moment with effective damping and isolation periods for different level of eccentricities in 3- story (3-S) superstructure..................................................................................................................................... 40
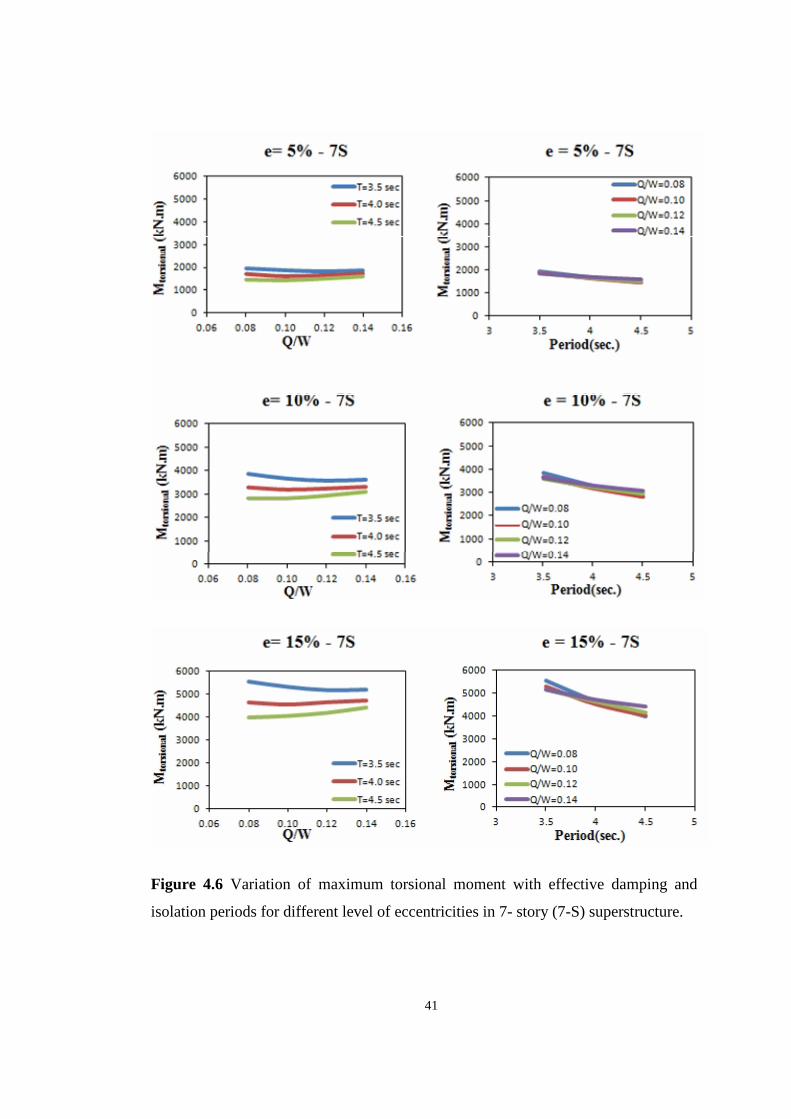
Figure 4.6 Variation of maximum torsional moment with effective damping and isolation periods for different level of eccentricities in 7- story (7-S) superstructure..................................................................................................................................... 41
Figure 4.7 Variation of maximum torsional moment with different level of eccentricities for different isolation periods and Q/W =0.14 in 3-S and 7-S buildings..................................................................................................................................... 42
Figure 4.8 Variation of maximum isolator displacements with damping and eccentricities in superstructure. .................................................................................. 43
Figure 4.9 Normalized isolator displacements obtained from bi-directional excitations for 3- story buildings and each mass eccentricity.................................... 44
xv
Figure 4.10 Amplifications in isolator displacements due to isolation period under increasing Q/W ratios................................................................................................. 46
Figure 4.11 DRHA ECC versus DELF
ECC for 3-story and 7-story superstructure. ........... 47
Figure 4.12 Variation of maximum displacements with story level and damping in 3-S buildings for e=0% and e=5%. ............................................................................... 49
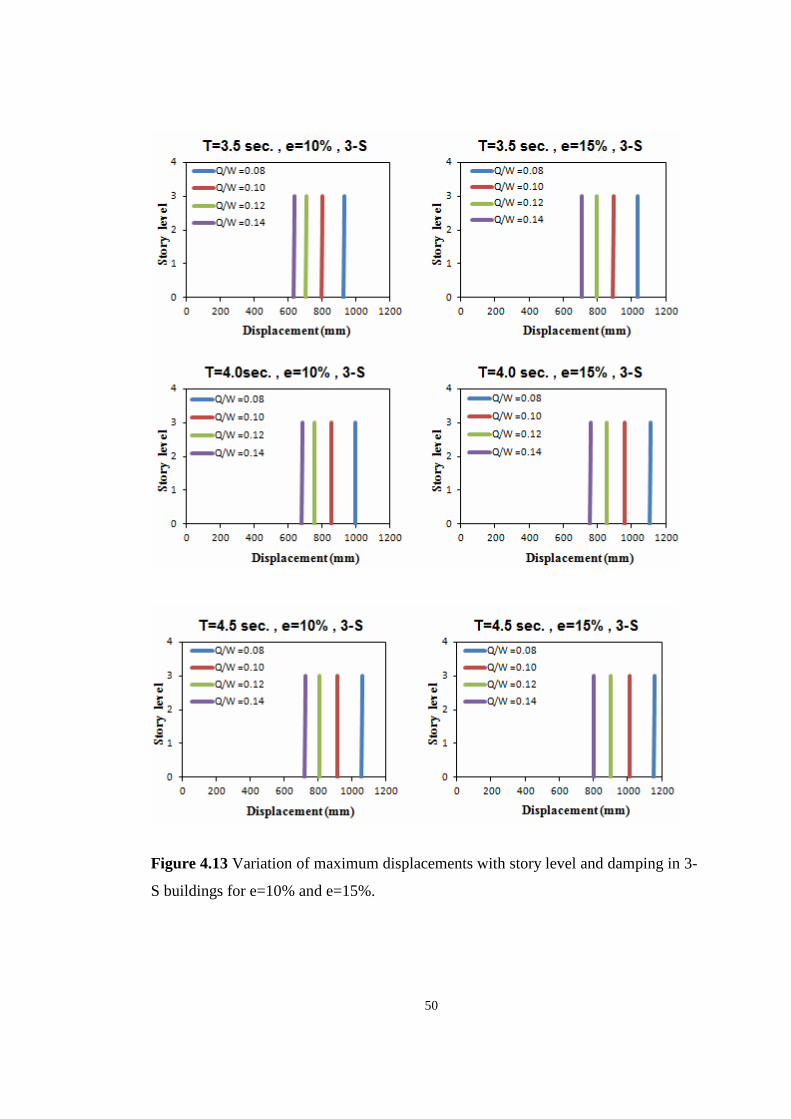
Figure 4.13 Variation of maximum displacements with story level and damping in 3-S buildings for e=10% and e=15%. ........................................................................... 50
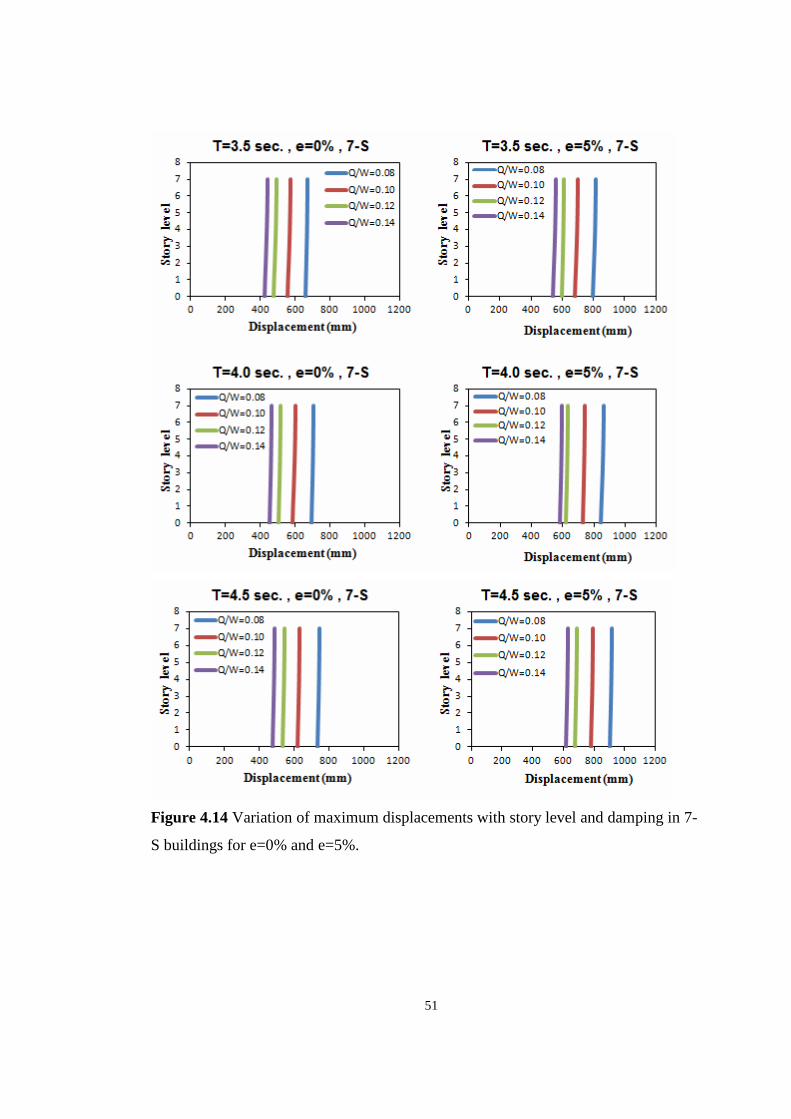
Figure 4.14 Variation of maximum displacements with story level and damping in 7-S buildings for e=0% and e=5%. ............................................................................... 51
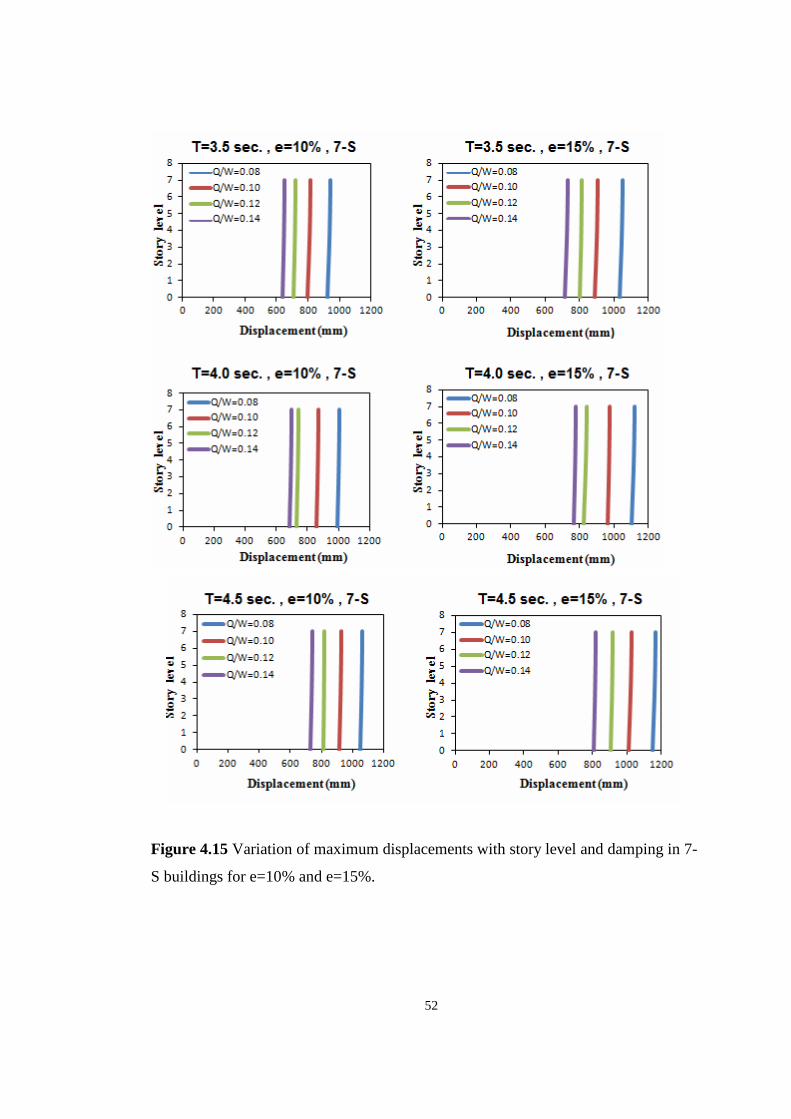
Figure 4.15 Variation of maximum displacements with story level and damping in 7-
S buildings for e=10% and e=15%. ........................................................................... 52
Figure 4.16 Variation of maximum floor accelerations with story level and isolation periods in 3-S buildings for e=0% . ........................................................................... 54
Figure 4.17 Variation of maximum floor accelerations with story level and isolation periods in 3-S buildings for e=5%. ............................................................................ 55
Figure 4.18 Variation of maximum floor accelerations with story level and isolation periods in 3-S buildings for e=10%. .......................................................................... 56
Figure 4.19 Variation of maximum floor accelerations with story level and isolation periods in 3-S buildings for e=15%. .......................................................................... 57
Figure 4.20 Variation of maximum floor accelerations with story level and isolation periods in 7-S buildings for e=0%. ............................................................................ 58 Figure 4.21 Variation of maximum floor accelerations with story level and isolation periods in 7-S buildings for e=5%. ............................................................................ 59
Figure 4.22 Variation of maximum floor accelerations with story level and isolation periods in 7-S buildings for e=10%. .......................................................................... 60

xvi
Figure 4.23 Variation of maximum floor accelerations with story level and isolation periods in 7-S buildings for e=10%. .......................................................................... 61
1
CHAPTER 1
1. INTRODUCTION
Reduction of earthquake damage is one of the big concerns of structural engineering
philosophy. As a traditional seismic design approach, increasing strength or ductility
of building systems could be a solution. In addition to classical approach, seismic
isolation systems are introduced as a protection from earthquakes.
In base isolation, flexible and dissipative elements are placed at the interface between
the foundation and the base of the structure. These isolators increase building
flexibility and energy absorption capacity. The isolating system absorbs part of the
earthquake energy before transferring it to the structure, by shifting the natural period
of the isolated structure. This period shift results in a reduction in the inertial forces.
As a result, the energy dissipated by the structural elements decreases (Agranovich
and Ribakov, 2008).
Base isolation application has been increasing all over the world with the help of
developing technologies. The analytical and experimental researches have also
accelerated for many aspects of base isolation. However, in terms of torsional
response of base-isolated structures, there are not many studies available in the
literature (Tena-Colunga and Zambrana-Rojas, 2006).
2
1.1. Base Isolation Philosophy
In traditional seismic design, there are two different approaches to increase safety of
buildings: increasing strength or increasing ductility of building systems. Increasing
the strength is only possible with the reduction of ductility, which will cause an
increase in floor acceleration. On the other hand, increasing the ductility causes an
increase in vibrations.
Interstory drifts and floor accelerations are two primary causes of damage to the
building systems. Interstory drift can reach high values in flexible structures, and
high floor accelerations can be observed in stiff buildings Furthermore, floor
accelerations generally increase through the height of buildings in a fixed base
structure during an earthquake (Figure 1.1) (Mayes and Naeim, 2001). Isolating the
structures from earthquakes by using seismic isolation systems lowers the floor
accelerations (Figure 1.2).
The basic idea behind the seismic isolation is decoupling the structure from the
earthquake excitations by placing dissipative and flexible elements at the isolation
level. These elements reduce the transmission of seismic force from the ground to
the superstructure by shifting the fundamental period of structure (Figure 1.3). This
means that the inertial forces that affect the structure will be lower. However, the
period shift should be in a reasonable limit since increasing period result in
increasing displacement at isolation level. Damping of isolation system is the
parameter that limits these excessive displacement (Figure 1.4) (Matsagar and
Jangid, 2004; Constantinou et. al., 2007; Ozdemir 2010).
3
1.2. Types of Seismic Isolation Devices
There are two primary isolation systems: elastomeric bearings and friction sliding
devices. For a proper seismic isolation, these two systems should have the following
properties (Naeim and Kelly, 1999; Mayes and Naeim, 2001):
Figure 1.1 Conventional Structure (Mayes and Naeim, 2001).
Figure 1.2 Base Isolated Structure (Mayes and Naeim, 2001)
4
- High lateral flexibility to increase the fundamental period sufficiently.
- Damping to prevent resonance in case of long period earthquakes.
- Rigidity for low lateral loads such as wind and minor earthquakes.
- Re-centring effect: to bring the structure its rest position.
- Resistant to tension if there is a risk of uplift.
Figure 1.3 Effect of Period Shift in Isolated Structures on Accelerations
(Constantinou et. al., 2007).
Figure 1.4. Effect of Period Shift in an Isolated Structure on Displacements
(Constantinou et. al., 2007).
5
1.2.1. Elastomeric Bearings Elastomeric bearings can be grouped into three groups.
i) Low Damping Natural and Synthetic Rubber Bearing (NRB)
ii) Lead Rubber Bearing (LRB)
iii) High Damping Rubber Bearing (HRB).
1.2.1.1 Low Damping Natural and Synthetic Rubber Bearing (NRB)
Two thick steel endplates, many thin steel shims and rubber plates are components of
a low damping natural and synthetic rubber bearing (NRB) (Figure 1.5). High
vertical stiffness are provided by steel shims. Moreover, these shims prevents
excessive bulging of the rubber. On the other hand, elastomer control the horizontal
stiffness of NRB. As a result, horizontal stiffness is relatively small. The behaviour
of NRB system is approximately linear up to shear strains about 100%, with the
damping range of 2–3% . In addition, the material is not subjected to creep, and long-
term stability of the modulus is good. Another advantage of NRB is its
manufacturing simplicity. It is easy to model. In addition, temperature, aging and
history do not affect the mechanical response of these bearings. On the other hand,
the disadvantage of NRBs is that they must be used with additional damping systems
such as viscous dampers, steel bars, and frictional devices (Kelly and Naeim, 1999).
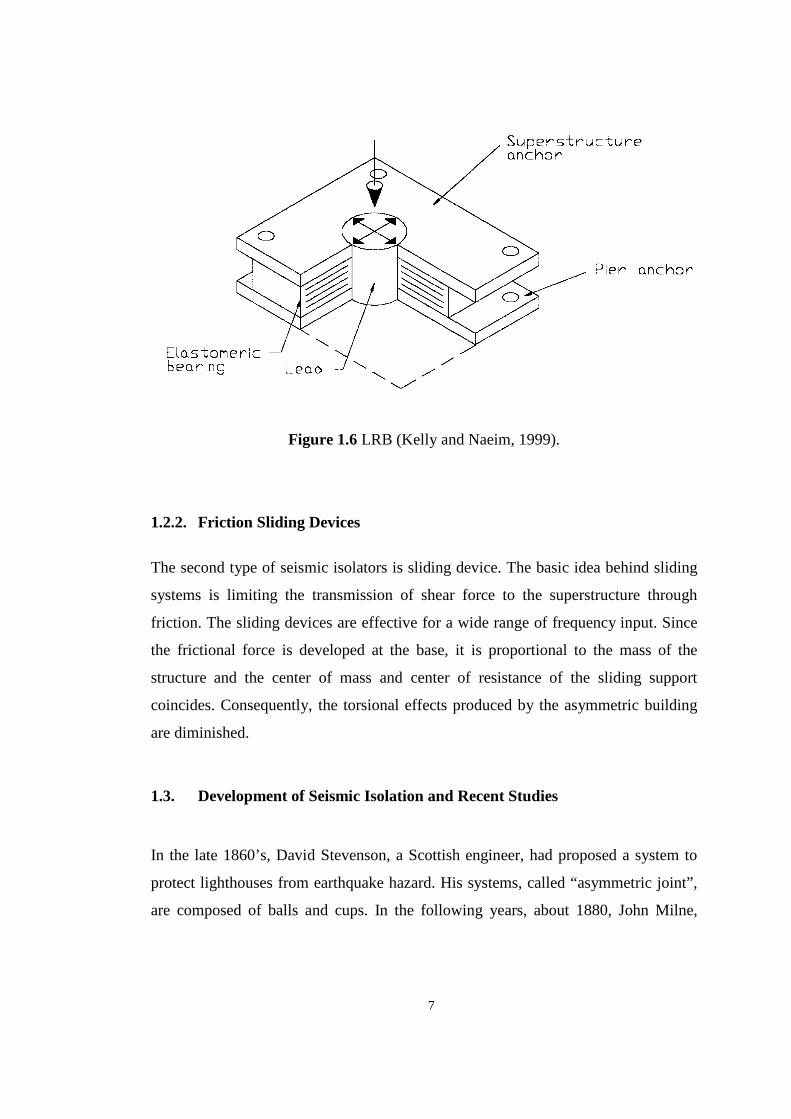
1.2.1.2 Lead Rubber Bearing (LRB)
A lead rubber bearing (LRB) is similar to low damping rubber bearing but it has lead
core inserted into holes (Figure 1.6). This core increase the damping, control the
displacements and supports weight of the structure (Kelly and Naeim, 1999). In this
thesis, the selected isolator type is Lead Rubber Bearings. The mechanical properties
of chosen LRB are given in Chapter 3.
6
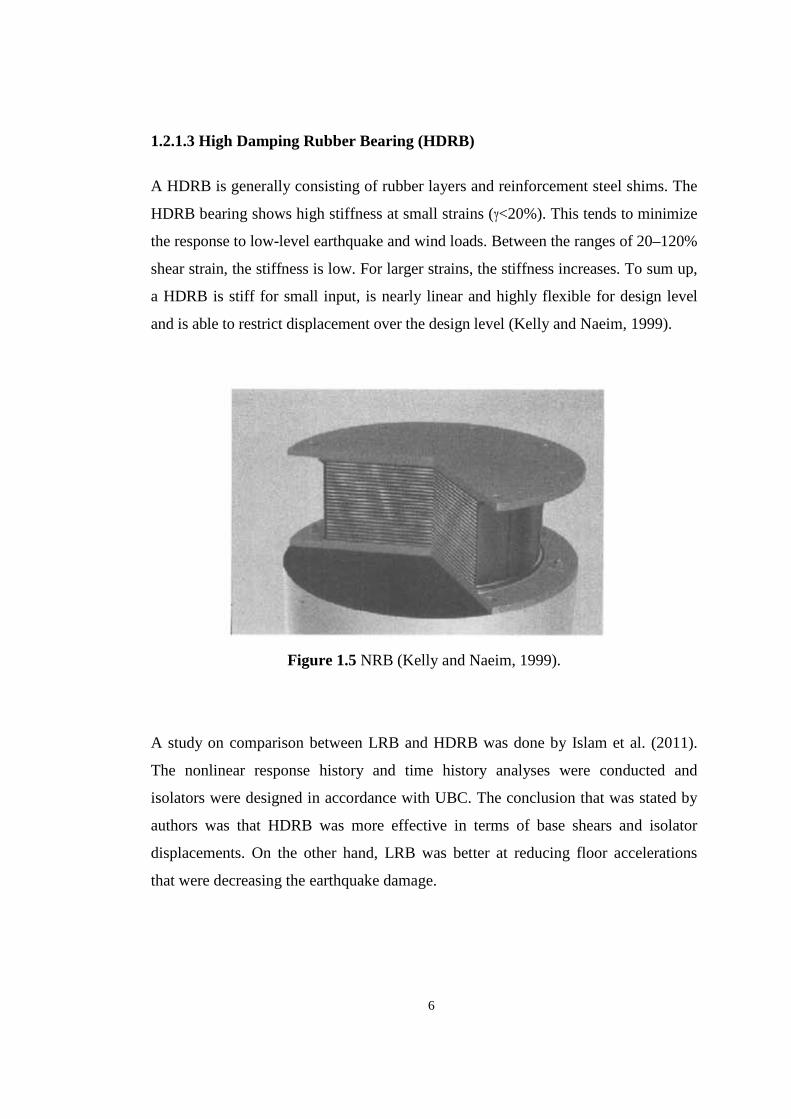
1.2.1.3 High Damping Rubber Bearing (HDRB) A HDRB is generally consisting of rubber layers and reinforcement steel shims. The
HDRB bearing shows high stiffness at small strains (γ<20%). This tends to minimize
the response to low-level earthquake and wind loads. Between the ranges of 20–120%
shear strain, the stiffness is low. For larger strains, the stiffness increases. To sum up,
a HDRB is stiff for small input, is nearly linear and highly flexible for design level
and is able to restrict displacement over the design level (Kelly and Naeim, 1999).
Figure 1.5 NRB (Kelly and Naeim, 1999).
A study on comparison between LRB and HDRB was done by Islam et al. (2011).
The nonlinear response history and time history analyses were conducted and
isolators were designed in accordance with UBC. The conclusion that was stated by
authors was that HDRB was more effective in terms of base shears and isolator
displacements. On the other hand, LRB was better at reducing floor accelerations
that were decreasing the earthquake damage.
7
Figure 1.6 LRB (Kelly and Naeim, 1999).
1.2.2. Friction Sliding Devices The second type of seismic isolators is sliding device. The basic idea behind sliding
systems is limiting the transmission of shear force to the superstructure through
friction. The sliding devices are effective for a wide range of frequency input. Since
the frictional force is developed at the base, it is proportional to the mass of the
structure and the center of mass and center of resistance of the sliding support
coincides. Consequently, the torsional effects produced by the asymmetric building
are diminished.
1.3. Development of Seismic Isolation and Recent Studies
In the late 1860’s, David Stevenson, a Scottish engineer, had proposed a system to
protect lighthouses from earthquake hazard. His systems, called “asymmetric joint”,
are composed of balls and cups. In the following years, about 1880, John Milne,
ddddd
8
referred as father of modern seismology, and the son of Stevenson, David A.
Stevenson successfully, conducted the first test of seismic isolation (Tobriner, 2006).
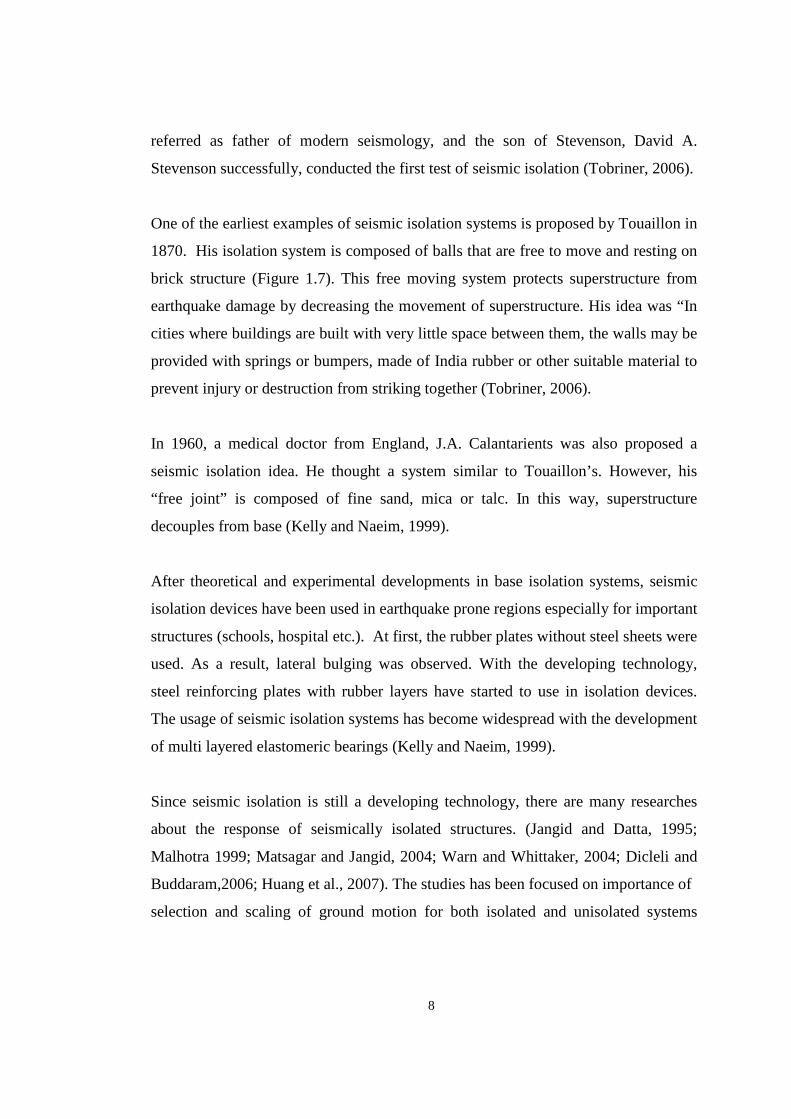
One of the earliest examples of seismic isolation systems is proposed by Touaillon in
1870. His isolation system is composed of balls that are free to move and resting on
brick structure (Figure 1.7). This free moving system protects superstructure from
earthquake damage by decreasing the movement of superstructure. His idea was “In
cities where buildings are built with very little space between them, the walls may be
provided with springs or bumpers, made of India rubber or other suitable material to
prevent injury or destruction from striking together (Tobriner, 2006).
In 1960, a medical doctor from England, J.A. Calantarients was also proposed a
seismic isolation idea. He thought a system similar to Touaillon’s. However, his
“free joint” is composed of fine sand, mica or talc. In this way, superstructure
decouples from base (Kelly and Naeim, 1999).
After theoretical and experimental developments in base isolation systems, seismic
isolation devices have been used in earthquake prone regions especially for important
structures (schools, hospital etc.). At first, the rubber plates without steel sheets were
used. As a result, lateral bulging was observed. With the developing technology,
steel reinforcing plates with rubber layers have started to use in isolation devices.
The usage of seismic isolation systems has become widespread with the development
of multi layered elastomeric bearings (Kelly and Naeim, 1999).
Since seismic isolation is still a developing technology, there are many researches
about the response of seismically isolated structures. (Jangid and Datta, 1995;
Malhotra 1999; Matsagar and Jangid, 2004; Warn and Whittaker, 2004; Dicleli and
Buddaram,2006; Huang et al., 2007). The studies has been focused on importance of
selection and scaling of ground motion for both isolated and unisolated systems
jjjjjjjj
9
(Naeim and Lew, 1995; Shome et al., 1998; Malhotra 1999; Chopra and
Chintanapakdee, 2001; Stewart at al., 2001; Akkar and Gulkan, 2002) response of
different isolation systems to ground excitation, discussion of simplified methods of
codes in the prediction of seismic isolation systems (Kelly, 1999; Mayes and Naeim,
2001; Ramirez et al., 2002; Matsagar and Jangid, 2004; Pavlou and Constantinou,
2004; Warn and Whittaker, 2004; Guyader and Iwan, 2006). In this study, the
emphasis will be given to the studies on the response of asymmetric isolated
structures.
Figure 1.7 Touaillon’s proposed isolation system (Tobriner, 2006).
10
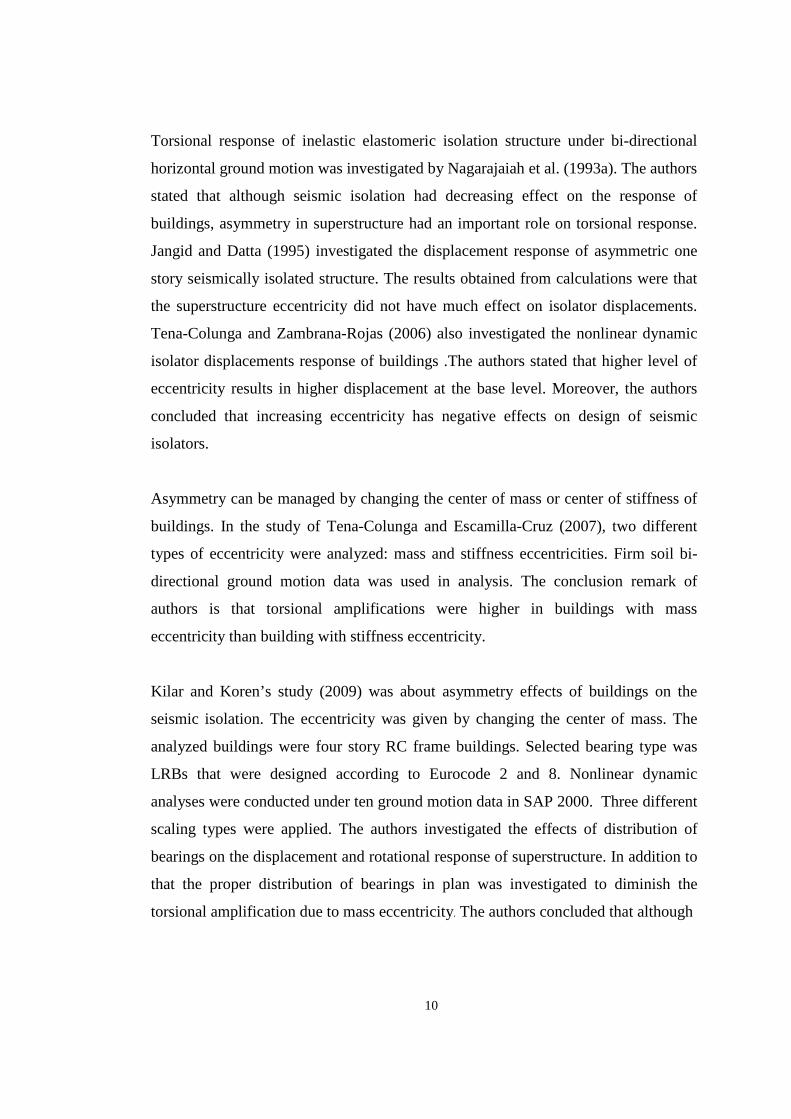
Torsional response of inelastic elastomeric isolation structure under bi-directional
horizontal ground motion was investigated by Nagarajaiah et al. (1993a). The authors
stated that although seismic isolation had decreasing effect on the response of
buildings, asymmetry in superstructure had an important role on torsional response.
Jangid and Datta (1995) investigated the displacement response of asymmetric one
story seismically isolated structure. The results obtained from calculations were that
the superstructure eccentricity did not have much effect on isolator displacements.
Tena-Colunga and Zambrana-Rojas (2006) also investigated the nonlinear dynamic
isolator displacements response of buildings .The authors stated that higher level of
eccentricity results in higher displacement at the base level. Moreover, the authors
concluded that increasing eccentricity has negative effects on design of seismic
isolators.
Asymmetry can be managed by changing the center of mass or center of stiffness of
buildings. In the study of Tena-Colunga and Escamilla-Cruz (2007), two different
types of eccentricity were analyzed: mass and stiffness eccentricities. Firm soil bi-
directional ground motion data was used in analysis. The conclusion remark of
authors is that torsional amplifications were higher in buildings with mass
eccentricity than building with stiffness eccentricity.
Kilar and Koren’s study (2009) was about asymmetry effects of buildings on the
seismic isolation. The eccentricity was given by changing the center of mass. The
analyzed buildings were four story RC frame buildings. Selected bearing type was
LRBs that were designed according to Eurocode 2 and 8. Nonlinear dynamic
analyses were conducted under ten ground motion data in SAP 2000. Three different
scaling types were applied. The authors investigated the effects of distribution of
bearings on the displacement and rotational response of superstructure. In addition to
that the proper distribution of bearings in plan was investigated to diminish the
torsional amplification due to mass eccentricity. The authors concluded that although
11
most of building codes suggested superposing the center of mass with center of
isolators to decrease torsional response, this bearing implementation was not
kkkkkkkkk
protective for superstructure. They stated that top displacements could be increased
up to nearly 2 times when it is compared to symmetrical buildings.
Khante and Laukesh (2010) conducted another study. Their study was based on the
effect of mass eccentricities of seismically isolated structure. 13-story concrete
building was analyzed in ETABS. The selected levels of eccentricities were 5%,
10%, 15% and 20% of larger plan dimensions. The response spectrum and time
history analyses were conducted in both uni-axial and bi-axial directions. The fixed
base buildings were also analyzed and comparisons were done. The authors
emphasized that no matter how high the eccentricity is, the response of seismically
isolated structure is reduced in terms of maximum shear force, torsion, bending
moment, lateral displacement, story drift, story acceleration and base shear when
comparing with fixed base buildings.
Etadili and Sohrabi (2011) compared the response of seismic isolated asymmetric
buildings with fixed base ones. Nonlinear time history analyses were conducted and
three real ground motion records were selected in analyses (El Centro (1940), Tabas
(1978), and Bam (2003). These records were scaled to the maximum acceleration of
0.4 g. 3 story and eight story steel structures supported by lead rubber bearings were
analyzed in SAP 2000. The selected level of eccentricities were chosen randomly as
10%, 15% and 20% and T=1.5, T=2, T=2.5 and T=3.0 sec were selected as isolation
periods. The authors stated that the seismically isolated asymmetric buildings were
less prone to the destructive effect of torsion with respect to fixed base buildings.
However, in large eccentricities the effectiveness of isolation on torsion disappeared.
Moreover, isolator displacements became higher when level of eccentricity was
higher. The increasing isolation period had also same effect on isolator displacement.
12
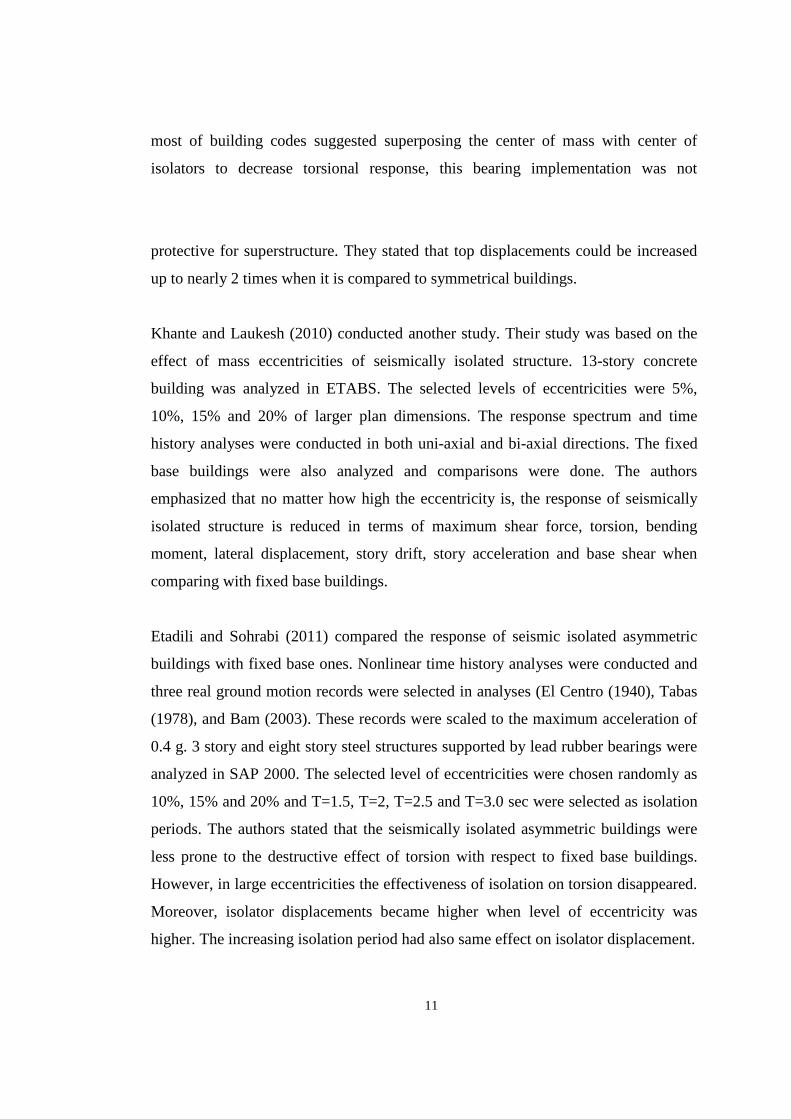
1.4. Scope of Study
This study has been conducted to evaluate the effects of bi-directional earthquake
excitations of near fault records on the torsional response of asymmetric base
isolated structures. Nonlinear response history analysis (RHA) is carried out for 11
different earthquakes recorded at soft soil. The ground motion data are taken from
the study of Ozdemir (2010). Effects of asymmetry in superstructure are examined
considering mass eccentricity at each floor level for the percentage of 5, 10 and 15 of
the longest plan dimensions. Torsional amplifications in base shears, torsional
moments, isolator displacements, floor displacements and accelerations are
compared for different level of eccentricities. Amplifications due to bi-directional
excitations and asymmetry in superstructure are also investigated. The isolation
response of buildings that were calculated from Nonlinear RHA is compared with the
isolator displacements calculated from simplified method. The structures are
modeled as a 3-D three-story (3-S) and seven-story (7-S) buildings with concrete
columns, beams a n d concrete slabs resting on the base isolation system. Lead-
rubber bearings (LRBs) are chosen in analyses and the variables that are examined in
this thesis are the effective damping of LRB and isolation periods.
13
CHAPTER 2
2. TYPES OF ANALYSIS FOR ISOLATON SYSTEM
2.1. Introduction
Although there are different codes for the design of seismically isolated structures,
the main philosophy is the same:
The current codes define two levels of seismic hazards:
– The Design Basis Earthquake (DBE, 475 years period earthquakes)
– The Maximum Credible Earthquake (MCE, 2500 years period earthquakes) (Mayes
and Naeim, 2001).
Two different procedures are permitted for the analysis of seismically isolated
structures:
-Static Analysis
-Dynamic Analysis
14
2.2. Static Analysis
In general, a static analysis is necessary for all seismic isolation systems since this
analysis gives a minimum level for design forces and design displacements.
Furthermore, when dynamic analysis is required, it is also useful both for preliminary
design of the isolation system and the superstructure. However, for design review,
under certain circumstances it may be the only design method used (Kelly and
Naeim, 1999). The static analyses are also carried out in this thesis when choosing
the properties of bearings. The details are given in Chapter 4.
2.3. Dynamic Analysis
Contrary to static analysis, dynamic analysis can be used in all cases. Besides, if static
analysis is not sufficient to represent the response of system, dynamic analysis should
be used. The response spectrum and time history analysis may be the form of dynamic
analysis (Mayes and Naeim, 2001). Site-specific spectra are required in the following
cases:
- The isolated structure is located on soft soil.
- The isolated structure is within 10 km of a known active fault.
- The isolated structure period (MCE) is greater than 3 sec.
However, dynamic analysis is still needed if the effective period of the isolated
structure for DBE (TD) is greater than three times the elastic fixed-base period of the
structure (Kelly and Naeim, 1999). All of the three parameters listed above are
appropriate with the concept of this study, as a result nonlinear response history
analysis (RHA) with the proper ground motion records is chosen as the analysis type.
15
Suitable acceleration records are needed to carry out nonlinear dynamic analyses.
The selected earthquake ground motions should be consistent with site, soil, source
characteristics and durations with DBE and MCE (Kelly and Naeim, 1999). In
addition, if real ground motion data is not available, suitable simulated time histories
could be used to constitute the required number of ground motion (Mayes and Naeim,
2001). Real acceleration time histories are used in this study.
2.3.1. Selection and Scaling of Ground Motions
Since the ground motion databases are widespread and available, the characteristics
of the ground motion records can be obtained easily. When these records are
examined, it is seen that there is a distinct difference between the ground motion data
recorded at near-fault and far-fault regions. Near-fault records of major earthquakes
have large displacement pulses from 0.5 m to more than 1.5 m with peak velocities
of 0.5 m/sec or higher. Moreover, although acceleration time histories are generally
smooth, in some cases they have also large pulses in near-fault records (Makris and
Chang, 2000). Malhotra (1999) also stated that the ground motions recorded in near-
fault regions have remarkable pulses in acceleration, velocity and displacement time
histories.
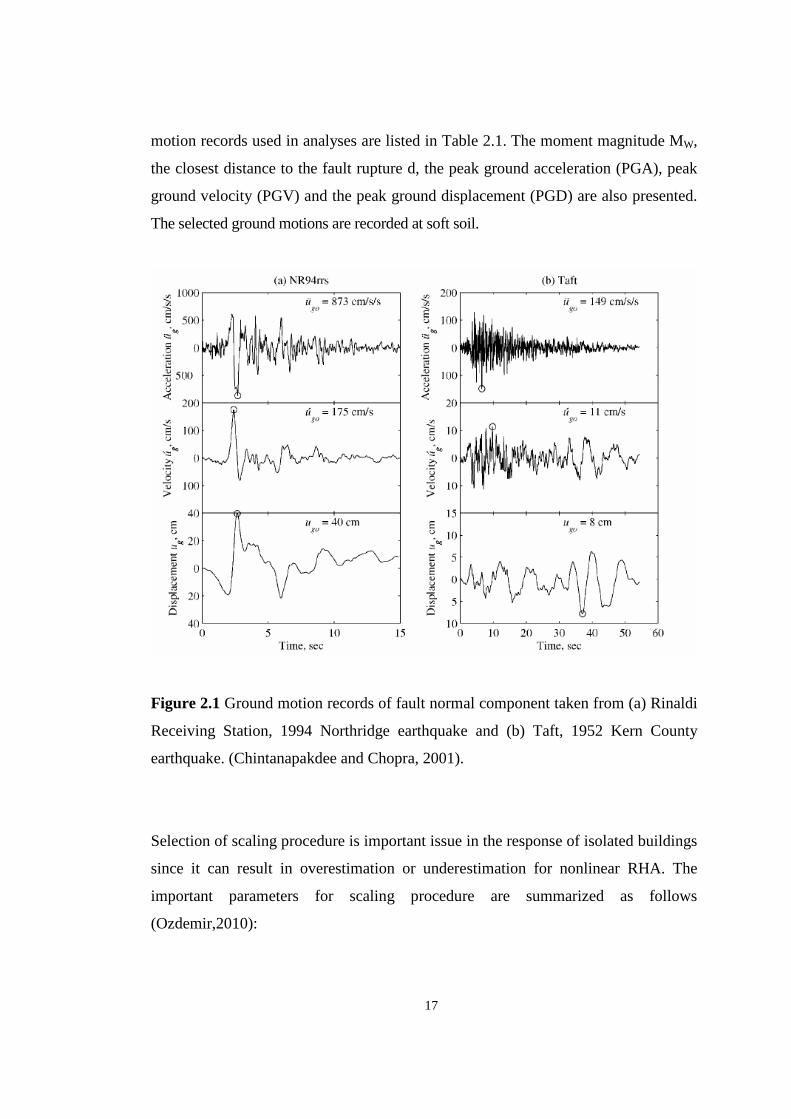
In Figure 2.1(a), acceleration, velocity and displacement histories of Northridge,
California, earthquake of 17 January 1994 are given. This data is recorded at a near-
fault region and these records are belonging to fault normal component. There is a
long period pulse in the acceleration time history that is consistent with velocity and
displacement histories. On the other hand, the ground motion data recorded at Kern
County, California, earthquake of 21 July 1952 is given in Figure 2.1(b). These
records are far-fault region records and there is not such a distinct pulse in time
histories. Due to the different characteristics of near-fault ground motion, the interest
16
on the near-fault effect on structure response has increased (Chintanapakdee and
Chopra, 2001). In this thesis, a set of near-fault ground motion records are used to
examine near-fault effect.
Suitable acceleration records are needed to carry out non-linear dynamic analyses.
These records should be compatible with predefined earthquake generally obtained
from a probabilistic seismic hazard analysis. The time histories used in nonlinear
RHA analyses have different effects on the response of structure. It is an important
issue to obtain the expected inelastic response of a structure in earthquake
engineering. As a result, selection and scaling of acceleration histories of ground
motions are also crucial to have an idea about the real response of a structure under
earthquake excitations. There are some parameters such as magnitude of earthquake,
source-to-site distance and site classification when considering scaling and selection.
(Hancock et al., 2008). The number of records used in analysis is also an important
issue. The codes recommended that at least three pairs of horizontal ground motion
recorded events should be used in time history analysis. If seven or more records are
used then the average of the results could be used in design. On the other hand, if
three records are chosen in design, then the maximum response of these three records
should be used. Besides the codes’ recommendations, there are some researches
about the required number of ground motions. Shome et al. (1998) reported that in
case of proper scaling of records, the number of ground motion records use in
analyses could be decreased by a factor of four. In addition, the study of Bommer
and Acevedo (2004) also stated that there is a possibility of reduction in the number
of motions in case of reasonable selection and scaling.
In this thesis, the selection and scaling procedure of ground motion used in analyses
are taken from the previous researches. The selection information is taken from
previous studies carried out by Somerville et al. (1997), Akkar and Gulkan (2002),
Pavlou and Constantinou (2004), Metin (2006) and Ozdemir (2010). The ground
şşşşş
17
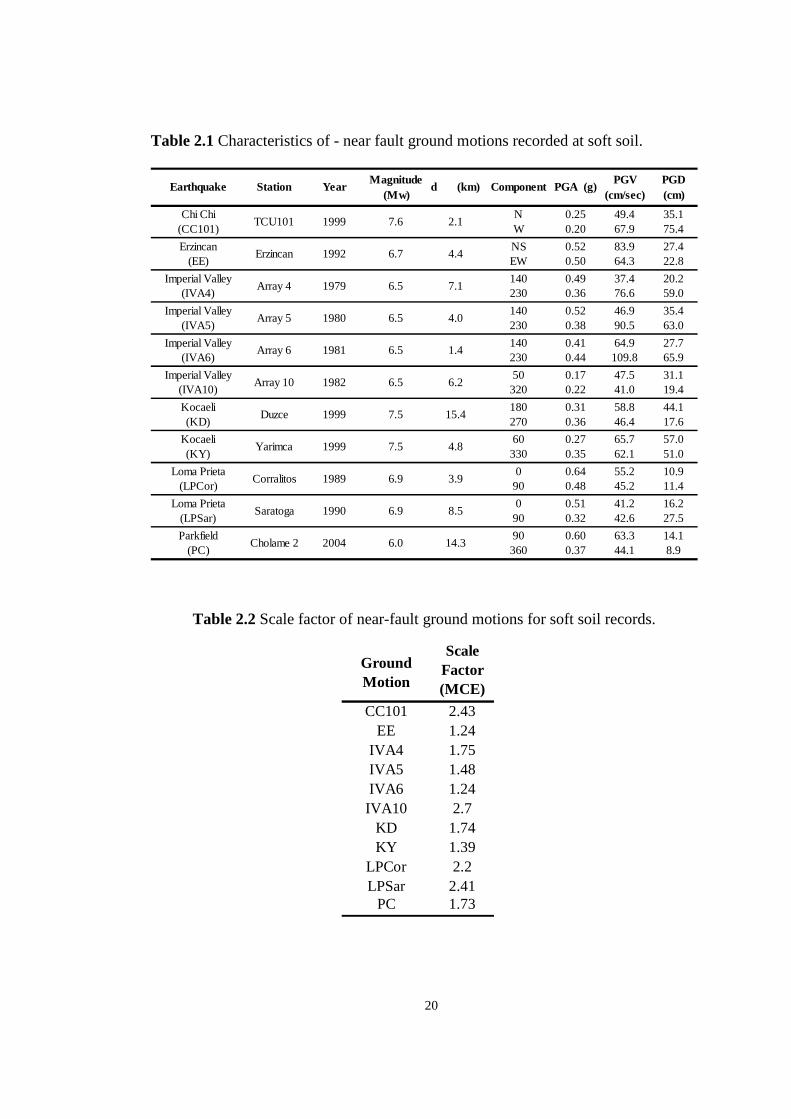
motion records used in analyses are listed in Table 2.1. The moment magnitude MW,
the closest distance to the fault rupture d, the peak ground acceleration (PGA), peak
ground velocity (PGV) and the peak ground displacement (PGD) are also presented.
The selected ground motions are recorded at soft soil.
Figure 2.1 Ground motion records of fault normal component taken from (a) Rinaldi
Receiving Station, 1994 Northridge earthquake and (b) Taft, 1952 Kern County
earthquake. (Chintanapakdee and Chopra, 2001).
Selection of scaling procedure is important issue in the response of isolated buildings
since it can result in overestimation or underestimation for nonlinear RHA. The
important parameters for scaling procedure are summarized as follows
(Ozdemir,2010):
18
• The period of structure should have no effect on scaling.
• A range of period should be considered instead of one single period.
• In order to determine seismic demands of the structures, the number of
selected ground motions should be chosen as small as possible.
• It should also be applicable for both far field and near-field records.
• The distribution in the earthquake shaking for the selected characterization of
the hazard should be preserved for the site of interest.
• Bidirectional effect of the records should be considered.
• Scale factors should be less than four.
The scaling procedure is also adopted from a previous study carried out by
Constantinou and Ozdemir (2010). Their suggested scaling procedure is conducted in
two phase. In first stage, the selected ground motions should be made compatible
with the target spectrum that is called geo-mean scaling. This method is based on
minimizing sum of the weighted squared errors between the geometric mean of the
two horizontal components and the target spectral values at various periods by
amplitude scaling. The geometric mean of the acceleration spectra of the two
horizontal ground motion components is calculating and mean value of these
spectrums correspond to each ground motion pairs is calculated. On the other hand,
target spectrum values are taken from Turkish Earthquake Code (TEC) (2007) for the
soft soil conditions. The corresponding spectral ordinates values for MCE are
selected to be 1.5 times the ordinates of DE (design earthquake) spectra (ASCE,
2005; TEC, 2007). The soft soil definition is given by choosing spectrum
characteristic periods TA = 0.20 sec, and TB = 0.6 sec. Target spectral accelerations
are calculated by;
A(T) = AoIS(T)
(2.1)
19
that is in accordance with TEC (2007). The selected values are :
Ao (effective ground acceleration coefficient) = 0.4
I (building importance factor) = 1.0
S(T) (spectrum coefficient) = 2.5 (for TA ≤ T ≤ TB)
A(T) is the spectral acceleration coefficient corresponding to 5% damped design
spectrum normalized by the acceleration gravity. It is obtained as 1.5g between the
spectrum characteristic periods for MCE. (Constantinou and Ozdemir, 2010).
The comparison of the target MCE spectra with the mean SRSS of the spectral
components of the scaled ground motions are concerned after the first phase of
scaling.
On the other hand, the requirements of ASCE (2005) should be checked for dynamic
analysis in second part. Scaling of each pair of ground motions was concerned such
that the average of the SRSS spectra from all ground motion pairs does not fall below
1.3 times the corresponding ordinate of the target response spectrum by more than
10% for each period between 0.5TD and 1.25TM. TD and TM are the effective periods
in the DE and the MCE, respectively. (Constantinou and Ozdemir, 2010).
The product of two scaling factor corresponding to each scaling stage is the final
scale factor. These scaling factors are represented in Table 2.2.
20
Ground Motion
Scale Factor (MCE)
CC101 2.43EE 1.24
IVA4 1.75IVA5 1.48IVA6 1.24
IVA10 2.7KD 1.74KY 1.39
LPCor 2.2LPSar 2.41
PC 1.73
Table 2.1 Characteristics of - near fault ground motions recorded at soft soil.
Chi Chi N 0.25 49.4 35.1(CC101) W 0.20 67.9 75.4Erzincan NS 0.52 83.9 27.4
(EE) EW 0.50 64.3 22.8Imperial Valley 140 0.49 37.4 20.2
(IVA4) 230 0.36 76.6 59.0Imperial Valley 140 0.52 46.9 35.4
(IVA5) 230 0.38 90.5 63.0Imperial Valley 140 0.41 64.9 27.7
(IVA6) 230 0.44 109.8 65.9Imperial Valley 50 0.17 47.5 31.1
(IVA10) 320 0.22 41.0 19.4Kocaeli 180 0.31 58.8 44.1(KD) 270 0.36 46.4 17.6
Kocaeli 60 0.27 65.7 57.0(KY) 330 0.35 62.1 51.0
Loma Prieta 0 0.64 55.2 10.9(LPCor) 90 0.48 45.2 11.4
Loma Prieta 0 0.51 41.2 16.2(LPSar) 90 0.32 42.6 27.5Parkfield 90 0.60 63.3 14.1
(PC) 360 0.37 44.1 8.9
d (km) PGA (g) PGV (cm/sec)
PGD (cm)
1999
1999
1989
1990
2004
Magnitude (Mw)
Year
1999
1992
1979
1980
1981
Cholame 2 6.0 14.3
Corralitos 6.9 3.9
Saratoga 6.9 8.5
Duzce 7.5 15.4
Yarimca 7.5 4.8
Array 6 6.5 1.4
Array 10 6.5 6.21982
Array 4 6.5 7.1
Array 5 6.5 4.0
TCU101 7.6 2.1
Erzincan 6.7 4.4
Earthquake Station Component
Table 2.2 Scale factor of near-fault ground motions for soft soil records.
21
CHAPTER 3
3. PROPERTIES OF ISOLATION SYSTEM AND SIMPLIFIED METHOD
OF ANALYSIS
3.1. Properties of Isolation System – Mechanical Characteristics of Lead
Rubber Bearings (LRBs)
In general, equivalent linear model is used for seismic isolation bearings when
demand analysis is concerned. However, since more approximate estimation of
bearing performance of isolation systems under maximum capable earthquakes
(MCE) is needed, nonlinear demand analysis has been used extensively in recent
years (Fenves et al, 2000).
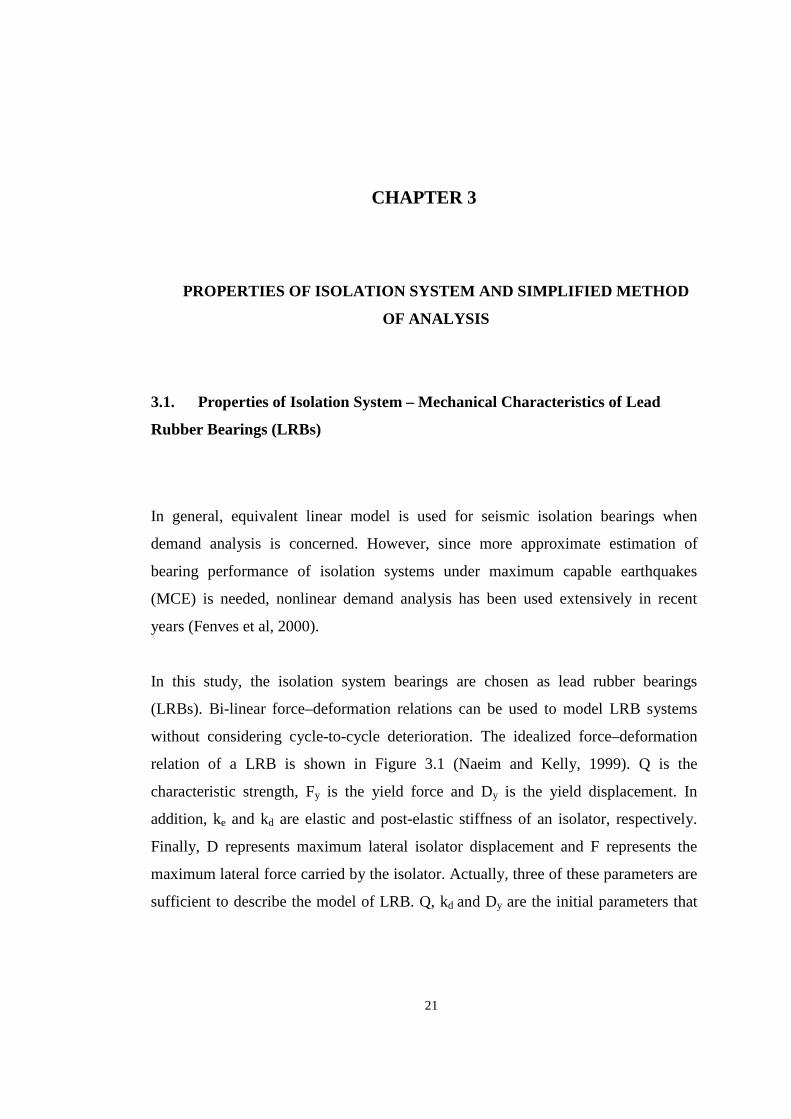
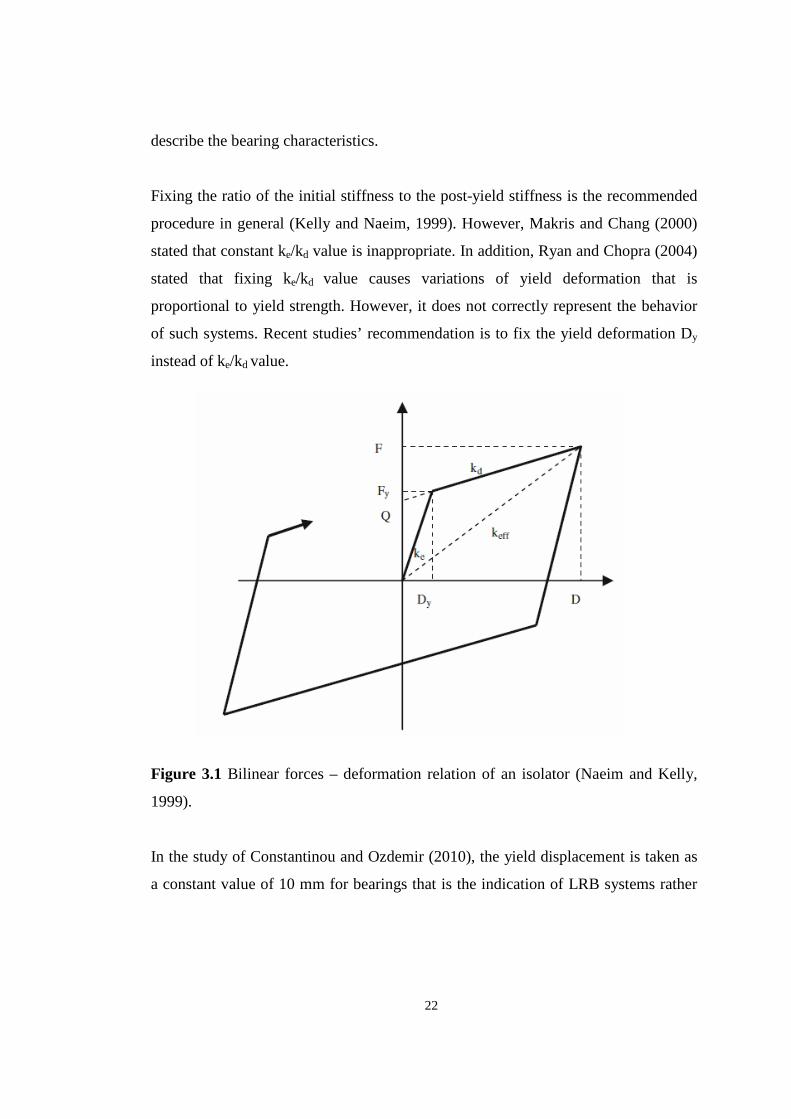
In this study, the isolation system bearings are chosen as lead rubber bearings
(LRBs). Bi-linear force–deformation relations can be used to model LRB systems
without considering cycle-to-cycle deterioration. The idealized force–deformation
relation of a LRB is shown in Figure 3.1 (Naeim and Kelly, 1999). Q is the
characteristic strength, Fy is the yield force and Dy is the yield displacement. In
addition, ke and kd are elastic and post-elastic stiffness of an isolator, respectively.
Finally, D represents maximum lateral isolator displacement and F represents the
maximum lateral force carried by the isolator. Actually, three of these parameters are
sufficient to describe the model of LRB. Q, kd and Dy are the initial parameters that
kkk
22
describe the bearing characteristics.
Fixing the ratio of the initial stiffness to the post-yield stiffness is the recommended
procedure in general (Kelly and Naeim, 1999). However, Makris and Chang (2000)
stated that constant ke/kd value is inappropriate. In addition, Ryan and Chopra (2004)
stated that fixing ke/kd value causes variations of yield deformation that is
proportional to yield strength. However, it does not correctly represent the behavior
of such systems. Recent studies’ recommendation is to fix the yield deformation Dy
instead of ke/kd value.
Figure 3.1 Bilinear forces – deformation relation of an isolator (Naeim and Kelly,
1999).
In the study of Constantinou and Ozdemir (2010), the yield displacement is taken as
a constant value of 10 mm for bearings that is the indication of LRB systems rather
kkkk
23
than sliding systems. On the other hand, they also stated that the calculated isolation
displacements and base shears are not affected significantly by the yield
displacement. In this thesis, Dy is also taken as 10 mm.
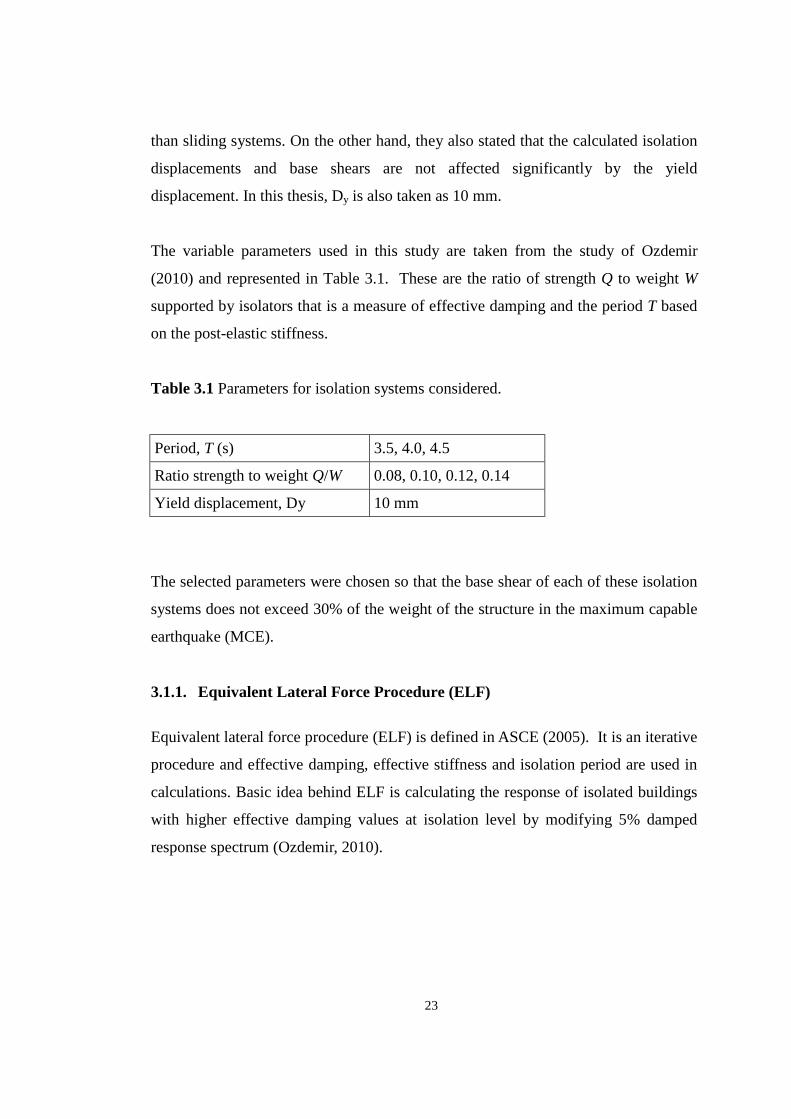
The variable parameters used in this study are taken from the study of Ozdemir
(2010) and represented in Table 3.1. These are the ratio of strength Q to weight W
supported by isolators that is a measure of effective damping and the period T based
on the post-elastic stiffness.
Table 3.1 Parameters for isolation systems considered.
Period, T (s) 3.5, 4.0, 4.5
Ratio strength to weight Q/W 0.08, 0.10, 0.12, 0.14
Yield displacement, Dy 10 mm
The selected parameters were chosen so that the base shear of each of these isolation
systems does not exceed 30% of the weight of the structure in the maximum capable
earthquake (MCE).
3.1.1. Equivalent Lateral Force Procedure (ELF) Equivalent lateral force procedure (ELF) is defined in ASCE (2005). It is an iterative
procedure and effective damping, effective stiffness and isolation period are used in
calculations. Basic idea behind ELF is calculating the response of isolated buildings
with higher effective damping values at isolation level by modifying 5% damped
response spectrum (Ozdemir, 2010).
24
According to ELF, the effective stiffness keff and effective damping βeff of a single-
degree-of-freedom system are the representation of the isolated structure and given
by:
deff k
DQk +=
22)(4
DkDDQ
eff
yeff π
β−
=
As mentioned before, Q, kd and Dy are the selected initial parameters and the
beginning of the ELF procedure start with the assumption of displacement D.
Afterward, the effective stiffness keff is calculated followed by the calculation of
effective damping βeff and the effective period Teff as represented through Equations
3.1 - 3.3, respectively. The numerator in the calculation of βeff is the area of
hysteretic loop that is the representation of the energy dissipated at each cycle.
gkWTeff
eff π2=
where; W = weight carried by isolator,
g = gravitational acceleration.
In the calculation of design displacement, damping reduction factor, B is also
needed. Simplified elastic methods for increasing damping values can be used by
modifying the 5% damped elastic response spectrum. Elastic spectrum for damping
values greater than 5% can simply be obtained by dividing the 5% spectrum by
kkkkk
(3.1)
(3.2)
(3.3)
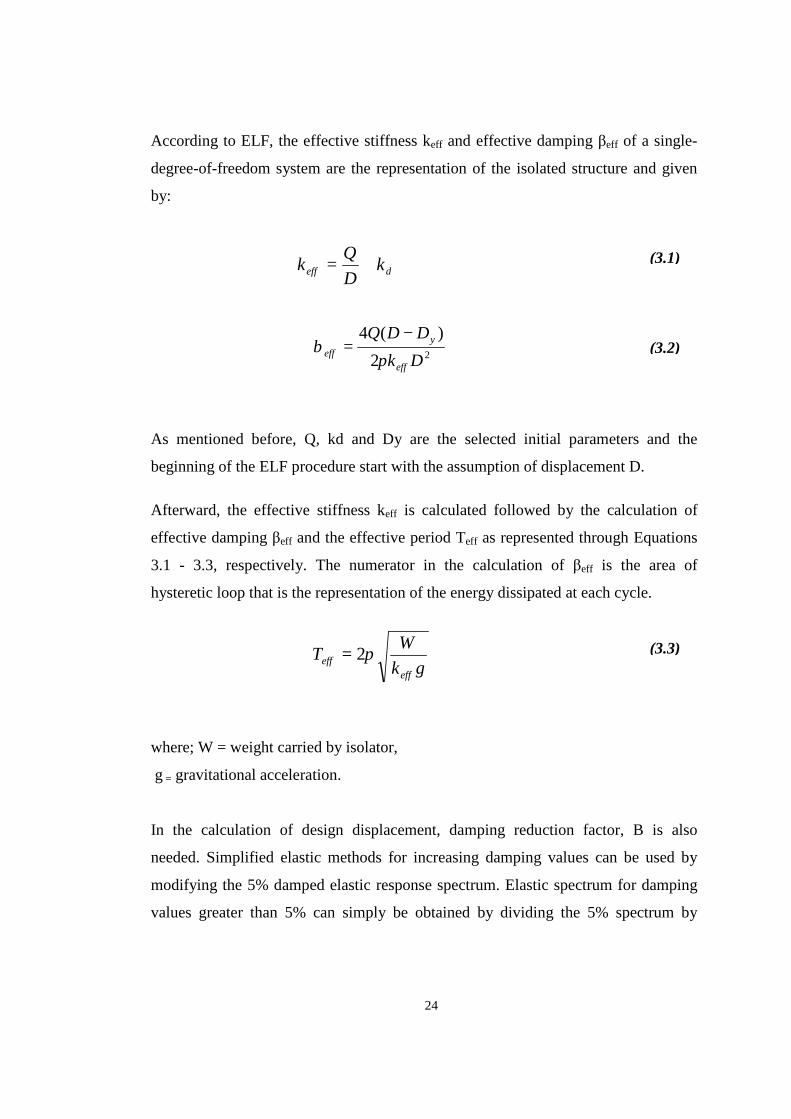
25
factor B. In Table 3.2, values of damping reduction factor in codes and specifications
are given in terms of βeff. The mentioned codes and specifications are AASHTO
(American Association of State Highway and Transportation Officials, 1999),
NEHRP (Building Seismic Safety Council, 2003), ASCE (American Society of Civil
Engineers, 2005), Eurocode 8 (European Committee for Standardization, 2005) and
recommendations in FEMA 440 (Applied Technology Council, 2005). In this study,
B values are chosen from ASCE (2005).
Table 3.2 Damping reduction factor B in codes and specifications.
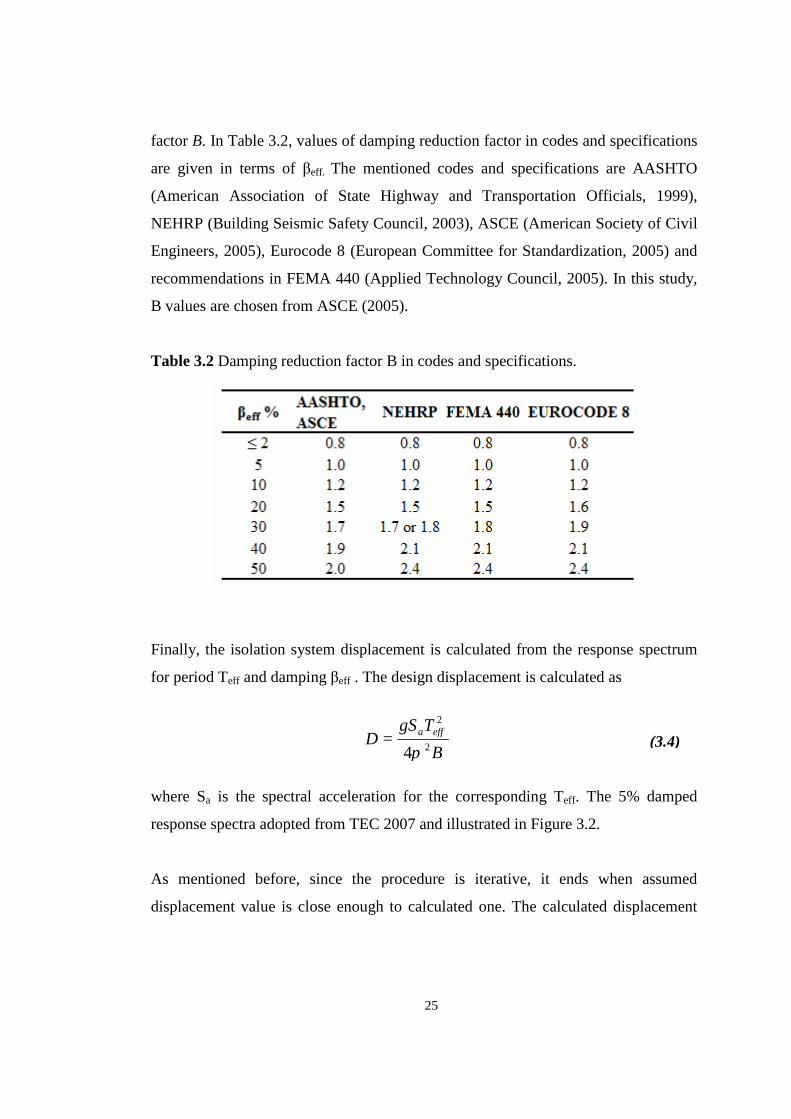
Finally, the isolation system displacement is calculated from the response spectrum
for period Teff and damping βeff . The design displacement is calculated as
B
TgSD effa
2
2
4π=
where Sa is the spectral acceleration for the corresponding Teff. The 5% damped
response spectra adopted from TEC 2007 and illustrated in Figure 3.2.
As mentioned before, since the procedure is iterative, it ends when assumed
displacement value is close enough to calculated one. The calculated displacement
HHH
(3.4)
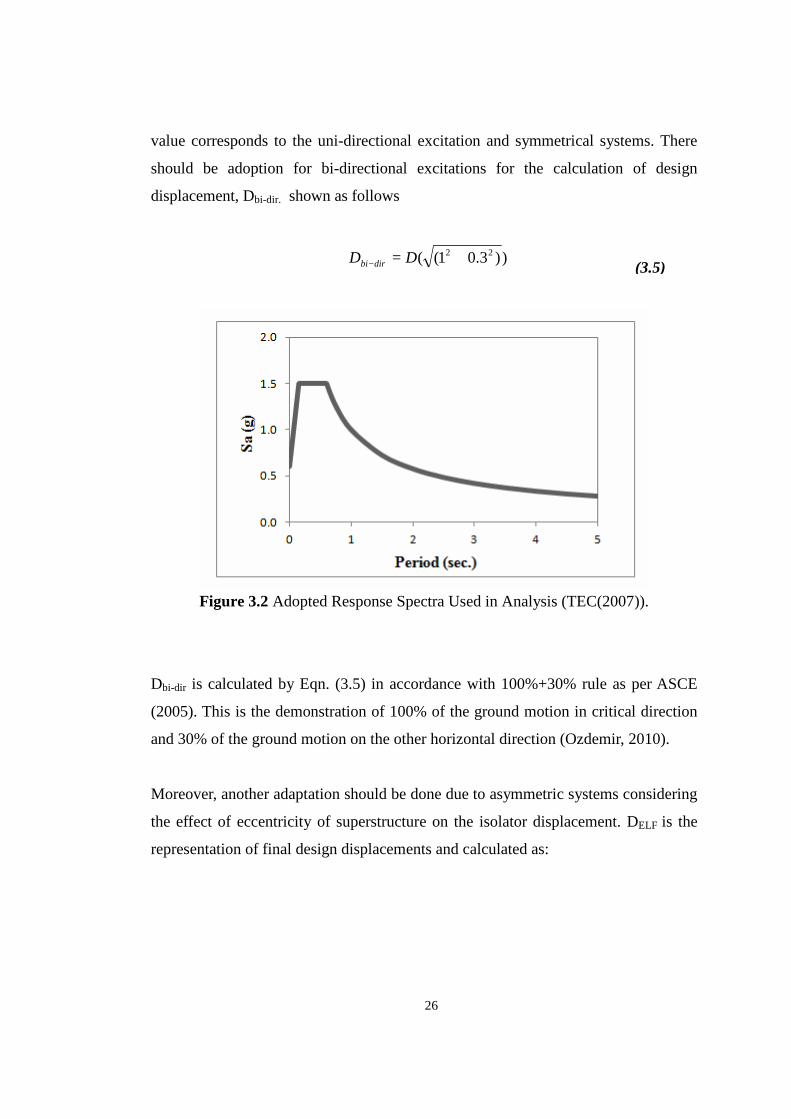
26
value corresponds to the uni-directional excitation and symmetrical systems. There
should be adoption for bi-directional excitations for the calculation of design
displacement, Dbi-dir. shown as follows
))3.01(( 22 +=− DD dirbi
Figure 3.2 Adopted Response Spectra Used in Analysis (TEC(2007)).
Dbi-dir is calculated by Eqn. (3.5) in accordance with 100%+30% rule as per ASCE
(2005). This is the demonstration of 100% of the ground motion in critical direction
and 30% of the ground motion on the other horizontal direction (Ozdemir, 2010).
Moreover, another adaptation should be done due to asymmetric systems considering
the effect of eccentricity of superstructure on the isolator displacement. DELF is the
representation of final design displacements and calculated as:
(3.5)
27
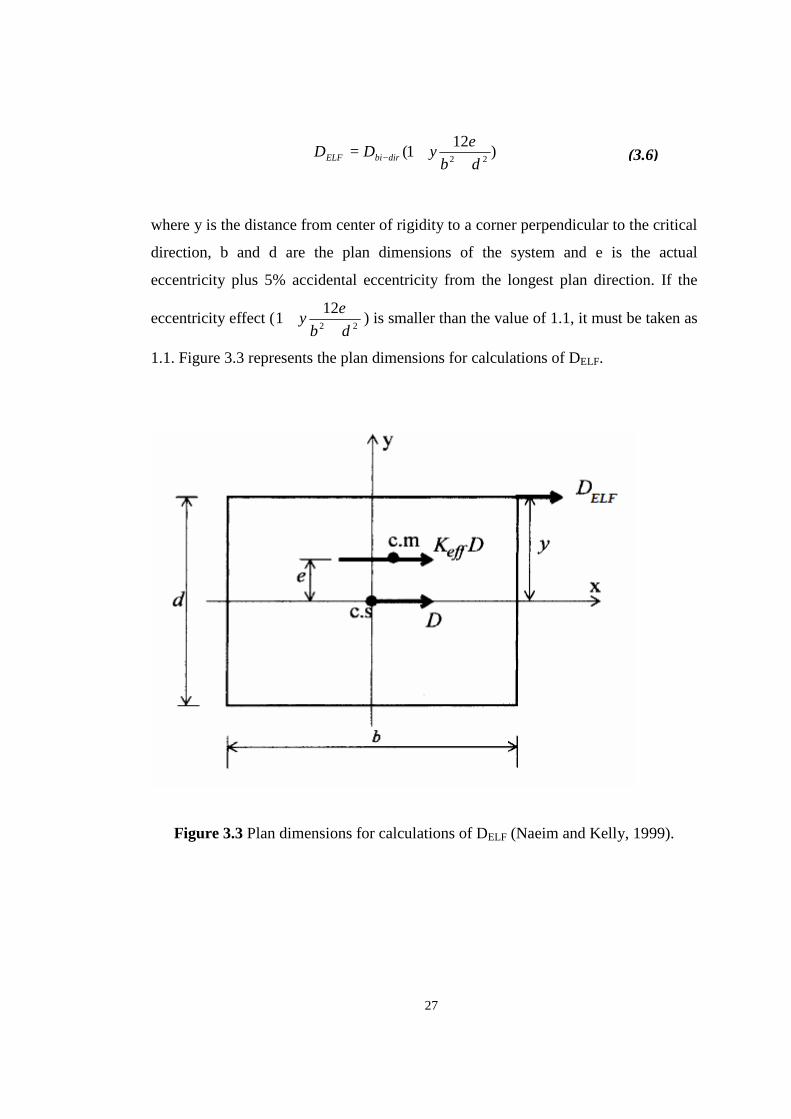
)121( 22 dbeyDD dirbiELF +
+= −
where y is the distance from center of rigidity to a corner perpendicular to the critical
direction, b and d are the plan dimensions of the system and e is the actual
eccentricity plus 5% accidental eccentricity from the longest plan direction. If the
eccentricity effect ( 22
121dbey
++ ) is smaller than the value of 1.1, it must be taken as
1.1. Figure 3.3 represents the plan dimensions for calculations of DELF.
Figure 3.3 Plan dimensions for calculations of DELF (Naeim and Kelly, 1999).
(3.6)
28
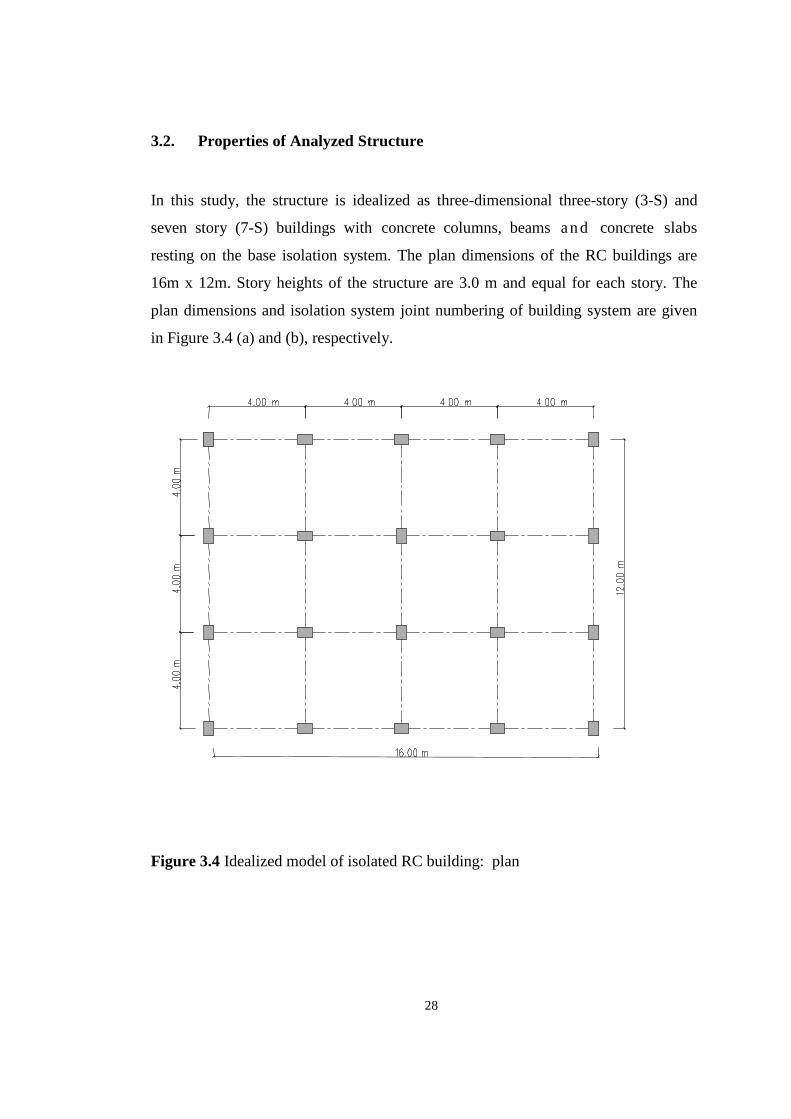
3.2. Properties of Analyzed Structure
In this study, the structure is idealized as three-dimensional three-story (3-S) and
seven story (7-S) buildings with concrete columns, beams a n d concrete slabs
resting on the base isolation system. The plan dimensions of the RC buildings are
16m x 12m. Story heights of the structure are 3.0 m and equal for each story. The
plan dimensions and isolation system joint numbering of building system are given
in Figure 3.4 (a) and (b), respectively.
Figure 3.4 Idealized model of isolated RC building: plan
29
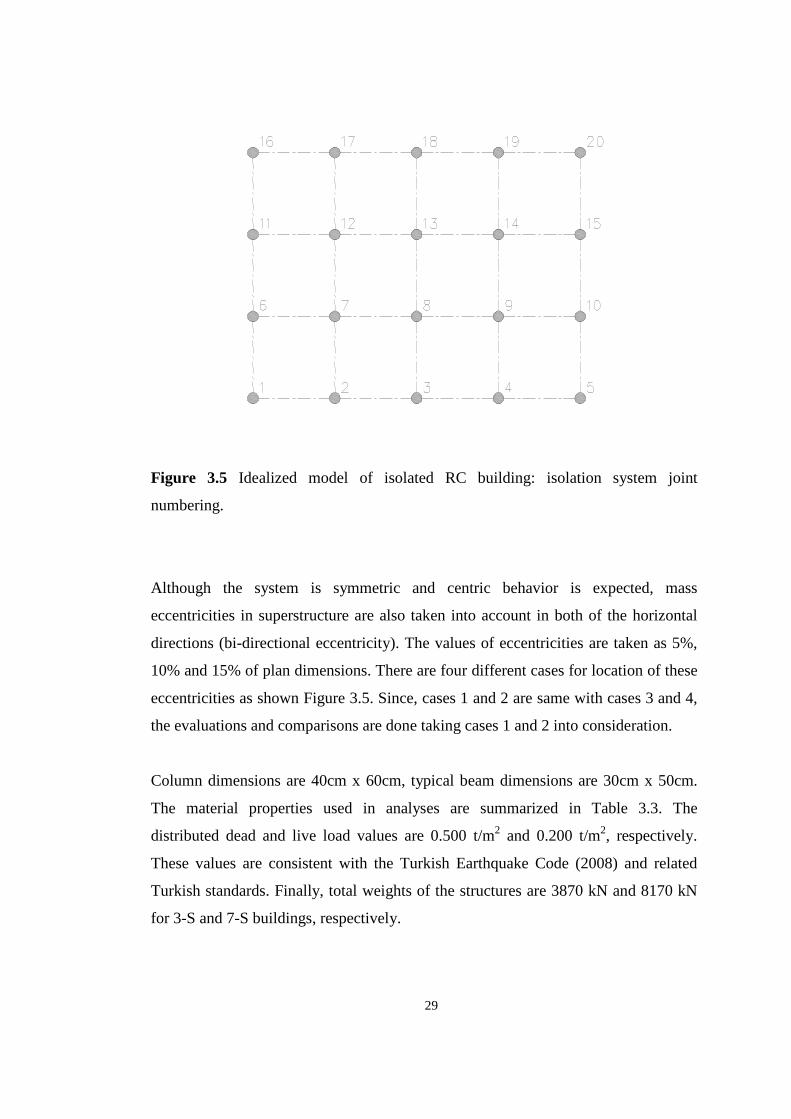
Figure 3.5 Idealized model of isolated RC building: isolation system joint
numbering.
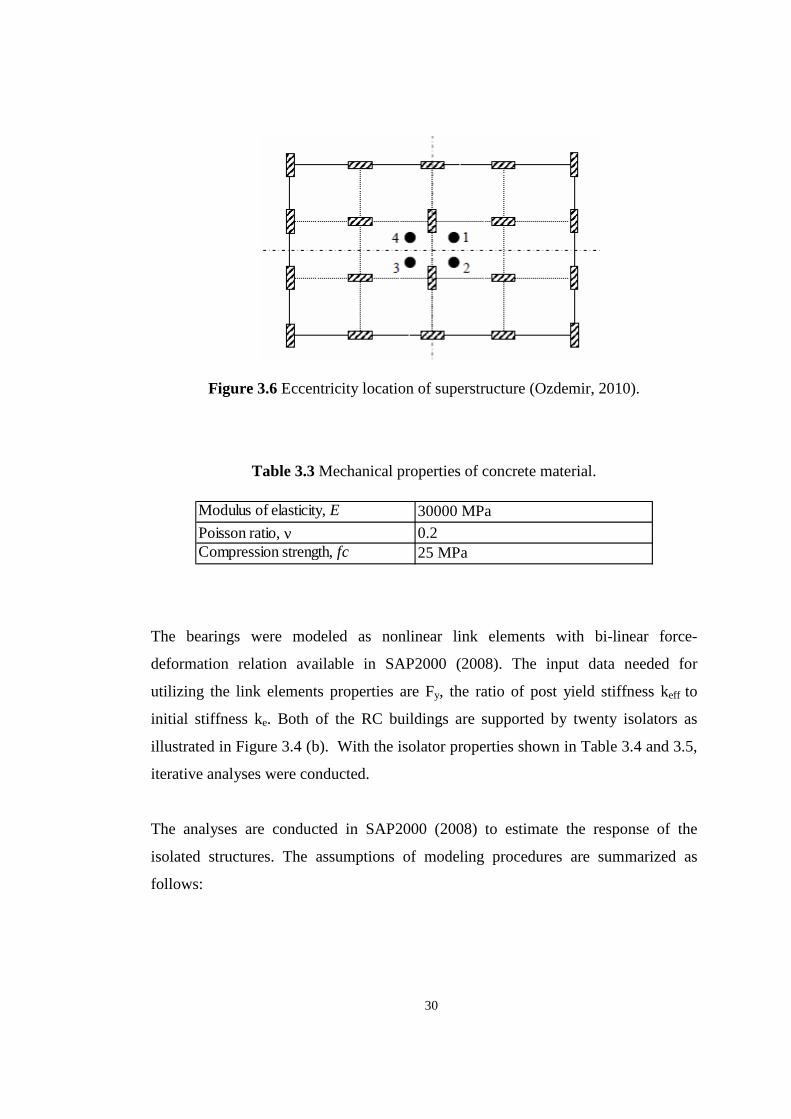
Although the system is symmetric and centric behavior is expected, mass
eccentricities in superstructure are also taken into account in both of the horizontal
directions (bi-directional eccentricity). The values of eccentricities are taken as 5%,
10% and 15% of plan dimensions. There are four different cases for location of these
eccentricities as shown Figure 3.5. Since, cases 1 and 2 are same with cases 3 and 4,
the evaluations and comparisons are done taking cases 1 and 2 into consideration.
Column dimensions are 40cm x 60cm, typical beam dimensions are 30cm x 50cm.
The material properties used in analyses are summarized in Table 3.3. The
distributed dead and live load values are 0.500 t/m2 and 0.200 t/m2, respectively.
These values are consistent with the Turkish Earthquake Code (2008) and related
Turkish standards. Finally, total weights of the structures are 3870 kN and 8170 kN
for 3-S and 7-S buildings, respectively.
30
Modulus of elasticity, E 30000 MPaPoisson ratio, ν 0.2Compression strength, fc 25 MPa
Figure 3.6 Eccentricity location of superstructure (Ozdemir, 2010).
Table 3.3 Mechanical properties of concrete material.
The bearings were modeled as nonlinear link elements with bi-linear force-
deformation relation available in SAP2000 (2008). The input data needed for
utilizing the link elements properties are Fy, the ratio of post yield stiffness keff to
initial stiffness ke. Both of the RC buildings are supported by twenty isolators as
illustrated in Figure 3.4 (b). With the isolator properties shown in Table 3.4 and 3.5,
iterative analyses were conducted.
The analyses are conducted in SAP2000 (2008) to estimate the response of the
isolated structures. The assumptions of modeling procedures are summarized as
follows:
31
• All floors for all story level have three degree of freedoms: two translations
and one rotation. This is due to their rigidity in their own plane.
• Superstructure frame members are taken as elastic.
• Soil-structure interaction effects on the response of structure are not taken
into consideration.
• Although columns provide lateral stiffness, they are weightless and
inextensible.
• Mass of a floor is equally distributed among the joints of that floor level.
• For the first three modes, the damping was specified as 2%. For the other
higher modes, it was assigned as 5%. The logic behind the 2% damping is
that it is conservative to choose damping lower since the seismically isolated
superstructure behaves almost elastically.
Tables 3.6 and 3.7 show the periods of the first three fixed-base modes of the 3-S and
7-S buildings under elastic conditions, respectively.
32
3.5 0.08 145.61 0.171 2686.00 26.86 0.0393.5 0.10 164.07 0.221 3332.00 33.32 0.0323.5 0.12 185.47 0.267 3977.00 39.77 0.0273.5 0.14 211.81 0.311 4622.00 46.22 0.0234.0 0.08 117.92 0.196 2661.16 26.61 0.0304.0 0.10 134.60 0.249 3307.16 33.07 0.0254.0 0.12 155.32 0.298 3952.16 39.52 0.0214.0 0.14 181.20 0.344 4597.16 45.97 0.0184.5 0.08 98.04 0.217 2644.12 26.44 0.0244.5 0.10 114.00 0.274 3290.12 32.90 0.0194.5 0.12 134.45 0.327 3935.12 39.35 0.0164.5 0.14 162.50 0.377 4580.12 45.80 0.014
Yield Strength Fy (kN)
Post Yield Stiffness
Ratio
Period T (sec.)
Q/WEffective
Stiffness keff
(kN/m)
Effective Damping
βeff
Elastic Stiffness
ke (kN/m)
3.5 0.08 307.43 0.171 5671.78 56.72 0.0393.5 0.10 346.35 0.221 7033.78 70.34 0.0323.5 0.12 391.52 0.267 8394.78 83.95 0.0273.5 0.14 447.13 0.311 9756.78 97.57 0.0234.0 0.08 248.94 0.196 5619.33 56.19 0.0304.0 0.10 284.13 0.249 6981.33 69.81 0.0254.0 0.12 327.86 0.298 8342.33 83.42 0.0214.0 0.14 382.52 0.344 9704.33 97.04 0.0184.5 0.08 207.00 0.217 5583.37 55.83 0.0244.5 0.10 240.66 0.274 6945.37 69.45 0.0194.5 0.12 283.83 0.327 8306.37 83.06 0.0164.5 0.14 343.04 0.377 9668.37 96.68 0.014
Post Yield Stiffness
Ratio
Period T (sec.) Q/W
Effective Stiffness keff
(kN/m)
Effective Damping
βeff
Elastic Stiffness ke
(kN/m)
Yield Strength Fy (kN)
Table 3.4 LRB properties used in analysis for 3-S buildings
Table 3.5 LRB properties used in analysis for 7-S buildings.
33
MODE PERIOD (sec.)1 (Translation ) 0.18
2 (Translation ) 0.18
3 (Rotation) 0.14
MODE PERIOD (sec.)
1 (Translation ) 0.45
2 (Translation ) 0.44
3 (Rotation) 0.15
Table 3.6 The first three periods of modes of analyzed fixed-base 3-story building.
Table 3.7 The first three periods of modes of analyzed fixed-base 7-story building.
Figure 3.7 3-D model of 3-S RC structure in SAP2000.
34
Figure 3.8 3-D model of 7-S RC structure in SAP2000.
35
CHAPTER 4
4. ANALYSES OF STRUCTURES
4.1. General Concepts
In this study, 1848 Nonlinear RHA was conducted under bi-directional earthquake
excitations in structural analysis program SAP2000 (2008). The ground motion
excitations are applied simultaneously like in Figure 4.1. The response of symmetric
buildings for both combinations gives same results. On the other hand, asymmetric
buildings are subjected to both combinations of ground motion excitations. The
maximum response of these two combinations has been investigated.
Figure 4.1 Application of bi-directional ground motion excitations (Ozdemir 2010).
36
As mentioned in Chapter 3, eccentricity in superstructure can be provided in two
different ways: stiffness and mass eccentricity. The type of irregularity on
superstructure is chosen as mass eccentricity for analyses. Therefore, seismically
isolated buildings with eccentric superstructure are also subjected to real scaled
ground motions. Then, the same procedures with symmetric buildings are applied for
asymmetric buildings, when calculating mean values of isolator displacements. The
selected level of mass eccentricity values are chosen as 5%, 10% and 15% of plan
dimensions of floors in both horizontal directions. On the other hand, as previously
described, there are four different cases for location of these eccentricities as shown
in Figure 3.5. Since, cases 1 and 2 are approximately same with cases 3 and 4, the
evaluations and comparisons are done taking cases 1 and 2 into consideration.
The torsional amplifications of superstructure asymmetry on seismically isolated
buildings are investigated. The variations of base shears, torsional moments, isolator
displacements, floor displacements and accelerations are compared based on the
level of eccentricities. The discussions of results are summarized in the following
sections.
4.2. Base Shear
Reduction of base shear is one of the basic purposes of base isolation system in
design of buildings since it decreases earthquake damage. As a result, variation of
base shear with different effective damping values, isolation periods and level of
eccentricities are investigated in this thesis. Base shear results of Nonlinear RHA of
near-fault ground motions under two horizontal orthogonal directions were
calculated. Maximum of calculated base shear are taken and normalized with weight
of analyzed buildings. VRHA is the representation of maximum base shear.
37
The variation of normalized base shear as a function of effective damping and
isolation periods for different level of eccentricities of 3-story (3-S) and 7-story (7-S)
buildings are given in Figure 4.2 and 4.3, respectively.
Figure 4.2 Variation of maximum base shears with damping for different level of
eccentricities in 3- story superstructure.
According to nonlinear RHA results, alteration of normalized VRHA is nearly same
for each level of eccentricities and can be seen in Figures 4.2 and 4.3. The
normalized base shear values are also similar for 3-S and 7-S for same periods,
damping values and eccentricities. This means that change in superstructure has no
ddd
38
Figure 4.3 Variation of maximum base shears with damping for different level of
eccentricities in 7- story superstructure.
effect on normalized base shear of isolated buildings. The variation of normalized
base shear when Q/W =0.14 for different level of eccentricity of 3-S and 7-S
buildings are given in Figure 4.4. The values of normalized base shear are very close
to each other and decrease from 0.25W to 0.2 W. Another conclusion from the
nonlinear RHA results of the analysis is that effective damping has no effect on base
shear. On the other hand, the increase of isolation periods causes a decrease in base
shear. However, it is very small and can be neglected. Finally, as mentioned before,
ssss
39
Figure 4.4 Variation of maximum base shears with different level of eccentricities
for different isolation periods and Q/W =0.14 in 3-S and 7-S buildings.
the selected parameters were chosen so that the base shear of each of these isolation
systems does not exceed 30% of the weight of the structure in the maximum
considered earthquake (MCE) and results meets the desired condition.
4.3. Torsional Moments
One of the expected results of mass eccentricity is torsional moment in buildings
since torsional moment is calculated as multiplication of base shear by eccentricity.
The effects of different level of eccentricities with different isolation period and
different effective damping values on torsional moment for 3-S and 7-S buildings are
investigated in this study and the results are illustrated in Figures 4.5 and 4.6.
Mtorsional is the representation of maximum torsional moment calculated from
nonlinear RHA. As similar to base shear results, effective damping ratio has no effect
on torsional moment. However, an increase in the eccentricity of building results in
an increase in torsional moment. Although the torsional moment of symmetrical
vjjjjjjj
40
Figure 4.5 Variation of maximum torsional moment with effective damping and
isolation periods for different level of eccentricities in 3- story (3-S) superstructure.
41
Figure 4.6 Variation of maximum torsional moment with effective damping and
isolation periods for different level of eccentricities in 7- story (7-S) superstructure.
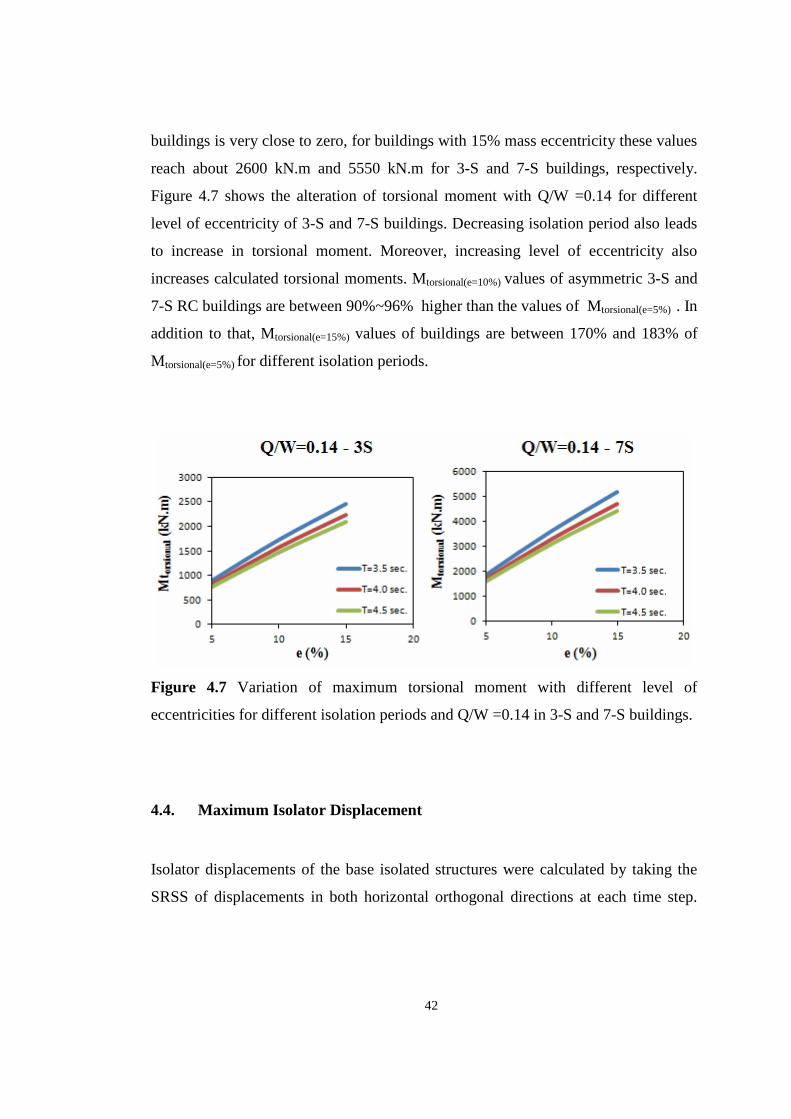
42
buildings is very close to zero, for buildings with 15% mass eccentricity these values
reach about 2600 kN.m and 5550 kN.m for 3-S and 7-S buildings, respectively.
Figure 4.7 shows the alteration of torsional moment with Q/W =0.14 for different
level of eccentricity of 3-S and 7-S buildings. Decreasing isolation period also leads
to increase in torsional moment. Moreover, increasing level of eccentricity also
increases calculated torsional moments. Mtorsional(e=10%) values of asymmetric 3-S and
7-S RC buildings are between 90%~96% higher than the values of Mtorsional(e=5%) . In
addition to that, Mtorsional(e=15%) values of buildings are between 170% and 183% of
Mtorsional(e=5%) for different isolation periods.
Figure 4.7 Variation of maximum torsional moment with different level of
eccentricities for different isolation periods and Q/W =0.14 in 3-S and 7-S buildings.
4.4. Maximum Isolator Displacement
Isolator displacements of the base isolated structures were calculated by taking the
SRSS of displacements in both horizontal orthogonal directions at each time step.
hhhhhh
43
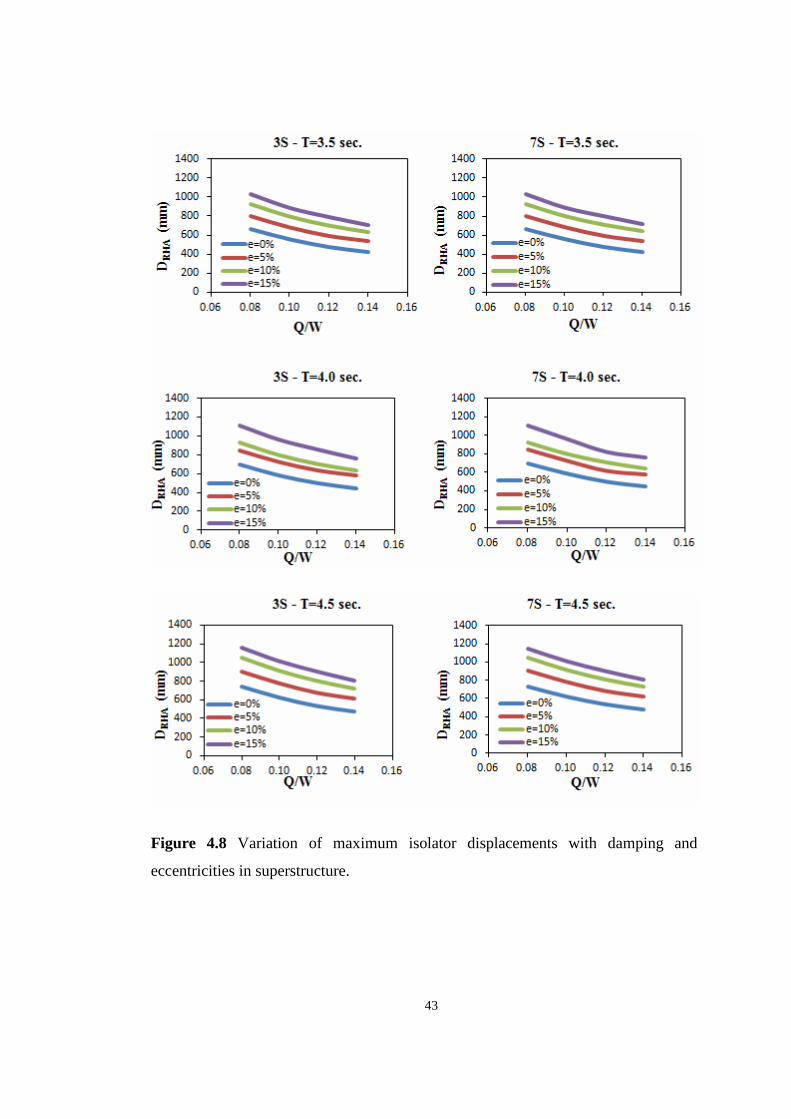
Figure 4.8 Variation of maximum isolator displacements with damping and
eccentricities in superstructure.
44
Afterward, the maximum of calculated isolator displacements were taken for each
ground motion pair. Finally, the mean values of maximum displacements of each
earthquake record (Table 3.1) are calculated. DRHA is the representation of mean
isolator displacement.
In Figure 4.8, the variations of DRHA are represented as functions of damping and
mass eccentricity in superstructure for various isolation periods. It is clear that
isolator displacement responses of 3-S and 7-S isolated buildings are very close to
each other for same damping and same level of eccentricities. It indicates that
isolator displacements are independent from superstructure in terms of story height.
On the other hand, the results taken from nonlinear RHA demonstrate the inverse
relation between damping (Q/W) and isolator displacements regardless of evaluated
isolation period and eccentricity above basement. Figure 4.8 displays the decreasing
tendency of isolator displacements due to increasing damping. Moreover, the amount
of decrease is nearly same for different isolation periods. These decreases are about
36%, 32%, 32% and 31% for symmetric and asymmetric 3-S and 7-S RC buildings
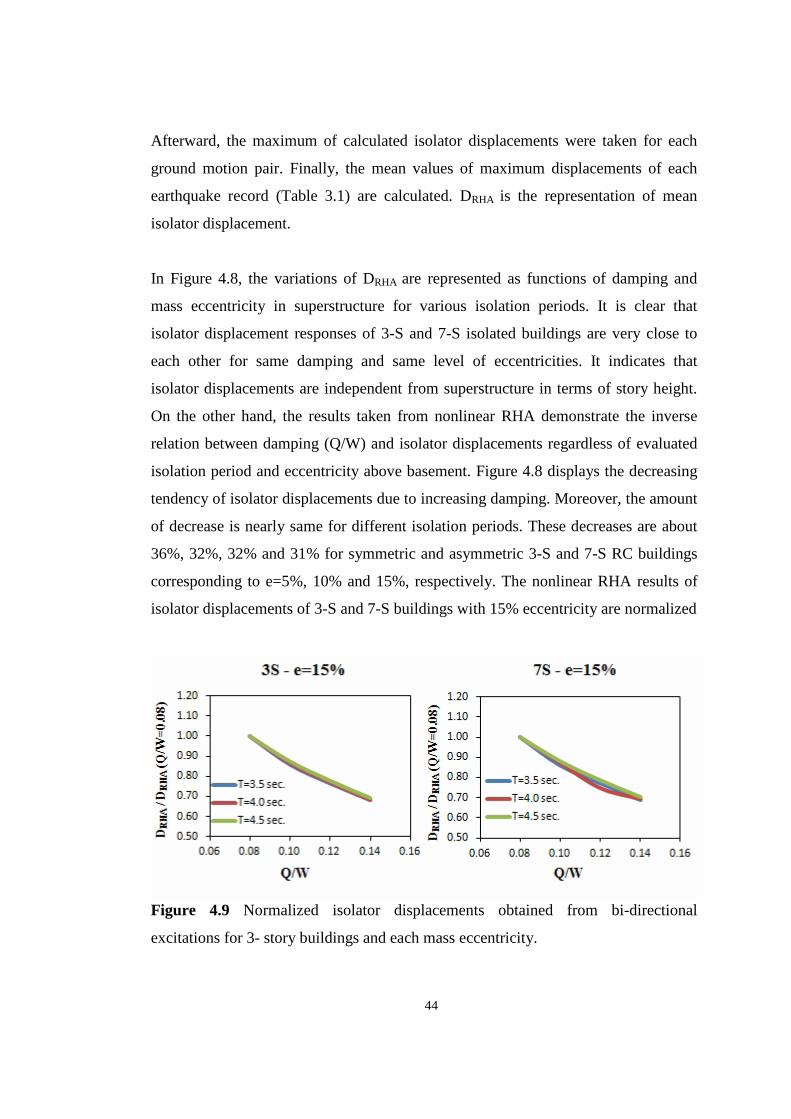
corresponding to e=5%, 10% and 15%, respectively. The nonlinear RHA results of
isolator displacements of 3-S and 7-S buildings with 15% eccentricity are normalized
Figure 4.9 Normalized isolator displacements obtained from bi-directional
excitations for 3- story buildings and each mass eccentricity.
45
with that of smallest effective damping (Q/W=0.08) and illustrated in Figure 4.9. The
normalized displacements are coincides with each other.
Increasing isolation period has increasing effects on isolator displacements. With the
variation of isolation period from 3.5 sec to 4.5 sec, DRHA values increase about
12%, 14%, 14% and 13% for symmetric and asymmetric 3-S and 7-S RC buildings
corresponding to e=5%, 10% and 15%, respectively.
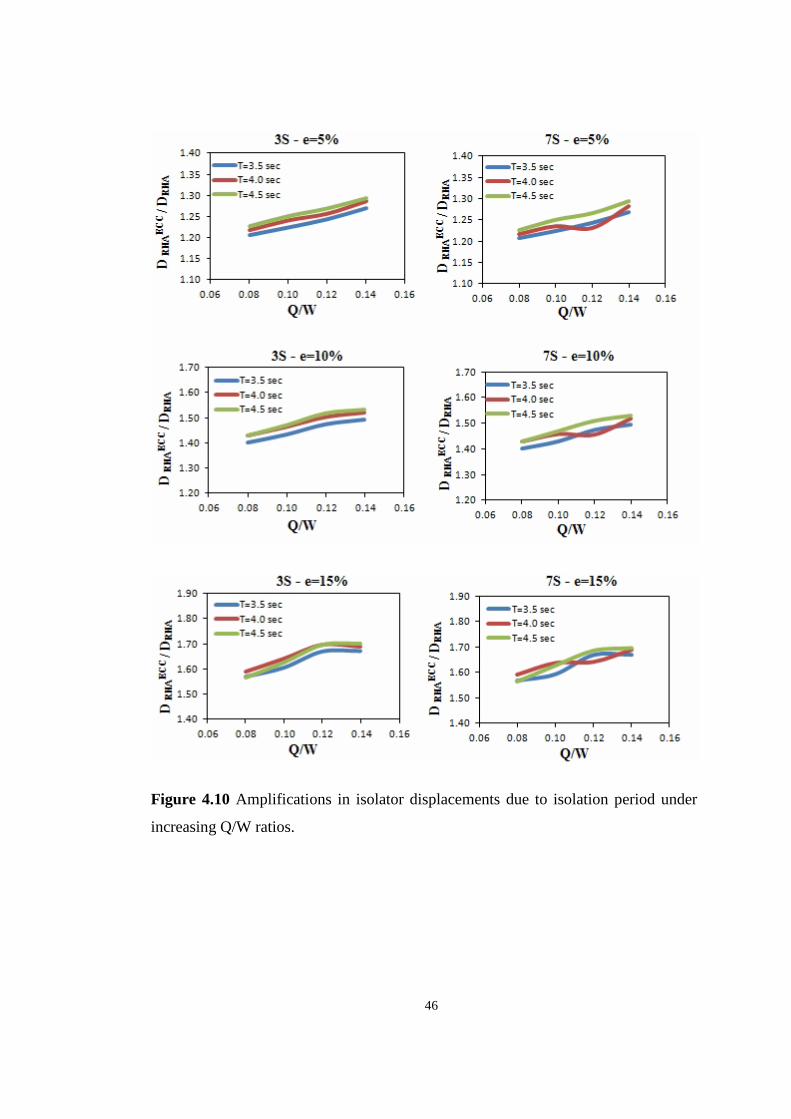
The variation of (DRHA)ecc/DRHA ratio for various effective damping values as a
function of isolation periods for 3-S and 7-S buildings are illustrated in Figure 4.10
for each level of eccentricity. These ratios generally increase slightly when isolation
periods increase for 3-S buildings. They are in between 1.15-1.30, 1.35-1.55 and
1.55-1.70 depending on Q/W ratio for e=5%, 10% and 15%, respectively. Figure
4.10, the decreasing tendency of (DRHA)ecc/DRHA with increasing damping, observed
in 3-S buildings, dissappears in 7-S buildings. The eccentricity increase diminishes
the effect of damping. Moreover, the isolation periods become ineffective on
(DRHA)ecc/DRHA.
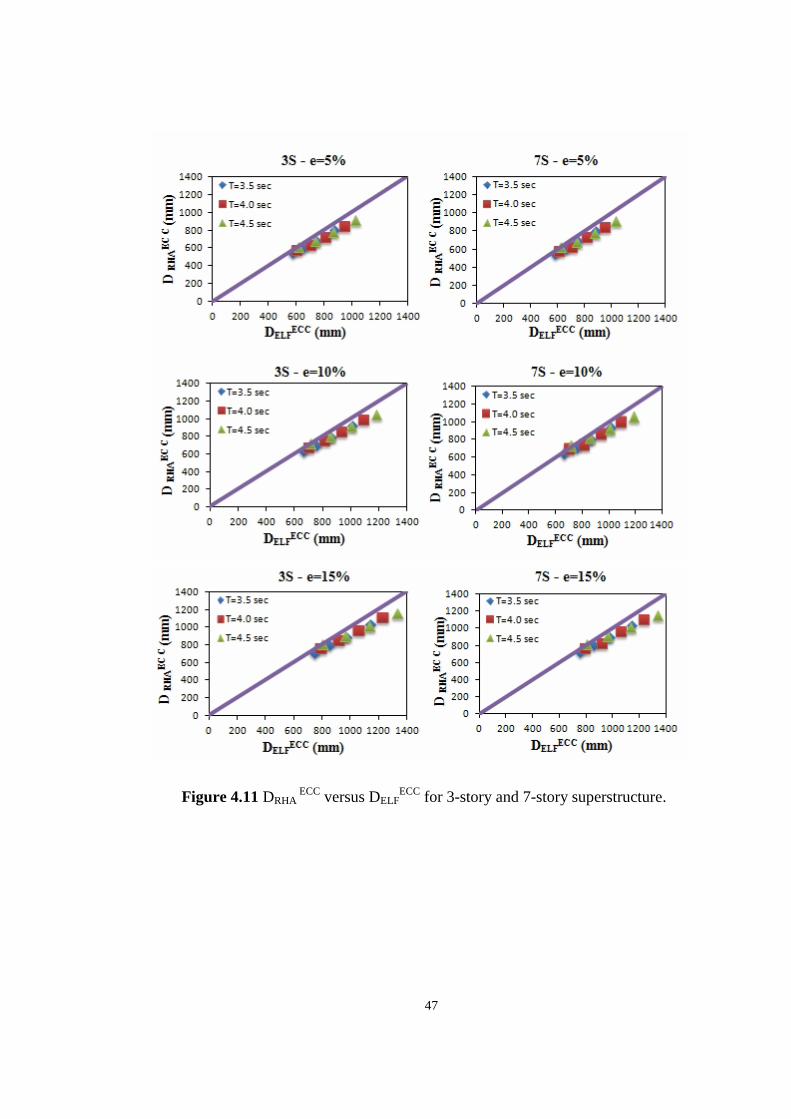
In this thesis, the accuracy of simplified method in terms of isolator displacement is
also investigated. In Figure 4.11, the horizontal and vertical axes show the isolator
displacements calculated by equivalent lateral force procedure (DELF) and maximum
resultant isolator displacements taken from nonlinear RHA (DRHA), respectively. The
solid lines imply the equality of DELF and DRHA values for each eccentricity. It is
clearly seen that almost all values are below the solid line that represents the
conservation of simplified method. The overestimation of isolator displacements of
ELF is about 10% and independent from the level of eccentricities, since different
level of eccentricities are concern in calculations of isolator displacements in
simplified method.
46
Figure 4.10 Amplifications in isolator displacements due to isolation period under
increasing Q/W ratios.
47
Figure 4.11 DRHA ECC versus DELF
ECC for 3-story and 7-story superstructure.
48
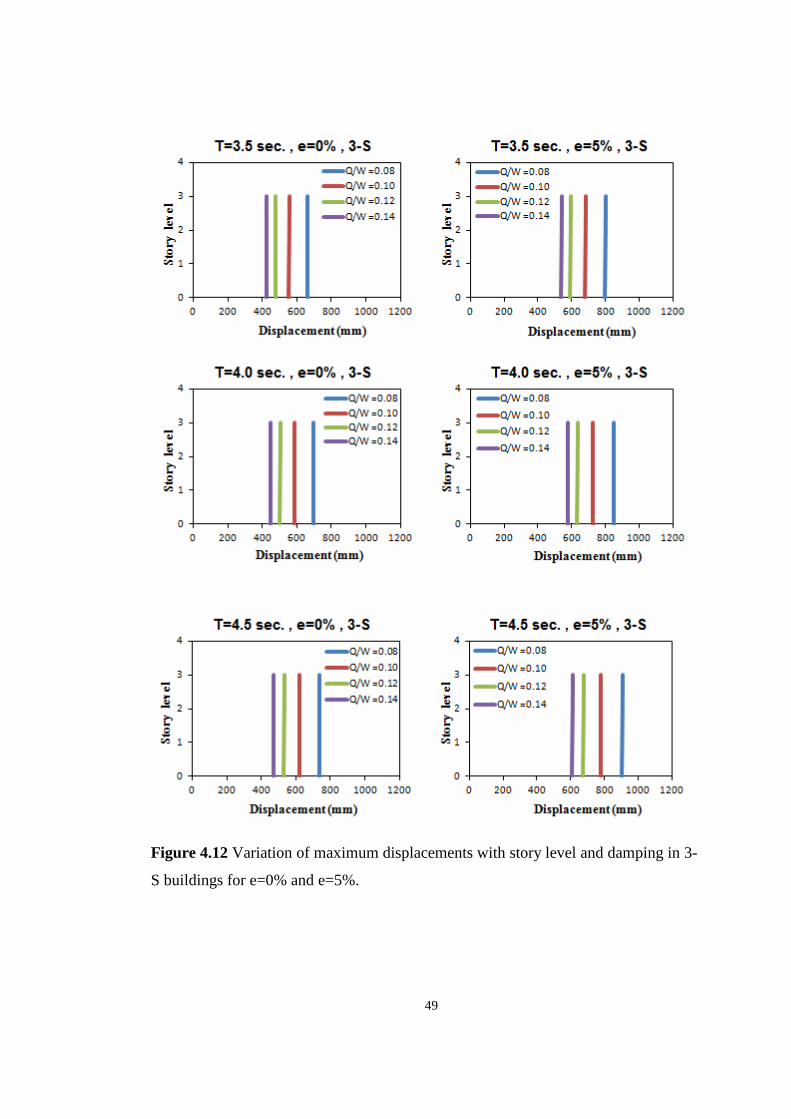
4.5. Floor Displacements
Calculation methods of floor displacements of 3-S and 7-S buildings are same as
calculation of isolator displacements. SRSS of displacements are calculated in both
horizontal orthogonal directions at each time step. Maximum of these displacements
are taken and average of each selected ground motion displacement is calculated.
The results are illustrated in Figure 4.12 and 4.13 for 3-S buildings and Figure 4.14
and 4.15 for 7-S buildings. Similar results are obtained for 3-S and 7-S buildings that
is the indication of independency of floor displacements to superstructure in terms of
story level. Increase in effective damping results in decrease in floor displacements
for both 3-S and 7-S buildings. The higher the effective damping values are, the
smaller the floor displacements are. On the other hand, there are remarkable
increases in displacements with increasing isolation periods. Level of eccentricity is
also an effective parameter that influences displacement response of buildings.
Reflection of increasing level of eccentricity is increasing floor displacements. As
expected, while story level is increasing, displacement increments between
successive floors are very small.
49
Figure 4.12 Variation of maximum displacements with story level and damping in 3-
S buildings for e=0% and e=5%.
50
Figure 4.13 Variation of maximum displacements with story level and damping in 3-
S buildings for e=10% and e=15%.
51
Figure 4.14 Variation of maximum displacements with story level and damping in 7-
S buildings for e=0% and e=5%.
52
Figure 4.15 Variation of maximum displacements with story level and damping in 7-
S buildings for e=10% and e=15%.
53
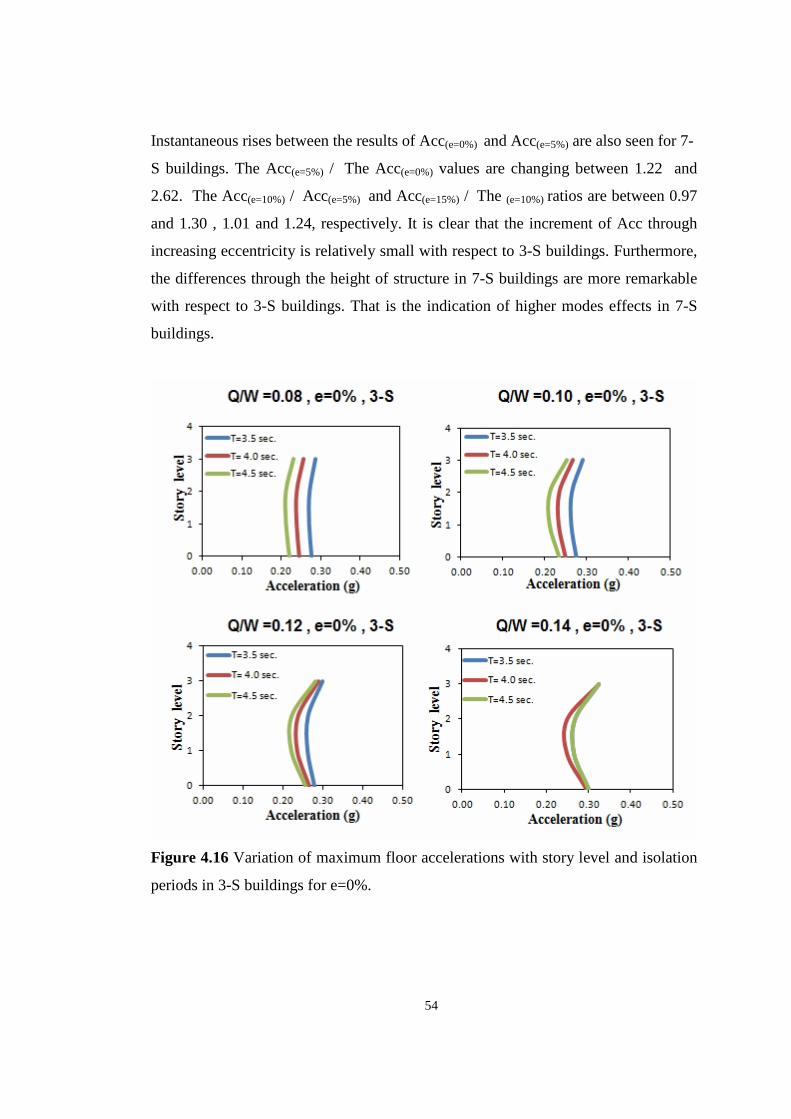
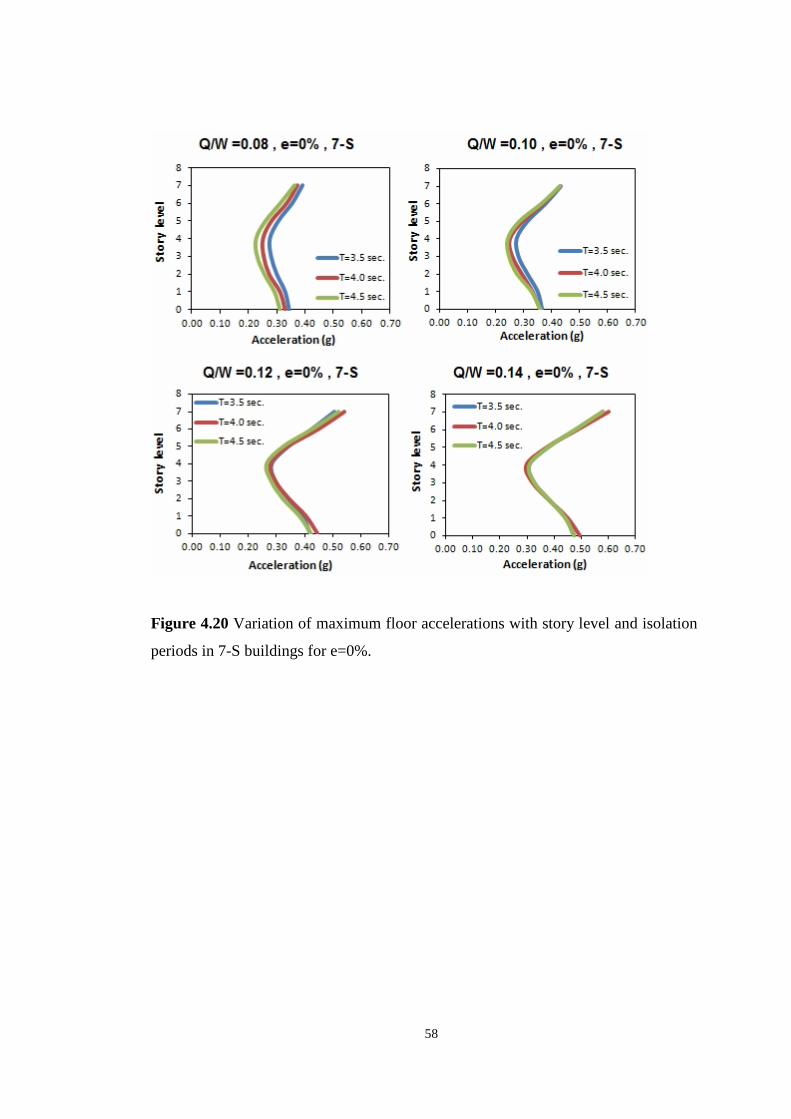
4.6. Floor Accelerations
Floor acceleration is another important parameter when earthquake damage is
concerned. One of the main purposes of seismic isolation is to reduce the floor
accelerations. In accordance with this intention, the variation of floor acceleration
with different level of eccentricity, isolation period and effective damping are
investigated in this study. Floor accelerations were calculated by taking maximum of
accelerations in both horizontal orthogonal directions at each time step of selected
ground motions. Then averages of these maximum accelerations of each ground
motion were calculated. Acc is the representation of this maximum average
acceleration.
The changes of floor acceleration with evaluated parameters are illustrated through
Figures 4.16-4.19 for 3-S buildings and Figures 4.20-4.23 for 7-S buildings. An
increase in isolation period results in a decrease in floor accelerations through height
of buildings in 3-S RC symmetric buildings. In case of asymmetric 3-S structures,
the decreasing effect of increasing periods becomes to disappear. In case of 7-S RC
symmetric buildings, the decreasing effect of increasing isolation periods continue
only for Q/W =0.08 and Q/W =0.10. For 7-S buildings with Q/W ratio equal to 0.12
and 0.14 and asymmetric 7-S buildings, this effect diminishes.
Another remarkable result of analyses is that a sudden increase is observed in floor
accelerations when comparing Acc(e=0%) with Acc(e=5%) for 3-S buildings . The
Acc(e=5%) values are 1.95 ~3.17 times higher than Acc(e=0%) values. The increase
between Acc values become relatively slow when level of eccentricity start to
increase. The Acc(e=10%) and Acc(e=15%) values are 1.05 ~1.36 and 1.02~1.14 times
higher than Acc(e=5%) Acc(e=10%) values, respectively.
54
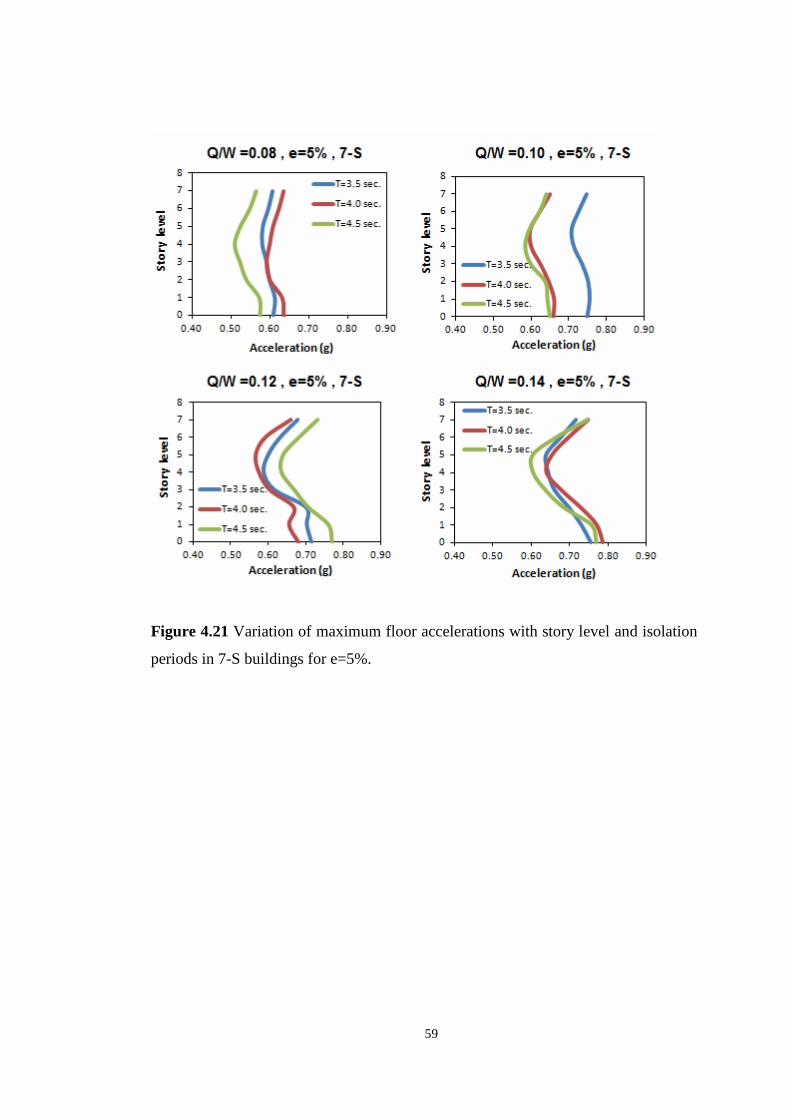
Instantaneous rises between the results of Acc(e=0%) and Acc(e=5%) are also seen for 7-
S buildings. The Acc(e=5%) / The Acc(e=0%) values are changing between 1.22 and
2.62. The Acc(e=10%) / Acc(e=5%) and Acc(e=15%) / The (e=10%) ratios are between 0.97
and 1.30 , 1.01 and 1.24, respectively. It is clear that the increment of Acc through
increasing eccentricity is relatively small with respect to 3-S buildings. Furthermore,
the differences through the height of structure in 7-S buildings are more remarkable
with respect to 3-S buildings. That is the indication of higher modes effects in 7-S
buildings.
Figure 4.16 Variation of maximum floor accelerations with story level and isolation
periods in 3-S buildings for e=0%.
55
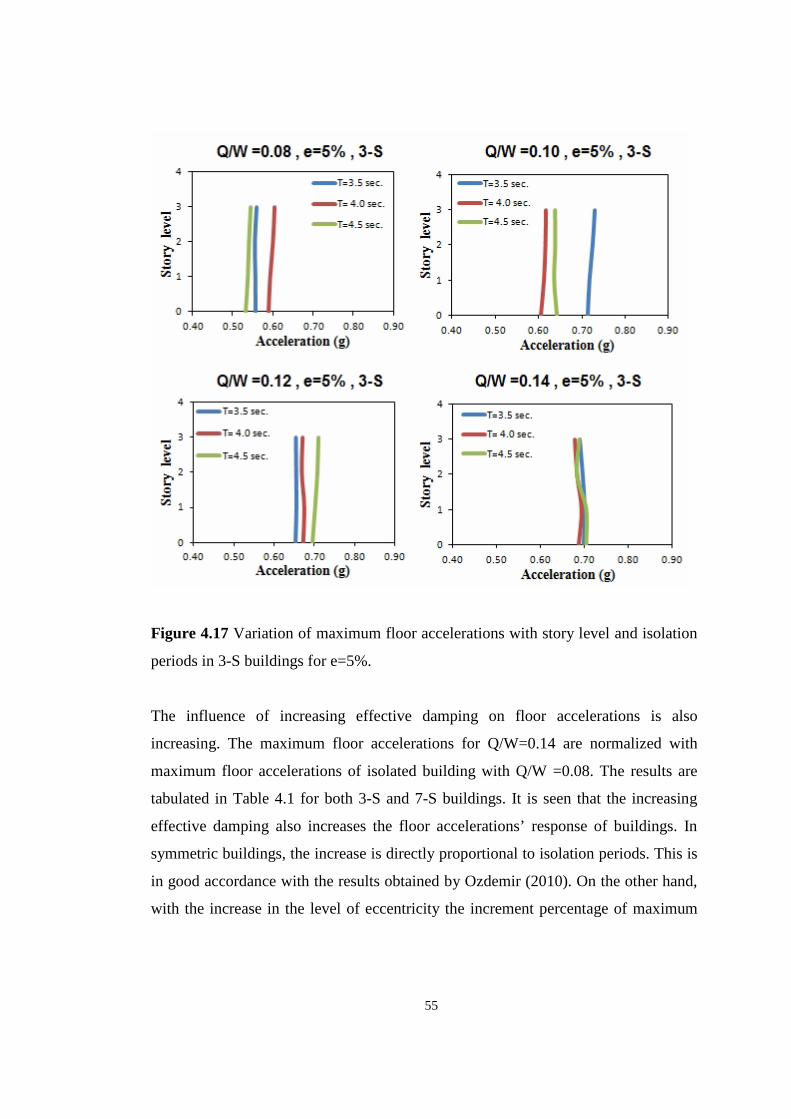
Figure 4.17 Variation of maximum floor accelerations with story level and isolation
periods in 3-S buildings for e=5%.
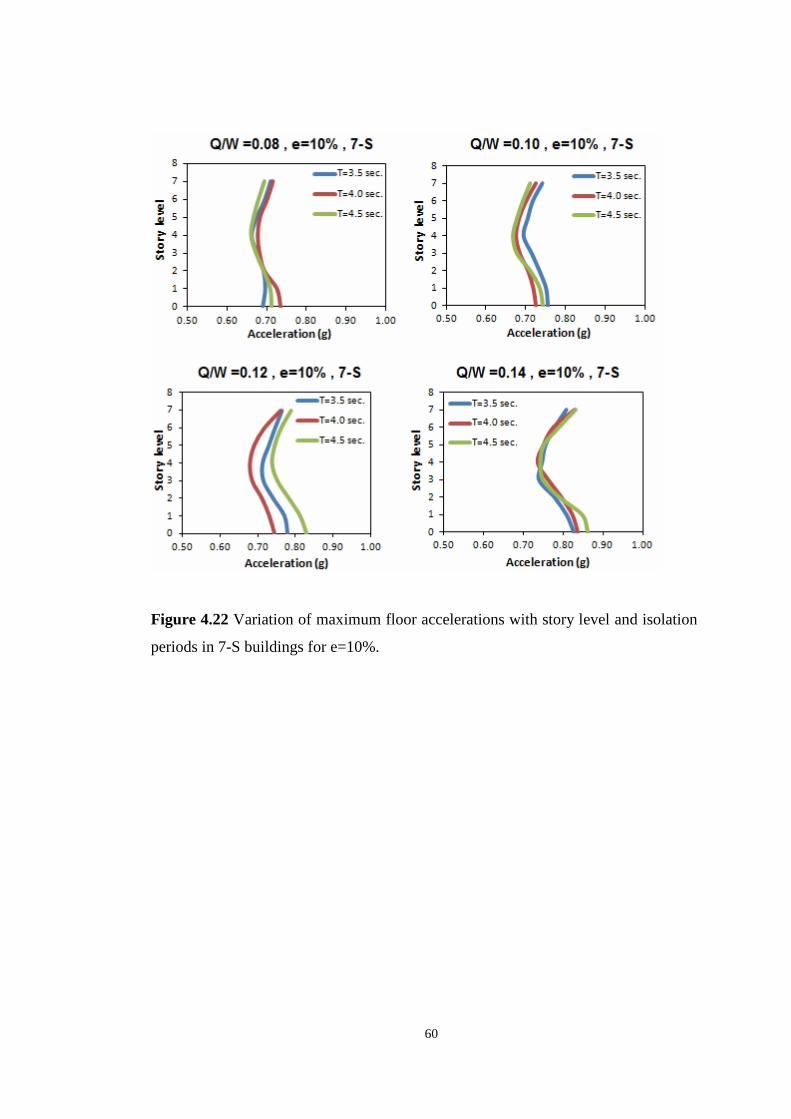
The influence of increasing effective damping on floor accelerations is also
increasing. The maximum floor accelerations for Q/W=0.14 are normalized with
maximum floor accelerations of isolated building with Q/W =0.08. The results are
tabulated in Table 4.1 for both 3-S and 7-S buildings. It is seen that the increasing
effective damping also increases the floor accelerations’ response of buildings. In
symmetric buildings, the increase is directly proportional to isolation periods. This is
in good accordance with the results obtained by Ozdemir (2010). On the other hand,
with the increase in the level of eccentricity the increment percentage of maximum
kkk
56
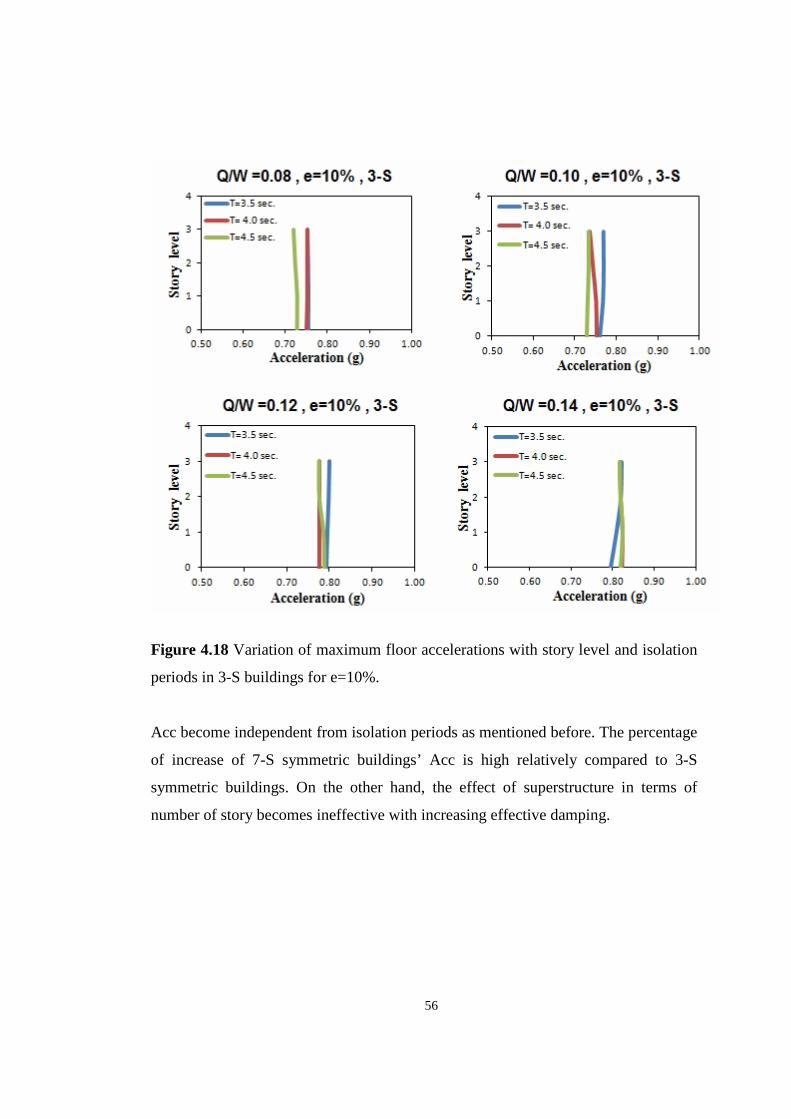
Figure 4.18 Variation of maximum floor accelerations with story level and isolation
periods in 3-S buildings for e=10%.
Acc become independent from isolation periods as mentioned before. The percentage
of increase of 7-S symmetric buildings’ Acc is high relatively compared to 3-S
symmetric buildings. On the other hand, the effect of superstructure in terms of
number of story becomes ineffective with increasing effective damping.
57
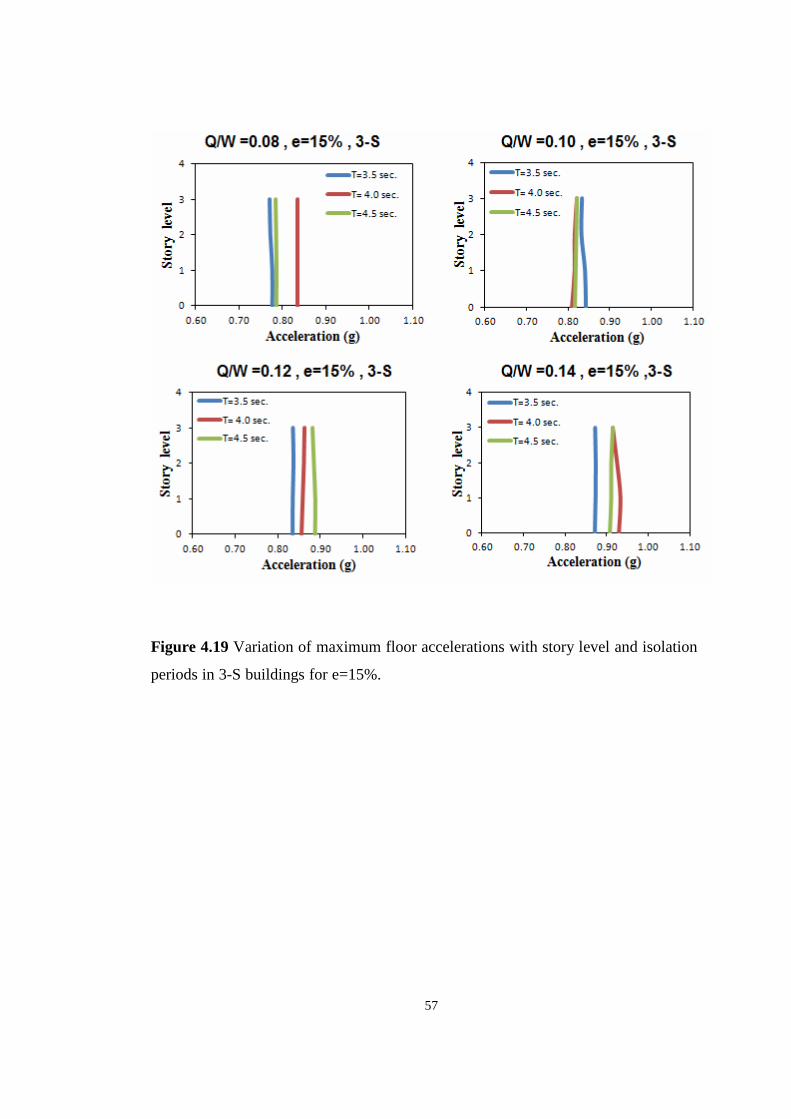
Figure 4.19 Variation of maximum floor accelerations with story level and isolation
periods in 3-S buildings for e=15%. cccccccccccccccccccccccccccccccccccccccccccc
58
Figure 4.20 Variation of maximum floor accelerations with story level and isolation
periods in 7-S buildings for e=0%.
59
Figure 4.21 Variation of maximum floor accelerations with story level and isolation
periods in 7-S buildings for e=5%.
60
Figure 4.22 Variation of maximum floor accelerations with story level and isolation
periods in 7-S buildings for e=10%.
61
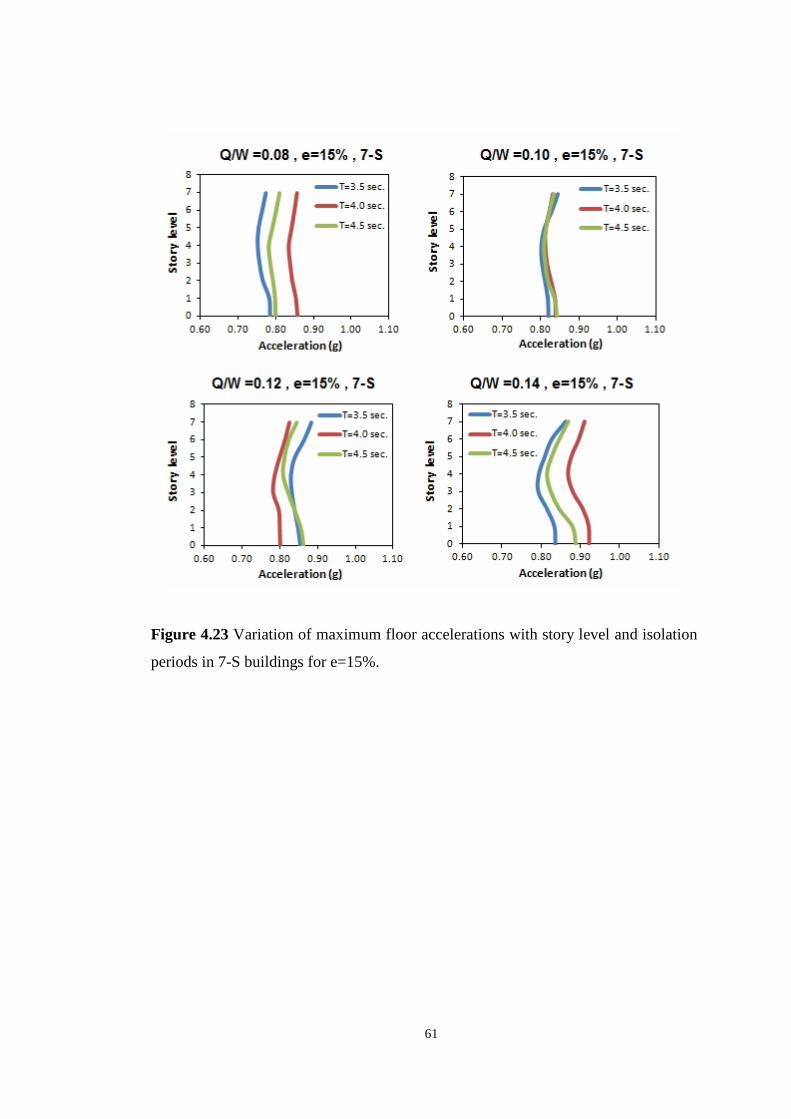
Figure 4.23 Variation of maximum floor accelerations with story level and isolation
periods in 7-S buildings for e=15%.
62
Table 4.1 Percentage of increase in floor accelerations between Q/W =0.08 and
Q/W=0.14 in 3-S and 7-S buildings.
63
CHAPTER 5
5. SUMMARY AND CONCLUSION
This study has been conducted to evaluate the effects of bi-directional earthquake
excitations of near fault records on the response of asymmetric base isolated
buildings. The variation of maximum base shear, torsional moments, isolator
displacements, floor accelerations and displacements are also compared based on the
level of eccentricities. Non-linear response history analyses (RHA) are carried out
for different range of effective damping of LRB and isolation period and for 11
different earthquake ground motions. The building systems are modeled in SAP2000
program. The isolation bearings are modeled as non-linear link element and
superstructure is modeled as elastic. Effect of asymmetry in superstructure is
examined considering different eccentricity at each floor level. Moreover, the
isolator displacements computed from nonlinear response history analysis (RHA) are
compared with the isolated displacements computed from simplified method.
Based on the numerical results, conclusions can be drawn as follows:
• The effect of level of eccentricity on normalized base shear is negligible for
both 3-S and 7-S buildings. The change in superstructure in terms of story
level is also an insignificant parameter for base shear response of isolated
mmm
64
buildings. Moreover, effective damping is also an insignificant parameter for
calculation of base shear. The normalized base shear values of buildings
corresponding to Q/W =0.14 represent the independency of base shear to
level of eccentricity. Although VRHA / W ratio decreases from 0.25W to 0.20
W for Q/W=0.14 for 3-S and 7-S buildings, the decrease is small and can be
neglected.
• The torsional amplification of moments is higher with increasing level of
eccentricity. Mtorsional(e=10%) values of asymmetric 3-S and 7-S RC buildings
are about 1.95 times higher than the values of Mtorsional(e=5%) . Moreover,
Mtorsional(e=15%) values of buildings are between 170% and 183% of
Mtorsional(e=5%) for different isolation periods. In addition to that, decreasing
isolation period also leads to increase in torsional moment.
• Isolator displacements are independent from superstructure in terms of story
height since nonlinear RHA results of isolator displacements for 3-S and 7-
S buildings are nearly same. On the other hand, increasing effective
damping results in decreasing isolator displacements. These decreases are
about 36%, 32%, 32% and 31% for symmetric and asymmetric 3-S and 7-S
RC buildings corresponding to e=5%, 10% and 15%, respectively. These
given ratios are independent from isolation periods.
• An increase in isolation period has increasing effects on isolator
displacements. When isolation periods increase from 3.5 sec to 4.5 sec,
DRHA values increase about 12%, 14%, 14% and 13% for symmetric and
asymmetric 3-S and 7-S RC buildings corresponding to e=5%, 10% and
15%, respectively.
65
• Simplified method of analysis (ELF) procedure is conservative in terms of
isolator displacements. Since simplified method also considers the bi-
directional and asymmetry effect, the overestimation of isolator
displacements are nearly same and about 10% for each 3-S and 7-S
symmetric and asymmetric RC buildings.
• (DRHA)ecc/DRHA ratios generally increase slightly when isolation periods
increase for 3-S buildings . They are in between 1.15-1.30, 1.35-1.55 and
1.55-1.70 depending on Q/W ratio for e=5%, 10% and15%, respectively.
The decreasing tendency of (DRHA)ecc/DRHA with increasing damping,
observed in 3-S buildings, diminish in 7-S buildings. In addition to that, the
isolation periods become ineffective on (DRHA)ecc/DRHA.
• Seismic isolation reduces the floor displacements with respect to base.
However, the relative floor displacements are relatively low. Effective
damping has decreasing effect on displacements. In contrast to that high
eccentricities result in higher displacements.
• Increasing isolation periods has reducing effect on floor accelerations
through the height of buildings in symmetric 3-S RC buildings. On the
other hand, the decreasing effect of increasing isolation periods is only valid
for 7-S RC symmetric buildings with Q/W ratio equals to 0.08 and 0.10.
• There are remarkable increases between floor accelerations of symmetric
and asymmetric buildings. However, the rate of increase in accelerations
decreases with increasing level of eccentricity for both 3-S and 7-S
buildings. The Acc(e=5%)/Acc(e=0%), Acc(e=10%)/Acc(e=15%) and
Acc(e=15%)/Acc(e=10%) are between 1.95 ~3.17, 1.05 ~1.36 and 1.02 ~1.14 for
3-S buildings and 1.22 ~2.62, 0.97 ~1.30 and 1.01 ~1.24, respectively.
66
• The influence of increasing effective damping on floor accelerations is also
increasing considering the response of both 3-S and 7-S buildings in terms
of normalized floor accelerations corresponds to Q/W=0.14 with floor
accelerations of isolation buildings with Q/W =0.08. In symmetric
buildings, the increase is directly proportional to isolation periods for both
3-S and 7-S buildings. On the other hand, with the increase in the level of
eccentricity the increment percentage of maximum Acc become
independent from isolation periods. The percentage of increase of Acc for
7-S symmetric building is relatively high compared to 3-S symmetric
buildings.
67
REFERENCES
• AASHTO, 1999, American Association of State Highway and Transportation
Officials. Guide Specification for Seismic Isolation Design, Washington, DC.
• Agranovich, G., and Ribakov Y., 2008, “Using Hybrid Isolation Systems with
Friction Dampers for Seismic Protection of Structures.” ENOC 2008, Saint
Petersburg, Russia.
• Akkar S. and Gulkan P., 2002, “A Critical Examination of Near-Fault
Accelerograms from the Sea of Marmara Region Earthquakes”, Bulletin of
the Seismological Society of America, 92(1), pp. 428-447.
• ASCE, 2005, American Society of Civil Engineers. Minimum Design Loads
for Buildings and Other Structures. Standard ASCE/SEI 7-05, Reston, VA.
• Bommer J.J. and Acevedo A.B., 2004, “The Use of Real Earthquake
Accelerograms as Input to Dynamic Analysis”, Journal of Earthquake
Engineering, Volume 8, Special Issue 1, pp. 43-92.
• Building Seismic Safety Council (BSSC), 2003, “NEHRP Recommended
Provisions for Seismic Regulations for New Buildings and Other Structures”,
2003 Edition, Report Nos. FEMA 450, Federal Emergency Management
Agency, Washington, DC.
68
• Chopra A.K., Chintanapakdee C., 2001, “Comparing Response of SDF
Systems to Near-fault and Far-fault Earthquake Motions in the Context of
Spectral Regions”, Earthquake Engineering and Structural Dynamics, 30, pp.
1769-1789.
• Computers and Structures, Inc., 2008. SAP 2000 Nonlinear, Version 10.0.0,
Structural Analysis Program, Berkeley, CA.
• Constantinou M.C., Whittaker A.S., Fenz D.M. and Apostolakis G., 2007,
“Seismic Isolation of Bridges”, Department of Civil, Structural and
Environmental Engineering, State University of New York at Buffalo.
• Constantinou M.C., Ozdemir G., 2010, “Evaluation of Equivalent Lateral
Force Procedure in Estimating Seismic Isolator Displacements”, Soil
Dynamics and Earthquake Engineering, 30 (10), p.p. 1036-1042.
• Dicleli M. and Buddaram S., 2006, “Effect of Isolator and Ground Motion
Characteristics on the Performance of Seismic-Isolated Bridges”, Earthquake
Engineering and Structural Dynamics, 35, pp. 233-250.
• EN 8, 2005, Eurocode 8: Design of Structures for Earthquake Resistance Part
2: Bridges. EN 1998-2.
• Etedali S., Sohrabi M.R., “Torsional Strengthening of Base-Isolated
Asymmetric Structures by Increasing the Flexible Edge Stiffness of Isolation
System” International Journal of Civil & Environmental Engineering, Vol: 11
No: 02, p.p. 51-59.
69
• Guyader A.C. and Iwan W.D., 2006, “Determining Equivalent Linear
Parameters for Use in a Capacity Spectrum Method of Analysis”, Journal of
Structural Engineering, ASCE,132(1), pp. 59–67.
• Hancock J., Bommer J.J. and Stafford P.J., 2008, “Numbers of Scaled and
Matched Accelerograms Required for Inelastic Dynamic Analyses”,
Earthquake Engineering and Structural Dynamics, 37, pp. 1585-1607.
• Huang Y.-N., Whittaker A.S. and Constantinou M.C., 2007, “Seismic
Demands on Secondary Systems in Base-Isolated Nuclear Power Plants”,
Earthquake Engineering and Structural Dynamics, 36, pp. 1741-1761.
• International Conference of Building Officials (1997), “Earthquake
Regulations for Seismic-Isolated Structures,” Uniform Building Code,
Appendix Chapter16, Whitter, CA.
• Islam A.B.M.S, Jameel M. and Jummat M.Z., 2011, “Study on optimal
isolation system and dynamic structural responses in multi-storey buildings”
International Journal of the Physical Sciences Vol. 6(9), pp. 2219-2228.
• Jangid R.S. and Datta T.K., 1995, “Performance of Base Isolation Systems
for Asymmetric Building Subject to Random Excitation”, Engineering
Structures, Volume: 17, p.p. 443-454
• Jangid R.S. and Datta T.K., 1995, “Seismic Behavior of Base-Isolated
Buildings: A Stateof-the-Art Review”, Structures and Buildings, 110, pp.
186-202.
• Kelly J.M., 1999, “The Role of Damping in Seismic Isolation”, Earthquake
Engineering and Structural Dynamics, 28, pp. 3-20.
70
• Khante S.N., Lavkesh R.W., “Study of seismic response of symmetric and
asymmetric base isolated building with mass asymmetry in plan”
International Journal of Civil and Structural Engineering, Volume 10, No 10,
p.p. 897-909.
• Kilar V., Koren D., “Seismic behaviour of asymmetric base isolated
structures with various distributions of isolators” Engineering Structures, 31,
p.p. 910-921.
• Makris N. and Chang S.P., 2000, “Effect of Viscous, Viscoplastic, and
Friction Damping on the Response of Seismic Isolated Structures”,
Earthquake Engineering and Structural Dynamics, 29, pp. 85-107.
• Malhotra P.K., 1999, “Response of Buildings to Near-fault Pulse-like Ground
Motions”, Earthquake Engineering and Structural Dynamics, 28, pp. 1309-
1326
• Matsagar V.A. and Jangid R.S., 2004, “Influence of Isolator Characteristics
on the Response of Base-Isolated Structures”, Engineering Structures, 26, pp.
1735-1749.
• Mayes R.L. and Naeim F., 2001. Design of structures with seismic isolation,
in The Seismic Design Handbook , 2nd edition, (F. Naeim, ed.), Kluwer
Academic Publishers.
• Metin A., 2006, “Inelastic Deformation Demands on Moment-Resisting
Frame Structures”, PhD Thesis, Department of Civil Engineering, Middle
East Technical University.
71
• Naeim F. and Kelly J.M., 1999, “Design of Seismic Isolated Structures”,
Wiley: New York.
• Naeim F. and Lew M., 1995, “On the use of Design Spectrum Compatible
Time Histories”, Earthquake Spectra, 11(1), pp. 111-127.
• Nagarajaiah S., Reinhorn A.M. and Constantinou M.C., 1993a, “Torsion in
Base Isolated Structures with Elastomeric Isolation Systems”, Journal of
Structural Engineering, ASCE,119 (10), pp. 2932-2951.
• Ozdemir G., 2010, “Response of Isolated Structures Under Bi-directional
Excitations of Near-fault ground Motions”,PhD Thesis, Department of Civil
Engineering, Middle East Technical University.
• Pavlou E.A. and Constantinou M.C., 2004, “Response of Elastic and Inelastic
Structures with Damping Systems to Near-Fault and Soft-Soil Ground
Motions”, Engineering Structures, 26(9), pp. 1217–1230.
• Ramirez O.M., Constantinou M.C., Whittaker A.S., Kircher C.A. and
Chrysostomou C.Z.,2002, “Evaluation of Simplified Methods of Analysis of
Yielding Structures with Damping Systems”, Earthquake Spectra, 18(3), pp.
531–547.
• Ryan K.L. and Chopra A.K., 2004, “Estimation of Seismic Demands on
Isolators Based on Nonlinear Analysis”, Journal of Structural Engineering,
ASCE, 130(3), pp. 392-402.
• Shome N., Cornell C.A., Bazzurro P. and Carballo J.E., 1998, “Earthquakes,
Records and Nonlinear Responses”, Earthquake Spectra, 14(3), pp. 469-500.
72
• Somerville P.G., Smith N.F., Graves R.W. and Abrahamson N.A., 1997,
“Modification of Empirical Strong Ground Motion Attenuation Relations to
Include the Amplitude and Duration Effects of Rupture Directivity”,
Seismological Research Letters, 68(1), pp. 199-222.
• Stewart J.P., Chiou S.-J., Bray J.D., Graves R.W., Somerville P.G. and
Abrahamson N.A., 2001, “Ground Motion Evaluation Procedures for
Performance-Based Design”, PEER Report 2001/09, Pacific Earthquake
Engineering Research Center, University of California.
• Tena-Colunga A. and Zambrana-Rojas C., 2006, “Dynamic Torsional
Amplifications of Base-isolated Structures with an Eccentric Isolation
System”, Engineering Structures, 28, pp. 72-83.
• Tena-Colunga A. and Escamilla-Cruz J.L., 2007, “Torsional Amplifications
in Asymmetric Base Isolated Structures”, Engineering Structures, 29, pp.
237-247.
• Tobriner S., 2006, “Bracing for Disaster: Earthquake-Resistant Architecture
and Engineering in San Francisco, 1838-1933”, Berkeley, Calif. : Bancroft
Library, University of California : Heyday Books.
• Turkish Earthquake Code, 2007, “Specifications for the Buildings to be
Constructed in Disaster Areas”, Ministry of Public Works and Settlement,
Ankara, Turkey.
• Warn G.P. and Whittaker A.S., 2004, “Performance Estimates in Seismically
Isolated Bridge Structures”, Engineering Structures, 26, pp 1261-1278.