Embed Size (px)
Citation preview
JOURNAL OF THE OPTICAL SOCIETY OF AMERICA
Response Functions for Sine- and Square-Wave Modulations of Disparity
WHITMAN RICHARDS*
Department of Psychology, Massachusetts Institute of Technology, Cambridge, Massachusetts 02139(Received 21 August 1971)
Depth sensations cannot be elicited by modulations of disparity that are more rapid than about 6 Hz,regardless of the modulation amplitude. Vergence tracking also fails at similar modulation rates, suggestingthat this portion of the oculomotor system is limited by the behavior of disparity detectors. For sinusoidalmodulations of disparity between 2 to 2 deg of disparity, most depth-response functions exhibit a low-frequency decrease that is not observed with square-wave modulations of disparity.INDEX HEADING: Vision.
During the past fifteen years, there has been an in-creasing interest in describing the behavior of the visualsystem in terms of its response to sinusoidally modu-lated stimuli.',2 One advantage of such a description isthat, if the system is linear, predictions can be madeabout the system's response to a wide class of stimuli.During this fifteen-year period, many people have re-ported spatial and temporal contrast-sensitivity func-tions for the eye, both at threshold2 and suprathreshold. 3
The spatial studies are mostly along one dimension,although there are a few two-dimensional studies in thex, y, or frontal plane.4 This report describes the firstmeasurements of sensitivity to modulations in the zdirection, normal to the frontal plane. The appropriatesystem response is the sensation of depth elicited by thebinocular parallax or disparity of the moving objectrelative to the fixation point. Presumably, the resultingresponse functions should describe the steady-statebehavior of the detectors of binocular disparity.
METHOD
In order to generate a stimulus modulated in depth inthe z direction, two polarized images of a 4X2-deg barwere rear projected onto a translucent screen having aluminance of 15 cd/m2 and located 200 cm from thesubject. The luminance of the images on the screen was60 cd/mi2 . Each image was seen through polarizers byseparate eyes, and both images always occupied sym-metric positions about the fixation point. This sym-metrical arrangement was produced optically from asingle image of the bar: Light passing through a fieldstop forming the image of the bar was first reflected by amirror positioned at 45 deg to the screen. This reflectedimage of the bar entered a beam splitter oriented 90 degto the mirror. The beam splitter reflected one image ofthe bar onto the projection screen and directed a secondimage into an inverting prism. The prism rotated thebar 180 deg and a second front-surface mirror reflectedthis rotated image onto the screen, producing the secondimage of the bar. Appropriately oriented polarizers wereplaced in the paths of the two images of the bars, whichwere aligned precisely with the fixation point. Sym-metrical displacements of the two bars were then pro-duced by rotating the first mirror about an axis parallel
to the surface of the mirror and at the focal point of theimage of the bar, which also coincided with the plane ofthe mirror. To the subject who viewed this displaythrough polarizers, the net result was a bar moving backand forth in depth through the plane of fixation. Be-cause the rotating mirror was mounted upon the shaftof a D'Arsonval galvanometer, the rates and extents ofexcursions of the bar moving in depth could be con-trolled by a Hewlett-Packard function generator. Thefunction generator also had a second signal that could bephase shifted from the first; this was used to deliverclicks to the subject (WR), who adjusted the phaserelation so that the clicks seemed to be coincident withthe passage of the bar through the fixation plane. Thistask, though quite difficult, provided some crudeestimates of the phase angle of the disparity response asthe modulation rate was increased.
The oscillations of the bar in depth caused a rapidloss of the initial depth sensation, whenever fixation wasrigidly maintained in the screen. To guard against toorapid an adaptation effect, two fixation crosses wereused, one 3 deg above the top of the 2-deg bar and an-other 3 deg below the bottom of the bar. Fixationalternated between these two positions approximatelyevery 3 s. By not having a single fixation point in themiddle of the moving bar, fixation was also easier tomaintain. To provide further assistance in holding eyeposition, two sets of thin nonius lines appeared con-tinuously on each side of the fixation points.
A probe, seen with free eye movements, was used inorder to estimate the apparent depth of the bar as itappeared to move in and out through the fixation plane.The probe was a black 1-cm-diam disk located 4 deg tothe right of the fixation points and was carried by aglider on a rail. The glider could be moved manually bythe subject, who was instructed to set the probe at themost-forward position reached by the bar, when thelatter was seen while properly fixating. This "depth-matching" procedure is described fully elsewhere' andis a simple and effective method of estimating themaximum apparent depth of the bar. Only the apparentforward extent of the bar's movement in depth wasestimated, thus limiting the measurements to responsesto crossed disparities relative to the fixation point. Foreach data point, three or five probe settings were made
907
VOLUME 62, NUMBER 7 JULY 1972
WHITMAN RICHARDS
1.0
0.6
0.4
4'-', DM'"-t ±±IUUlaLu111 guaa. ± sA jJUILIUf UI LIIOgraph shows the apparent phase angle for sinusoidal modulation.
on different occasions, with the median chosen as therepresentative estimate of the apparent depth. Onlythree settings were deemed necessary for the smallmodulations of disparity, which were generally repro-ducible to within 10%.
RESULTS
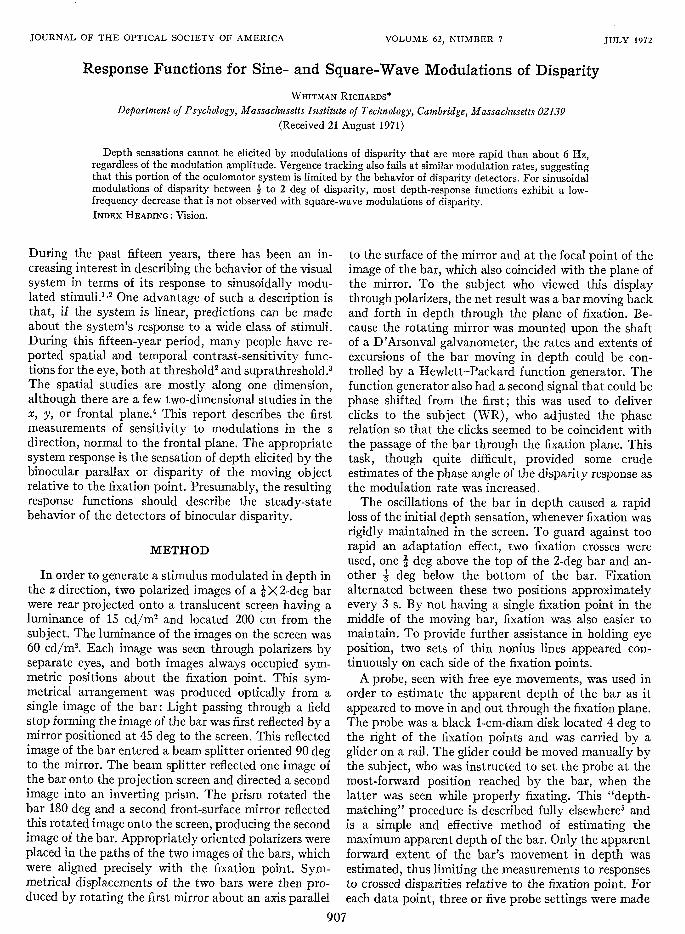
The system's response was measured both to a rangeof modulation amplitudes and rates. The modulationamplitude was set at a value between 4is to ±=4 deg ofdisparity, and then the rate of modulation was varied.Both square- and sine-wave modulations were used. Thetwo curves in Fig. I show typical sine- and square-waveresponse functions for ± 1.0-deg modulation, indicatingthe maximum apparent excursion of the bar toward theobserver as a function of its rate of oscillation back andforth in depth through the fixation plane. As expected,when the modulation rate becomes high, the sensationof depth is rapidly lost, essentially disappearing at about6 Hz. This decrease of depth sensation occurs at about-A the frequency for flicker detection, and suggests thatthe detectors for binocular disparity are quite sluggish.Of further interest is that vergence tracking decreases in
1.0
0.6
0.4
>a
o 0.2
.-
o 0.1
e 0.06
l 0.04
I-
X 0.02o
K
I-
lF
I-
0.011F
0.006
0.004I I - I I I I I
1/8 1/4 1/2 I 2 4 8
MODULATION RATE, Hz.
FIG. 2. Depth-response curves for a range of amplitudes ofdisparity modulation. Filled circles, i deg; crosses, 4 or 4 deg (bothamplitudes are essentially identical for this observer); plusses,I deg; open circles, I deg. These curves are typical of the majorityof subjects.
C.
0
3o
I
Lito
a.I
0.2
0.1
0.06
0.04
0.02
0.01
0.006
0.004
0
20
40
60
80
100
FIG. 1. Apforth througheld constarrzir,.lc 11:
908 Vol. 62
a similar manner, 6 implying that the constraint uponvergence movements is disparity detection and not
'0-O limitations in the potential power of the oculomotor-O commands. Eye-movement records obtained from two
.0 0 N subjects support this suggestion: The decrease of
- \vergence tracking matches the same observer's depth-\ \response functions; vergence movements cease at a
o \frequency at which lateral pursuit movements may stillbe elicited.7
A second feature of the response functions shown inFig. 1 is that, at low frequencies, the depth elicited bysinusoidal modulation falls off in a manner commonlyobserved for spatial- and temporal-sensitivity functions.When square-wave modulations of disparity are used,the low-frequency decrease is not observed, as would beexpected because even low-frequency square waves
o - contain high-frequency components.In the lower portion of Fig. 1 the approximate phase
1/8 1/4 1/2 I 2 4 B angle of the apparent modulation is shown. Because the-- phase curve is estimated by comparing auditory and
visual inputs, the curve is in error by the time differencefor detection in the two systems. For frequencies greaterthan 1 Hz, the phase curve suggests an auditory-visualdelay of about 50 Ins, whereas the delay would be 25 Insor less for modulation rates less than 2 Hz. Even if this
1/8 1/4 1/2 1 2 4 8 latter value is taken as the fixed real delay between the
MODULATION RATE, Hz. two systems,8 disparity detection cannot be consideredas a minimum linear system, for the phase angle at half-
,parent depth generated by a bar oscillating back and'h the fixation plane, with the maximum amplitude amplitude would be far too small for the observed high-Lt at -t1.0 deg of disparity. Sine-wave modulation, frequency decrease. Instead, it appears that the
RESPONSES TO MODULATIONS OF DISPARITY
disparity-detection system has some capability fopredicting periodic inputs.
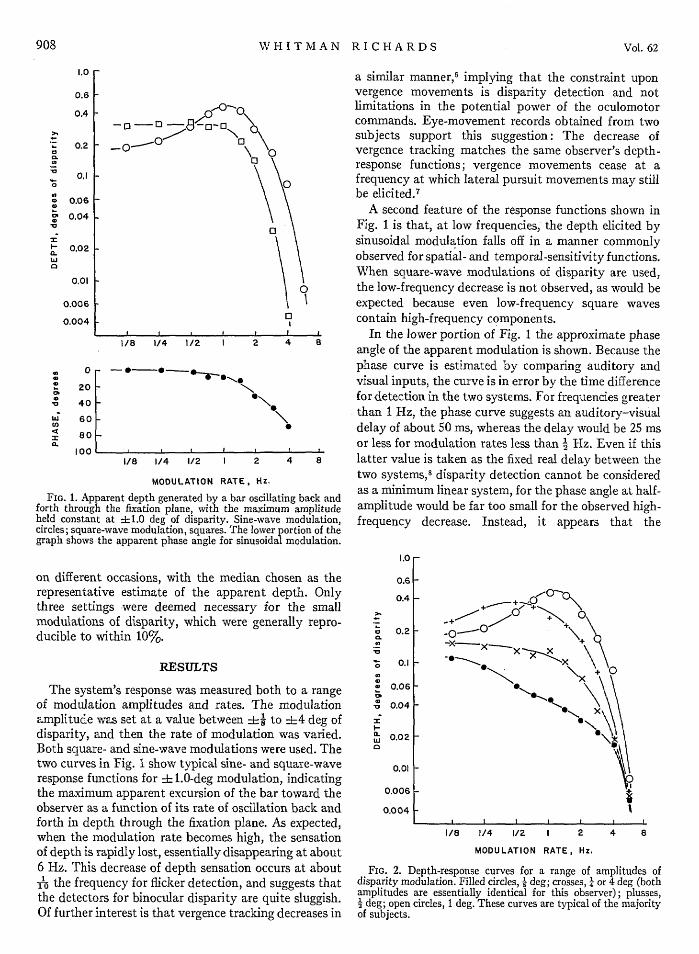
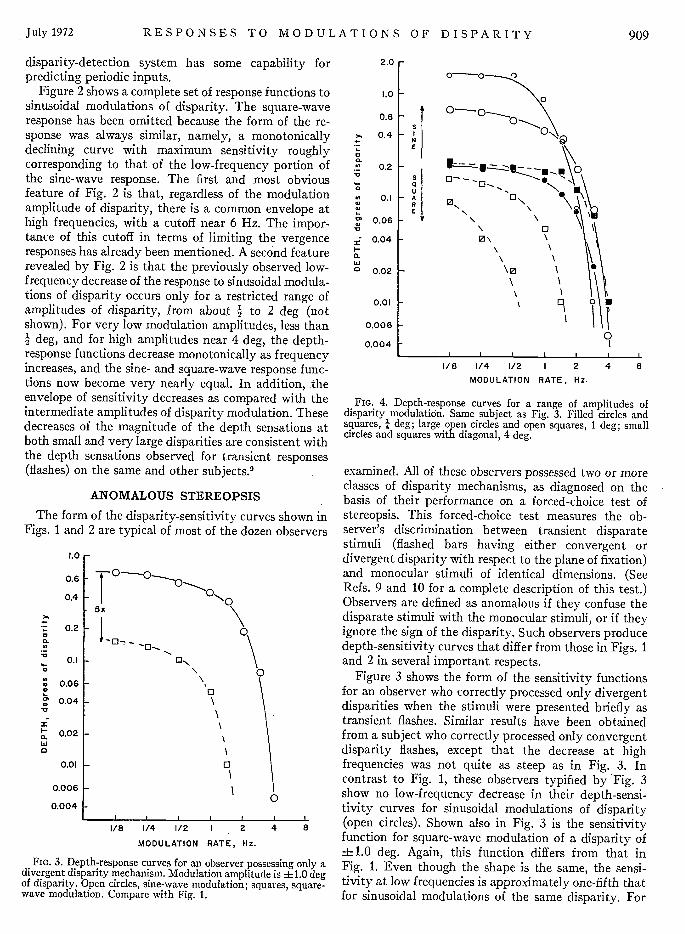
Figure 2 shows a complete set of response functions tcsinusoidal modulations of disparity. The square-wavresponse has been omitted because the form of the response was always similar, namely, a monotonicallydeclining curve with maximum sensitivity roughlycorresponding to that of the low-frequency portion oithe sine-wave response. The first and most obviousfeature of Fig. 2 is that, regardless of the modulationamplitude of disparity, there is a common envelope alhigh frequencies, with a cutoff near 6 Hz. The impor-tance of this cutoff in terms of limiting the vergencEresponses has already been mentioned. A second featurerevealed by Fig. 2 is that the previously observed low-frequency decrease of the response to sinusoidal modula-tions of disparity occurs only for a restricted range oJamplitudes of disparity, from about 2 to 2 deg (norshown). For very low modulation amplitudes, less than4 deg, and for high amplitudes near 4 deg, the depth-response functions decrease monotonically as frequencyincreases, and the sine- and square-wave response func-tions now become very nearly equal. In addition, theenvelope of sensitivity decreases as compared with theintermediate amplitudes of disparity modulation. Thesedecreases of the magnitude of the depth sensations atboth small and very large disparities are consistent withthe depth sensations observed for transient responses(flashes) on the same and other subjects. 9
ANOMALOUS STEREOPSIS
The form of the disparity-sensitivity curves shown inFigs. 1 and 2 are typical of most of the dozen observers
1.0
0.6
0.4
Q-
a.0I?
0.2
0.!
0.06
0.04
I -- - -s-
0
0.02 I-
0.01 -
0.006
0.004
0
0
I I I I
1/8 1/4 1/2 1 2
MODULATION RATE, Hz.
4 8
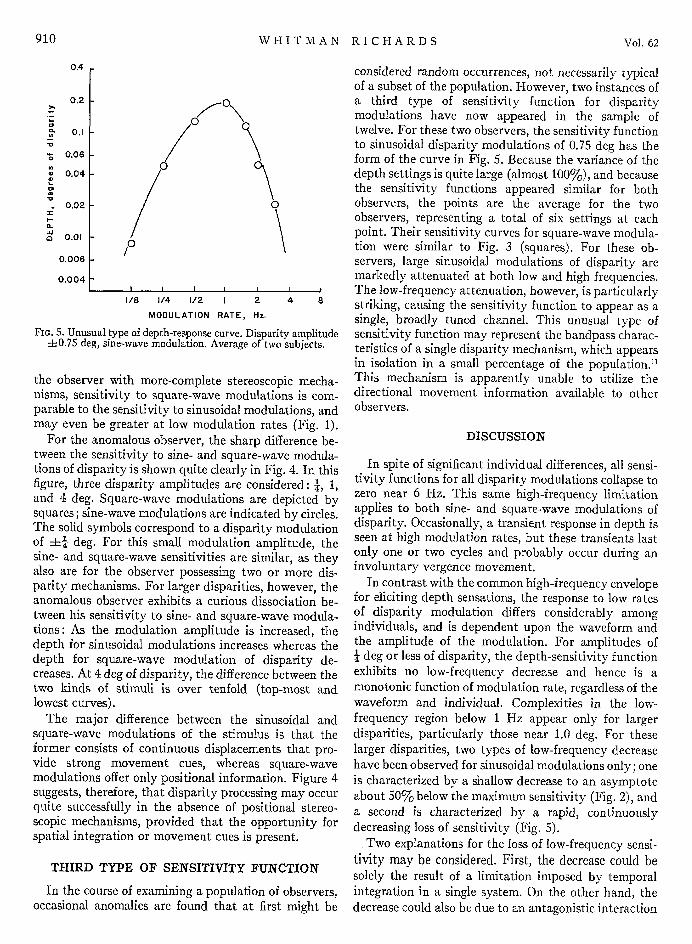
FIG. 3. Depth-response curves for an observer possessing only adivergent disparity mechanism. Modulation amplitude is 4 1.0 degof disparity. Open circles, sine-wave modulation; squares, square-wave modulation. Compare with Fig. 1.
2.0 rr
I
r
r
I
I
I
I
L
0.
0.
'0
I-
a.
wCod
D
0.2 F
0.1
0.06
0.04
SI
N I
S
UA
E
0
0.02 H
0.01
0.006
0.004
\0I
X I01
1
-1/8 1/4 1/2 1 2
MODULATION RATE, Hz.
4 8
FIG. 4. Depth-response curves for a range of amplitudes ofdisparity modulation. Same subject as Fig. 3. Filled circles andsquares, 4 deg; large open circles and open squares, 1 deg; smallcircles and squares with diagonal, 4 deg.
examined. All of these observers possessed two or moreclasses of disparity mechanisms, as diagnosed on thebasis of their performance on a forced-choice test ofstereopsis. This forced-choice test measures the ob-server's discrimination between transient disparatestimuli (flashed bars having either convergent ordivergent disparity with respect to the plane of fixation)and monocular stimuli of identical dimensions. (SeeRefs. 9 and 10 for a complete description of this test.)Observers are defined as anomalous if they confuse thedisparate stimuli with the monocular stimuli, or if theyignore the sign of the disparity. Such observers producedepth-sensitivity curves that differ from those in Figs. 1and 2 in several important respects.
Figure 3 shows the form of the sensitivity functionsfor an observer who correctly processed only divergentdisparities when the stimuli were presented briefly astransient flashes. Similar results have been obtainedfrom a subject who correctly processed only convergentdisparity flashes, except that the decrease at highfrequencies was not quite as steep as in Fig. 3. Incontrast to Fig. 1, these observers typified by 'Fig. 3show no low-frequency decrease in their depth-sensi-tivity curves for sinusoidal modulations of disparity(open circles). Shown also in Fig. 3 is the sensitivityfunction for square-wave modulation of a disparity of4 1.0 deg. Again, this function differs from that inFig. 1. Even though the shape is the same, the sensi-tivity at low frequencies is approximately one-fifth thatfor sinusoidal modulations of the same disparity. For
. . . . . . . .
July 1972 909
1.0
0.6
0.4
I I
WHITMAN RICHARDS
0.4
tLt -Jutuai IIIUU faLUII allU
may even be greater at low modulation rates (Fig. 1).For the anomalous observer, the sharp difference be-
tween the sensitivity to sine- and square-wave modula-tions of disparity is shown quite clearly in Fig. 4. In thisfigure, three disparity amplitudes are considered: 4, 1,and 4 deg. Square-wave modulations are depicted bysquares; sine-wave modulations are indicated by circles.The solid symbols correspond to a disparity modulationof ±4 deg. For this small modulation amplitude, thesine- and square-wave sensitivities are similar, as theyalso are for the observer possessing two or more dis-parity mechanisms. For larger disparities, however, theanomalous observer exhibits a curious dissociation be-tween his sensitivity to sine- and square-wave modula-tions: As the modulation amplitude is increased, thedepth for sinusoidal modulations increases whereas thedepth for square-wave modulation of disparity de-creases. At 4 deg of disparity, the difference between thetwo kinds of stimuli is over tenfold (top-most andlowest curves).
The major difference between the sinusoidal andsquare-wave modulations of the stimulus is that theformer consists of continuous displacements that pro-vide strong movement cues, whereas square-wavemodulations offer only positional information. Figure 4suggests, therefore, that disparity processing may occurquite successfully in the absence of positional stereo-scopic mechanisms, provided that the opportunity forspatial integration or movement cues is present.
THIRD TYPE OF SENSITIVITY FUNCTION
In the course of examining a population of observers,occasional anomalies are found that at first might be
DISCUSSION
In spite of significant individual differences, all sensi-tivity functions for all disparity modulations collapse tozero near 6 Hz. This same high-frequency limitationapplies to both sine- and square-wave modulations ofdisparity. Occasionally, a transient response in depth isseen at high modulation rates, but these transients lastonly one or two cycles and probably occur during aninvoluntary vergence movement.
In contrast with the common high-frequency envelopefor eliciting depth sensations, the response to low ratesof disparity modulation differs considerably amongindividuals, and is dependent upon the waveform andthe amplitude of the modulation. For amplitudes of#r deg or less of disparity, the depth-sensitivity functionexhibits no low-frequency decrease and hence is amonotonic function of modulation rate, regardless of thewaveform and individual. Complexities in the low-frequency region below 1 Hz appear only for largerdisparities, particularly those near 1.0 deg. For theselarger disparities, two types of low-frequency decreasehave been observed for sinusoidal modulations only; oneis characterized by a shallow decrease to an asymptoteabout 50% below the maximum sensitivity (Fig. 2), anda second is characterized by a rapid, continuouslydecreasing loss of sensitivity (Fig. 5).
Two explanations for the loss of low-frequency sensi-tivity may be considered. First, the decrease could besolely the result of a limitation imposed by temporalintegration in a single system. On the other hand, thedecrease could also be due to an antagonistic interaction
0.2 I
a.
awC,
considered random occurrences, not necessarily typicalof a subset of the population. However, two instances of
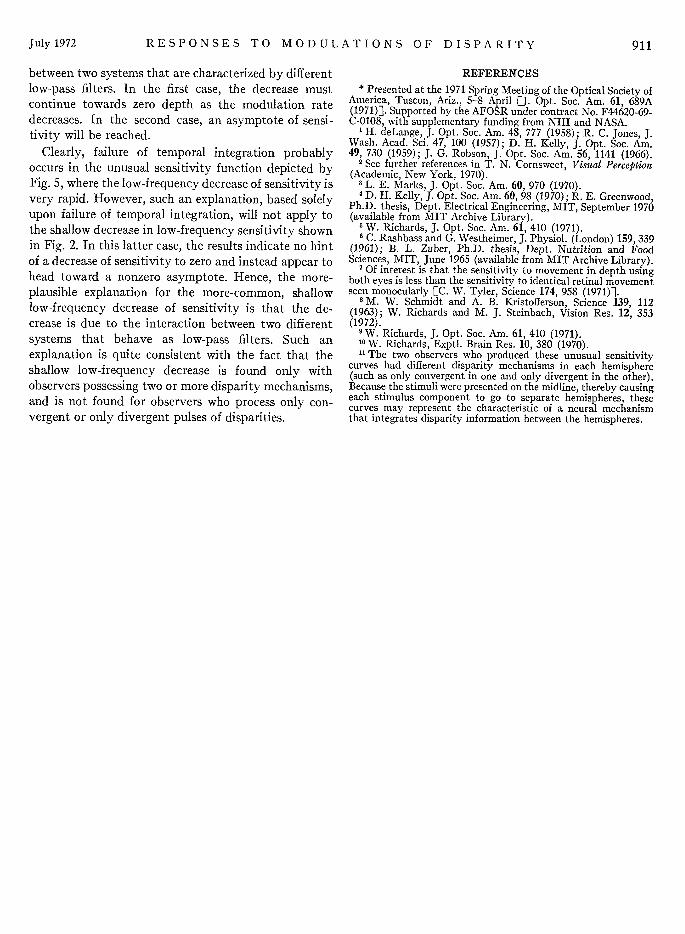
-0 a third type of sensitivity function for disparitymodulations have now appeared in the sample oftwelve. For these two observers, the sensitivity functionto sinusoidal disparity modulations of 0.75 deg has theform of the curve in Fig. 5. Because the variance of thedepth settings is quite large (almost 100%), and becausethe sensitivity functions appeared similar for both
o observers, the points are the average for the twoobservers, representing a total of six settings at eachpoint. Their sensitivity curves for square-wave modula-
/0 \tion were similar to Fig. 3 (squares). For these ob-servers, large sinusoidal modulations of disparity aremarkedly attenuated at both low and high frequencies.The low-frequency attenuation, however, is particularly
1/8 1/4 1/2 i 2 4 8 striking, causing the sensitivity function to appear as aMODULATION RATE, Hz. single, broadly tuned channel. This unusual type of
*ual type of depth-response curve. Disparity amplitude sensitivity function may represent the bandpass charac-^g, sine-wave modulation. Average of two subjects. teristics of a single disparity mechanism, which appears
in isolation in a small percentage of the population."rer with more-complete stereoscopic mecha- This mechanism is apparently unable to utilize thesitivity to square-wave modulations is com- directional movement information available to otherthfnk. cpnci-ri- -+l -I fa observers.
0.1
0.06
0.04
0.02
0.01
0.006 I
0.004
FIG. 5. Unus40.75 de
the obserinisms, sennnrnhlel tfn
910 Vol. 62
RESPONSES TO MODULATIONS OF DISPARITY
between two systems that are characterized by differentlow-pass filters. In the first case, the decrease mustcontinue towards zero depth as the modulation ratedecreases. In the second case, an asymptote of sensi-tivity will be reached.
Clearly, failure of temporal integration probablyoccurs in the unusual sensitivity function depicted byFig. 5, where the low-frequency decrease of sensitivity isvery rapid. However, such an explanation, based solelyupon failure of temporal integration, will not apply tothe shallow decrease in low-frequency sensitivity shownin Fig. 2. In this latter case, the results indicate no hintof a decrease of sensitivity to zero and instead appear tohead toward a nonzero asymptote. Hence, the more-plausible explanation for the more-common, shallowlow-frequency decrease of sensitivity is that the de-crease is due to the interaction between two differentsystems that behave as low-pass filters. Such anexplanation is quite consistent with the fact that theshallow low-frequency decrease is found only withobservers possessing two or more disparity mechanisms,and is not found for observers who process only con-vergent or only divergent pulses of disparities.
REFERENCES
* Presented at the 1971 Spring Meeting of the Optical Society ofAmerica, Tuscon, Ariz., 5-8 April [J. Opt. Soc. Am. 61, 689A(1971)]. Supported by the AFOSR under contract No. F44620-69-C-0108, with supplementary funding from NIH and NASA.
1 H. deLange, J. Opt. Soc. Am. 48, 777 (1958); R. C. Jones, J.Wash. Acad. Sci. 47, 100 (1957); D. H. Kelly, J. Opt. Soc. Am.49, 730 (1959); J. G. Robson, J. Opt. Soc. Am. 56, 1141 (1966).
2 See further references in T. N. Cornsweet, Visual Perception(Academic, New York, 1970).
3 L. E. Marks, J. Opt. Soc. Am. 60, 970 (1970).4 D. H. Kelly, J. Opt. Soc. Am. 60, 98 (1970); R. E. Greenwood,
Ph.D. thesis, Dept. Electrical Engineering, MIT, September 1970(available from MIT Archive Library).
W. Richards, J. Opt. Soc. Am. 61, 410 (1971).6 C. Rashbass and G. Westheimer, J. Physiol. (London) 159, 339
(1961); B. L. Zuber, Ph.D. thesis, Dept. Nutrition and FoodSciences, MIT, June 1965 (available from MIT Archive Library).
I Of interest is that the sensitivity to movement in depth usingboth eyes is less than the sensitivity to identical retinal movementseen monocularly [C. W. Tyler, Science 174, 958 (1971)].
8 M. W. Schmidt and A. B. Kristofferson, Science 139, 112(1963); W. Richards and M. J. Steinbach, Vision Res. 12, 353(1972).
9 W. Richards, J. Opt. Soc. Am. 61, 410 (1971).10 W. Richards, Exptl. Brain Res. 10, 380 (1970).11 The two observers who produced these unusual sensitivity
curves had different disparity mechanisms in each hemisphere(such as only convergent in one and only divergent in the other).Because the stimuli were presented on the midline, thereby causingeach stimulus component to go to separate hemispheres, thesecurves may represent the characteristic of a neural mechanismthat integrates disparity information between the hemispheres.
July 1972 911