Embed Size (px)
Citation preview

l'IaIionalAgriCu1tUraJoS~"~··S&V;.ceu
~·aild~~DiViSiOn
@~~h·ReportNUmber SRB~1-01-- - -- - -
RESPONSEAGRldIDT~"ACREAGEo~·1989

Keywords: Reihterview, subsample, reconciliation, bias and ~recision.
- ---*************************- ••• ****************.*~~***** This paper was··prepared for limited distrtPQ:~f(m-*• uta the research communityoutside the· U.Jl~-'Q·~4~,**.*** .**. ****** ******. *. *.* ••• *********** .•*trtff, •• ,,**,l
ACIQf01fLBDoBDIft'SSpecHs)., thanks to the state statistical Offices, he~qutlrte-rss.taff,enumerators and supervisQry enumerators who participated in theseprojects.
i

TABLE OF CONTENTSSUMMAR Y 0 iii
INTRODUCTION 1
SURVEY PROCEDURES 0 • 1
STATISTICAL MEASURES 0 •••••• 2
TH E SAMPLE 2
RESULTS
Response Bias 0 •••• 3Precision 0 .6Proportion of Farm Population Studied 0 ••• 00 •• 7Bias Characteristics 0 ••• 0 ••• 8Bias by Size of Farm 10
DISCUSSION 0 •• 12
RECOMMENDATIONS 0 ••• 0 •• 14
REFERENCES 0 •• 15
APPENDIX A: Reinterview Questionnaire - Crops sections 0 •••• 16
APPENDIX B: Stratified Multivariate and Univariate Tests 21
APPENDIX C: Variance Computation of the Percent Bias 00 •• 23
APPENDIX D: Reinterview Survey Bias Reasons Summaries 24
APPENDIX E: Frequency of Unexpanded Acreage Bias 0 ••••••• 34
APPENDIX F: Harvested Acres and Production Biases 44
ii

SUMMARYReinterview surveys were conducted in Indiana, Iowa, Minnesota,Nebraska, Ohio and Pennsylvania following the 1988 and 1989 DecemberAgricultural Surveys (DAS). The purpose of the surveys was to providea measure of quality in the Agricultural Surveys (AS) by estimatingresponse bias. A subsample of Computer Assisted Telephone Interview(CATI) respondents was selected for personal (face to face)reinterviews. The reinterview survey samples covered 18% of the CATIsample in 1988 and 16% in 1989. It covered 7% of the overall DAS samplefor both years. The six states in the study account for 15% of thetotal land in farms at the national level [6,7]. The CATI strata directexpansions (DE) for total land across all six states covered nearly 60percent of the six state operational survey DE for both years.
Questionnaire content and enumeration procedures for the reinterviewsurveys were virtually the same as for the DAS. Reinterviews were to becompleted within ten days of the CATI interview. Enumerators askedspecific questions about total land, cropland, individual crop acreagesplanted, grains in storage and hog inventories. The reinterview datawere then compared to the original data and any differences werereconciled to determine a "true" value. The reconciled value was usedas the proxy for the truth. Bias estimates were calculated as theaverage difference between the original answer and the reconciled value.Reasons for differences, provided by the respondent, were then recordedby the enumerator. This report contains the analysis of the acreagedata.
univariate and multivariate tests were utilized to determine if theacreage biases were significantly different from zero. Univariate testsfor most items indicated that bias was evident, but it was less than 5%for every item. A significant bias of +2.4% of the DAS (p value=.03)was found in the 1989 six State total cropland indication. This bias ischiefly attributed to the significant bias found in the Indiana croplandestimate. Significant bias was also found in Pennsylvania's 1989 cornplanted acreage. The biases of the combined state acreage indicationswere negative for 1988 but were positive for 1989, except for winterwheat seeded which was negative for both years. Mul tivariate testresul ts for 1988 data revealed a statistically significant bias (pvalue=.02). This was not unexpected since the bias estimates for allfive variables used in the test were negative and there is strongdependence among the variables.
The precision of the bias estimates was low, with all of the standarderrors large compared to the estimated biases. This was due primarilyto a small portion of the sample contributing heavily to the biasestimate for each acreage item. In 1989 for example, the averageabsolute value of the total land bias was 43 acres for all observations.By contrast, the average absolute bias of those reporting a differencewas 144 acres. There were 283 observations with total land biases out ofthe total response of 942. Several large positive biases counter-balanced by several large negative biases, increased the standard error.The low precision of the bias estimates limits their direct use asadjustments to survey indications. However, certain characteristics ofthe reported biases (frequency, type and size) are informative. The
iii

"reason for difference" summaries can be used to improve weaknesses Insurvey procedures, training and design.Reported "reasons for di fference" were divided into three classes,"def initional" , "estimating" , and "other". "Def initional" reasonscontributed most to the absolute value of the total bias. "Estimating"reasons described nearly 50 percent of the total number of differencesin both years. The single most frequent reason for bias was that therespondent estimated an acreage. The average bias from this errorsource, however, was relatively small. The largest biases occurred whenthe respondent included acres from another operation or did not reportcorrectly for the sampled name. This points to a weakness in thescreening portion of the interview.
Bias estimates by size of operation (final reconciled total land) werecomputed. The average absolute bias increased as farm size increased.The relative bias, i.e., the size of the bias in relation to the amountof crop acreage planted, was larger for the smaller farms.
It is recommended that the reinterview project continue, in order tomeasure bias level chanqes over time. Larger sample Slzes or animproved sample design should be utilized to improve the precision ofthe bias estimates, currently the principal weakness in the reinterviewprogram. continued analysis of the bias and reasons for bias can leadto improvements in training, enumeration procedures and questionnairedesign.
iv

INTRODUCTIONThe National Agricultural statistics service (NASS) has conducted aseries of reinterview surveys to measure possible bias in data collectedduring the December Agricultural Survey (DAS). The purpose of thesesurveys is to provide a quantitative, longitudinal measure of qualityfor the Agricultural Surveys (AS). The first reinterview survey wasconducted in December 1987 in Indiana, Minnesota and Ohio. Previouspapers from NASS reinterview surveys reported negative biases(underreporting) of grain stocks and hogs [3,4,5]. The author suggeststhe reader become familiar with these reports for a complete descriptionand overview of specific procedures, training manuals, questionnaires,and reconciliation forms. This paper presents the results of biasestimates for total land, cropland, winter wheat seeded, and corn andsoybean planted acres from the 1988 and 1989 DAS in Indiana, Iowa,Minnesota, Nebraska, Ohio and Pennsylvania.
The biases illustrated in this study were not in the anticipateddirection (i.e., positive) for all acreages. The December reinterviewsurvey questionnaire was primarily designed as an instrument to collectdata to measure hog and grain stock biases. In order to measure acreagebiases, more probing questions are needed regarding acres owned, rented,rented out, etc. A reinterview survey more appropriate to measuringacreage bias was conducted in June 1990 in Ohio and Indiana [8]. Thedesign of the June 1990 survey should result in a better "proxy totruthll for acreage items. The December reinterview results may be abetter representation of response variance than of response bias foracreage items.
SURVEY PROCEDURESThe reinterview surveys conducted by NASS over the past 3 years havefollowed the same procedures initially implemented in the December 1987survey [3]. The reinterviewjreconciliation technique used by NASS isbased on similar techniques used at the u. S. Census Bureau. Theobjective of NASS' surveys is to identify response bias rather than thevariance or consistency of response targeted by the u.s. Census Bureau.In each survey, the final reconciled value is considered the true valuefor computing estimates of bias.
The NASS reinterview surveys feature a 'face to face' reinterview of asubsample of DAS respondents. Computer Assisted Telephone Interviewing(CATI) was used for the original DAS contact, providing a platform forthe reinterview subsample. Reinterview subsample enumeration wasconducted within ten days of the original DAS interview by anexperienced field enumerator or supervisor. Questionnaire wording andsurvey procedures were kept as close to operational DAS procedures aspossible [3]. The reinterview questionnaire's crops section was anabbreviated version of that of the operational questionnaire (seeAppendix A). The original CATI response was not revealed until afterthe reinterview was completed and the reconciliation process initiated.The reconciliation of differences between the original CATI response andthe reinterview response was designed to determine the true value.Reasons for these differences were given by the respondent and recordedby the enumerator.
1

STATISTICAL MEASURESBias and variance estimates were based on a stratified sample design[3]. Estimates and tests of significance were computed on thedifferences between the final Survey Processing System (SPS) edited CATIdata and the final reconciled value or 'truth'. Bias estimates fororiginal unedited CATI data were also summarized and the results weresimilar to the SPS edited CATI results. These results were notpublished in this report in order to minimize repetitive information.
For the ith observation in strata h, bias was measured as
strata h 1, ... ,Land unit i = 1, ... ,nhwhere 0hi = Original SPS edited CATI data
Fhi = Final or reconciled value
THE SAMPLEThe reinterview sample was selected from the DAS CATI respondents ineach of the selected States. Only completed interviews were considered,including 'out-of-business' respondents and interviews with itemrefusals or item 'don't knows'. Survey refusals were not eligible forreinterview. The reinterview subsample approximates a simple randomsample of only the list sampling frame records chosen for CATI. TheCATI sample does not include most extreme operator (EO) strata, areaframe non-overlap (NOL) and operations with previous nonresponse habits.Table 1 illustrates the ]988 and 1989 December Reinterview Survey sampleSlzes and response rates.
Table 1. Sample sizes and response rates, for the 1988 and 1989 DecemberReinterview Surveys.
CompletesState1988IndianaIowaMinnesotaNebraskaOhioPennsylvania
82%94%95%86%93%87%
Refusals
4%3%2%6%3%7%
Inaccessibles
14%:H3 %,8%:4 ~:6~,
TotalSample
Size
16225618020018871
Total 90% 4% 6%: 1,057
1989Indiana 87% 4% 9%; 160Iowa 89% 4% 7<].' 244"Minnesota 95% 2% ] ~; 197Nebraska 86% 6% 81; 204Ohio 83% 7% 10~; 187Pennsylvania 88% 1% 119,; 83
Total 88% 4%
2
1,075

Table 2 shows a comparison of the 1988 and 1989 DAS (list only) samplesizes, number of CATI responses and reinterview sample sizes. Thereinterview survey sample size for 1988 covered 6.8% of the DAS sample.The 1989 reinterview sample covered 7.0% of the DAS sample. The CATIresponse covered 38% of the DAS sample in 1988, ranging from 23% inIndiana to 62% in Ohio. In 1989, the CATI response was 39% of the DAS,ranging from 17% in Indiana to 63% in Ohio.
Table 2. DAS sample sizes, CATI response and reinterview survey samplesizes for 1988 and 1989
DAS CATI Reinterview Reinterviewstate Sample Response Subsample Usables1988Indiana 2,737 676 162 129Iowa 3,025 793 256 240Minnesota 2,971 1,235 180 171Nebraska 2,910 1,165 200 173Ohio 2,354 1,456 188 174Pennsylvania 1,453 571 71 62
Total
1989IndianaIowaMinnesotaNebraskaOhioPennsylvania
Total
15,450
2,7213,0502,9492,9172,3621,365
15,364
5,896
4621,0481,0581,2611,483
739
6,051
RESULTS
1,057
16024419720118783
1,075
949
13921718917515673
949
Response BiasBias estimates for total land, cropland, winter wheat seeded, and cornand soybean planted acreages for the two survey periods are presentedat the six state level in Table 3. Also shown in Table 3 are the biasesas a percent of the DAS expansions. The estimated biases with p-valuesnear .05 are shown in parentheses and any significant univariate test p-values are marked with an asterisk. Both univariate and multivariateanalysis results are shown (H :Bias=O). In this table, a negative biasindicates underreporting of °the survey item, while a positive biasindicates overreporting. Data for harvested acres and production werealso collected and summarized for corn and soybeans. The results weresimilar to those for the planted acres and are illustrated in AppendixF. The formulas for the univariate and multivariate test procedures usedin the analysis can be found in Appendix B.
3

3. six state bias estimates for total land,seeded, corn planted and soybeans planted.
1988Acreaqe Bias
-1,903,777-1,232,594
-174,617-357,309
-22,804
cropland,Tablewheat
CropTotal landCroplandWheat SeededCorn PlantedSoybeans Planted
Multivariate p-value
% of-1.6%-1.7%-4.3%-1.4%-0.1%
DAS( .07)
( .09)
( • 02) *
1989Acreaqe Bias
524,5771,901,473
-146,456437,746356,201
% of0.5%2.4%
-2.7%1. 7%1. 9%
winter
DAS
(.03) *( .07)( . 10)
( . 15)
* indicates significant bias at a=.05
The 1988 analysis indicates an overall negative bias (underreporting) ineach of the six State totals. The absolute relative differences rangedfrom 0.1% for soybeans planted to 4.3% for winter wheat seeded. Amultivariate test using the five variables shows a significantdifference from zero with a p-value less than .05 in 1988. Theviability of the multivariate test is weakened somewhat since thevariables used in the test were highly correlat.ed. Corn, soybeans andwinter wheat are primary components of cropland and cropland makes up asubstantial portion of the total land. Multivariate tests usingdifferent combinations of the five variablE,s did not indicate anysignificant differences.
The biases in 1989 data are in the opposite direction of those of theprevious year, indicating an overreporting of data (with the exceptionof wheat seeded). The cropland bias estimate was statisticallysignificant, with a p-value less than .05. Most of the bias in the sixstate total cropland is attributed to the bias found in Indiana (Table4) •
Table 4 shows the six states' bias calculations for 1988 and 1989. The1989 cropland acres bias in Indiana is significant (p-value=.03), as isthe corn planted acres bias in Pennsylvania (p-value=.Ol). Indiana's1989 cropland bias accounts for 53% of the six State cropland bias.Five observations in Indiana's 1989 reinterview sample accounted for alarge portion of the individual and combined St.ate biases. These fiveobservations combined for 85% of the State's cropland bias and 45% ofthe six State cropland bias. In each case, land from another operationwas incorrectly reported as part of the sampled unit. without thesefive 'outliers', Indiana's cropland bias drops to 152,740 acres (1.3% ofDAS, p-value of .41) and the six State cropland bias drops to 1,041,949acres (1.3% of DAS, p-value of .16). These five observations had asubstantial impact on the significance of the Indiana cropland and sixstate cropland biases. This type of instabilit.y in the bias estimateswas rather characteristic of the acreage data.
4

The majority of biases in Table 4 show the change from negative(underreporting) in 1988 to positive (overreporting) in 1989. Of thefive acreage biases studied, only the wheat seeded bias remainednegative in both years for most states. The biases in Minnesota werenegative in both years for all acreages, the only state with thatcharacteristic.
4. state level bias estimates for total land, cropland,seeded, corn planted, and soybeans planted.
1988Acres Bias % of DAS
( . 06)
TablewheatstateTotal LandIndianaIowaMinnesotaNebraskaohioPennsylvania
-410,868-138,997-118,976-996,055-121,077-147,802
-2.5%-0.9%-0.5%-2.3%-0.9%-2.4%
1989Acres Bias
1,152,801227,346
-425,032-42,608
-262,858-125,074
% of DAS
7.2%1. 2%
-1.8%-0.1%-1. 8%-2.0%
winter
CroplandIndianaIowaMinnesotaNebraskaOhioPennsylvania
Wheat SeededIndianaIowaMinnesotaNebraskaohioPennsylvania
-658,771-178,748
-61,676-107,445-112,221-113,732
17,911-5,922-1,504
-110,398-54,906-19,798
-5.0% (.12)-1. 4%-0.3%-0.7%-1.0%-2.9%
1. 7%-12.2%-1. 3%-8.1% (.06)-4.0% (.09)
-21. 0%
1,012,265432,978
-558,655367,212596,544
51,128
-49,103-6,570
-29,251-21,268-40,678
-414
8.0% (.03)*3.0% (.10)
-3.1% (.12)1. 9%5.6% (.06)1. 3%
-6.0%-29.0%-25.9%
-0.7%-3.1%-0.3%
Corn PlantedIndianaIowaMinnesotaNebraskaOhioPennsylvania
Soybeans PlantedIndianaIowaMinnesotaNebraskaOhioPennsylvania
-118,548-13,027-35,776
16,324-95,580-40,704
-6,220-1,364
-69,893-12,079
97,370-30,618
-3.4%-0.2%-0.7%
0.3%-2.9%-3.3%
-0.2%-0.0%-1. 9%-0.6%
2.6%- 14 • 0'%
188,243102,822-32,772
69,38187,79722,275
248,61762,648
-63,94548,91060,007
-37
3.7%1. 6%
-0.7%1. 1%3.1%2.3%
5.5%1. 5%
-1.6%2.4%1. 7%0.0%
(.01)*
( • 08)
* indicates significant bias at a=.05
5

precisionThe precision of the acreage bias estimates 15 presented in Table 5.The variance formula for the percent bias can be found in Appendix C.The majority of the reconciled crop acreages ~ndicated zero bias. Arelatively small percentage of the responses contributed to theestimated bias for most acreage items. In addition, several largepos itive biases counterbalanced several large negative biases. Thisresulted in a small overall bias for that acreage item coupled with alarge standard error (SE). This is illustrated in Appendix 0 whereexpanded actual bias for soybeans planted in 1988 is relatively smallcompared to expanded absolute bias.
Table 5. precision of crop bias estimates (SPS edited CAT! data).
Crop1988Total landCroplandWheat SeededCorn PlantedSoybeans Planted
1989Total landCroplandWheat SeededCorn PlantedSoybeans Planted
Est.imatedPercent Bias
-1. 6-1.7-4.3-1.4-0.1
0.52.4
-2.71.71.9
StandardError
0.91.02.71.11.4
1.11.13.20.91.2
95% ConfidenceInterval for the
~stimated Percent Bias
(-3.39, 0.17)(-3.67, 0.33)(-9.57, 0.97)(-3.44, 0.74)(-2.87, 2.63)
(-1.68, 2.58)( 0.31, 4.53)(-8.91, 3.52)(-0.12, 3.42)(-0.37, 4.21)
The widths of the confidence intervals for the estimated percent biasesin Table 5 point out a severe lack of precision in the aggregate biasestimates. However, systematic biases apparently do exist and we canestimate their size as shown in the previous section. The lack ofprecis ion in their estimation, however, prec 1udes our using theseestimates as a direct adjustment to survey indications. Nevertheless,the information in this report can be a useful tool in improving surveyprocedures, questionnaire design and enumerato~ training.
Table 6 shows the average absolute biases by crop for all respondents inthe survey and for only respondents reporting a bias. The number ofrespondents reporting a bias represents only a small portion of thetotal response. Looking at total land in 1988, the average absolutebias for all respondents was 43 acres. The average absolute bias forthose reporting a bias was 144 acres.
6

Table 6. Average absolute bias (unexpanded) per respondent for allsurvey respondents and for respondents with a response bias.
Crop1988Total LandCroplandWheat SeededCorn PlantedSoybeans Planted
1989Total LandCroplandWheat SeededCorn PlantedSoybeans Planted
TotalNumber of
Respondents
952951954951952
942939943941942
AverageAbsolute
Bias
33322
116
4339286
Number ofRespondents
with Bias
308390107258224
28335897
228195
AverageAbsolute
Bias
10377224024
144102
143127
proportion of Farm Population studiedAs stated earlier, the reinterview samples were selected from CATIrespondents. As such, the samples were restricted representations ofthe States' farm populations, since NOL area tracts and some list stratawere not included in the CATI samples. Table 7 illustrates thereinterview CATI strata expansions as a percent of the total surveyexpansions. For both years, the CATI strata expansions covered justunder 60% of the DAS (list only) total land expansions. However, theCATI strata representation in the overall DAS list expansions is fairlyconsistent year to year within State and crop classification.
Table 7. Proportion of operational list expansions for crop acreagesrepresented in the reinterview project, by state and survey period.
CATI Strata Representation in the DAS Expansion 1/IN IA MN NE OH PA Total
1988 (Percent)Total Land 77.8 44.5 52.4 70.9 59.1 61.1 59.7Cropland 78.7 45.1 69.9 76.9 73.3 72.7 66.2Wheat Seeded 85.2 35.8 85.1 81.4 78.8 75.3 80.3Corn Planted 82.9 43.9 70.4 77.5 77.7 75.0 65.9Soybeans Planted 82.9 48.4 69.4 74.2 78.1 52.7 66.0
1989Total Land 72.5 43.5 65.3 68.6 44.1 67.7 59.2Cropland 76.5 42.7 91.4 76.5 69.9 162.7 71.5Wheat Seeded 76.8 50.5 93.8 84.5 78.4 77.4 81.0Corn Planted 77.6 43.0 74.1 75.5 77.1 78.6 64.3Soybeans Planted 77.9 42.7 73.8 80.1 80.6 76.9 65.7
1/ (CATI Strata DE -+ Total List DE) x 100.
7

Table 8 shows the proportion of the national estimates represented byeach state estimate [6,7). winter wheat was lightly represented in thesample with only 10% of the crop sown in these six states. Coverage ofthe winter wheat seeded in the six states was high, with over 80% of theoperational expansion coming from the CATI strdta. Cropland acreage wasomitted from Table 8 because NASS does not mil}:enational estimates 01cropland acres.Table 8. Proportion of national estimate represented by each state inthe reinterview study.
state Estimate as a Percent ofthe National Estimate
Crop IN IA MN NE OH PA 6 states__ •___ •• ___ - ___ a_
1988Total Land 1.6 3.4 3.0 4.7 l. () 0.8 15.2Wheat Seeded 1.9 0.2 0.3 5.1 2. :) 0.5 10.2Corn Planted 7.7 16.7 8.4 10.2 4 ..9 2.2 50.0Soybeans Planted 7.3 13.7 8.3 4.1 ()" G 0.4 40.2
1989Total Land 1.7 3.4 3.0 4.8 1..6 0.8 15.2Wheat Seeded 1.9 0.1 0.2 4.5 2 ..6 0.4 9.8Corn Planted 7.4 17.4 8.6 10.4 4 ..4 1.9 50.0Soybeans Planted 7.6 13.7 8.3 4.3 6..6 0.5 41.0
Bias CharacteristicsSpecific reasons for differences between the criginal contact and thereinterview responses were provided by the r0spondent and recorded bythe enumerator during the reconciliation process. Reasons were dividedinto three classes, "def::"nitional", "estimat inq" and "other". Table 9shows the frequencies and the average absolute biases by reason class.The frequency is the number of times each reason occurred within eachclass. The average absolute bias is the average of the absolute valuesof each unexpanded response bias.
Table 9. Frequency of bias and average absolute bias by class of reason,"definitional", "estimating", or "other".
Frequency Av,'raqe Absolute BiasCrop Def Est oth Total Of? j Est Oth Total
- -----~~------1988Total Land 98 123 87 308 IG(3 47 110 103Cropland 96 174 120 390 14:3 35 86 77Wheat Seeded 14 55 38 107 1() 15 32 22Corn Planted 39 =.. 36 83 258 llg 16 44 40Soybeans Planted 32 ..16 76 224 ') ' . 20 45 39
1989Total Land 108 126 49 283 11') 32 497 144Cropland 108 169 81 358 l7l 62 97 102Wheat Seeded 11 55 31 97 i) ~) 24 61 39Corn Planted 37 129 62 228 Il '7 18 38 39Soybeans Planted 31 113 51 195 9 ,) 17 62 41
8

In Table 9, the large "other" average absolute bias in 1989's total landindication came from a large operation in Ohio where the respondent didnot remember the CAT! interview. "Estimating" reasons accounted for ahigher frequency of actual differences but "definitional" reasonsaccounted for the larger average absolute biases. Table 10 shows thereason class, frequency and biases for total land in 1988 and 1989. Theactual bias and absolute bias were calculated by summing the stratalevel bias expansions for total land.
Table 10. Bias frequencies by reason class for total land, 1988 and1989, 6 state total.
Reason Frequency Actual Absolute ValueClass Obs (%) Bias Bias (% )
1988Definitional 98 (32%) -535,249 3,924,216 (53%)Estimating 123 (40%) -373,081 1,233,825 (17%)Other 87 (28%) -995,446 2,200,807 (30%)
Total 308 -1,903,777 7,358,848
1989Definitional 108 (38%) 1,537,806 5,953,090 (67%)Estimating 126 (45%) -735,602 1,614,356 (18%)Other 49 (17%) -277,627 1,317,148 (15%)Total 283 524,577 8,884,594
Tables 11 and 12 list each reason that accounted for over 5% of thetotal land absolute bias for 1988 and 1989. Reasons for biases incropland, corn and soybeans planted and winter wheat seeded acreagesfollow a pattern similar to that of the reasons for total land. Biascharacteristics for cropland, corn planted, soybean planted, and winterwheat seeded acreages are found in Appendix D.
In both years, the reason "Figure was estimated" had the highestfrequency but had little contribution to the actual or absolute bias.The largest portion of the bias for both years resulted from failure toidentify the proper reporting unit. The reasons causing the largestabsolute bias for both years were associated with determining whetherthe operation was in or out of business and with determining the correctamount of acreage to include. Both issues deal with the screeningquestions (Section 1 of the interviewing instrument) and the acresoperated (Section 2). The largest individual reporting biases were inNebraska where 2 respondents incorrectly included their ADM (fee perhead basis) pasture in the total farm acres.
9
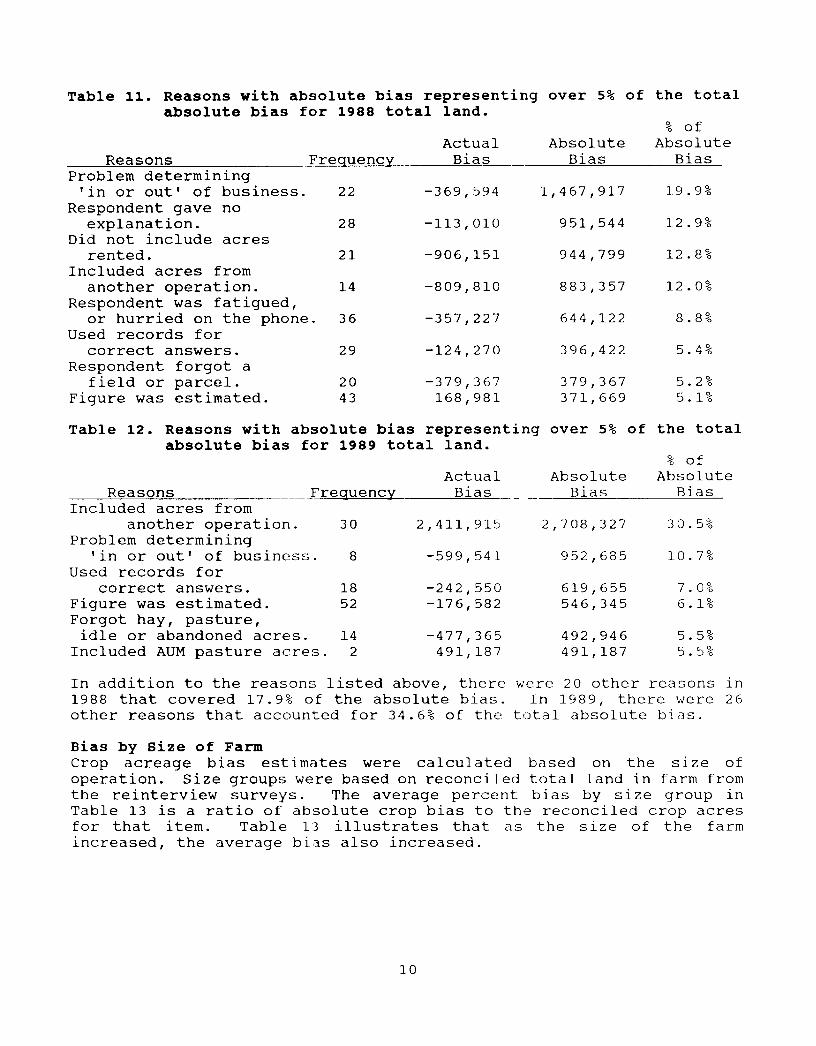
Table 11. Reasons with absolute bias representing over 5% of the totalabsolute bias for 1988 total land.
Reasons FrequencyProblem determining
'in or out' of business. 22Respondent gave no
explanation. 28Did not include acres
rented. 21Included acres from
another operation. 14Respondent was fatigued,
or hurried on the phone. 36Used records for
correct answers. 29Respondent forgot a
field or parcel. 20Figure was estimated. 43
ActualBias
-369,594
-113,010
-906,151
-809,810
-357,227
-124,270
-379,367168,981
AbsoluteBias
1,467,917
951,544
944,799
883,357
644,122
396,422
379,367371,669
% ofAbsolute
Bias
19.9%
12.9%
12.8%
12.0%
8.8%
5.4%
5.2%5.1%
Table 12. Reasons with absolute bias representing over 5% of the totalabsolute bias for 1989 total land.
Reasons __FrequencyIncluded acres from
another operation. 30Problem determining
'in or out' of business. 8Used records for
correct answers. 18Figure was estimated. 52Forgot hay, pasture,
idle or abandoned acres. 14Included AUM pasture acres. 2
ActualBias
2,411,915
-599,541
-242,550-176,582
-477,365491,187
AbsoluteBias
2,708,327
952,685
619,655546,345
492,946491,187
% ofAbsolute
Bias
30.5%
10.7%
7.0%6.1%
5.5%5.5%
In addition to the reasons listed above, there were 20 other reasons In1988 that covered 17.9% of the absolute bias. In 1989, there were 26other reasons that accounted for 34.6% of the total absolute bias.
Bias by Size of FarmCrop acreage bias estimates were calculated based on the size ofoperation. size groups were based on reconciled total land in farm fromthe reinterview surveys. The average percent bias by size group inTable 13 is a ratio of absolute crop bias to the reconciled crop acresfor that item. Table 13 illustrates that as the size of the farmincreased, the average bias also increased.
10

Table 13. Average crop bias (unexpanded), by size of operation.
Total LandSize Groups1988
o - 99100 - 249250 - 499500 - 999
1000+Missing II
1989o - 99
100 - 249250 - 499500 - 999
1000+Missing II
Crop-landAcres
6.49.8
33.535.379.014.6
10.512.825.943.9
126.00.0
WheatSeeded
Acres
0.70.61.41.79.9
25.0
0.21.10.82.9
19.90.0
CornPlanted
Acres
4.24.1
11.613.526.920.0
1.46.45.4
14.324.8
0.0
SoybeansPlanted
Acres
5.42.68.9
11. 619.850.0
1.25.35.0
15.119.9
0.0
11Total land acres were missing but crop biases were present.
Table 14 shows that the amount of bias is larger in the smaller farmsrelative to the amount of crop acres present. Since small farmsusually fall into the lower strata that have large expansion factors,their reporting biases have a large influence on survey expansions.
Table 14. Bias acres as a percent of crop acres, by size of operation.Crop- Wheat Corn Soybeans
Total Land land Seeded Planted PlantedSize Groups 9,- 9,- % 9,-
0 0 0
19880 - 99 71.2 7.5 87.4 135.0
100 - 249 7.4 10.2 8.0 8.3250 - 499 11. 6 13.3 10.0 12.3500 - 999 6.2 5.6 6.3 7.5
1000+ 7.0 10.3 7.1 8.5Missing II 26.9 66.7 9.9 29.4
19890 - 99 48.4 23.5 28.1 26.1
100 - 249 9.9 17.7 13.6 16.6250 - 499 9.9 8.1 5.0 6.7500 - 999 8.1 10.1 6.3 9.1
1000+ 10.2 12.0 7.1 9.4Missing II 0.0 0.0 0.0 0.0
11Total land acres were missing but crop biases were present.
11

DISCUSSIONThe purpose of the reinterview surveys is to search for biases in theAgricultural Survey data, measure their magnitude if biases exist andidentify the reasons for biases. categories were created tocharacterize biases with respect to population coverage and size offarm. Previously, biases were observed and measured in the hog data [5]and in the grain stocks data [3,4J of the AS. These reports indicatedbiases were present in t~he grain stocks and hogs data series fromunderreported survey data. While bias appears i:o be present in the AScrop acreage indications as well, the actual level of bias is difficultto ascertain given the low level of precision in our bias estimates.Complete check data are not available for most crop acreages.
The biases found in the 1988 and 1989 Reinterview Surveys' acreage dataare only approximations. Bias estimates were relatively small at thesix State level for acreage items, ranging from -4.3% for wheat seededin 1988 to 2.4% for cropland in 1989. Standard errors were largerelative to the estimated biases. The standard errors were governed bya minority of large negative and positive di fferences surrounding amajority of zero or near zero biases, and their magnitudes limit anyinferences about the effect of bias on the official estimates. Manyother characteristics of the indicated biases were identified in theanalysis, which can serve as a basis for future survey improvements andpossible questionnaire redesign.
The samples for the reinterview surveys taken from the CATI responses,do not fully represent the DAS sample in any of the six States. All NOLarea frame records and EO strata were excluded. CATI sample sizes arenot easily manipulated, since CATI capabilities are dictated by officespace, telephone connections, computer hardware, and enumerator staffingwithin each State stati stical Office. Larger samples should includearea frame NOL and other non-CATI respondents, giving us a truerrepresentation of the AS sample. Including more States in the projectwould broaden the coveraqe of the survey and ,JQuld account for moremajor crop acreages. Comparing Table 2 (sample sizes and responses) andTable 7, indicates that the CATI strata for the reinterview states covera majority (nearly 60% in both years) of their respective total landsurvey expansions, but represent only 38% of the total DAS responses in1988 and 46% in 1989. Previous papers [3,4,5] have recommended qreatercoverage for the reinterview sample to improvc> the reliability of thebias estimates. The results from this analysis also point out the needfor a larger and broader sample size in future reinterview studies.
The estimated total land biases in both years were relatively small,-1.6% in 1988 and 0.5% in 1989. These differenc('~;were not statisticallysignificant. State level biases ranqed from -2.5% to 1.2%, excludingIndiana's estimated bias of 7.2% explained earlier in the paper. TheIndiana cropland bias illustrates the influence a few large errors canhave on the reinterview data.
12

Looking at the tables in Appendix D, "definitional" reasons account.edfor the greatest portion of the absolute bias in both years. These werethe major contributors to the large CV's for the estimated total landbias. The largest biases resulted from including AUM acres in the totalacres operated. The most frequent definitional reason across both yearsof the survey was" Included acres from another operation.", occurring 44times, with an average absolute bias of 388 acres. This reason as wellas other definitional reasons (Appendix D, Table 1 and Table 6) implythat the inclusions/exclusions from Section 2 (Acres Operated) in theinterviewing instrument need to be emphasized by the enumerator duringthe interview.
winter wheat seedings are initially set using the indications from end-of-season acreage surveys. Prior to 1987, the main vehicle for makingthe estimate was the December Enumerative Survey. Since the inceptionof the DAS in 1987, the six States' winter wheat seeded acres have beenreported on the DAS. The estimated biases in this report for winterwheat seedings are negative for both years, making winter wheat the onlycrop to exhibit this consistency. The six States in the study accountfor about 10% of the national winter wheat seeded. The CATI strataexpansions in the six States represented over 80% of their overall DASexpansions. Unlike corn and soybeans, the wheat seeded acreage biascarne mostly from "estimating" and "other" type errors. A likely reasonfor a lower "definitional" type bias for winter wheat was a shorterrecall time for this crop relative to that for either corn or soybeans.winter wheat seedings are normally completed by early November.
Corn and soybean planted acreage biases, under 2% of the DAS expansionsfor each crop in both years, were not significant at the six Statelevel. At the State level, Pennsylvania's 1989 corn planted acreageshowed the only significant difference. The six State level bias forboth corn and soybeans changed sign from negative (underreporting) in1988 to positive (overreporting) in 1989. Treating each reinterviewsample independently, a 95% confidence interval for the differencebetween the 1988 bias and the 1989 bias includes zero, indicating thatthe biases were not significantly different from 1988 to 1989 for cornand soybeans. Again, any inferences about the magnitude of the biasesare weak due to a lack of estimation precision.
Total "definitional" bias was positive for all crop items, except fortotal land in 1988 where "definitional" bias was negative and "other"bias was dominant. This indicates overreporting generally occurred when"definitional" rules were broken. Many of the "definitional" errors maybe corrected through training, interviewing instrument redesign orsurvey design improvements. Many of the "definitional" errors made inthe DAS resulted from problems with Sections 1 and 2 of the interviewinginstrument. The screening questions in the front of the instrument needto be emphasized for the sampled name. The inclusion/exclusionstatements in section 2 should be more noticeable.
13

Total "estimating" bias was negative in most cases, showing that when arespondent estimates, they tend to underreport their acreages. The"estimating" type errors were the most frequent, but had the smallestimpact on overall bias compared to "definitional" and "other" typeerrors. "Estimating" errors will occur to some extent in any surveyregardless of the amount of training and for any survey design. "other"errors are also to some degree inevitable and depend on the respondentor enumerator action during the course of the CATI interview or face-to-face reinterview.
Minnesota was the only state to exhibit negative biases for both years,but it is difficult to draw inferences since the biases are notsignificant given the lack of estimation precision. However, unlike thecharacteristics of the other five states, reasons for differences inMinnesota showed that "est:imating" type errors accounted for most of thebias.
RECOMMENDATIONSstatistically significant differences at the six state level were notevident for any crops in either year's reinterview survey because theprecision of the bias estimates was less than desirable. If the biasestimates are to be used as a tool by the Agricultural statistics Boardin estimating acreages, the bias estimating precision must be increased.Larger sample sizes will be necessary to achieve this goal. Non-CATIrespondents, including NOL samples, should be eligible for reinterviewsample selection. More states should be included in the survey in orderto broaden the coverage of major crop acreages.
Reinterviews following the DAS should continue since DAS acreageindications continue to be a concern. The change in estimated bias inthe reinterview survey from year to year was not significant nor was itconsistent. Bias measurement should continue on a regular basis so thatdata series can be developed over time.
Failure to identify the proper operating unit. leads to many of the"definitional" errors for crop acreages. The interviewing instrumentshould highlight "The name or operation sampled." in each of thescreening questions and stress the "land operated" reporting concept.
The "Include" and "Exclude" statements in section 2 of the interviewinginstrument should be highlighted. Enumerators should place heavyemphasis on obtaining the correct total acreage, since errors in section2 can invalidate all data collected in subsequent sections.
14

REFERENCES1. Cochran, W. G. (1977). Samplinq Techniques, Third edition, Wiley &Sons, New York.
2. Fahimi, M., Kasala, S., Fecso, R. (1990). "Hypothesis Testing forMultivariate Stratified Sampling", draft paper, National Agriculturalstatistics Service, U.S. Department of Agriculture.
3. Pafford, B. (1989). "USE OF REINTERVIEW TECHNIQUES FOR QUALITYASSURANCE: The Measurement of Response Bias in the Collection ofDecember 1987 Quarterly Grain Stocks Data Using CATI", SRB ResearchReport Number SRB-89-08, National Agricultural statistics service, U.s.Department of Agriculture.
4. McClung, G., Tolomeo, V., Pafford, B. (1990). "The Measurement ofResponse Bias in March 1988 Quarterly On-Farm Grain stocks Data", SRBResearch Report Number SRB-90-09, National Agricultural statisticsService, U.S. Department of Agriculture.
5. Tolomeo, V., McClung, G. (1990). "Response Bias in the QuarterlyAgricultural Survey Hog Data: December 1987 and March 1988", SRBResearch Report Number-90-12, National Agricultural Statistics Service,U.s. Department of Agriculture.
6. Agricultural Statistics Board (1989). "Crop Production, 1988 AnnualSummary", Publication CrPr 2-1 (89), National Agricultural StatisticsService, U.S. Department of Agriculture.
7. Agricultural Statistics Board (1990). "Crop Production, 1989 AnnualSummary", Publication CrPr 2-1 (90), National Agricultural statisticsService, U.S. Department of Agriculture.
8. Warren, F., (1991). "June 1990 Reinterview Survey, Acreage Analysis"draft paper, National Agricultural statistics Service, U.s. Separtmentof Agriculture.
15

t\ppendix t\: Rpint0rvic-w Qu~:-;t jl)rll]" I t-·' - \:Cf)pS Sp{-'tion - I()\\<)
Page 2
SECTION 2· ACRES OPERATED
Acres
1900
1. How many total acres of land were in this operation on December 1? _
Include: Farmstead, all cropland, woodland, pastureland, wasteland,government program land, all/and owned, rented or managed.
Exclude: Land rented to others and all grazing land used on an AUM (feeper head) baSIS
2. Of the total acres in this operation, how many acres would be considered 1802cropland, including land in hay and cropland in government programs? _
SECTION 3· CROPSHow to complete this section .•• Report for all the land you operate, including land rented from others00 If harvest is not complete, make your best estimate of acres and total production.00 Production is equal to acres ha"'ested and to be ha",ested times average yield per acre.00 Total production should include the landlord'sshare.
1. The following information IS needed for CROPS HARVESTED DURING 1989
19
CORN (exclude popcorn and sweet corn):
e. Acres planted for all purposes _ acres
b. Acres ha",ested and to be ha",ested for grain (exclude seed corn) acres
c. Total grain production (exclude seed corn) bushels
d. Acres harvested for seed corn acres
e. Total seed corn production , bushels
SOYBEANS:
f. Acres planted for all purposes acres
g. Acres ha",ested and to be harvested for beans acres
h. Total production bushels
530
400
401
398
399
600
763
227
----------------------------------------------2. Please report WINTER WHEAT seedings for the 1990 CROP YEAR.
WINTER WHEAT acres seeded and to be seeded for ell purposes ..............•..• ,,.s 1836
Continue On Ne.t Page
] 6

Appendix A: ReintcrviBW Questionnaire - Crops Section - MinnesotaPage 2
SECTION 2 - ACRES OPERATED
Acres
1900
1. How many total acres of land were in this operation on December 1? .......•............. _
Include: Farmstead, all cropland, woodland, pastureland, wasteland,government program land, all land owned, rented or managed.
Exclude: Land rented to others and all grazing land used on anAUM (fee per head) basis.
2. Of the total acres in this operation, how many acres would be considered 1802cropland, including land in hay and cropland in government programs? .........•....... '- ---'
SECTION 3 - CROPSHow to complete this section.- - Report for all the land you operate, including land rented from others.- - If harvest is not complete, make your best estimate of acres and total production.- - Production is equal to acres harvested and to be harvested times average yield per acre.- - Total production should include the landlord's share.
1. For the following SMALL GRAIN CROPS. please report for the 1989 CROP YEAR.
SPRING WHEAT:
1550
a. Acres planted for all purposes this past spring acres
OATS:
1533
b. Acres planted for all purposes this past fall or spring .....................• acres
2. The following information is needed for crops harvested during 1989.
CORN (exclude popcorn and sweet corn):530
27
a. Acres planted for all purposes acres
b. Acres harvested and to be harvested for grain and seed acres
c. Total grain and seed production ........•............................ bushels
SOYBEANS:
d. Acres planted for all purposes ..................•....................... acres
e. Acres harvested and to be harvested for beans ....•...................... acres
f. Total production " .......• bushels
3. Please report WINTER WHEAT seedings for the 1990 CROP YEAR.
531
310
600163221
!836WINTER WHEAT acres seeded and to be seeded for all purposes ............•.... acres
Continue On Next Page
17

Reintervlp\,,r OUE~St 11~ttrJ,1
SECTION 2 - ACRES OPERATED
Acres
1900
1. How many total acres of land were In this operation on December 1? ---l
Include: Farmstead, all cropland, woodland, pastureland, wasteland,government program land, all land owned, rented or managed.
Exclude: Land rented to others and all grazing land used on an AUM (feeper head) basis.
2. Of the total acres in this operatIon, how many acres would be considered 1802cropland. including land in hay and cropland in government programs? _
SECTION 3 - CROPSHow to complete this section .. - Report for all the land you operate, including land rented from others- - If harvest is not complete, make your best estimate of acres and total production.- - Production is equal to acres harvested and to be harvested times average yield per acre.- -LAND IRRIGATED should include all land watered one or more times for the 1989 crop- - Report acreage and production for both irrigated and non-irrigated crops when listed separately.- - Total production should Include the landlord's share
1. The following information is needed for CROPS HARVESTED DURING 1989
31
CORN (exclude popcorn and sweet corn):
a. Acres planted for all purposes .
b. Acres harvested and to be harvested for grain and seed .
c. Total grain and seed production .
SOYBEANS:
d. Acres planted for all purposes .
e. Acres harvested and to be harvested for beans .
f. Total production , .
Non-Irrigated Irrigated532 621
ac ae538 544
ac ae372 371
bu bu
Non-Irrigated Irrigated761 622
ac ac226 225
ac ac229 228
bu bu
2. Please report WINTER WHEAT seedings for the 1990 CROP YEAR.
1836
WINTER WHEAT acres seeded and to be seeded for all purposes .
Continue On Next Page
18
ae I
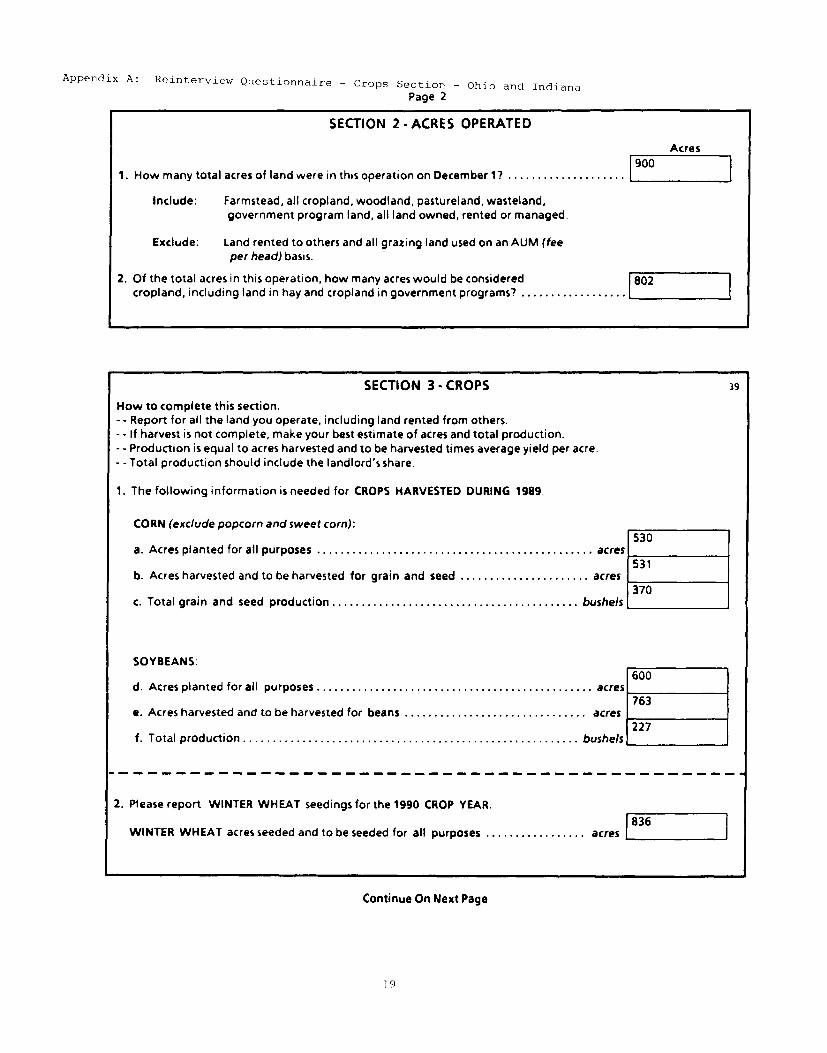
Appendix A: Reinterview Questionnaire - Crops Section - Ohio and IndianaPage 2
SECTION 2 - ACRES OPERATED
Acres
1900
1. How many total acres of land were in this operation on December 1? L _
Include: Farmstead, all cropland, woodland, pastureland, wasteland,government program land, all land owned, rented or managed.
Exclude: Land rented to others and all grazing land used on an AUM (feeper head) basis.
2. Of the total acres in this operation, how many acres would be considered IS02cropland, including land in hay and cropland in government programs? .............•...• --..J
SECTION 3· CROPSHow to complete this section.- - Report for all the land you operate, including land rented from others.- - If harvest is not complete, make your best estimate of acres and total production.- - Production is equal to acres harvested and to be harvested times average yield per acre.- - Total production should include the landlord's share.
1. The following information is needed for CROPS HARVESTED DURING 1989.
CORN (exclude popcorn and sweet corn):
a. Acres planted for all purposes acres
b. Acres harvested and to be harvested for grain and seed acres
c. Total grain and seed production bushels
SOYBEANS:
d. Acres planted for all purposes acres
e. Acres harvested and to be harvested for beans acres
f. Total production bushels
530
531
370
600763
227
39
----------------------------------------------2. Please report WINTER WHEAT seedings for the 1990 CROP YEAR.
1836
WINTER WHEAT acres seeded and to be seeded for all purposes acres
Continue On Next Page
19

Page 2
SECTION :l- ACRES OPERATED
Acres
1900
1. How many total acres of land were in this operation on December l' ---l
Include: Farmstead, all cropland. woodland, pastureland, wasteland,government program land, all land owned, rented or managed.
Exclude: land rented to others and all grazing land used on an AUM (feeper head) baSIS.
2. Of the total acres in this operation, how many acres would be considered 1802cropland, including land in hay and cropland in government programs' .................•..•. -'
SECTION 3 - CROPS
How to complete this section.- - Report for all the land you operate. including land rented from others- - If harvest is not complete, make your best estimate of acres and total production.- - Production is equal to acres harvested and to be harvested times average yield per acre.- - Total production should include the landlord's share.
1. The following information IS needed for CROPSHARVESTED DURING 1989
CORN (exclude popcorn and sweet corn):
a. Acres planted for all purposes ..................................................•..
b. Acres harvested and to be harvested for dry grain .
c. Total dry grain production .
d. Acres harvested for high moisture shelled corn (usually 24 - 30% mOisture) .
e. Total high moisture shelled corn production .
f. Acres harvested for ground high moisture ear corn '" ....•.
g. Total ground high moisture ear corn production ...................................•
SOYBEANS:
h. Acres planted for all purposes .
i. Acres harvested and to be harvested for beans .
j. Total production ......................................................•..........
530
369
382
383
384
386
387
600763
227
ac
ac
bu
ac
bu
ac
bu
ac
ac
bu
42
---------------------------------------------2. Please report WINTER WHEAT seedings for the 1990 CROP YEAR.
1836
WINTER WHEAT acres seeded and to be seeded for all purposes .
Continue On Next Page
20

Appendix B: stratified Multivariate and Univariate Tests
stratified Multivariate Test: [2)
vs
wherex, ~ are (1 x p) row vectors
= an (nh x p) matrix of observations on p variables for stratum h
an (nh x 1) vector of l's
21

stratified Univariate Test:
VB
if z >- Z C1 then reject Ho2
z Xst - ~ 0
Vvar (xst)
22
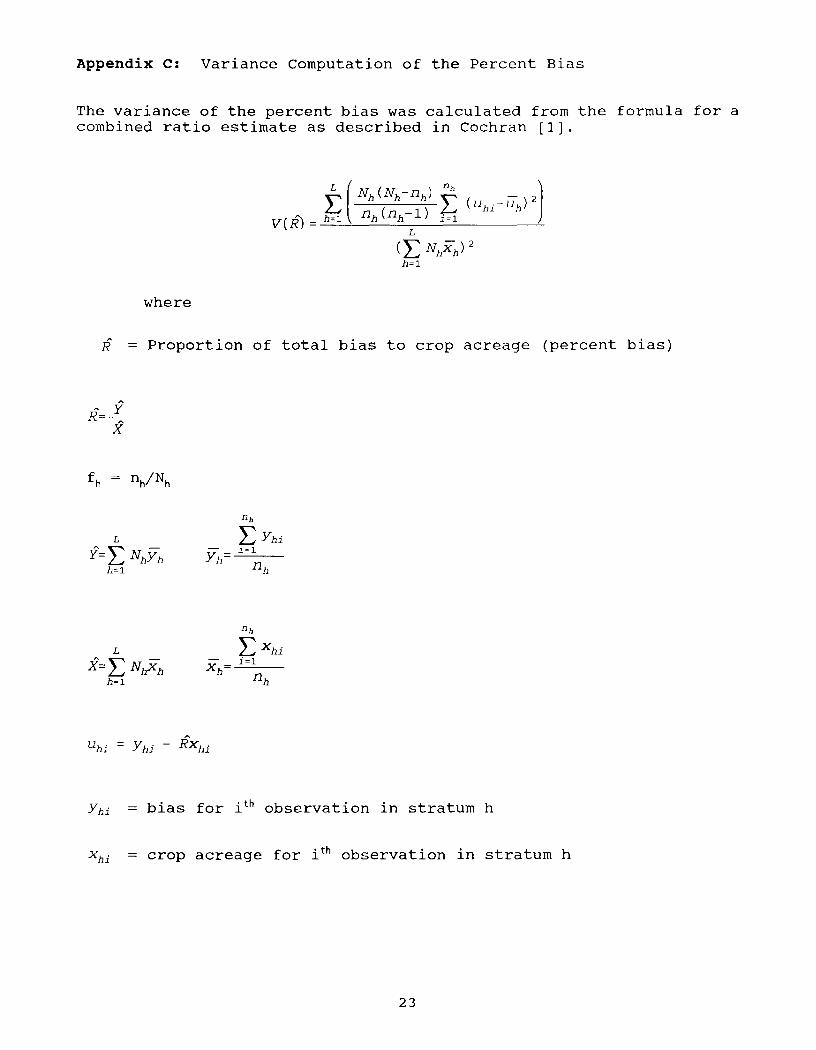
Appendix C: Variance computation of the Percent Bias
The variance of the percent bias was calculated from the formula for acombined ratio estimate as described in Cochran [1].
where
R = Proportion of total bias to crop acreage (percent bias)
~ yR=-
X
Yhi bias for ith observation in stratum h
Xhi = crop acreage for ith observation in stratum h
23

Appendix D. Reinterview Survey Bias Reasons Summary (Six State Level).
1\1lJ 1e 1. 1988 Total Land Bias by Reason
Total LandH i~lSby Class
Total Definitional Biasrotal Estimating BiasTotCll Other Bias
Total
Frequency
98123
87
308
ActualBias
(expanded)
-535,249-373,081-995,446
-1,903,848
AbsoluteBias
(expanded)
3,924,2161,233,8252,200,807
7,358,848
f ceq\Jency
AverageAbs. Bias
(unexp)
16847
110
103
AverageAbsolute Bias
(une~lDefinitional Biasoidn't report for name on label.Included acres from another operation.Problem determining 'in or out' of business.Didn't include acres rented.rncluded acres rented out.Reported crop acres not total acres.Forgot CRP acres and/or cover crop acres.oidn't include silage acres.DiJ not report as of December 1.Forgot hay, pasture, abandoned and/or idle acres.I'r'oblemwith include/exclude of woods and waste.1.3tC planted acres were not included.
Estj"mational BiasForgot a field or parcel of land.Used records for correct answer.Fi~ure was estimated.tither answer was right.Rounding.
otll~r BiasEnumerator asked question wrong.Respondent can't remember phone interview.Respondent can't hear on the phone.Respondent gave no explanation.Respondent fatigued.Respondent reported for wrong year.Respondent thought it was reported the first time.Rospondent does not give accurate data on phone.Enumerator did not reconcile.Respondent did not think it was enough to report.
24
2142221102123
1911
2029431813
341
283614262
514438193144113
903030282823
7
796246196
353202192138
9045422315
9

Appendix D. Reinterview Survey Bias Reasons Summary (Six State Level).
Table 2. 1988 Cropland Bias by Reason
CroplandBias by Class
Total Definitional BiasTotal Estimating BiasTotal Other Bias
Frequency
96174120
ActualBias
(expanded)
420,478-845,399-807,673
AbsoluteBias
(expanded)
2,630,3081,592,8252,383,063
AverageAbs. Bias
(unexpanded)
1433586-------------------------------------------------------------------------------
Total 390 -1,232,594 6,606,196 77
Frequency
AverageAbsolute Bias(unexpanded)
Definitional BiasIncluded acres from another operation.Didn1t report for name on label.Problem determining 'in or out' of business.Late planted acres not included.Forgot CRP acres and/or cover crop acres.Included acres rented outDidn't include &cres rented.Forgot hay, pasture, abandoned and/or idle acres.Did not report as of December 1.Did not include silage acres.Problem with include/exclude of woods & waste.Included only acres owned, not operated.Included only acres harvested, not planted.
Estimational BiasForgot a field or parcel of land.Figure was estimated.Used records for correct answer.Either answer was right.Rounding problem.
134
195
117
16622812
971532615
354202201134111
867853463028109
13838321511
other BiasEnumerator asked question wrong. 4Respondent can't remember phone interview. 3Respondent can't hear on the phone. 2Respondent fatigue. 45Respondent gave no explanation. 44Respondent forgot to report the first time. 3Respondent reported for wrong year. 1Respondent does not give accurate data on phone 2Enumerator did not reconcile. 5Respondent thought it was reported the first time. 9Respondent did not think it was enough to report. 2
25
250179124
898863605041177

Appendix D. Reinterview Survey Bias Reasons Summary (Six State Level).
Table 3. 1988 Wheat Seeded Bias by Reason
winter Wheat SeededBias by Class
Total Definitional BiasTotal Estimating BiasTotal Other Bias
Total
Frequency
145538
107
ActualBias
(expanded)
340-8,918
-166,039
-174,617
AbsoluteBias
(l,"xpanded)
44,305202,433243,908
490,646
AverageAbs. Bias
(unexpanded)
191532
22
AverageAbsolute Bias
Frequ~ncy-- (unexpanded)Definitional BiasIncluded acres from another operation.Problem determining lin or out' of business.IncJuded acres rented out.Forgot CRP acres and/or cover crop acres.Problem with include/exclude woods and waste.Did not report as of December 1.
Estimational BiasForgot a field or parcel of land.Used records for correct answer ..Figure was estimated.Rounding problem.Either answer was right.other BiasRespondent forgot to report the first time.Enumerator asked question wrong.Respondent does not give accurate data on phone.Respondent was not asked question on the phone.Enumerator had problem with the computer.Respondent gave no explanation.Respondent fatigue.Respondent did not think it was enough to report.
26
154121
G1326
':)':)
4
322
LO131
382320655
25231322
12661463122141410

Appendix D. Reinterview Survey Bias Reasons Summary (Six State Level).
Table 4. 1988 Corn Planted Bias by Reason
Corn PlantedBias by Class Frequency
ActualBias
(expanded)
AbsoluteBias
(expanded)
AverageAbs. Bias
(unexpanded)-------------------------------------------------------------------------------Total Definitional BiasTotal Estimating BiasTotal Other Bias
3913683
135,864- 79,780-413,392
788,083496,150795,014
1181644
-------------------------------------------------------------------------------Total 258 -357,309 2,079,248 40
Definitional BiasDidn't report for name on label.Included acres from another operationProblem determining 'in or out' of business.Didn't include acres rented.Included acres rented out.Didn't include silage acres.Problem with include/exclude woods and waste.Reported acres harvested not planted.
Freauency
19
1393211
AverageAbsolute Bias(unexpanded)
61523610639351914
2
Estimational BiasForgot a field or parcel of land.Used records for correct answer.Figure was estimated.Either answer was right.Rounding problem.
Other BiasRespondent forgot to report the first time.Respondent couldn't hear on the phone.Reported for wrong year.Enumerator asked question wrong.Respondent can't remember phone interview.Enumerator had problem with the computer.Respondent fatigue.Respondent gave no explanation.Enumerator did not reconcile.Respondent thought they reported the first time.Respondent does not give accurate data on phone.
9 5534 1563 1515 1415 2
1 1981 1331 1005 983 861 50
34 4125 32
6 235 111 10
27

Appendix D. Reinterview Survey Bias Reasons Summary (six State Level).
TGble 5. 1988 Soybeans Planted Bias by Reason
Soybeans PlantedBias by Class
Total Definitional BiasTotal Estimating BiasTotal Other Bias
Total
Frequency
3211676
224
ActualBias
(expanded)
192,82378,015
-293,642
- 22,804
AbsoluteBias
(expanded)
577,175507,652679,571
1,)64,398
AverageAbs. Bias
(unexpanded)
912045
39
AverageAbsolute Bias
EL(~(lU(>t1CY_~ __ (unexpanded 1Definitional BiasIncluded acres from another operationProblem determining 'in or out' of business.Didn't include acres rented.Didn't include double crop acres.Included acres rented out.Reported acres harvested not planted.
Estimational BiasForgot a field or parcel of land.Used records for correct answer.Figure was estimated .Either answer was right.Rounding problem.
other BiasEnumerator asked question wrong.Respondent can't remember phone interview.Respondent fatigue.Respondent gave no explanation.Respondent couldn't hear on the phone.Enumerator did not reconcile.Respondent forgot to report the first time.Respondent does not give accurate data on phone.Respondent forgot to report.Respondent did not think it was enough to report.
8 1401') 965 541 301 20] 1
III 39, . 23)Lj
•~ G 20] 2 10] " 6<,
2 2152 83
31 4624 43
J 33<1 31J 27J 20L 12L 7
28

Appendix D. Reinterview Survey Bias Reasons Summary (Six State Level).
Table 6. 1989 Total Land Bias by Reason
Total LandBias by Class Frequency
ActualBias
(expanded)
AbsoluteBias
(expanded)
AverageAbs. Bias
(unexpanded)-------------------------------------------------------------------------------Total Definitional BiasTotal Estimating BiasTotal Other Bias
108126
49
1,537,806-735,602-277,626
5,953,0901,614,3561,317,148
11532
497-------------------------------------------------------------------------------
Total 283 524,577 8,884,594 144
FrequencyDefinitional BiasIncluded AUM pasture acres. 2Did not report as of December 1. 4Included acres from another operation 30Problem determining 'in or out' of business. 8Forgot hay, pasture, abandoned and/or idle acres. 14Didn't include rented acres. 14Included acres rented out. 15Forgot CRP acres and/or cover crop acres. 2Problem determining correct partnership data. 1Problem with include/exclude woods and waste. 11Didn't report for name on label. 1Reported crop acres not total acres. 5Late planted acres were not included. 1
AverageAbsolute Bias(unexpanded)
1418382364280148124
963329272621
3
Estimational BiasUsed records for correct answer.Forgot a field or parcel of land.Figure was estimated.Either answer was right.Rounding problem.
other BiasRespondent can't remember phone interview.Enumerator recorded answer incorrectly.Respondent fatigue.Respondent does not give accurate data on phone.Respondent can't hear on the phone.Enumerator asked question wrong.Respondent thought they reported the first time.Respondent gave no explanation.Respondent added wrong.Respondent said they were not asked on the phone.Enumerator forgot to ask.Enumerator did not reconcile.Respondent did not think it was enough to report.
29
1819541718
1453268691211
181140
68139
1710529253133101
716666533325211

Appendix D. Reinterview Survey Bias Reasons Summary (Six State Level).
Table 7. 1989 Cropland Bias by Reason
CroplandBias by Class
Total Definitional BiasTotal Estimating BiasTotal Other Bias
Total
Frequency
108169
81
358
ActualBias
(expanded)
2,137,279-128,975-106,833
1,901,471
AI::solutE,Bias
(expanded)
4,422,5731,914,0921,799,473
;:;,136,138
AverageAbs. Bias
(unexpanded)
1716297
102
AverageAbsolute Bias(unexpanded~
Definitional BiasIncluded acres from another operationProblem with include/exclude woods and waste.Did not report as of December 1.Problem determining 'in or out' of business.Included wild hay and/or pasture acres.Included rented out acres.Forgot hay, pasture, idle and/or abandoned acres.Didn't include acres rented.Forgot CRP acres and/or cover crop acres.I'roblem determining correct partnership data.Included ADM pasture acres.Didn't report for name on label.Reported total acres not crop acres.
&~timational BiasRespondent forgot a field or parcel of land.Respondent used records for correct answer.Respondent indicated figure was estimated.Rounding problem.Either answer was right.
QtheL BiasRespondent can't remember phone interview.R0~p0ndent thought they reported the first time.Respondent does not give accurate data on phone.Enumerator asked question wrong.Respondent added wrong.Respondent fatigue.Enumerator recorded wrong answer.Respondent reported for wrong year.Respondent can't hear on the phone.Respondent gave no explanation.Enumerator typing error on CATI.Fnumerator did not reconcile.Enumerator forgot to ask.
30
2 )
11111 1111 1
I
1h
3 J;~l
l' )2 3
.L7
1! 1
')
1 L
1 ()
33L
362354339189129105104100
503828249
117777111
7
15852161321046764605541363118
2

Appendix D. Reinterview Survey Bias Reasons Summary (Six State Level).
Table 8. 1989 Wheat Seeded Bias by Reason
winter Wheat SeededBias by Class
Total Definitional BiasTotal Estimating BiasTotal Other Bias
Total
Frequency
115531
97
ActualBias
(expanded)
63,847-117,357- 92,947
-146,457
AbsoluteBias
(expanded)
96,261193,659364,931
654,851
AverageAbs. Bias
(unexpanded)
552461
39
Definitional BiasIncluded acres from another operationDidn't report for name on label.Included acres rented out.Did not report as of December 1.Forgot CRP acres and/or cover crop acres.
Frequency
42113
AverageAbsolute Bias(unexpanded)
1136012104
Estimational BiasForgot a field or parcel of land.Used records for correct answer.Figure was estimated.Either answer was right.Rounding problem.
Other BiasRespondent added wrong.Respondent gave no explanation.Enumerator recorded wrong answer.Respondent does not give accurate data on phone.Respondent fatigue.Respondent was not asked question on the phone.Respondent can't remember phone interview.Respondent thought they reported the first time.Respondent reported for wrong year.Respondent did not think it was enough to report.Enumerator asked question wrong.Enumerator did not reconcile.
31
6 1218 31
21 1511 2
9 2
5 1566 852 802 463 402 301 223 191 162 151 102 3

Appendix D. Reinterview Survey Bias Reasons Summary (Six State Level).
Table 9. 1989 Corn Planted Bias by Reason
Corn PlantedBias by Class
Total Definitional BiasTotal Estimating BiasTotal Other Bias
Total
Frequency
3712962
228
ActualBias
(expanded)
511,777- 84,890
10,859
437,746
AL'o~ol utE~Bias
(expanded)
773,867416,227500,242
1,690,336
AverLlqeAbs. Bias
(unexpanded)
1181838
39
AverageAbsolute Bias
f re_ClIl':'Ll<::}l --L unexpan deenDefinitional BiasDidn't report for name on label.Included acres from another operationIncluded acres rented out.Didn't include rented acres.Problem determining 'in or out' of business.Did not report as of December 1.Forgot CRP acres and/or cover crop acres .Problem with include/exclude woods and waste.Included popcorn acres.
Estimational BiasForgot a field or parcel of land.Figure was estimated .Used records for correct answer.Rounding problem.Either answer was right.
other BiasRespondent can't hear on the phone.Respondent does not give accurate data on phone.Respondent thought they reported the first time.Respondent gave no explanation.Enumerator asked question wrong.EI"1"'0r:ltorrecorded wrong answer.Respondent gave wrong answer.Respondent fatigue.Respondent reported for wrong year.Enumerator forgot to ask.Respondent did not think it was enough to report.
2 52211 1585 109C) 64') 581 50.) 361 20l 8
1 L 37..~I, 2121 181 ') 92 J 4
1 190') 67" 78
1>1 496 36J 32
17 21'} 15
411
32

Appendix D. Reinterview Survey Bias Reasons Summary (Six state Level).
Table 10. 1989 Soybeans Planted Bias by Reason
SoybeansBias by Class Frequency
ActualBias
(expanded)
AbsoluteBias
(expanded)
AverageAbs. Bias
(unexpanded)-------------------------------------------------------------------------------Total Definitional BiasTotal Estimating BiasTotal Other Bias
31113
51
437,29143,972
-125,062
563,285417,816573,064
951762
-------------------------------------------------------------------------------Total 195 356,201 1,554,165 41
Definitional Bias
Didn't report for name on label.Included acres from another operationProblem determining 'in or out' of business.Didn't include acres rented.Included acres rented out.Problem with irrigated & non irrigated acres.Problem with include/exclude woods and waste.Forgot CRP acres and/or cover crop acres.
Estimational BiasForgot a field or parcel of land.Figure was estimated.Used records for correct answer.Rounding problem.Either answer was right.
Frequency
212
264311
1044191228
AverageAbsolute Bias(unexpanded)
593978339371932
39241310
3
other BiasRespondent gave no explanation. 7Enumerator recorded wrong answer. 3Respondent does not give accurate data on phone. 5Respondent thought they reported the first time. 5Enumerator asked question wrong. 2Respondent gave wrong answer. 14Respondent fatigue. 9Enumerator forgot to ask. 2Respondent can't hear on the phone. 1Enumerator did not reconcile. 2Respondent did not think it was enough to report. 1
33
1631099562523430261414
2

Appendix E. Reinterview Survey frequency of unexpilnded acreage biases.Zero biases are not included.
Table 1. 1988 Total land (Six States Combined)
Acres bias interval Obs. Percent
(1,000, 2,000] 1** 3 0.97( 750, 500] I 0 0.00( 500, 750] *** 6 1.95( 400, 500] * 1 0.32( 300, 400] ** 4 1. 30( 200, 300] *** 6 1.95( 100, 200] ********* 17 5.52( 90, 100] 0 0.00( 80, 90] ** 4 1.30( 70, 80] * 2 0.65( 60, 70] * 1 0.32( 50, 60] *** 6 1.95( 40, 50] ** 3 0.97( 30, 40] **** 7 2.27( 20, 30] ********* 18 5.84( 10, 20] ******* 13 4.22( 0, 10] *************** 30 9.74( -10, 0) ************************k***** 59 19.16( -20, -10] ************** 27 8.77( -30, -20] ****** 11 3.57( -40, -30] ****** 11 3.57( -50, -40] ******* 13 4.22( -60, -50] **** 8 2.60( -70, -60J * 1 0.32( -80, -70J ** 4 1.30( -90, -80] ** 3 0.97( -100, -90] ****** 11 3.57( -200, -100] *********** 22 7.14( -300, -200] ** 3 0.97( -400, -300] *** 5 1.62( -500, -400] ** 4 1.30( -750, -500] * 1 0.32(-1000, -750] * 1 0.32(-2000, -1000] ** 3 0.97
-----+----+----+----+----t----+10 20 30 40 ' ,() 60
FREQUENCY
34

Appendix E. Reinterview Survey frequency of unexpanded acreage biases.Zero biases not included.
Table 2. 1988 Cropland(Six States Combined}.
Acres bias interval Obs. Percent
(1,000, 2,000] 1* 1 0.26( 750, 1,000] * 1 0.26( 500, 750] *** 5 1.28( 400, 500] ** 3 0.77( 300, 400] *** 5 1.28( 200, 300] *** 6 1.54( 100, 200] ****** 12 3.08( 90, 100] ** 3 0.77( 80, 90] *** 6 1.54( 70, 80] *** 6 1.54( 60, 70] *** 6 1.54( 50, 60] *** 6 1.54( 40, 50] **** 8 2.05( 30, 40] **** 8 2.05( 20, 30] ******** 15 3.85( 10, 20] *************** 29 7.44( 0, 10] ***************************** 58 14.87( -10, 0) *********************************** 70 17.95( -20, -10] '***************** 34 8.72( -30, -20] 1******* 13 3.33( -40, -30] ******* 13 3.33( -50, -40] 1****** 11 2.82( -60, -50] 1**** 7 1.79( -70, -60] **** 7 1.79( -80, -70] '*** 5 1.28( -90, -80] 1** 4 1.03( -100, -90] 1***** 9 2.31( -200, -100] 1************ 23 5.90( -300, -200] 1*** 5 1.28( -400, -300] 1* 2 0.51( -500, -400] 1*** 5 1.28( -750, -500] 1* 2 0.51(-1000, -750] 1* 1 0.26(-2000, -1000] 1* 1 0.26I -----+----+----+----+----+----+----+
10 20 30 40 50 60 70
FREQUENCY
35

Appendix E. Reinterv iew Survey frequency of unexp,lI~dl'dacreage bi ases.Zero biases not included.
fClble 3. 1988 Winter wheat seeded (Six States Combined) .
Acres bias interval
300,200,100,
90,80,70,60,50,40,30,20,10,0,
-10,-20,-30,-40,-50,-60,-70,-80,-90,
-100,-200,-300,-400,
400]300]200]100]90]80]70]60]50]40]30]20]10]
0)-10]-20]-30J-40]-50]-60]-70]-80]-90]
-100]-200]-300]
I
1
1*1
1*1
1*1
1
1***1***'****1*****************'*********************************-********1**************1*****1****1***'***1**1*1
1*1*1
1*I
Obs Percent-------
0 0.000 0.001 0.930 0.001 0.93a 0.001 0.930 0.000 0.003 2.803 2.804 3.74
17 15.8942 39.2514 13.08
5 4.674 3.743 2.803 2.802 1.871 0.93a 0.001 O. ')J1 0.930 0.001 0.93
-----t----+----+----+----+----+---+----1--~ 10 15 20 25 30 35 40
FREQUENCY
36
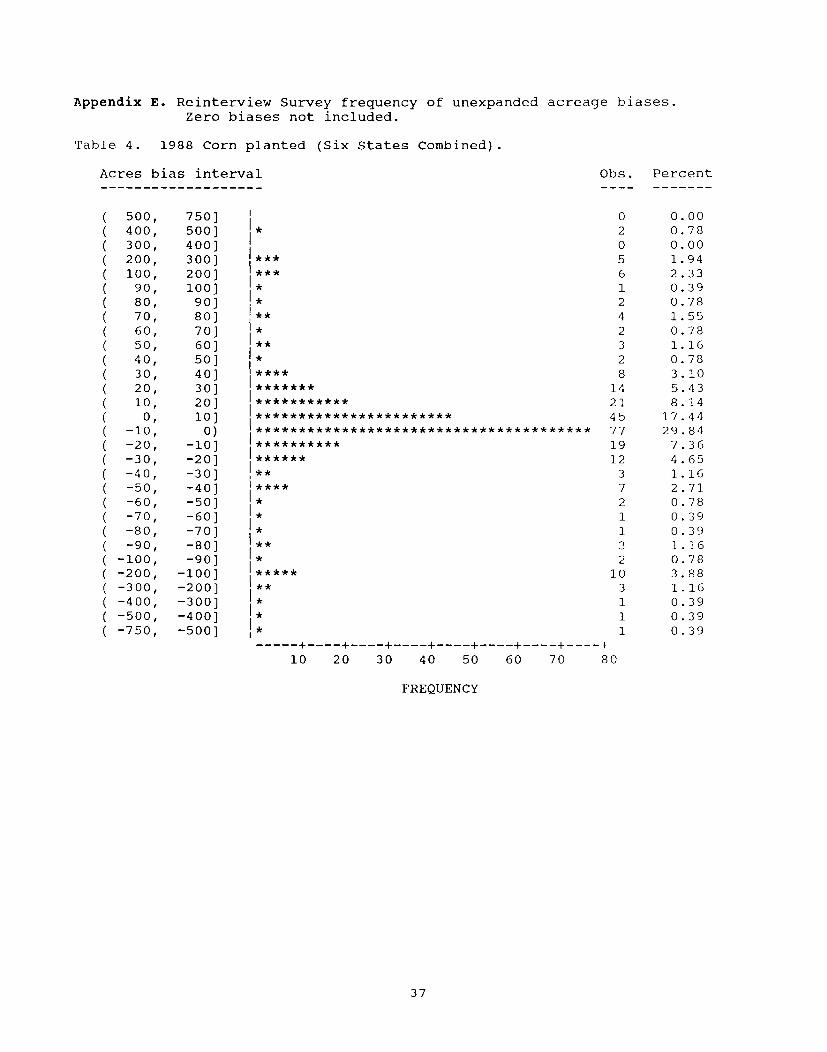
Appendix E. Reinterview Survey frequency of unexpanded acreage biases.Zero biases not included.
Table 4. 1988 Corn planted (Six States Combined).
Acres bias interval Obs. Percent
o2o561242328
1421457719123721132
103111
500,400,300,200,100,
90,80,70,60,50,40,30,20,10,
0,-10,-20,-30,-40,-50,-60,-70,-80,-90,
-100,-200,-300,-400,-500,-750,
750)500)400)300)200)100)90]80]70]60]50]40]30]20]10]
0)-10)-20]-30]-40]-50]-60]-70]-80]-90]
-100]-200]-300]-400]-500)
I
'*1
1***1***'*'*1**1*
'**1*1****'*******'***********'***********************11***************************************1**********,********1****
'*'*1*1**
'*'*****1**
'*'*1*I -----+----+----+----+----+----+----+----+10 20 30 40 50 60 70 80
FREQUENCY
37
0.000.780.001. 942.330.390.781. 550.781.160.783.105.438.14
17.4429.84
7.364.651.162.710.780.390.391.160.783.881.160.390.390.39

Appendix E. Reinterview Survey frequency of unexpanded acreage biases.Zero biases not included.
Table 5. 1988 Soybeans planted (Six States Combined).
Acres bias interval Obs. Percent
( 500, 750] 0 0.00( 400, 500] * 1 0.45( 300, 400] * 1 0.45( 200, 300] ** 3 1.34( 100, 200] *** 6 2.68( 90, 100] * 1 0.45( 80, 90) * 2 0.89( 70, 80) * 2 0.89( 60, 70) * 1 0.45( 50, 60) ***** 9 4.02( 40, 50) ** 4 1.79( 30, 40) *** 5 2.23( 20, 30) **** 7 3.12( 10, 20] ********** 19 8.48( 0, 10) ********************* 42 18.75( -10, 0) ********************************* 65 29.02( -20, -10) ********* 18 8.04( -30, -20] ***** 9 4.02( -40, -30) ** 4 1.79( -50, -40) ** 4 1.79( -60, -50) * 2 0.89( -70, -60) * 1 0.45( -80, -70) ** 4 1.79( -90, -80) ** 3 1.34( -100, -90] * 1 0.45( -200, -100] **** 7 3.12( -300, -200] * 1 0.45( -400, -300] * 1 0.45( -500, -400] 0 0.00( -750, -500] * 1 0.45
-----+----+----+----+----+----+---10 20 30 40 50 60
FREQUENCY
38

Appendix E. Reinterview Survey frequency of unexpanded acreage biases.Zero biases not included.
Table 6. 1989 Total land (Six States Combined).
Acres bias interval Obs. Percent
(1,000,( 750,( 500,( 400,( 300,( 200,( 100,( 90,( 80,( 70,( 60,( 50,( 40,( 30,( 20,( 10,( 0,( -10,( -20,( -30,( -40,( -50,( -60,( -70,( -80,( -90,( -100,( -200,( -300,( -400,( -500,( -750,(-1000,(-2000,
2,000]1,000]
750]500]400]300]200]100]90]80]70]60]50]40]30]20]10]
0)-10]-20]-30]-40]-50]-60]-70]-80]-90J
-100]-200]-300J-400 J-500]-750J
-1000J
II *****1****1******1***
II**********1:*******
'**1*1***'****II***************
II*************************
'*******************************1'********************************************************************************************************************************************************************
54423
1081213487
131231452117101452316
13964224
1. 771. 421. 420.711. 063.552.840.350.710.351. 061. 422.842.484.614.26
10.9915.96
7.456.033.554.961. 770.711. 060.352.134.613.192.131. 420.710.711. 42
-----+----+----+----+----+----+----+----+----+5 10 15 20 25 30 35 40 45
FREQUENCY
39

Appendix E. Reinterview Survey frequency of unexpanded acreage biases.Zero biases not included.
Table 7. 1989 Cropland (Six states Combined).
Acres bias interval Obs. Percent
(1,000, 2,000] ** 3 0.84( 750, 1,000] * 2 0.56( 500, 750] **** 8 2.23( 400, 500] * 2 0.56( 300, 400 ] 1** 4 1.12( 200, 300] 1***** 10 2.79
I
( 100, 200] '*********** 22 6.15( 90, 100] 1 0 0.00( 80, 90] 1*** 5 1.40
I( 70, 80] '*** 5 1.40
I( 60, 70] '** 3 0.84( 50, 60] 1*** 5 1.40( 40, 50] 1**** 8 2.23( 30, 40] 1******* 13 3.63( 20, 30] 1*********** 22 6.15( 10, 20] 1*********** 21 5.87( 0, 10] 1***************** 33 9.22( -10, 0) *********************************** 70 19.55( -20, -10] ********** 20 5.59( -30, -20] ******* 13 3.63( -40, -30] **,*** 10 2.79( -50, -40] ******** 16 4.47( -60, -50] ***** 9 2.51( -70, -60] * 2 0.56( -80, -70] *** 6 1.68( -90, -80] ** 3 0.84( -100, -90] 1**** 8 2.23( -200, -100] 1********** 19 5.31( -300, -200] 1*** 5 1.40( -400, -300] 1** 4 1.12( -500, -400] 1* 2 0.56( -750, -500] 1* 2 0.56(-1000, -750] 1* 1 0.28(-2000, -1000] 1* 2 0.56
I -----+----+----+----+----i----+----+10 20 30 40 ~)(I 60 70
FREQUENCY
40

Appendix E. Reinterview Survey frequency of unexpanded acreage biases.Zero biases not included.
Table 8. 1989 winter wheat seeded (Six States Combined) .
Acres bias interval Obs. Percent------------------- -------
( 500, 750] I 0 0.00,( 400, 500] 1**
0 0.00( 300, 400] 2 2.06( 200, 300]
,a 0.00
( 100, 200] 1* 1 1.03( 80, 90] 1* 1 1.03( 80, 70] I a 0.00( 60, 70] 1* 1 1.03( 50, 60] '** 2 2.06( 40, 50] 1 0 0.00( 30, 40] '* 1 1.03( 20, 30] '*** 3 3.09( 10, 20] '********* 9 9.28( 0, 10] '*************** 15 15.46( -10, 0) 1*********************************** 35 36.08( -20, -10] 1******** 8 8.25( -30, -20] ,***** 5 5.15( -40, -30]
1***a 0.00
( -50, -40] 3 3.09( -60, -50] '** 2 2.06( -70, -60J 1* 1 1.03( -80, -70]
,a 0.00
( -90, -80] 1* 1 1.03( -100, -90] 1** 2 2.06( -200, -100] 1*** 3 3.09( -300, -200J 1 a 0.00( -400, -300J '* 1 1.03( -500, -400] 1 0 0.00( -750, -500J ,* 1 1.03I -----+----+----+----+----+----+----+
5 10 15 20 25 30 35
FREQUENCY
41

Appendix E. Reinterview Survey frequency of unexpanded acreage biases.Zero biases not included.
Table 9. 1989 Corn planted (Six States Combined).
Acres bias interval Obs. Percent
( 500,( 400,( 300,( 200,( 100,( 90,( 80,( 70,( 60,( 50,( 40,( 30,( 20,( 10,( 0,( -10,( -20,( -30,( -40,( -50,( -60,( -70,( -80,( -90,( -100,( -200,( -300,( -400,( -500,( -750,
750 ]500]400]300J200J100J
90J80J70]60]50J40J30J20J10J
0)-10J-20]-30]-40J-50J-60J-70J-80]-90J
-100J-200J-300}-400'-500-
1*1*1**1**'****1*1*1*1*1****1*1***1*****'*********1************************1*********************************1*********1****1**1****1**1**1
,
i*****
*-----+----+----+----+----t----+---10 20 30 40 50 60
FREQUENCY
42
1133821217259
1748651884833o116ooo1
0.440.441. 321. 323.510.880.440.880.443.070.882.193.957.46
21.0528.51
7.893.511. 753.511. 321. 320.000.440.442.630.000.000.000.44

Appendix E. Reinterview Survey frequency of unexpanded acreage biases.Zero biases not included.
Table 10. 1989 Soybeans planted (Six States Combined).
Acres bias interval Obs. Percent
o2o11922o26
1156
1445506954422a331ooo1
( 750,( 500,( 400,( 300,( 200,( 100,( 90,( 80,( 70,( 60,( 50,( 40,( 30,( 20,( 10,( 0,( -10,( -20,( -30,( -40,( -50,( -60,( -70,( -80,( -90,( -100,( -200,( -300,( -400,( -500,( -750,(-1000,
1,000]750]500]400]300]200]100]90]80]70]60]50]40]30]20]10]
0)-10]-20]-30]-40]-50]-60]-70]-80]-90]
-100]-200J-300J-400]-500]-750J
I
1*1
'*1*1*****1*,*1*1***1******1******
'*******1***********************1
1
****************************
1*****1***1**1:*1*I1**1**1*III
'*I -----+----+----+----+----+10 20 30 40 50
FREQUENCY
43
0.001. 020.000.510.514.591. 021. 020.001. 023.065.612.553.067.14
22.9625.51
3.064.592.552.042.041. 021. 020.001. 531. 530.510.000.000.000.51

Appendix F. Bias estimates for harvested acreage and production.
1988 1989Actual ~ i\ctual %0
Crop Bias Bias Bias BiasCorn Harvested (acres) (acres)Indiana -90,817 -1.7 196,083 3.9Iowa 60,543 1.1 163,824 2.6Minnesota -65,649 -1.7 -,E2 ,7 56 -1.9Nebraska 4,685 0.1 ]10,713 1.9Ohio -21,451 -0.7 96,157 3.7Pennsylvania -37,010 -7.2 3,795 0.5Total -149,698 -0.6 "87 ,8 16 2.0
Soybeans HarvestedIndiana -54,143 -1.3 ;~48 ,6 17 5.5Iowa -4,791 -0.1 62,648 1.5Minnesota -117,530 -3.2 --GO,028 -1. 5Nebraska -12,079 -0.6 50,729 2.5Ohio 110,631 3.1 "i9,300 1.7Pennsylvania -22,651 -10.4 -1,145 -0.5Total -100,573 -0.6 ~(JO,120 2. °Corn Production (bushels) (bushels)Indiana -12,746,620 -2.8 61,4:)3,967 9.1Iowa 2,384,778 0.5 ?? ,1G4 ,57 5 3.2Minnesota -12,993,243 -5.3 -4 ,'I 37 ,°2 6 -0.9Nebraska 11,401,035 1.6 18 ,'~36, 17 7 2.9Ohio -3,408,086 -1. 5 1:>,"28,117 4.5Pennsylvania -2,228,676 -5.9 1,11'i':, ,214 2.7Total -17,590,811 -0.8 11 :3,I0 1 ,°2 3 3.8
Soybean ProductionIndiana 1,467,079 1.3 7,1317,026 5.1Iowa 1,550,415 1.2 :l,:)59 ,3 11 2.2Minnesota -4,516,003 -5.1 -2,'}65,092 -2.2Nebraska -715,861 -1.1 .;G2 ,9 16 0.7Ohio 3,397,644 3.4 :>,;71,541 3.2Pennsylvania -919,327 -12.5 ',69,624 7.9Total 263,947 0.1 12 ,1-, 15 ,32 6 2.0
44