Embed Size (px)
Citation preview

For professional investors and advisers only. This material is not suitable for retail clients
Responding to the DC
investment challenge Schroders Defined Contribution
Conference 2016
Peter Weidner, Head of Advanced Beta
Remi Olu-Pitan, Fund Manager Multi-Asset
Ugo Montrucchio, Fund Manager Multi-Asset
@SchroderPension

Value of savings
The DC journey Gradual transition from working life to retirement
1
Source: Schroders, for illustration only
20/05/2016 10:39:31
Stable
growth Transition
to retirement
Time
Late retirement Growth
Normal retirement age
Early in retirement
Members can afford to take
on more risk
Investment returns and
risk become the dominant
factor
Focus on protecting
value

Responding to the DC
investment challenge
Growth phase
Peter Weidner, Head of Advanced Beta

What is ‘smart beta’? Many names…
Smart beta Alternative beta
Scientific beta
Alternative Beta Advanced beta Factor investing
3

What attracts investors to smart beta?
4
Source: MSCI, Morningstar. Gross total return in USD for the period of 31 December 1995 to 31 December 2015
20/05/2016 10:39:31
MSCI World
Minimum volatility
Value
Quality
Risk-weighted
Equal-weighted
Momentum
6.0%
9.0%
12.0%
11.0% 15.0% 19.0%
Annualised risk
Annualised return
High return and low risk
Low return and low risk
High return and high risk
Low return and high risk

Common pitfalls with smart beta investing Issues to watch out for
5
Source: Schroders, for illustration only
20/05/2016 10:39:31
Individual factor returns can be
highly cyclical
Uncontrolled scale may lead to poor
factor exposure and
uncompensated risks
Risk management
Products are designed for mass
market appeal
Investment guidelines are seldom
revised once they are in the public
domain
Implementation
Onus is placed on investors to
choose which factor(s) resonate
with their own investment views
Governance

A given factor can be implemented in many
different ways
– Fama-French factors are not investible and rely
heavily on small cap stocks
– Leading index factors are massively investible and
rely heavily on large cap stocks
“Value” portfolios can contain more or less value
depending on construction and intended capacity
– Three MSCI value indices: moderately correlated
active returns, very different cumulative returns
Not all factor portfolios are created equal Factors can be generic; however, investments are specific
6
Source: Schroders, Bloomberg, 31 December 2015
0
50
100
150
200
250
300
Dec-9
7
Oct-
98
Aug
-99
Ju
n-0
0
Apr-
01
Feb-0
2
Dec-0
2
Oct-
03
Aug
-04
Ju
n-0
5
Apr-
06
Feb-0
7
Dec-0
7
Oct-
08
Aug
-09
Ju
n-1
0
Apr-
11
Feb-1
2
Dec-1
2
Oct-
13
Aug
-14
Ju
n-1
5
ACWI ENHANCED VALUE Standard (Large+Mid Cap) Enhanced Value
ACWI PRIME VALUE Standard (Large+Mid Cap) Prime Value
ACWI VALUE WEIGHTED Standard (Large+Mid Cap) Value Weighted
Total active returns compared to MSCI ACWI

EVOLUTION
Incorporate latest academic and
proprietary research to ensure
strategies evolve with markets
Continuously monitor factors to
ensure portfolios reflect best ideas
ACCESS
Utilise style investing insights to
manage market risks
Minimise unintended risk
exposures to enhance risk-adjusted
returns
SOLUTIONS
Use advanced beta strategies as
building blocks within portfolios or
for the creation of new, stand-alone
solutions for client
Schroders advanced beta Our core competencies
7
Source: Schroders

Putting it all together Designing a solution to achieve equity-like returns, but with lower risk
Source: Schroders, 31 March 2016. For illustration only. *Inception date of sample portfolio is 21 November 2014. ‘Since inception’ performance data is for the period 21 November 2014 to 31 March
2016 and is stated in GBP. Benchmark MSCI AC World (NDR) TL. Portfolio is a segregated multi-factor portfolio managed for a UK Insurance client
8
Asset allocation
Value Quality Low Volatility Size
Performance (since inception) Portfolio* Benchmark
Annualised return 7.1% 3.5%
Volatility 12.0% 14.6%
Maximum drawdown -9.3% -10.9%
Portfolio characteristics Portfolio* Benchmark
Dividend yield 3.0% 2.7%
Return on equity 26.6% 20.7%
Price to earnings 16.8 18.5
Price to book 2.2 2.0

Responding to the DC
investment challenge
Stable growth phase
Remi Olu-Pitan, Fund Manager Multi-Asset

Returns matter in the stable growth phase Investment returns and risk become the dominant factor
Source: Schroders, for illustration only. 40 year contributions at base contribution rate of 10% of salary. Salary increases assumed to be 3% p.a. Starting salary is £25,000. Base annual investment
returns are estimated expected returns of a lifestyling strategy switching from equities to bonds and cash in the 10 years prior to retirement
0%
2%
4%
6%
8%
10%
12%
14%
16%
18%
20%
First 20 years Second 20 years
1% increase in contribution rate 1% increase in investment return
% Increase in final pot
Early years: Increasing contributions and
investment returns have similar effect
Later years: Investment returns much
more important
10

Equities Deliver the returns…but beware of the adverse outcomes
11
Source: Schroders, Robert Shiller. Data shows 20 year rolling annualised returns from 1871 to 2016. Equities represent the S&P 500 Index
0
2
4
6
8
10
12
14
16
18
20
1891 1899 1908 1916 1924 1933 1941 1949 1958 1966 1974 1983 1991 1999 2008 2016
Rolling annualised 20Y return to equities
145-year average: 9% per annum
Best 20 year period: 18% per annum
Worst 20 year period: 2% per annum

Diversify Asset classes perform at different times…but correlations are unstable
12
Source: Schroders, Datastream, 31 December 2015. Equity: MSCI AC World Total Return Index, Property: UK IPD Index, Hedge Funds: HFRI Funds of Funds Composite Total Return Index,
Cash: 3 month Sterling LIBOR, Credit: Barclays Global High Yield Index, Govts: Barclays Global Treasury Index; Property: UK IPD Index; Commods: Bloomberg Commodity Index; EMD:
JPM GBI-EM Composite Index; ILS: Swiss Re Cat Bond Index. All show total return either in local currency or currency of denomination
20/05/2016 10:39:31
2003 2004 2005 2006 2007 2008 2009 2010 2011 2012 2013 2014 2015
Equity
26.40% Property
18.90%
Commods
21.40%
Property
18.10%
Commods
16.20%
Govts
10.20%
Credit
46.80%
Commods
16.80%
Property
8.10%
Equity
16.50%
Equity
26.20%
Property
19.30%
Property
7.59%
Credit
24.10% Equity
12.00%
Property
18.80%
Equity
17.00%
ILS
15.70%
EMD
10.20%
Equity
30.00%
Property
14.50%
EMD
6.40%
EMD
14.10%
ILS
11.40%
Equity
9.90% ILS
4.45%
Commods
23.90% Govts
10.30%
Equity
17.40%
ILS
12.30%
Govts
10.60%
Cash
5.50%
Commods
18.90%
Credit
12.30%
Govts
6.30%
ILS
10.50%
Property
10.90%
EMD
8.70%
EMD
3.39%
Govts
14.80% EMD
10.20% EMD
10.00%
Hedge
Funds
10.40%
Hedge
Funds
10.30%
ILS
2.30%
ILS
13.90%
ILS
11.30%
ILS
3.30% Credit
9.60%
Hedge
Funds
9.00%
ILS
6.30% Cash
0.50%
Hedge Funds
11.60%
Commods
9.10%
Hedge
Funds
7.50%
EMD
7.40%
Equity
7.70%
Hedge
Funds
-21.40%
Hedge
Funds
11.50%
Equity
11.10%
Cash
0.90%
Hedge
Funds
4.80%
EMD
0.90%
Hedge
Funds
3.40%
Equity
0.15%
Property
11.20%
Hedge
Funds
6.90%
Cash
4.70%
Govts
6.40%
Cash
6.00%
Property
-22.50%
EMD
6.70%
EMD
9.70%
Credit
-5.00% Property
2.40%
Cash
0.50% Cash
0.50%
Hedge
Funds
-0.23%
EMD
7.20% ILS
6.40%
ILS
1.50%
Cash
4.90%
EMD
5.50% Credit
-35.10% Govts
2.60%
Govts
5.90%
Hedge
Funds
-5.70%
Govts
1.80% Credit
-2.00%
Govts
-0.80%
Govts
-2.13%
ILS
7.10% Cash
4.70%
Credit
-3.90%
Credit
2.70%
Property
-5.50%
Commods
-35.60%
Property
2.20%
Hedge
Funds
5.70%
Equity
-6.00%
Cash
0.80% Govts
-4.30% Credit
-3.90% Credit
-7.62%
Cash
3.70% Credit
2.70%
Govts
-6.70%
Commods
2.10%
Credit
-7.60%
Equity
-39.20%
Cash
1.20%
Cash
0.70%
Commods
-13.30%
Commods
-1.10%
Commods
-9.50%
Commods
-17.00%
Commods
-24.66%
Best performing asset class
Worse performing asset class

Recovery
Output below trend,
Growth accelerating,
Inflation falling
Expansion
Output above trend,
Growth accelerating,
Inflation rising
Slow-down
Output above trend,
Growth decelerating,
Inflation rising
Recession
Output below trend,
Growth decelerating,
Inflation falling
Our approach to dynamic asset allocation Different assets to cope with different economic environments
13
Source: Schroders, for illustration only. Average length of full cycle is about 5 – 6 years
20/05/2016 10:39:31
Adjust asset class exposure over the economic cycle
Equity
Property
Infrastructure
Private Equity
High Yield
Equity Long Short
Hedge Funds
Commodities
Private Equity
Property
Equity
Event Driven Hedge Funds
Cash
Government Bonds
Commodities
CTA Hedge Funds
High Yield
Private Equity
Equity
Investment Grade
Global Macro Hedge Funds
Output (GDP)

50
100
150
200
250
300
350
1991 1994 1997 2000 2003 2006 2009 2012 2015
Real commodity prices
Our approach to dynamic asset allocation Valuations matter
14
Source: Bloomberg, Schroders, 31 March 2016. DJUBS Commodities Total Return deflated by US Core CPI, rebased to 31 January 1991 = 100. Sectors and securities are mentioned for illustrative
purposes only and should not be viewed as a recommendation to buy/sell
Real price, 31 January 1991 = 100
Valuations became stretched
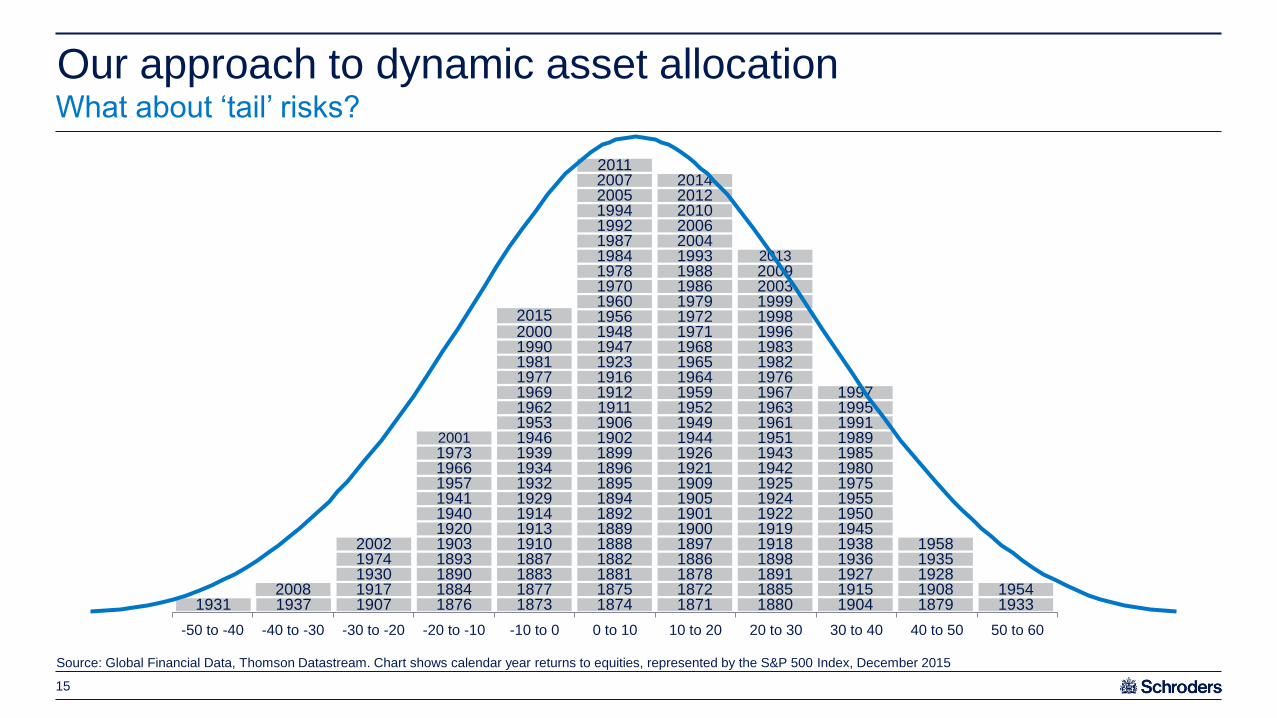
-50 to -40 -40 to -30 -30 to -20 -20 to -10 -10 to 0 0 to 10 10 to 20 20 to 30 30 to 40 40 to 50 50 to 60
2015
2013
Our approach to dynamic asset allocation
1931 1937 1907 1876 1873 1874 1871 1880 1904 1879 1933 2008 1917 1884 1877 1875 1872 1885 1915 1908 1954
1930 1890 1883 1881 1878 1891 1927 1928 1974 1893 1887 1882 1886 1898 1936 1935 2002 1903 1910 1888 1897 1918 1938 1958
1920 1913 1889 1900 1919 1945 1940 1914 1892 1901 1922 1950 1941 1929 1894 1905 1924 1955 1957 1932 1895 1909 1925 1975 1966 1934 1896 1921 1942 1980 1973 1939 1899 1926 1943 1985 2001 1946 1902 1944 1951 1989
1953 1906 1949 1961 1991 1962 1911 1952 1963 1995 1969 1912 1959 1967 1997 1977 1916 1964 1976 1981 1923 1965 1982 1990 1947 1968 1983 2000 1948 1971 1996
1956 1972 1998 1960 1979 1999 1970 1986 2003 1978 1988 2009 1984 1993 1987 2004 1992 2006 1994 2010 2005 2012 2007 2014 2011
Source: Global Financial Data, Thomson Datastream. Chart shows calendar year returns to equities, represented by the S&P 500 Index, December 2015
What about ‘tail’ risks?
15

Our approach to dynamic asset allocation Consider a range of scenarios and their respective probabilities
-2.0
-1.5
-1.0
-0.5
0.0
0.5
1.0
1.5
2.0
-2.0 -1.5 -1.0 -0.5 0.0 0.5 1.0 1.5 2.0
US recession
China hard landing
EM defaults
emerge
US wages accelerate
Global reflation Baseline
Currency wars return
Source: Schroders. 29 February 2016 forecast. Baseline 2016 forecast 2.4% growth and 3.9% inflation. The opinions stated in this document include some forecasted views. We believe that we are
basing our expectations and beliefs on reasonable assumptions within the bounds of what we currently know. However, there is no guarantee that any forecasts or opinions will be realised
Stagflationary Reflationary
Productivity boost Deflationary
2016 inflation vs baseline forecast
2016 growth vs baseline forecast
16
OPEC cuts oil production

Our investment objective has two key
elements
A target return objective – UK inflation
(CPI) + 4% per annum
A volatility objective – 1/2 to 2/3 volatility
of global equities
We aim to achieve this objective through:
Diversification
Dynamic asset allocation
Downside risk management
Schroder Life Dynamic Multi-Asset Fund An alternative to equities for the stable growth phase
17
Source: Schroders, May 2016. *The return and maximum loss targets are investment objectives only and not guaranteed
Return target
Cash
Fixed income
Schroder Life
Dynamic
Multi-Asset Fund
“Balanced” fund
Superior risk adjusted returns
Equities

Responding to the DC
investment challenge
Transition into retirement
Ugo Montrucchio, Fund Manager Multi-Asset

‘There is no free lunch, but diversification offers a cheap one’. Financial Times (February 2015)
The case for diversification A precious tool when approaching retirement
19
Source: Bank of America, Schroders, May 2016
20/05/2016 10:39:31
Diversification can experience drawbacks:
Limited by the restrictive nature of asset classes
Value agnostic and may not protect against systemic shocks
Diversified … … not so diversified
BoA UK Gilt Index FTSE 100 Index BoA UK Gilt Index FTSE 100 Index
Capital weight Risk weight

Investors approaching retirement are confronted with two key challenges:
Increasingly challenging to assess safety Asset classes may be deceptive
Hunt for yield: The ongoing financial repression has modified investors’ risk preferences
Volatility: The steady rise blurs the defensive appeal provided by certain asset classes
20
Source: Barclays Capital, Schroders, 3 May 2016. Volatility is calculated using a 1Y rolling window, Nominal yield uses semi-annual convention
20/05/2016 10:39:29
1%
2%
3%
4%
5%
6%
2%
3%
4%
5%
6%
7%
8%
9%
10%
Apr-
01
Apr-
02
Apr-
03
Apr-
04
Apr-
05
Apr-
06
Apr-
07
Apr-
08
Apr-
09
Apr-
10
Apr-
11
Apr-
12
Apr-
13
Apr-
14
Apr-
15
Apr-
16
Gilts volatility [LHS] Nominal Yield [RHS]

Better to think in terms of regimes Identify key sources of return
Focus on the drivers of risk and performance - from asset classes to risk premia
21
Source: Schroders, for illustration only
20/05/2016 10:39:31
Slowdown Growth Inflation
Government bonds
Low yielding currencies
Equities
Credit spreads
Commodities
Inflation-linked bonds
Property

When diversification fails… … a likely scenario?
Years of accommodative monetary policies may have increased the likelihood of tail events moving forward
22
Source: Schroders, BoA, Bloomberg, 3 May 2016. 160 day rolling correlation is calculated using FTSE 100 and BoA UK gilt index returns
20/05/2016 10:39:29
-1
-0.8
-0.6
-0.4
-0.2
0
0.2
0.4
May-0
6
De
c-0
6
Ju
l-0
7
Fe
b-0
8
Se
p-0
8
Ap
r-0
9
No
v-0
9
Ju
n-1
0
Ja
n-1
1
Au
g-1
1
Ma
r-1
2
Oct-
12
Ma
y-1
3
De
c-1
3
Ju
l-1
4
Fe
b-1
5
Se
p-1
5
Ap
r-1
6
60 day equity/bonds correlation1

Rely on the ability of a talented manager to
navigate through the evolving phases of a
business cycle
At which point should insurance be
considered?
How can we protect against a ‘diversification failure’? We can’t fully, but tools exist to help us manage it better
23
Source: Schroders, for illustration only. 1Simulations is based on constant return assumptions for equities/bonds/cash and a glide-path designed to completely disinvest from equities by age 65
20/05/2016 10:39:31
Impact of capital loss is more severe for investors approaching
retirement and rebuilding savings is challenging
Time can help mitigate the incidence of losses to capital
accumulation1
Use a long-term approach to investing Skill
Buy some form of protection
0
50
100
150
200
250
300
350
400
450
25 29 33 37 41 45 49 53 57 61 65
Age
Scenario B: 20% capital loss realised at 55 years
Scenario A: 20% capital loss realised at 35 years
Account size (£,000)
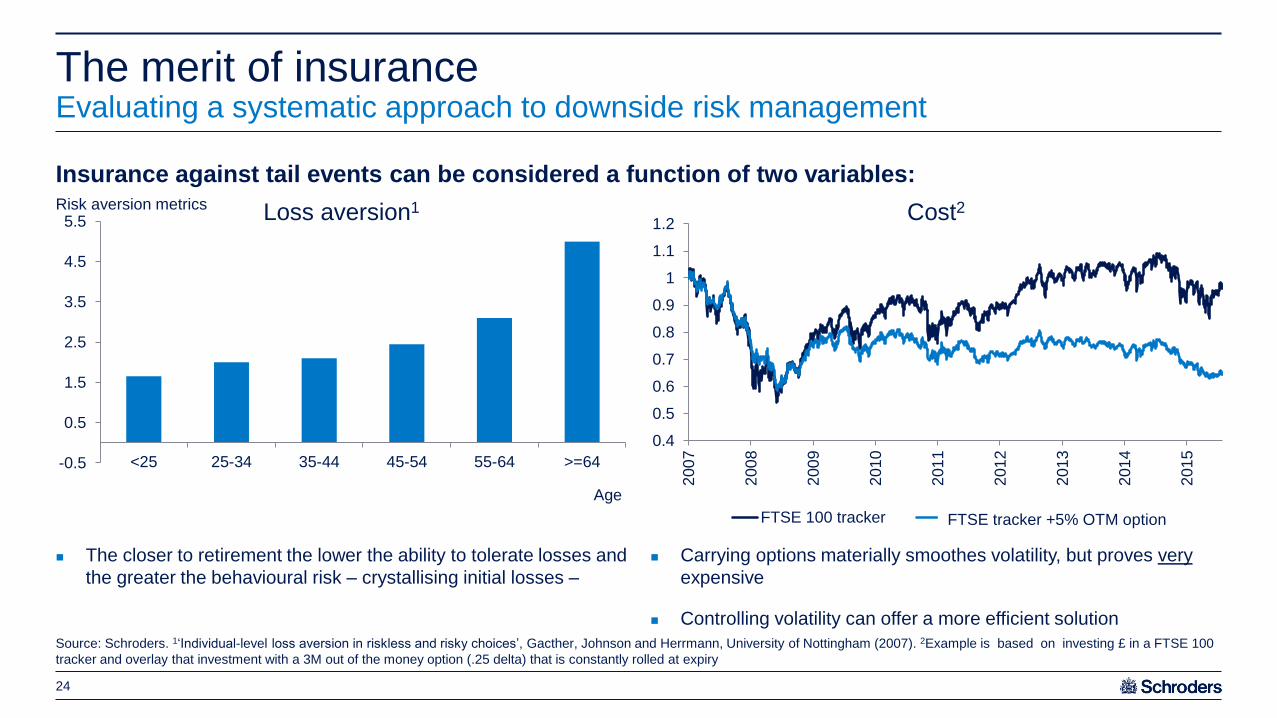
The closer to retirement the lower the ability to tolerate losses and
the greater the behavioural risk – crystallising initial losses –
Carrying options materially smoothes volatility, but proves very
expensive
Controlling volatility can offer a more efficient solution
Loss aversion1 Cost2
The merit of insurance Evaluating a systematic approach to downside risk management
24
Source: Schroders. 1‘Individual-level loss aversion in riskless and risky choices’, Gacther, Johnson and Herrmann, University of Nottingham (2007). 2Example is based on investing £ in a FTSE 100
tracker and overlay that investment with a 3M out of the money option (.25 delta) that is constantly rolled at expiry
20/05/2016 10:39:29
Insurance against tail events can be considered a function of two variables:
-0.5
0.5
1.5
2.5
3.5
4.5
5.5
<25 25-34 35-44 45-54 55-64 >=64
Age
0.4
0.5
0.6
0.7
0.8
0.9
1
1.1
1.2
200
7
200
8
200
9
201
0
201
1
201
2
201
3
201
4
201
5
FTSE 100 tracker Ftse tracker + 5% OTM optionFTSE tracker +5% OTM option
Risk aversion metrics

Conclusion Factors to keep in mind as we approach retirement
20/
05/
20
16
10:
39:
31
Diversification remains important – irrespective of the stage of our journey
to retirement
A critical evaluation of asset classes is key – think of how our
investments will evolve through the cycle
Downside risk management can be valuable – sensible implementation
can make a difference
25

For professional investors and advisers only. This material is not suitable for retail clients.
Past performance is not a guide to future performance and may not be repeated. The value of investments and the income from them may go down as well as
up and investors may not get back the amount originally invested.
This presentation is intended to be for information purposes only and it is not intended as promotional material in any respect. The material is not intended as an offer or
solicitation for the purchase or sale of any financial instrument. The material is not intended to provide, and should not be relied on for, accounting, legal or tax advice, or
investment recommendations. Information herein is believed to be reliable but Schroders does not warrant its completeness or accuracy. No responsibility can be accepted
for errors of fact or opinion. The data has been sourced by Schroders and should be independently verified before further publication or use. No responsibility can be
accepted for error of fact or opinion. This does not exclude or restrict any duty or liability that Schroders has to its customers under the Financial Services and Markets Act
2000 (as amended from time to time) or any other regulatory system.
The forecasts included in this presentation should not be relied upon, are not guaranteed and are provided only as at the date of issue. Our forecasts are based on our own
assumptions which may change. We accept no responsibility for any errors of fact or opinion and assume no obligation to provide you with any changes to our assumptions
or forecasts. Forecasts and assumptions may be affected by external economic or other factors.
Schroder Life Dynamic Multi-Asset Fund: Where a fund holds investments denominated in currencies other than sterling investors should note that exchange rates may
cause the value of these investments, and the income from them, to rise or fall. Investors should be aware that the fund may invest in derivatives and in alternative
investments (hedge funds, property funds and private equity) which involve an above-average degree of risk and can be more volatile than investment in equities or bonds.
The fund is not tied to replicating a benchmark and holdings can therefore vary from those in the index quoted. For this reason the comparison index should be used for
reference only. Funds which invest in a smaller number of stocks can carry more risk than funds spread across a larger number of companies.
Third party data is owned or licensed by the data provider and may not be reproduced or extracted and used for any other purpose without the data provider's consent.
Third party data is provided without any warranties of any kind. The data provider and issuer of the document shall have no liability in connection with the third party data.
The Prospectus and/or www.schroders.com contains additional disclaimers which apply to the third party data. Exchange Plc and The Financial Times Limited and is used
by FTSE International Limited under licence. All rights in the FTSE indices and / or FTSE ratings vest in FTSE and/or its licensors. Neither FTSE nor its licensors accept any
liability for any errors or omissions in the FTSE indices and / or FTSE ratings or underlying data. No further distribution of FTSE Data is permitted without FTSE’s express
written consent.
Issued in May 2016 by Schroder Investment Management Limited, 31 Gresham Street, London EC2V 7QA. Registered No: 1893220 England. Authorised and regulated by
the Financial Conduct Authority. INS04828
Important information
26
20/05/2016 10:39:32