Embed Size (px)
Citation preview
1
Responding to Cultural Diversity: Approaches and Alternatives
January 24, 2008
Paula DeCoito, Ph.D.The Social Planning Council of Peel
A Presentation Prepared for the Newcomer Organizations Network (NCON)
For Peel, Halton and Dufferin
2
Cultural Diversityin the Voluntary Sector
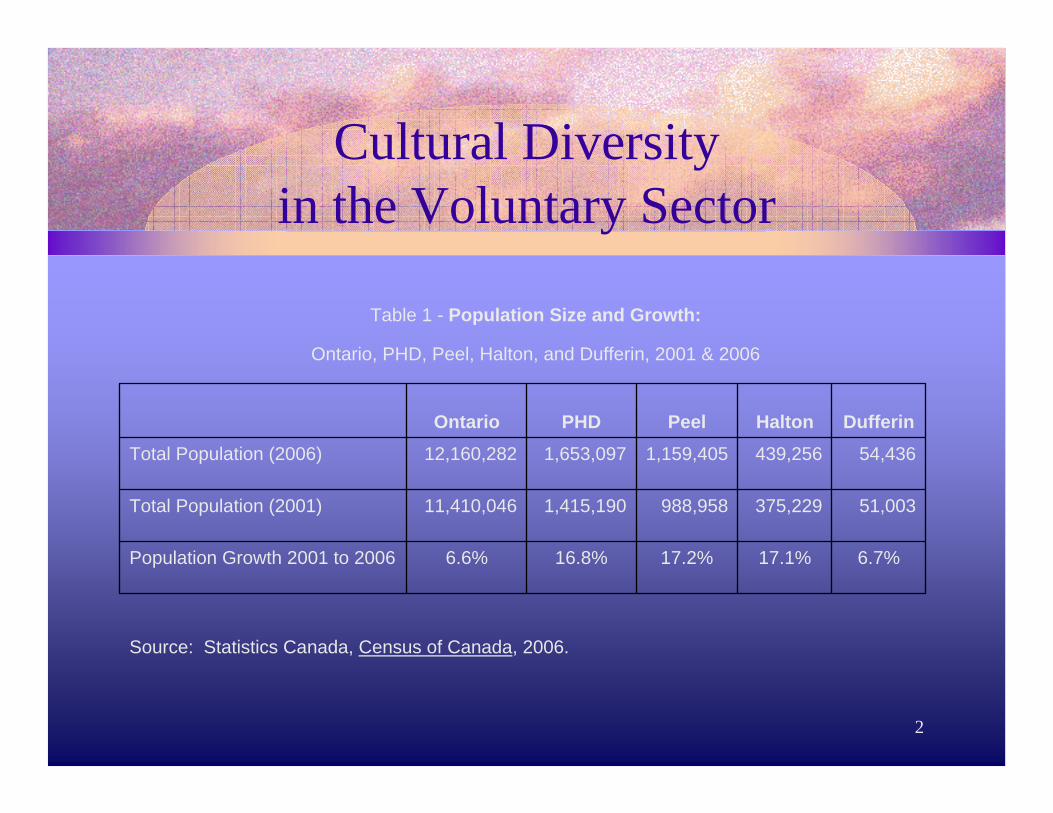
Table 1 - Population Size and Growth:
Ontario, PHD, Peel, Halton, and Dufferin, 2001 & 2006
Source: Statistics Canada, Census of Canada, 2006.
6.7%17.1%17.2%16.8%6.6%Population Growth 2001 to 2006
51,003375,229988,9581,415,19011,410,046Total Population (2001)
54,436439,2561,159,4051,653,09712,160,282Total Population (2006)
DufferinHaltonPeelPHDOntario
3
Cultural Diversityin the Voluntary Sector
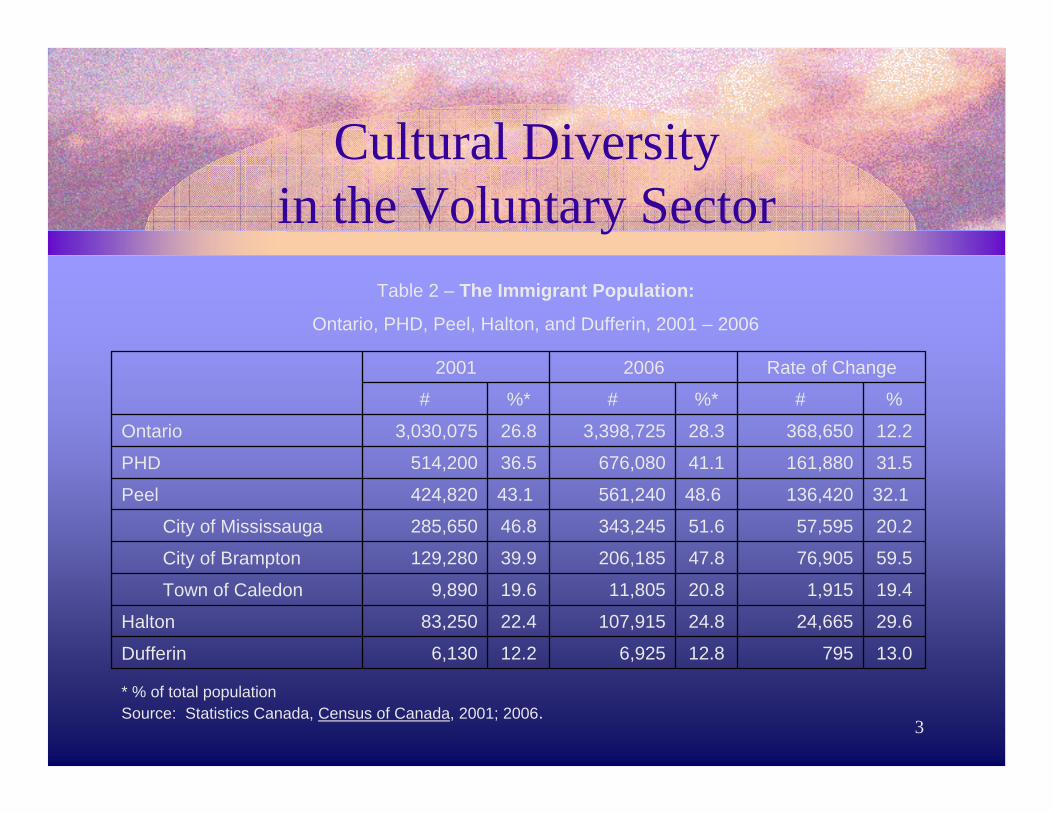
Table 2 – The Immigrant Population:
Ontario, PHD, Peel, Halton, and Dufferin, 2001 – 2006
* % of total populationSource: Statistics Canada, Census of Canada, 2001; 2006.
13.079512.86,92512.26,130Dufferin
29.624,66524.8107,91522.483,250Halton
19.41,91520.811,80519.69,890Town of Caledon
59.576,90547.8206,18539.9129,280City of Brampton
20.257,59551.6343,24546.8285,650City of Mississauga
32.1136,42048.6561,24043.1424,820Peel
31.5161,88041.1676,08036.5514,200PHD
12.2368,65028.33,398,72526.83,030,075Ontario
%#%*#%*#
Rate of Change20062001
4
Cultural Diversityin the Voluntary Sector
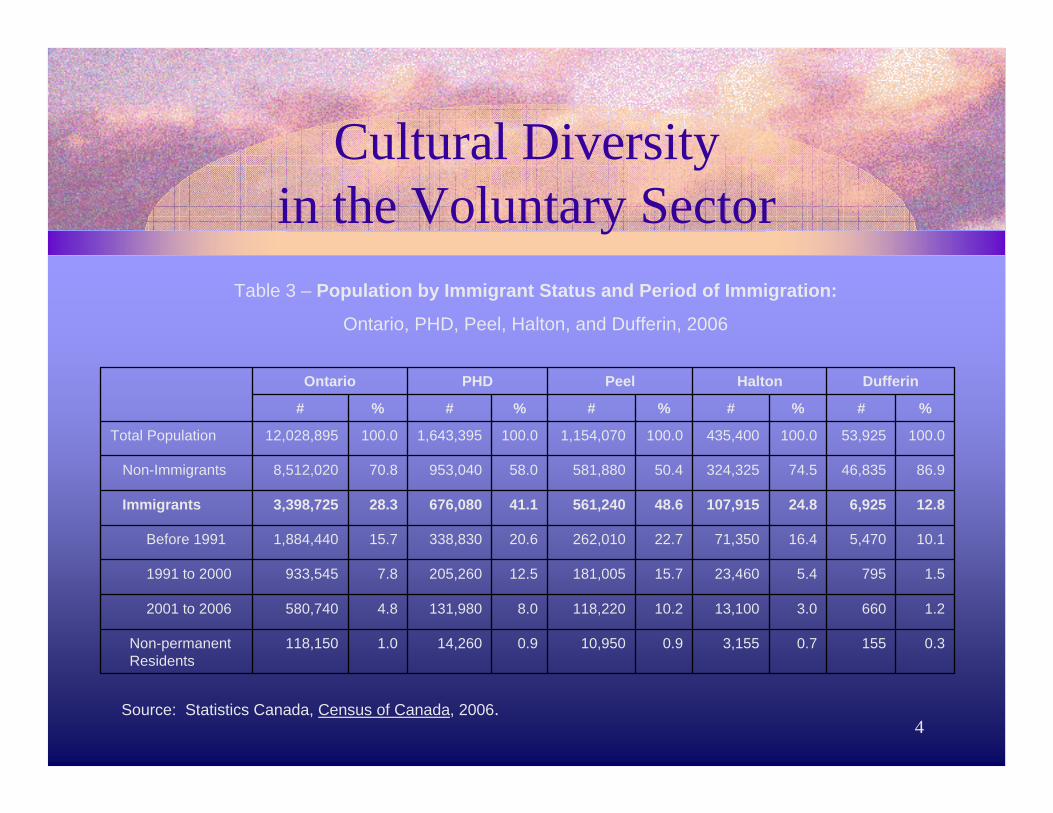
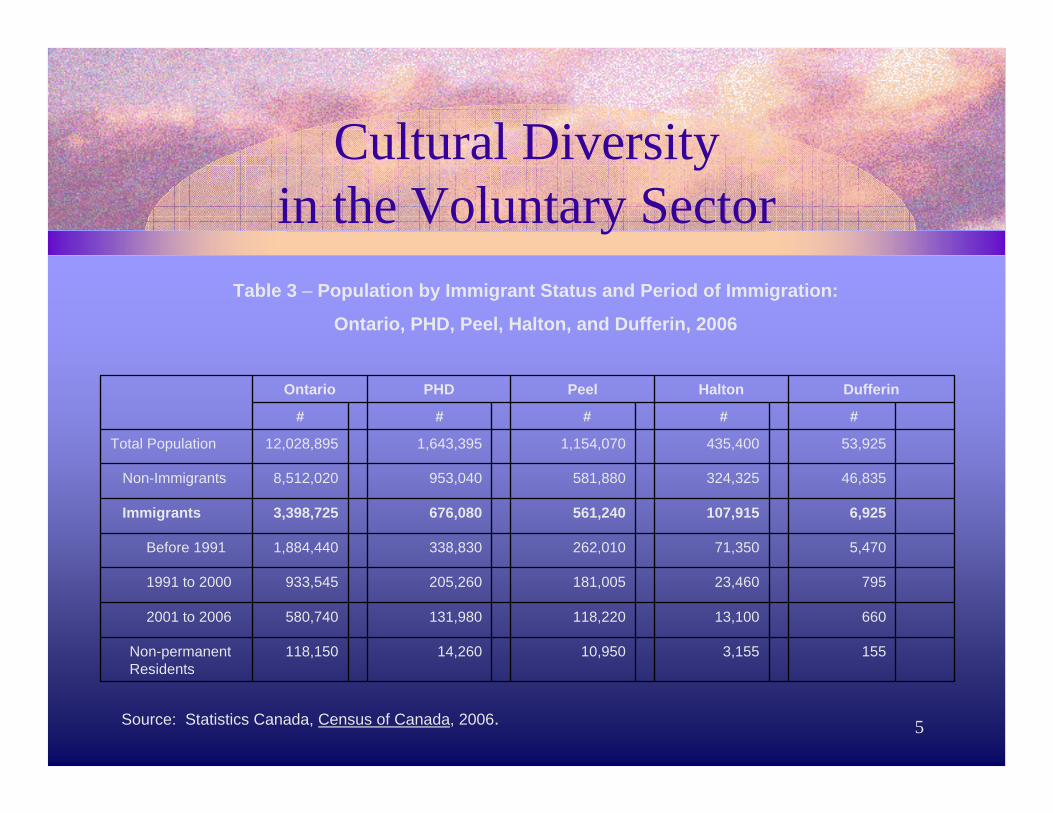
Table 3 – Population by Immigrant Status and Period of Immigration:
Ontario, PHD, Peel, Halton, and Dufferin, 2006
Source: Statistics Canada, Census of Canada, 2006.
0.31550.73,1550.910,9500.914,2601.0118,150Non-permanent Residents
1.26603.013,10010.2118,2208.0131,9804.8580,7402001 to 2006
1.57955.423,46015.7181,00512.5205,2607.8933,5451991 to 2000
10.15,47016.471,35022.7262,01020.6338,83015.71,884,440Before 1991
12.86,92524.8107,91548.6561,24041.1676,08028.33,398,725Immigrants
86.946,83574.5324,32550.4581,88058.0953,04070.88,512,020Non-Immigrants
100.053,925100.0435,400100.01,154,070100.01,643,395100.012,028,895Total Population
%#%#%#%#%#
DufferinHaltonPeelPHDOntario
5
Cultural Diversityin the Voluntary Sector
Table 3 – Population by Immigrant Status and Period of Immigration:
Ontario, PHD, Peel, Halton, and Dufferin, 2006
Source: Statistics Canada, Census of Canada, 2006.
1553,15510,95014,260118,150Non-permanent Residents
66013,100118,220131,980580,7402001 to 2006
79523,460181,005205,260933,5451991 to 2000
5,47071,350262,010338,8301,884,440Before 1991
6,925107,915561,240676,0803,398,725Immigrants
46,835324,325581,880953,0408,512,020Non-Immigrants
53,925435,4001,154,0701,643,39512,028,895Total Population
#####
DufferinHaltonPeelPHDOntario
6
Cultural Diversityin the Voluntary Sector
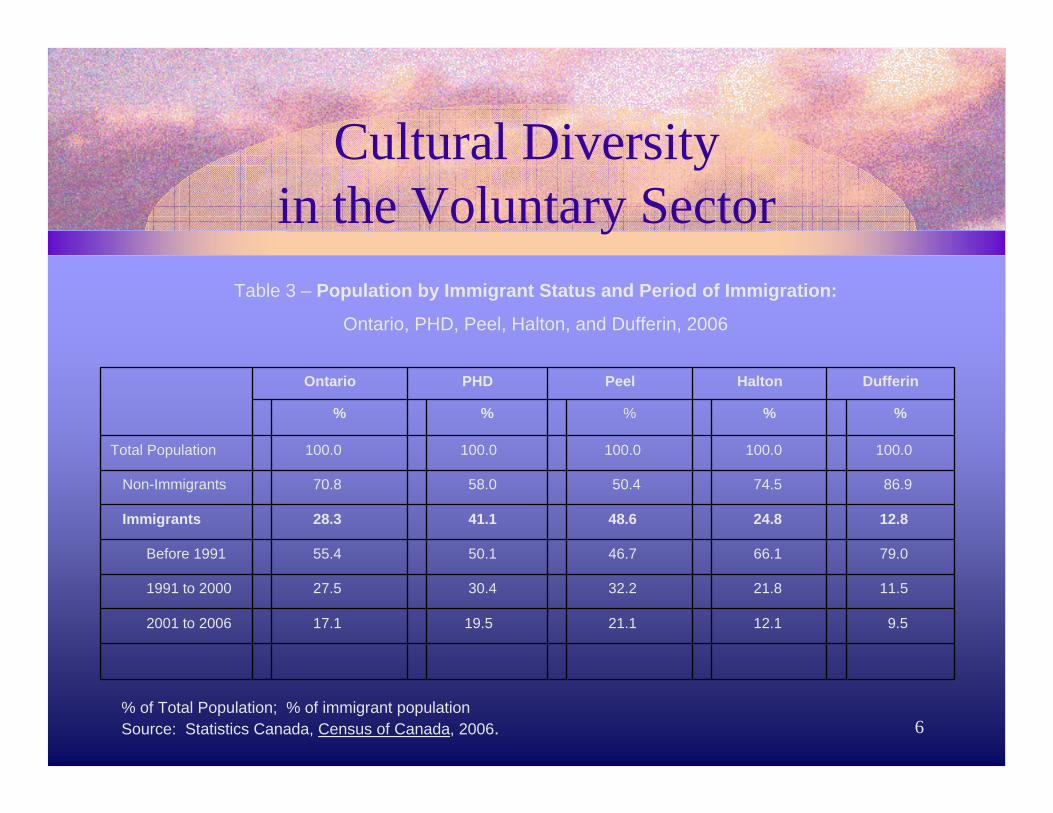
Table 3 – Population by Immigrant Status and Period of Immigration:
Ontario, PHD, Peel, Halton, and Dufferin, 2006
% of Total Population; % of immigrant population Source: Statistics Canada, Census of Canada, 2006.
9.512.121.119.517.12001 to 2006
11.521.832.230.427.51991 to 2000
79.066.146.750.155.4Before 1991
12.824.848.641.128.3Immigrants
86.974.550.458.070.8Non-Immigrants
100.0100.0100.0100.0100.0Total Population
%%%%%
DufferinHaltonPeelPHDOntario
7
Cultural Diversityin the Voluntary Sector
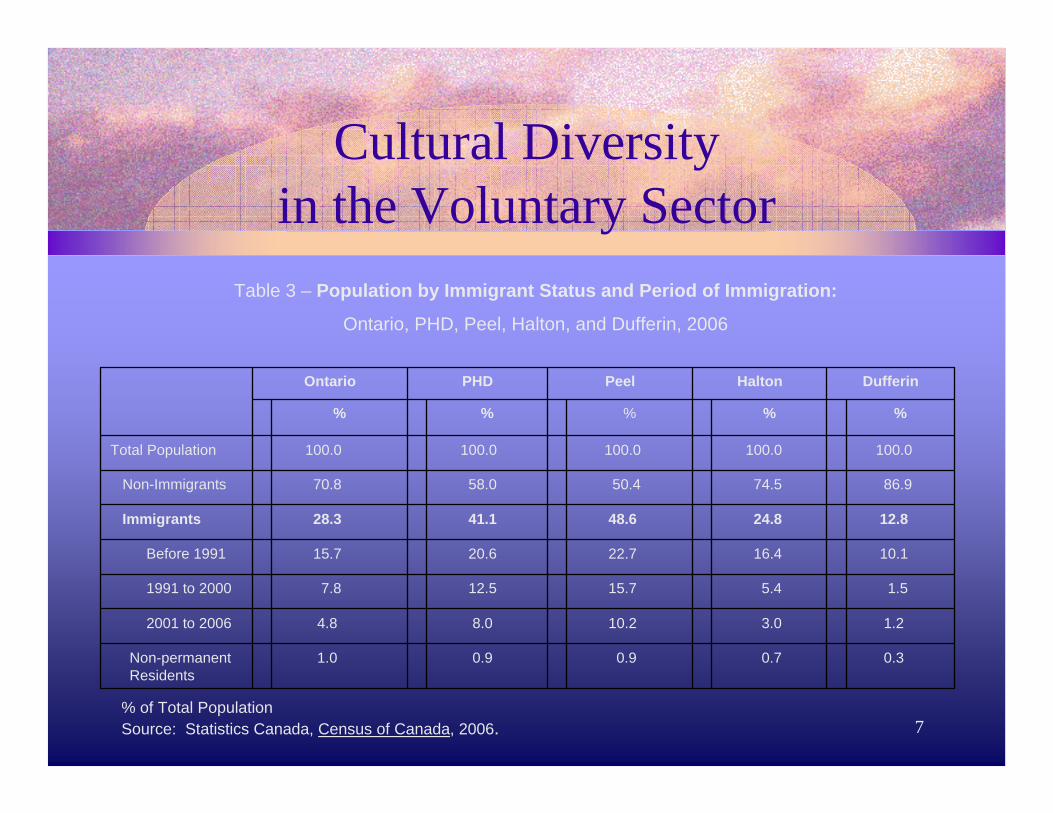
Table 3 – Population by Immigrant Status and Period of Immigration:
Ontario, PHD, Peel, Halton, and Dufferin, 2006
% of Total PopulationSource: Statistics Canada, Census of Canada, 2006.
0.30.70.90.91.0Non-permanent Residents
1.23.010.28.04.82001 to 2006
1.55.415.712.57.81991 to 2000
10.116.422.720.615.7Before 1991
12.824.848.641.128.3Immigrants
86.974.550.458.070.8Non-Immigrants
100.0100.0100.0100.0100.0Total Population
%%%%%
DufferinHaltonPeelPHDOntario
8
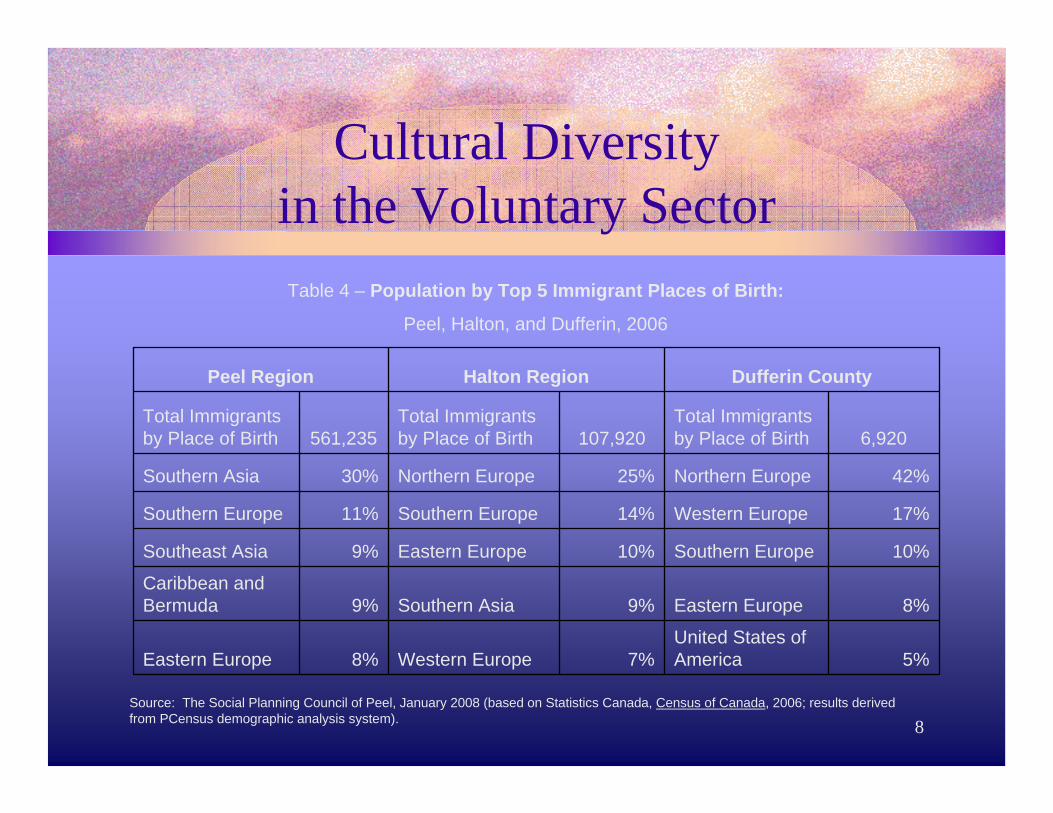
Cultural Diversityin the Voluntary SectorTable 4 – Population by Top 5 Immigrant Places of Birth:
Peel, Halton, and Dufferin, 2006
Source: The Social Planning Council of Peel, January 2008 (based on Statistics Canada, Census of Canada, 2006; results derived from PCensus demographic analysis system).
5%United States of America7%Western Europe8%Eastern Europe
8%Eastern Europe9%Southern Asia9%Caribbean and Bermuda
10%Southern Europe10%Eastern Europe9%Southeast Asia
17%Western Europe14%Southern Europe11%Southern Europe
42%Northern Europe25%Northern Europe30%Southern Asia
6,920Total Immigrants by Place of Birth107,920
Total Immigrants by Place of Birth561,235
Total Immigrants by Place of Birth
Dufferin CountyHalton RegionPeel Region
9
Cultural Diversityin the Voluntary Sector
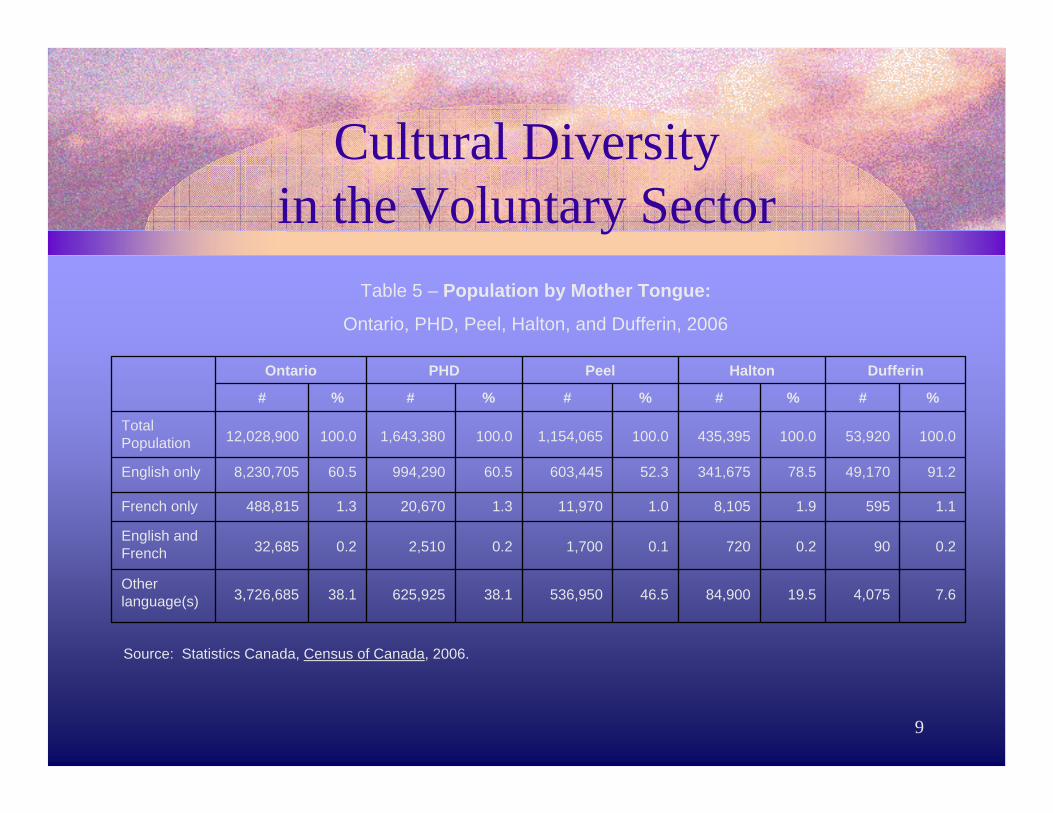
Table 5 – Population by Mother Tongue:
Ontario, PHD, Peel, Halton, and Dufferin, 2006
Source: Statistics Canada, Census of Canada, 2006.
7.64,07519.584,90046.5536,95038.1625,92538.13,726,685Other language(s)
0.2900.27200.11,7000.22,5100.232,685English and French
1.15951.98,1051.011,9701.320,6701.3488,815French only
91.249,17078.5341,67552.3603,44560.5994,29060.58,230,705English only
100.053,920100.0435,395100.01,154,065100.01,643,380100.012,028,900Total Population
%#%#%#%#%#
DufferinHaltonPeelPHDOntario
10
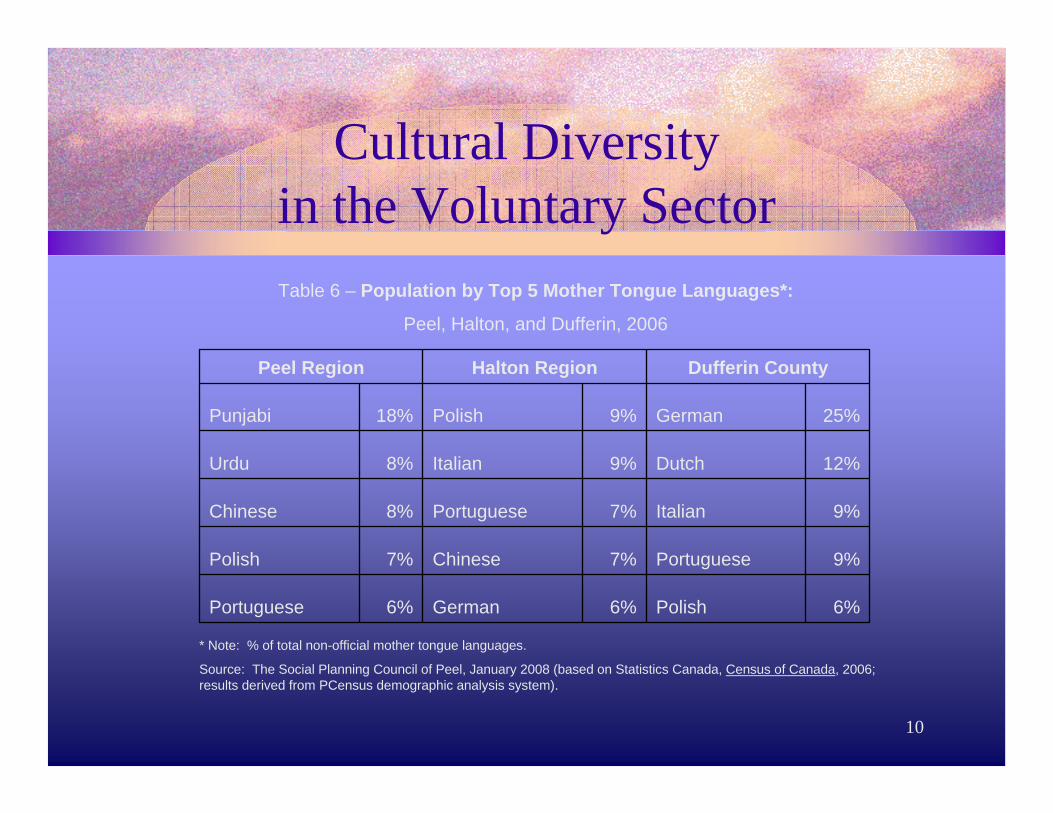
Cultural Diversityin the Voluntary SectorTable 6 – Population by Top 5 Mother Tongue Languages*:
Peel, Halton, and Dufferin, 2006
* Note: % of total non-official mother tongue languages.
Source: The Social Planning Council of Peel, January 2008 (based on Statistics Canada, Census of Canada, 2006; results derived from PCensus demographic analysis system).
6%Polish6%German6%Portuguese
9%Portuguese7%Chinese7%Polish
9%Italian7%Portuguese8%Chinese
12%Dutch9%Italian8%Urdu
25%German9%Polish18%Punjabi
Dufferin CountyHalton RegionPeel Region
11
Cultural Diversityin the Voluntary Sector
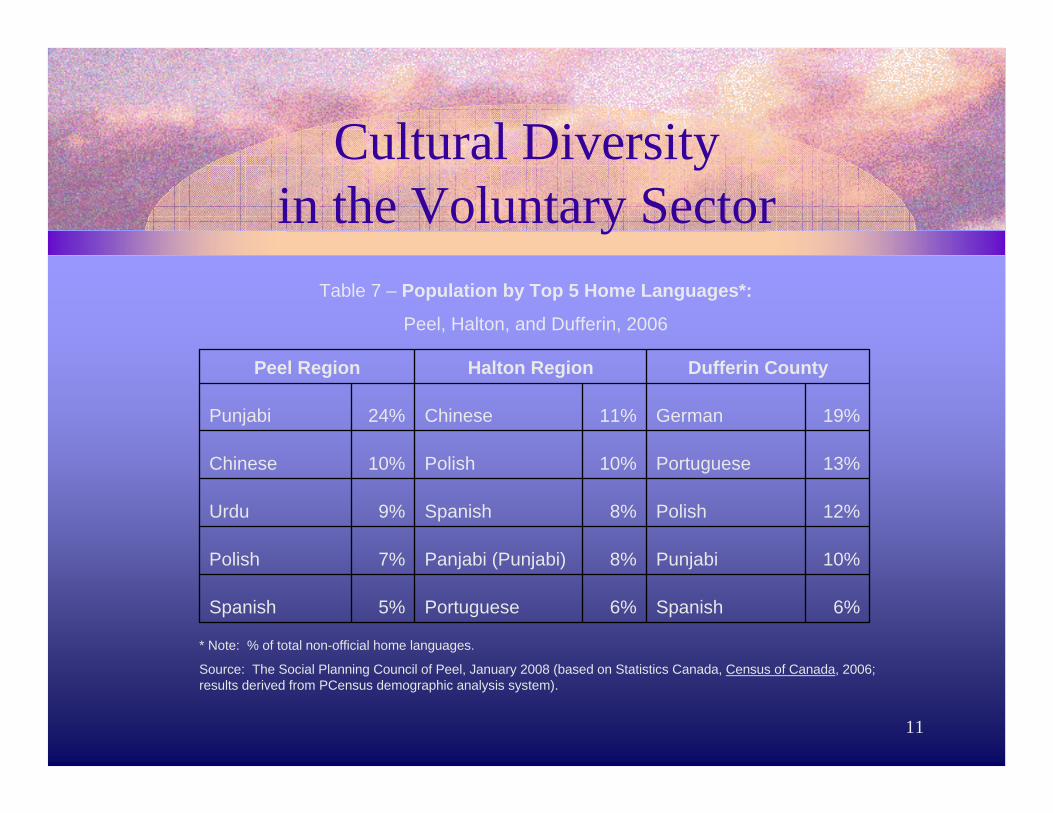
Table 7 – Population by Top 5 Home Languages*:
Peel, Halton, and Dufferin, 2006
* Note: % of total non-official home languages.
Source: The Social Planning Council of Peel, January 2008 (based on Statistics Canada, Census of Canada, 2006; results derived from PCensus demographic analysis system).
6%Spanish6%Portuguese5%Spanish
10%Punjabi8%Panjabi (Punjabi)7%Polish
12%Polish8%Spanish9%Urdu
13%Portuguese10%Polish10%Chinese
19%German11%Chinese24%Punjabi
Dufferin CountyHalton RegionPeel Region
12
Cultural Diversityin the Voluntary Sector
The Demographic
Why
The Mirror
13
THE DEMOGRAPHIC WHY
• Affirmative Action• Quotas• Diverse workforce• Diverse clients• Diverse leaders • Diverse services• Culturally appropriate services

14
Cultural Diversityin the Voluntary Sector
The Accreditation
Why
Certify Me!

15

16
A Diversity ManagementTool Kit
Prepared by:
Paula DeCoito, Ph.D.Laurie Williams, Ph.D.
2006

17
Cultural Diversityin the Voluntary Sector
TheEconomic
Why
The Bottom Line

18
Cultural Diversity in theBusiness Sector: Infrastructure
• Diversity Management Departments, Positions
• Diversity Committees and Working Groups of Boards of Trade, Chambers of Commerce
• Ethno-specific Banks and Credit Unions• Ethno-specific Business and Professional
Associations• Diversity Management Industry

19
Cultural Diversityin the Voluntary Sector
TheSocial
StabilityWhy
Keep theBoat Afloat

20
THE SOCIAL STABILITY WAY
DON’T ROCK TH E BOAT/KEEP IT AFLOAT
• Perception of Politeness• Perception of Openness• Perception of Reasonable Accommodation
Public Relations Approach

21
Cultural Diversity in theVoluntary Sector: Focus of Work
• New Canadians• Foreign-trained
Professionals• Faith Groups
• Diversity Management• Social Inclusion
2000 +
• Visible Minorities• Women
• Anti-Racism• Anti-Oppression• Employment Equity• Pay-Equity
1990s/2000
• Immigrants• Multiculturalism1970s/1980s

22
Cultural Diversityin the Voluntary Sector
TheLegalWhy
The Big Stick

23
• Immigration Policy• Human Rights Legislation• Multiculturalism Policy• Charter of Rights and Freedoms• Employment Equity Legislation• Pay-Equity Legislation• Supreme Court Decisions
INFRASTRUCTURE FOR CULTURAL DIVERSITY

24
Cultural Diversity in the Government Sector: Infrastructure
Canada: - Citizenship and Immigration Canada- Canadian Heritage
Ontario: - Ministry of Citizenship and Immigration
Municipal: - Diversity Offices- Diversity Managers

25
Cultural Diversity in theVoluntary Sector: Infrastructure
• Advocacy Organizations• Service Organizations
- Settlement Agencies- Ethno-specific Agencies
• Cultural Organizations• Research Centres• Community-based Leaders and Experts

26
Cultural Diversity in theVoluntary Sector: Infrastructure
• Voluntary Sector – Quasi-Governmental (Ontario)- Centre of Excellence for Research on
Immigration and Settlement (CERIS)- College and University Programs on Diversity
and Equity Issues

27
Cultural Diversityin the Voluntary Sector
TheMorality
Why
For all of the above reasons…

28
Root Cause Analysis and
Social Exclusion
Employment
Health
Income
Civic Engagement
Housing
Social Capital
Education
POLICIES, PROCEDURES
AND PRACTICES
ORGANIZATIONS AND
PUBLIC INSTITUTIONS
FEAR Limited Resources for Preventing or Reducing Social Exclusion
A WORLD VIEW OF SEPARATENESS AND SCARCITY
Racism, Sexism,
Homophobia
Machine Approach Ideologies of
Exclusion (Separateness)
Ideologies of/for Efficiency (Scarcity)
CONSERVATION

29
AS ABOVE, SO BELOW
Life Love

30
AS ABOVE, SO BELOW
Life
Diversity
Love
Unity

31
AS ABOVE, SO BELOW• Life
- Diversity
- Creativity
• Love
- Unity
- Freedom

32
AS ABOVE, SO BELOW
Life
Diversity
Creativity
Love
Unity
Freedom

Root Cause Analysis and
Social Communion
Employment
Health
Income Civic Engagement
Housing
Social Capital
Education
Etc.
POLICIES, PROCEDURES
AND PRACTICES
ORGANIZATIONS AND
PUBLIC INSTITUTIONS
HOPE
Resources for Promoting Social Communion and Creative Synthesis
Ideologies of Communion
(unity)
Ideologies of Creativity & Synthesis (abundance)
A WORLD VIEW OF UNITY AND ABUNDANCE
CHANGE

34
Contact Information
• Paula DeCoito, Ph.D.• Executive Director, Social Planning Council
of Peel• 905 629-3044; 416 230-2129• [email protected]• www.spcpeel.com