Embed Size (px)
Citation preview
Multilingual Academic Journal of Education and Social Sciences June 2014, Vol. 2, No. 1
ISSN: 2308-0876
1 www.hrmars.com/journals
DOI: 10.6007/MAJESS/v2-i1/1012 URL: http://dx.doi.org/10.6007/MAJESS/v2-i1/1012
1. Introduction
There has been a strong tradition in the mainstream of American psychology focusing on
individual as the unit of study. The Allport brothers (Floyd Allport, 1924; G. W. Allport, 1968) were the
ones who played a pioneering role in setting the tradition where even a group was conceptualized to be
essentially an aggregate of individuals and hence, a group phenomenon was examined from individuals’
perspective. Floyd Allport observed that “There is no psychology of groups which is not essentially and
entirely a psychology of individuals” (Allport, 1924, p. 4). G. W. Allport advanced this individualistic
tradition by suggesting to study the conscious motivations of individuals. He emphasized a rational
approach seeking consistency in the complexity of human behaviour. It was argued that Individuals are
conscious of their cognitions and motivations and are rational in their behaviour. Following this
individualistic tradition, Edwards (1957) contended that “It might seem logical to assume that if we want
to know how individuals feel about some particular psychological object; the best procedure would be
RReessppoonnddeennttss vveerrssuuss IInnffoorrmmaannttss MMeetthhoodd ooff DDaattaa
CCoolllleeccttiioonn:: IImmpplliiccaattiioonnss ffoorr BBuussiinneessss RReesseeaarrcchh
RR BB NN SSiinnhhaa && AArriiff HHaassssaann
Abstract
The present study juxtaposes the prevailing method of individual respondents’ self-ratings with their ratings
of how people in the society think, feel, and behave in order to identify a culturally sensitive method to
explore social reality. A sample of 100 adults from India and 127 university students from Malaysia rated
predominantly positive and negative description of beliefs, values and preferences twice-first for the people
residing around them and then for themselves. They also rated themselves on a scale of social desirability.
The findings confirmed that the respondents attributed negative cognitions (beliefs, values and preferences)
to the people more than themselves. They attributed predominantly positive beliefs, values and preferences
to themselves and people, although a shade more to themselves. The social desirability orientation was
meaningfully related to respondents’ self but not to people’s related perceptions. The findings thus favoured
the use of respondents in informants’ role of judging people’s cognitions of social reality.
Key words: Survey, Sample, Mix Method, Business Research
Multilingual Academic Journal of Education and Social Sciences June 2014, Vol. 2, No. 1
ISSN: 2308-0876
2 www.hrmars.com/journals
to ask them directly” (p. 3). Once the individualistic foundation was well laid out, even the social reality
was conceptualized as a totality of how individuals conceive it. A number of scholars (e.g. Hogan, 1975;
Sampson, 1977; Spence, 1985) studied macro level societal phenomena from this individualistic
perspective. Hofstede (1980), for example collected responses of IBM employees in a large number of
cultures, aggregated them into cultural scores, and extracted the dimensions to compare the cultures.
Despite such a strong tradition presuming the validity of individualistic approach, there were
voices of skepticism even in the West that remained largely unattended in the psychological research.
Edwards (1957), for example, had admitted “the reluctance of many individuals to give public expression
to their feelings or attitudes on controversial issues…”(p.3). Triandis (1980) further cautioned,
“Respondent methods [where the subject is responding to stimuli presented by the researcher] are
more obtrusive, and they are more likely to be distorted by reactivity. The respondents are more likely to
distort their answers, so that they will appear to be socially desirable people to the researcher, their
peers, or the authorities in their culture, or from the point of view of their culture’s ideal.” (p. 80)
If individuals’ responses are susceptible to social desirability effects in an individualistic culture
in the USA, they are likely to be much more tailored in a collectivist culture where people define
themselves in terms of collectives, comply with social norms rather than individual attitudes, yield
personal goals to those of the collectives, and prioritize relationships over rationality (Triandis, 1995).
The cultural ideal that Triandis referred above requires that respondents present themselves in a socially
desirable fashion. According to some (Hofstede, 1980; Sinha & Verma, 1987), Indian culture is by and
large collectivist while others find that it is both collectivist and individualist (D. Sinha and Tripathi, 1990;
Sinha, Sinha, Verma & Sinha, 2001; Sinha, Vohra, Singhal, Sinha, & Ushashree, 2002; Sinha, 2004).
Similarly Malaysians are reported to be high on collectivism (Abdullah, 1996). The country falls under
the South Asia cluster of Schwartz’s (1999, 2006) theory of cultural value orientations, which is
characterized as high on hierarchy (e.g., deference to authority) and embeddedness (e.g., in-group
solidarity).To the extent that the culture is collectivist, Sinha (2010) argued that a way out of the
problem in investigating a social reality without getting it contaminated by social desirability is to place
respondents in the role of informants. In informants’ role, respondents are likely to distance themselves
from their own personal views and make impersonal observations of the social reality. There is an
additional rationale to do so. Because collectives, not individuals, are the core of social reality in a
collectivist culture, it is more appropriate to ask respondents about the way they view collectives rather
than they view themselves. The disciplines of anthropology and sociology that study larger chunks of
social reality have indeed developed a respectable tradition of employing informants (Bernard et al.,
1984; Cambell, 1955) respectively. The third advantage lies in bypassing the requirement of having a
representative sample, which is a must in a study that employs respondent’s method. Unless the sample
is representative, the aggregated individuals’ self-perception cannot reflect the totality of a social
reality. On the other hand, even a smaller convenient sample can impersonally provide outsiders’
understanding of the reality.
There is, however, a limitation of using respondents as informants. Because they are giving
outsiders’ view, their perceptions may be stereotypical, and hence only partly valid. The limitation can
Multilingual Academic Journal of Education and Social Sciences June 2014, Vol. 2, No. 1
ISSN: 2308-0876
3 www.hrmars.com/journals
be circumvented by taking a precaution to see that divergent samples of informants converge in
profiling social reality. In that case, the seemingly stereotypical responses can be taken for
sociotypical(Triandis, 1994, p. 107), and hence valid. A review of literature (Shteynberg, Gelfand, & Kim,
2009, p. 47) revealed that even stereotypes are powerfully associated with the social reality in the sense
that informants’ descriptions of the cognitions and behaviours held by the social groups are closely
associated with their actual cognitions and behaviours.
The issue pertaining to the relative merit of respondents versus informant’s method is still far
from settled because the arguments are still unsupported by a comparative evaluation of the two
methods in a single study. Sinha (2010) has indeed reported substantial support in favourof the
informant’s method, but has not yet compared the two. The present study is an attempt in this
direction. The paper reports the findings of two studies—one conducted in India on a sample drawn
from a mix of social population, and the other conducted in Malaysia on a student sample.
The discussion above suggests that the respondents’ self perception compared to their
perception of the people at large will be affected by the cultural pressure to give socially desirable
responses. It means their self-perception will be over rated for positive and under rated for negative
beliefs, preferences, and practices. Thus the following hypothesis is formulated:
Hypothesis 1. Respondents will endorse more strongly positive beliefs, preferences, and practices
for themselves than for the people in their society. The reverse will be true for negative beliefs,
preferences, and practices, which will be attributed more strongly topeople than self
However, there may be a positive relationship between how respondents view themselves and
people in their society. Collectivism is known for the inter-dependence of self (Markus &Kitayama, 1991)
and interconnectedness among people. To the extent that Indians and Malaysians are collectivists, they
are likely to perceive themselves connected to others that in turn might lead to see similarity between
themselves and other people. Respondents, therefore, may project their own positive as well as
negative beliefs, preferences, and practices to them. In order to test it, the following hypothesis is
advanced:
Hypothesis 2. Respondent’s perception of their beliefs, preferences, and practices will be
correlated with their perception of people’s beliefs, and preferences.
Because the social desirability effects are presumed to be the bone of contention, the
respondents who are high on the disposition to present them in socially desirable fashion are likely to
overrate their positive and underrate their negative beliefs, preferences, and practices. There is,
however, no ground to believe that respondents’ social desirability disposition will affect how they
perceive other people. Hence, the following hypothesis:
Hypothesis 3. Respondents’ scores on a social desirability measure will be positively correlated
with their score on the positive beliefs, preferences, and practices and negatively correlated with the
negative beliefs, preferences, and practices. The social desirability measure will be uncorrelated with
respondents’ perception of people’s positive and negative beliefs, preferences, and practices.
Multilingual Academic Journal of Education and Social Sciences June 2014, Vol. 2, No. 1
ISSN: 2308-0876
4 www.hrmars.com/journals
2. Method
2.1 Sample and Measures
This study was conducted in India and Malaysia. In India 100 adults representing a mix
population participated in the study. They belonged to educated urban middle class, belonging to the
age range of 20 to 60 years (Mean = 40.38). 70% of them were males and 74% were married. And 61%
were having either a graduate or post graduate degree. In Malaysia data were collected from 127
undergraduates, majority of them were females (61.4%) and 97% were unmarried. Their age range was
20-26 years (Mean = 22.11).
A questionnaire consisting of items in three parts was prepared. It measured the following:
Perception of people’s beliefs, preferences, and practices. While selecting a measure for people’s
beliefs, preferences, and practices, care was taken to safeguard against a possibility that the items may
be stereotypical. Hence, 15 statements describing people’s discrepant beliefs, preferences, and
practices were drawn from a study (Sinha, et al., 2010) in which a large sample of adults located at 12
different parts of India were involved. These 15 statements were the ones which had the highest mean
scores indicating that they mapped socio-typical rather than stereotypical responses. Respondents were
asked to rate each statement on a 5-point scale ranging from Quite False (1), False (2), Undecided (3),
True (4), to Quite True (5). Because the statements had discrepant ideas having both positive and
negative themes, a 9-member social scientists group was involved in sorting them as either
predominantly positive or predominantly negative. Six statements were judged having predominantly
positive theme. Two examples were the following:
People forget differences and help each other during disasters.
People become quite creative when they get challenging opportunities.
Of the remaining 11 statements, eight were unanimously judged to have predominantly negative
theme while one statement was categorised negative based on the majority judgment. One example of
unanimous and one of majority decision were as follows;
Unanimously negative:
People run after power and positions, although value peace of mind.
People work very hard when expect to get amply rewarded.
Self-perception. In order to compare respondents’ perception of people and themselves, the same
15 statements that were used for perceiving people were rephrased to measure respondents’
Multilingual Academic Journal of Education and Social Sciences June 2014, Vol. 2, No. 1
ISSN: 2308-0876
5 www.hrmars.com/journals
perception of their own beliefs, preferences, and practices. Again the same 5-point scale was employed.
The examples of rephrased statements were following:
Positively worded items:
I forget differences and help others during disasters.
I become quite creative when I get challenging opportunities.
I run after power and positions, although I value peace of mind.
I work very hard when I expect to get amply rewarded.
Social Desirability. Items from the shorter a version of the Crowne-Marlow Scale (Fischer & Fick,
1993) were modified to measure the degree of respondents’ disposition to present themselves in a
socially desirable fashion. The measure consisted of 12 items including three negatively worded items.
The items were rated on the same 5-point scale ranging from Quite False (1), False (2), Undecided (3),
True (4), to Quite True (5). Factor analysis by the principal component analysis with the varimax
solution yielded only one factor on the criterion that the Eigenvalue should not be less than two. The
nine items out of 12 that loaded on the factor profiled a person with high disposition of social
desirability as the one who forgives those who hurt him, always admits when he is wrong, does not
speak a lie, does not get angry even he is provoked, is always courteous even to disagreeable people,
never offends others, and always helps someone in trouble. The alpha coefficient (rii =.66) was
acceptable. The factor accounted for 20.21% of variance. Two examples of the high loading items were
the following:
I forgive those who hurt me (Loading .63)
I always admit when I am wrong (Loading .60)
As a check on the measure of social responsibility, four statements were also included in Part 3
measuring on the same 5-point scale the respondent self-perception that he/she was a successful
person, a spiritual person, satisfied with life, and had the capacity to solve difficult problems of life. All
items loaded on a single factor, labeled as Personal Well-being. It explained 49.48% of variance. (Alpha
=.78). A positive correlation between the wellbeing and social desirability would support the validity of
the latter.
Background information. In the Indian sample information regarding age, education, and
economic class (low middle class, middle-middle class, high middle class, and high class) were also
collected for describing the sample of respondents and exploring whether they have any impact on
respondents’ perceptions of themselves and the people at large. The Malaysian sample consisted of all
Malay undergraduate students with little differences in their demographics.
Multilingual Academic Journal of Education and Social Sciences June 2014, Vol. 2, No. 1
ISSN: 2308-0876
6 www.hrmars.com/journals
3. RESULTS
3.1 Perception of Predominantly Positive Statements
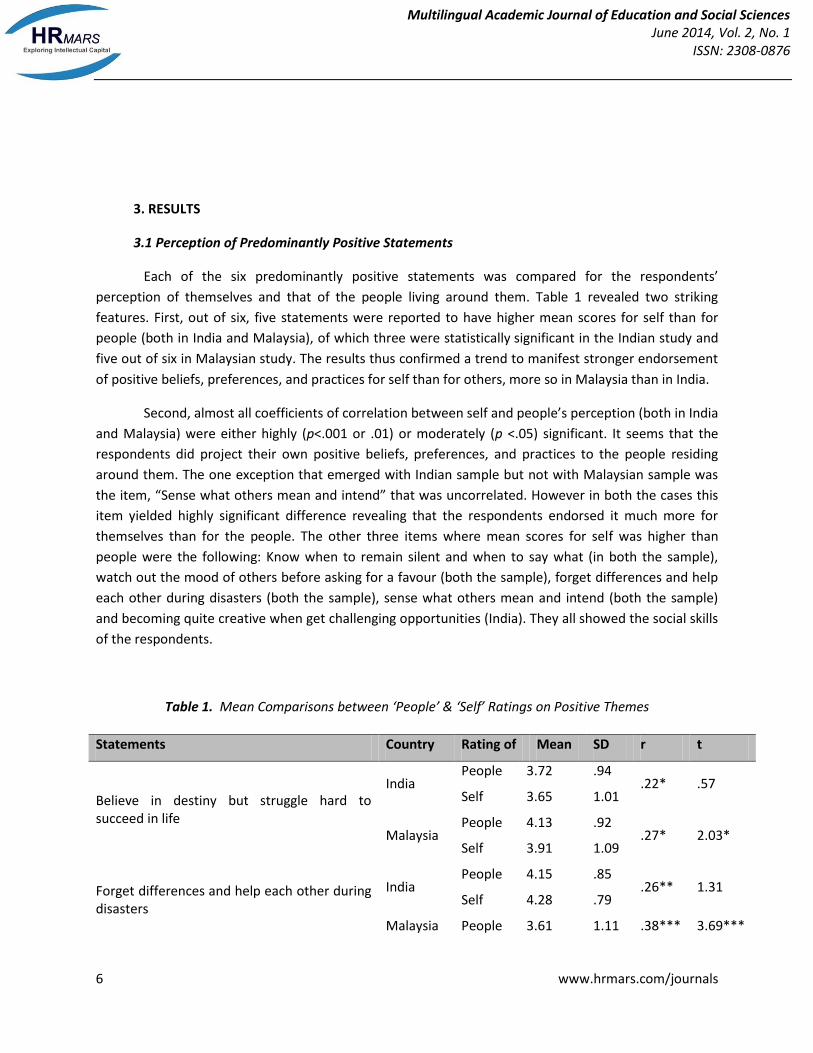
Each of the six predominantly positive statements was compared for the respondents’
perception of themselves and that of the people living around them. Table 1 revealed two striking
features. First, out of six, five statements were reported to have higher mean scores for self than for
people (both in India and Malaysia), of which three were statistically significant in the Indian study and
five out of six in Malaysian study. The results thus confirmed a trend to manifest stronger endorsement
of positive beliefs, preferences, and practices for self than for others, more so in Malaysia than in India.
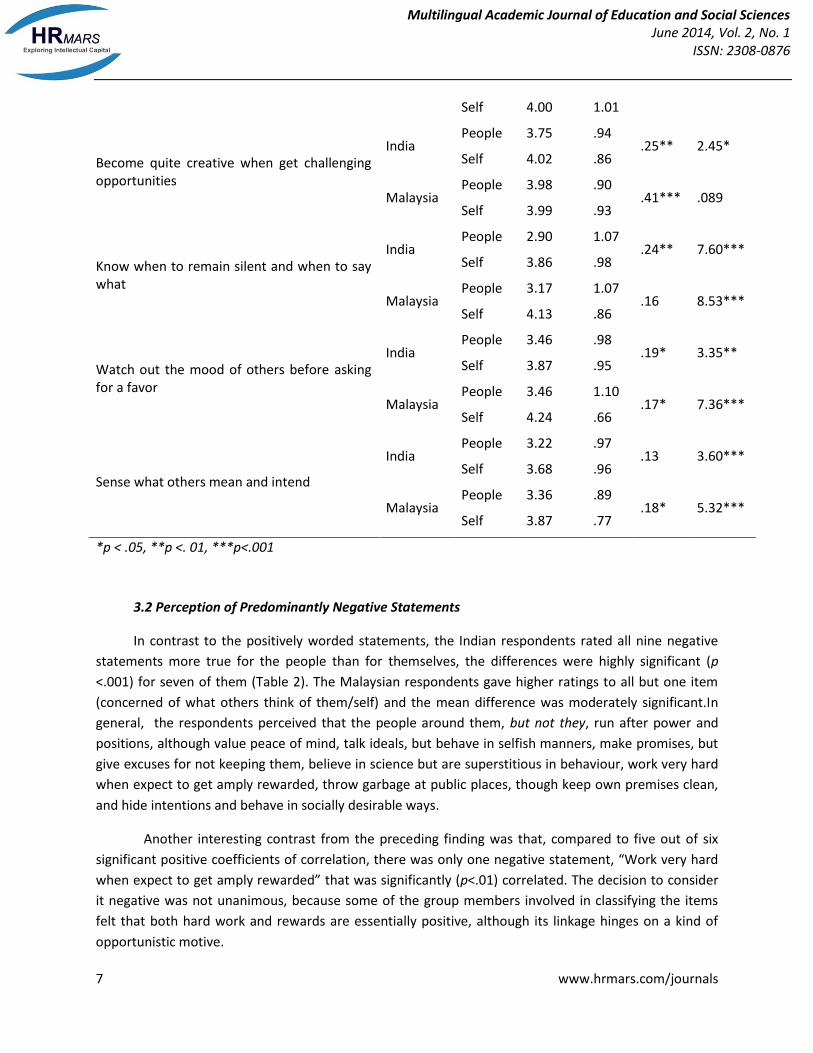
Second, almost all coefficients of correlation between self and people’s perception (both in India
and Malaysia) were either highly (p<.001 or .01) or moderately (p <.05) significant. It seems that the
respondents did project their own positive beliefs, preferences, and practices to the people residing
around them. The one exception that emerged with Indian sample but not with Malaysian sample was
the item, “Sense what others mean and intend” that was uncorrelated. However in both the cases this
item yielded highly significant difference revealing that the respondents endorsed it much more for
themselves than for the people. The other three items where mean scores for self was higher than
people were the following: Know when to remain silent and when to say what (in both the sample),
watch out the mood of others before asking for a favour (both the sample), forget differences and help
each other during disasters (both the sample), sense what others mean and intend (both the sample)
and becoming quite creative when get challenging opportunities (India). They all showed the social skills
of the respondents.
Table 1. Mean Comparisons between ‘People’ & ‘Self’ Ratings on Positive Themes
Statements Country Rating of Mean SD r t
Believe in destiny but struggle hard to succeed in life
India People 3.72 .94
.22* .57 Self 3.65 1.01
Malaysia People 4.13 .92
.27* 2.03* Self 3.91 1.09
Forget differences and help each other during disasters
India People 4.15 .85
.26** 1.31 Self 4.28 .79
Malaysia People 3.61 1.11 .38*** 3.69***
Multilingual Academic Journal of Education and Social Sciences June 2014, Vol. 2, No. 1
ISSN: 2308-0876
7 www.hrmars.com/journals
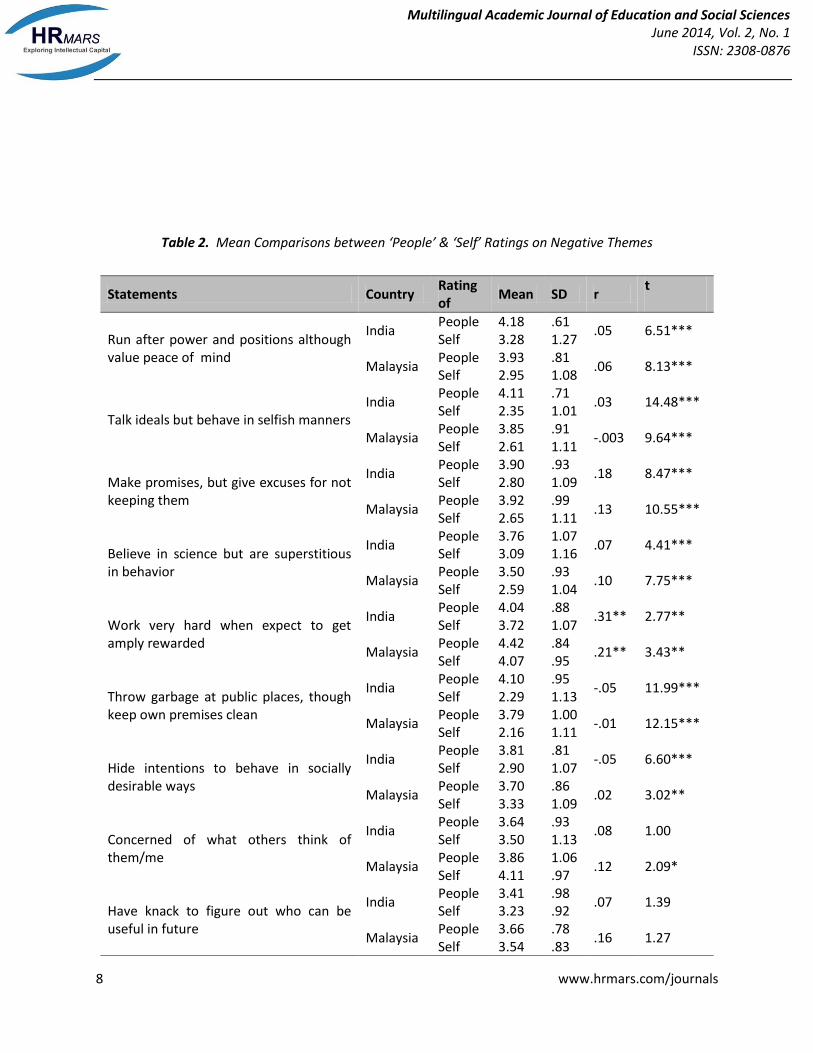
3.2 Perception of Predominantly Negative Statements
In contrast to the positively worded statements, the Indian respondents rated all nine negative
statements more true for the people than for themselves, the differences were highly significant (p
<.001) for seven of them (Table 2). The Malaysian respondents gave higher ratings to all but one item
(concerned of what others think of them/self) and the mean difference was moderately significant.In
general, the respondents perceived that the people around them, but not they, run after power and
positions, although value peace of mind, talk ideals, but behave in selfish manners, make promises, but
give excuses for not keeping them, believe in science but are superstitious in behaviour, work very hard
when expect to get amply rewarded, throw garbage at public places, though keep own premises clean,
and hide intentions and behave in socially desirable ways.
Another interesting contrast from the preceding finding was that, compared to five out of six
significant positive coefficients of correlation, there was only one negative statement, “Work very hard
when expect to get amply rewarded” that was significantly (p<.01) correlated. The decision to consider
it negative was not unanimous, because some of the group members involved in classifying the items
felt that both hard work and rewards are essentially positive, although its linkage hinges on a kind of
opportunistic motive.
Self 4.00 1.01
Become quite creative when get challenging opportunities
India People 3.75 .94
.25** 2.45* Self 4.02 .86
Malaysia People 3.98 .90
.41*** .089 Self 3.99 .93
Know when to remain silent and when to say what
India People 2.90 1.07
.24** 7.60*** Self 3.86 .98
Malaysia People 3.17 1.07
.16 8.53*** Self 4.13 .86
Watch out the mood of others before asking for a favor
India People 3.46 .98
.19* 3.35** Self 3.87 .95
Malaysia People 3.46 1.10
.17* 7.36*** Self 4.24 .66
Sense what others mean and intend
India People 3.22 .97
.13 3.60*** Self 3.68 .96
Malaysia People 3.36 .89
.18* 5.32*** Self 3.87 .77
*p < .05, **p <. 01, ***p<.001
Multilingual Academic Journal of Education and Social Sciences June 2014, Vol. 2, No. 1
ISSN: 2308-0876
8 www.hrmars.com/journals
Table 2. Mean Comparisons between ‘People’ & ‘Self’ Ratings on Negative Themes
Statements Country Rating of
Mean SD r t
Run after power and positions although value peace of mind
India People 4.18 .61
.05 6.51*** Self 3.28 1.27
Malaysia People 3.93 .81
.06 8.13*** Self 2.95 1.08
Talk ideals but behave in selfish manners India
People 4.11 .71 .03 14.48***
Self 2.35 1.01
Malaysia People 3.85 .91
-.003 9.64*** Self 2.61 1.11
Make promises, but give excuses for not keeping them
India People 3.90 .93
.18 8.47*** Self 2.80 1.09
Malaysia People 3.92 .99
.13 10.55*** Self 2.65 1.11
Believe in science but are superstitious in behavior
India People 3.76 1.07
.07 4.41*** Self 3.09 1.16
Malaysia People 3.50 .93
.10 7.75*** Self 2.59 1.04
Work very hard when expect to get amply rewarded
India People 4.04 .88
.31** 2.77** Self 3.72 1.07
Malaysia People 4.42 .84
.21** 3.43** Self 4.07 .95
Throw garbage at public places, though keep own premises clean
India People 4.10 .95
-.05 11.99*** Self 2.29 1.13
Malaysia People 3.79 1.00
-.01 12.15*** Self 2.16 1.11
Hide intentions to behave in socially desirable ways
India People 3.81 .81
-.05 6.60*** Self 2.90 1.07
Malaysia People 3.70 .86
.02 3.02** Self 3.33 1.09
Concerned of what others think of them/me
India People 3.64 .93
.08 1.00 Self 3.50 1.13
Malaysia People 3.86 1.06
.12 2.09* Self 4.11 .97
Have knack to figure out who can be useful in future
India People 3.41 .98
.07 1.39 Self 3.23 .92
Malaysia People 3.66 .78
.16 1.27 Self 3.54 .83
Multilingual Academic Journal of Education and Social Sciences June 2014, Vol. 2, No. 1
ISSN: 2308-0876
9 www.hrmars.com/journals
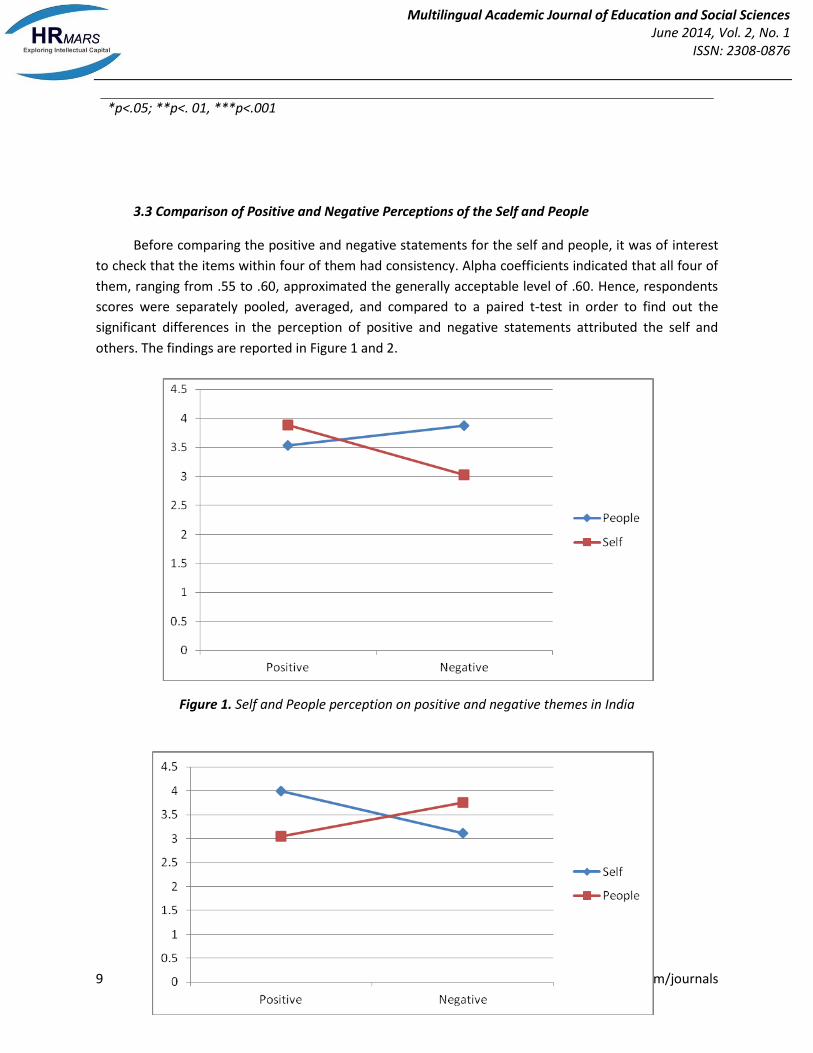
3.3 Comparison of Positive and Negative Perceptions of the Self and People
Before comparing the positive and negative statements for the self and people, it was of interest
to check that the items within four of them had consistency. Alpha coefficients indicated that all four of
them, ranging from .55 to .60, approximated the generally acceptable level of .60. Hence, respondents
scores were separately pooled, averaged, and compared to a paired t-test in order to find out the
significant differences in the perception of positive and negative statements attributed the self and
others. The findings are reported in Figure 1 and 2.
Figure 1. Self and People perception on positive and negative themes in India
*p<.05; **p<. 01, ***p<.001
Multilingual Academic Journal of Education and Social Sciences June 2014, Vol. 2, No. 1
ISSN: 2308-0876
10 www.hrmars.com/journals
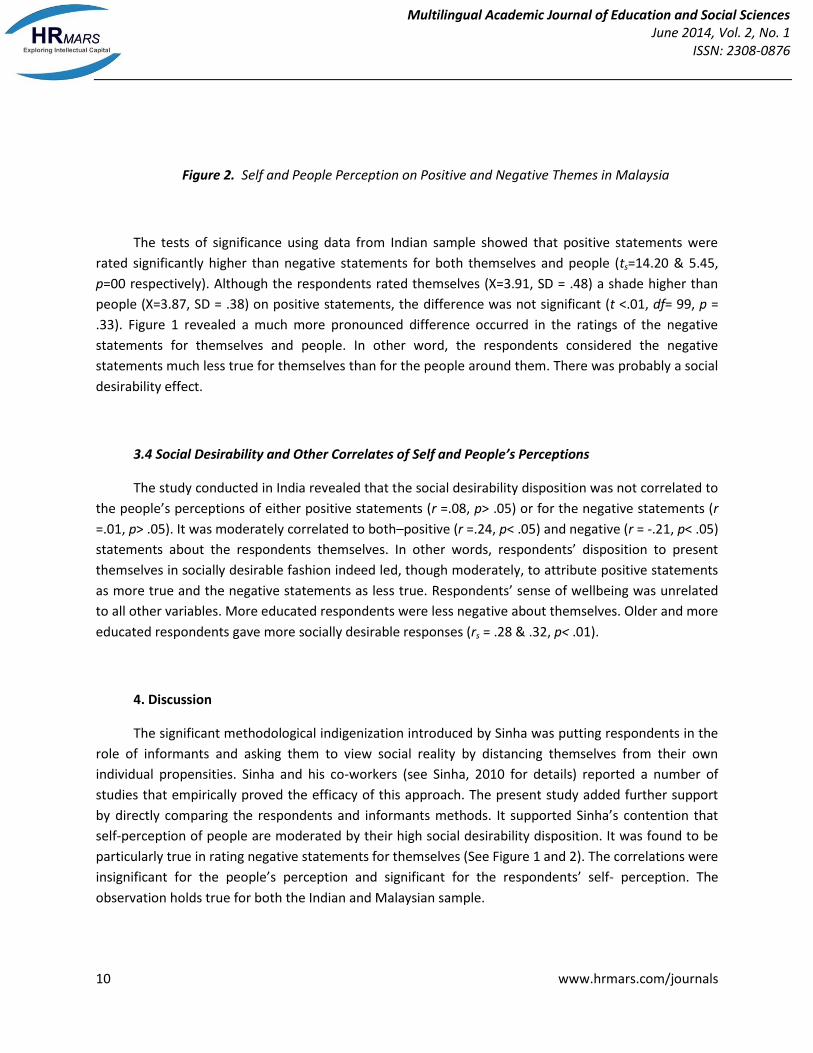
Figure 2. Self and People Perception on Positive and Negative Themes in Malaysia
The tests of significance using data from Indian sample showed that positive statements were
rated significantly higher than negative statements for both themselves and people (ts=14.20 & 5.45,
p=00 respectively). Although the respondents rated themselves (X=3.91, SD = .48) a shade higher than
people (X=3.87, SD = .38) on positive statements, the difference was not significant (t <.01, df= 99, p =
.33). Figure 1 revealed a much more pronounced difference occurred in the ratings of the negative
statements for themselves and people. In other word, the respondents considered the negative
statements much less true for themselves than for the people around them. There was probably a social
desirability effect.
3.4 Social Desirability and Other Correlates of Self and People’s Perceptions
The study conducted in India revealed that the social desirability disposition was not correlated to
the people’s perceptions of either positive statements (r =.08, p> .05) or for the negative statements (r
=.01, p> .05). It was moderately correlated to both–positive (r =.24, p< .05) and negative (r = -.21, p< .05)
statements about the respondents themselves. In other words, respondents’ disposition to present
themselves in socially desirable fashion indeed led, though moderately, to attribute positive statements
as more true and the negative statements as less true. Respondents’ sense of wellbeing was unrelated
to all other variables. More educated respondents were less negative about themselves. Older and more
educated respondents gave more socially desirable responses (rs = .28 & .32, p< .01).
4. Discussion
The significant methodological indigenization introduced by Sinha was putting respondents in the
role of informants and asking them to view social reality by distancing themselves from their own
individual propensities. Sinha and his co-workers (see Sinha, 2010 for details) reported a number of
studies that empirically proved the efficacy of this approach. The present study added further support
by directly comparing the respondents and informants methods. It supported Sinha’s contention that
self-perception of people are moderated by their high social desirability disposition. It was found to be
particularly true in rating negative statements for themselves (See Figure 1 and 2). The correlations were
insignificant for the people’s perception and significant for the respondents’ self- perception. The
observation holds true for both the Indian and Malaysian sample.
Multilingual Academic Journal of Education and Social Sciences June 2014, Vol. 2, No. 1
ISSN: 2308-0876
11 www.hrmars.com/journals
Interestingly enough, the respondents gave higher ratings on the positive statements for both
themselves and the people residing around them, although the average scores for themselves were a
shade higher than for the people in the Indian sample and prominently higher in Malaysian sample (See
Figure 1 and 2). There was also a significant positive correlation between the two. This partially
supported Hypothesis 2 and suggested that the relationship culture induces people to see others in a
positive light. One may even stretch Fiedler (1967) to argue that if a relationship oriented leader
perceives even his least preferred co-worker favorably, there are possibilities the relationship oriented
people see other people favorably too.
Unexpectedly, data from Indian sample demonstrated that the respondents’ sense of well-being
was unrelated to their social desirability score. It was expected that those who tend to present their
socially desirable face will also report a higher level of wellbeing. However, older and better educated
respondents reported higher levels of social desirability. Probably, the culture season those to remain
socially wise.
Despite supportive evidence in favour of employing informant’s method and items having
discrepant ideas, there still exists a need to anchor the findings in actual behavior.Further studies are
suggested to sample behaviours along with verbal measures to fill this gap.
5. Implications for Organizational Studies
Most of the survey studies in organizations employ respondents’ method to collect data and the
aggregated data are used to measure constructs and variables. To what extent the respondents are able
to distance themselves from the social reality and provide true and objective response is debatable.
Studies on moral/ethical values, beliefs and practices, motivation, citizenship behavior, leadership styles
and a host of other studies using self- report techniques may not yield objective data unless the
respondents’ are able to distance themselves and portray their true self. Using respondents as
informants can be one option. Items of the questionnaire may be modified accordingly.
References
Allport, F. H. (1924). Social psychology. Cambridge, MA: Riverside Press.
Allport, G. W. (1968). The historical background of modern social psychology,in G Lindzeyand E Aronson
(Eds) Handbook of social psychology (2nded) 1: 1-80, Reading, MA: Addisson-Wesley.
Asma A. (1996). Going Glocal: Cultural Dimension in Malaysian Management. Kuala Lumpur: Malaysian
Institute of Management.
Bernard, H. R., Killworth, P; Kronenfeld, D; & Sailer, L. (1984). The problem of informant accuracy: The
validity of retrospective data. Annual Review of Anthropology, pp 495-517.
Multilingual Academic Journal of Education and Social Sciences June 2014, Vol. 2, No. 1
ISSN: 2308-0876
12 www.hrmars.com/journals
Campbell, D. T (1955). The informant in quantitative research. American Journal of Sociology, 60, pp
339-342.
Edwards, A. L (1957). The social desirability variable in personality assessment and research. New York:
Dryden Press.
Fiedler, F. E. (1967). A theory of leadership effectiveness, New York: McGraw-Hill
Fischer, D. G.; & Fick, C. (1993). Measuring Social Desirability: Short Forms of the Marlowe-Crowne
Social Desirability Scale.Educational & Psychological Measurement, 53, pp 417-424
Hofstede, G. (1980). Culture’s consequences: International differences in work-related values. Beverly
Hills, CA: Sage.
Hogan, R. T. (1975). Theoretical egocentrism and the problem of compliance. American Psychologist, 30,
pp 533-540.
Markus, H. R.; & Kitayama, S. (1991). Culture and the self: Implications for cognition, emotion, and
motivation. Psychological Review, 98, pp 224-253.
Sampson, E. E. (1977). Psychology and the American ideal, Journal of Personality and Social Psychology,
35, pp767-782.
Shteynberg G, Gelfand, M. J, & Kim, K. (2009). Peering into “Magnum Mysterium” of culture: An
explanatory power of descriptive norms. Journal of Cross-Cultural Psychology, 40, pp 46-69.
Sinha, D. (1986). Psychology in the third world country: The Indian experience. New Delhi: Sage.
Sinha, D. (1998). Changing perspectives in social psychology in India: A journey towards indigenization.
Asian Journal of Social Psychology, 1, pp17-32.
Sinha, D.; & Tripathi, R. C. (1990) Individualism in a collective culture: A case of coexistence of
dichotomies. Paper presented at the International Conference on Individualism and Collectivism:
Psycho-cultural Perspectives from East and West, Seoul.
Sinha, J. B. P. (2003). Trends toward indigenization of psychology in India, In KS Yang, K. K. Hwang, P
Pederson, and I Diabo (Eds), Progress in Asian psychology: Conceptual and empirical contributions
(pp. 11-28). Westport & London: Praeger.
Sinha, J. B. P. (2010). Living and doing psychology.Psychology and Developing Societies, 22(1) pp 95-120.
Sinha, J. B. P., Singh S, Gupta P, Srivastava, K. B. L, Sinha, R. B. N, Srivastava, S, Ghosh, A, Siddiqui, R. N,
Tripathi, N, Gupta, M, Mulla, Z, Vijayalakshmi, C, & Pandey, A (2010). An Exploration of the Indian
Mindset. Psychological Studies, 55(1), pp 3-17.
Sinha, J. B. P., Sinha, T. N, Verma, J, & Sinha, R. B. N. (2001). Collectivism coexisting with individualism:
an Indian scenario. Asian Journal of Social Psychology, 4, pp 133-145.
Multilingual Academic Journal of Education and Social Sciences June 2014, Vol. 2, No. 1
ISSN: 2308-0876
13 www.hrmars.com/journals
Sinha, J. B. P., & Verma, J. (1987). Structure of collectivism. In C. Kagitcibasi (Ed.), Growth and progress in
cross-cultural psychology. Lisse, Netherlands: Swets&Zeitlinger.
Sinha, J. B. P.; Vohra, N; Singhal, S; Sinha, R. B. N.; & Ushashree, S (2002). Normative predictions of
collectivist-individualist intentions and behaviour of Indians. International Journal of Psychology,
Vol. 37(5), pp 309-319.
Sinha, R. B. N. (2004). Choice of the combinations of collectivist and individualist behaviour and
intention as function of generation gap. Psychological Studies, 49(1) pp14-19.
Schwartz, SH (1999). Cultural value differences: some implications for work, Applied Psychology: An
International Review, Vol. 48, pp 23–47.
Spence, J.(1985). Achievement American Style: The rewards and costs of individualism. American
Psychologist, 40, pp 1285-1295.
Triandis, H. C. (1980). Introduction. In H. C. Triandis & W. W. Lambert (Eds.), Handbook of cross-cultural
psychology (Vol. 1). Boston: Allyn & Bacon.
Triandis, H.C. (1994). Culture and social behavior .New York: McGraw Hill.
Triandis, H.C. (1995). Individualism and collectivism. Boulder, Co: West View Press.
Dr R B N Sinha is Professor and Head of the Department of Psychology, B.S. College, Danapur,
Patna, India. E mail:[email protected]
Dr Arif Hassan is Professor at the Department of Business Administration, Faculty of Economics &
Management Sciences, International Islamic University Malaysia. E mail: [email protected]