Embed Size (px)
Citation preview

RespiratoryVolumes & Capacities
2/1/00
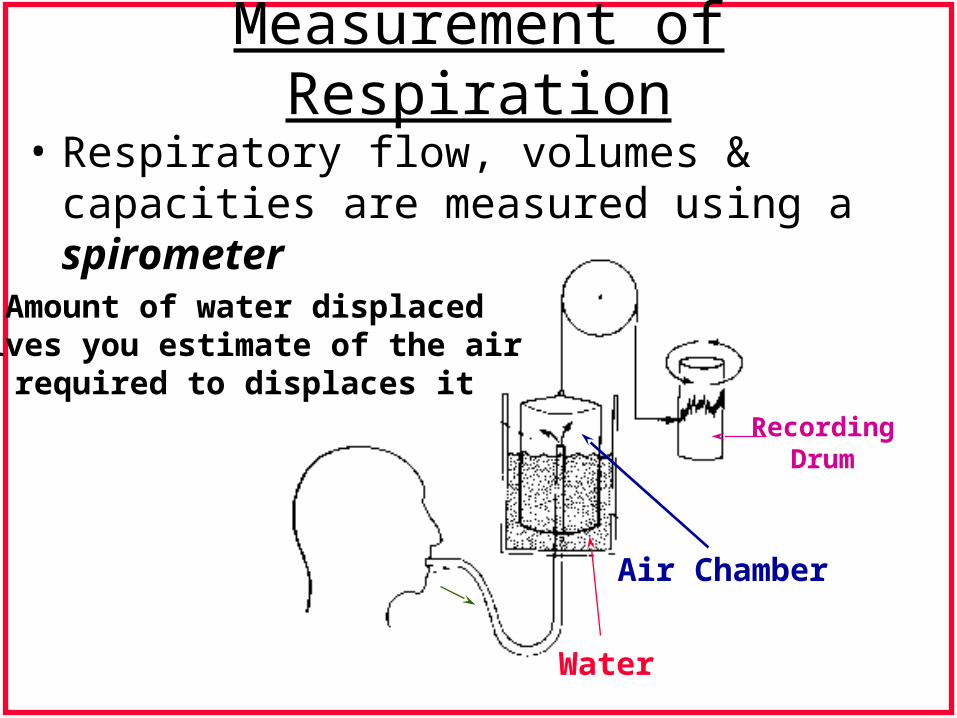
Measurement of Respiration
• Respiratory flow, volumes & capacities are measured using a spirometer
Amount of water displacedgives you estimate of the air
required to displaces it
Air Chamber
Water
RecordingDrum

Spirometry
• The measurement of air volumes and
capacities
– Volume: subdivision of the total amount of
air that can be contained in the lungs
– Capacity: Sum of two or more volumes

Spirometer

Respiratory Volumes
Total Capacity
Vital Capacity
ResidualVolume
Inspiratory Volume Reserve
Tidal Volume
Expiratory Volume Reserve
ResidualVolume
Per
cen
t V
ital
Cap
acit
y

Tot
al L
un
g C
apac
ity
TidalVolume
InspiratoryCapacity
Vit
al
Cap
acit
y
Expiratory Reserve Volume
Inspiratory Reserve Volume
Tidal Volume(Increasing Activity)
Residual VolumeResting
ExpiratoryLevel
FunctionalResidualCapacity
Spirometer for measuringrespiratory volume

Measurement of Respiration
cm H2OManometer
-Measures Pressure; more force used the higher the water rises

Respiration for Life• Quiet respiration
– Economy of effort
– Minimum departure from the resting volume
– Relaxed balance exists between tendencies of thorax expansion & lung collapse
– Balance is typically at 35-40% of vital capacity (amount available for use)
– Quiet inspiration= the volume of air that can be inhaled from a resting level with muscle contraction
– Quiet expiration= Passive process by elastic recoil of lungs & abdomen

Quiet Respiration
40%
Insp.60%
Exp.
Resting TidalVolume
Resting Volume
0
40
Per
cen
t of
Vit
al C
apac
ity
*Volume of air move called resting tidal volume

Vital Capacity based on Age & Gender
Male
Female
VC
(m
l)
Age (Years)

Typical Respiratory Volumes & Capacities in Adults
Volume/Capacity Males (cc)Females (cc) Average (in cc)
VC 4800 cc3200 cc 4000 cc
TLC 6000 cc4800 cc 5100 cc
Resting TV 600 cc450cc 525cc
Males: VC in ml= 27.63- (0.112 x age in years) x ht.in cm
Females: VC in ml= 21.78- (0.101 x age in years) x ht.in cm

Breathing for Speech
• Same respiratory equipment and measures of air volume &lung capacity apply for speech breathing
• Difference? How & Why they are used!– Life- Objective to move O2 & CO2 in & out of
lungs• resistance interferes
– Speech- Objective to have air under pressure; force vocal folds to vibrate• Achieve pressure by resisting airflow

Passive & Active Forces
• Active Forces = Muscles (Rib Cage, Abdomen, diaphragm)
• Passive Forces = Generated by elastic properties of respiratory tissue (lungs, muscles, tendons) when returning to rest

Lung
Chest Wall
High
Low
FRC
Lung Volume
Vit
al C
apac
ity
(%)
Alveolar pressure (cm H20)
Recoil Properties of Chest wall & Lung
Relaxation Pressure Curve

Recoil: Chest Wall & Lung
• High LV = Both chest wall & lung collapse due to extension beyond rest
• 50% VC = Chest wall is neutral, but lungs tend to collapse
• FRC = Tendency of expansion of chest wall is equal to opposite tendency of lungs to collapse
• Low LV = Chest wall tends to expand & lungs tend to collapse

Relaxation-Pressure Curve
• Passive conditions- absence of muscular effort
• Passive alveolar pressures generated at a particular
lung volume
– High LV = combined recoil forces contribute to high
alveolar pressure
– 38% LV = Equilibrium; alveolar pressure is 0
– 38% & below = relaxation pressure is negative
(alveolar pressure less than atmospheric); inspiratory
forces are passive

Vit
al C
apac
ity
(%)
Alveolar Pressure (cm H20)
IPRP EP
Pressure- Volume Diagram

Flow Volume Loop
• Relation between rate of airflow & LVfor inspiration & expiration.
• Expiration phase indicates peak exp.flow rate achievedat low LV (30%)
• Peak rate of airflowis greater for expiration

Respiratory Kinematics

Introduction
• Dynamic aspects of the chest wall function during speech via motion of the chest wall
• Measuring changes in the anteroposterior diameters (RC & AB)
• Motions of RC, AB & Diaphragm sum to match movements of the lung (LV can be determined)
• Individual volume displacements of RC & AB
• Contributions to LV from RC & AB

Magnetometer Position

Method
• Equipment:– Rib cage & abdominal magnetometers
• Two generator-sensor coil pairs
– Catheter-balloon techniques• esophageal & gastric pressures
• Measurements:– made in supine and upright positions– VC– Isovolume maneuvers at specified LV’s (20% VC)
• Created relaxation curve

Method
• Utterances:– Sustained production of /a/
• At 130 Hz
• 3 loudness levels- soft, comfortable, loud
– Repeated syllable task /pa/ • 4 per/second
• 3 loudness levels- soft, comfortable, loud
– Spontaneous conversation
– Normal reading “The Rainbow Passage”

Results
• Motion Diagrams:– Left of relaxation = pressures operating to make
RC larger &AB smaller
– Right of relaxation = pressures operating to make RC smaller & AB larger compared to relaxation

Motion Diagram: Relaxation

Sustained Vowel & Syllable Repetition
•High lung volumes for initiation•Chest wall configuration different than relaxation
•RC expanded more than AB during speech (left of relaxation)
•RC larger than AB for loud productions

Relative Motion Charts: Supine
•Both RC & AB decrease in LV
•Majority of volume change above FRC
•Gravity acts on RC & AB in expiratory position

Discussion
• Regulation of alveolar pressure in accordance with the demands of the utterance– Accomplished by adding muscular pressure
• Chest wall exerted increasingly more positive effort as lung volume decreased– Decreased passive recoil from relaxation pressure
means more active muscular forces are necessary
• Louder speech– Higher lung volumes (relaxation pressure high)