Embed Size (px)
Citation preview
Case Study: Timor-Leste
April 2017
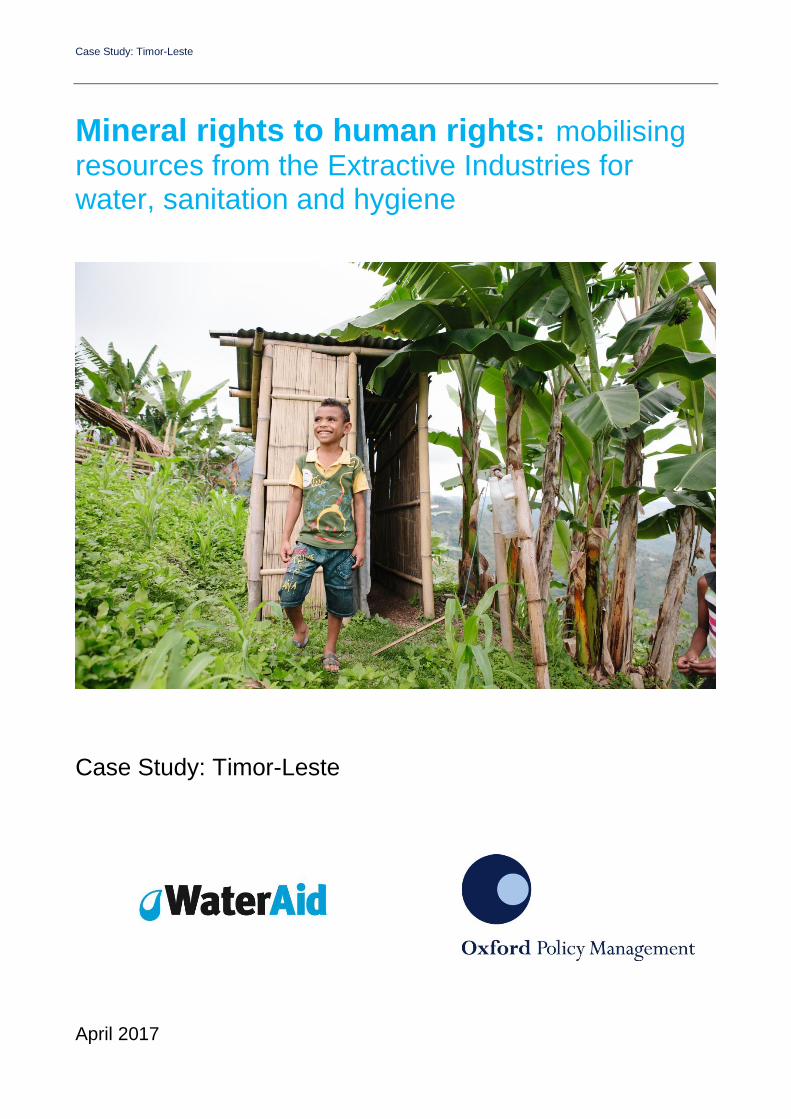
Mineral rights to human rights: mobilising resources from the Extractive Industries for water, sanitation and hygiene
Case Study: Timor-Leste
Case Study: Timor-Leste
2
Table of Contents
Table of Contents 2
1. Introduction 4
2. The Extractive Sector 5
2.2 Overview of the Extractive Sector 5 2.2 Legal and Institutional Framework Governing the Extractive Industry 6 2.3 The Role of the Extractive Sector in the Economy 8
3. Revenue Management and Collection 10
3.1 Non Petroleum Revenues 11 3.2 Petroleum revenues 11
4. Budget Analysis 18
4.1 Sources and Spending of the Annual State Budget 18 4.2 The WASH sector in Timor-Leste 21
5. Conclusions and Recommendations 28
Bibliography 31
Annex 32
This report was written by Laura Giles Álvarez (OPM) with contributions from Alex Grumbley, John Garrett, Stuart Kempster and Stephanie Lyons (all from WaterAid). This is one of a series of six case studies considering this issue.
Cover photo: Francisco, 8, outside a WaterAid latrine, Boroluli, Hatululi, Suco Lohidahar, Liquica district, Timor Leste, 2013. WaterAid/ Tom Greenwood.
Case Study: Timor-Leste
3
Acronyms and Abbreviations
ADB Asian Development Bank ADN Agencia Nacional de Desenvolvimento ANP Autoridade Nacional do Petróleo AusAid Australian Aid (now DFAT) BCTL Central Bank Timor-Leste BESIK Bee, Saneamentu no Ijiene iha Komunidade CFTL Consolidated Fund Timor-Leste CMAT Certain Maritime Arrangements DFAT Department for Foreign Affairs and Trade DNSA Direccão Naçional Saneamentu e Agua EC European Commission EITI Extractive Industry Transparency Initiative ESI Estimated Sustainable Income GDP Gross Domestic Product GoTL Government of Timor-Leste GCF HCDF
Green Climate Fund Human Capital Development Fund
HDI Human Development Index IBRD/WB International Bank for Reconstruction and Development/ World Bank IF Infrastructure Fund IMF International Monetary Fund IUA International Unitisation Agreement JICA Japanese International Cooperation Agency JMP Joint Monitoring Programme JPDA Joint Petroleum Development Area KOICA Korea International Cooperation Agency MDG Millennium Development Goals MoF Ministry of Finance NGO Non-Governmental Organisation O&M Operations and Maintenance PDID Planu Dezenvolvimentu Integradu Distrital PF Petroleum Fund PNDS RDTL
Programa Nasional Dezenvolvimentu Suku Democratic Republic of Timor-Leste
SDG Sustainable Development Goal SDP Strategic Development Plan SEPFOPE Secretaria De Estado Para A Política De Formação Profissional e Emprego TLEA Timor-Leste Exclusive Area TSDA Timor Sea Dedicated Authority
UNDP United Nations Development Programme UNICEF United Nations International Children’s’ Emergency Fund UNTAET United Nations Transitional Administration in East Timor USAID United States Aid WASH Water, Sanitation and Hygiene
Case Study: Timor-Leste
4
1. Introduction
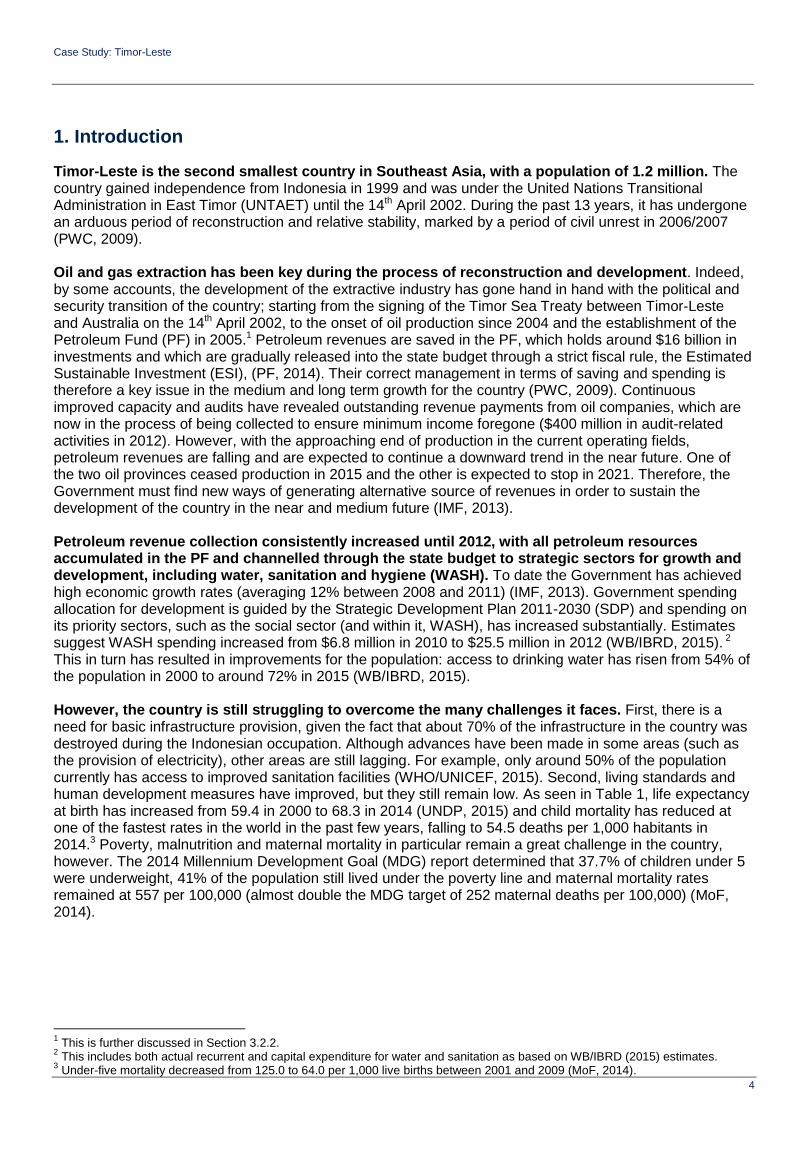
Timor-Leste is the second smallest country in Southeast Asia, with a population of 1.2 million. The country gained independence from Indonesia in 1999 and was under the United Nations Transitional Administration in East Timor (UNTAET) until the 14th April 2002. During the past 13 years, it has undergone an arduous period of reconstruction and relative stability, marked by a period of civil unrest in 2006/2007 (PWC, 2009). Oil and gas extraction has been key during the process of reconstruction and development. Indeed, by some accounts, the development of the extractive industry has gone hand in hand with the political and security transition of the country; starting from the signing of the Timor Sea Treaty between Timor-Leste and Australia on the 14th April 2002, to the onset of oil production since 2004 and the establishment of the Petroleum Fund (PF) in 2005.1 Petroleum revenues are saved in the PF, which holds around $16 billion in investments and which are gradually released into the state budget through a strict fiscal rule, the Estimated Sustainable Investment (ESI), (PF, 2014). Their correct management in terms of saving and spending is therefore a key issue in the medium and long term growth for the country (PWC, 2009). Continuous improved capacity and audits have revealed outstanding revenue payments from oil companies, which are now in the process of being collected to ensure minimum income foregone ($400 million in audit-related activities in 2012). However, with the approaching end of production in the current operating fields, petroleum revenues are falling and are expected to continue a downward trend in the near future. One of the two oil provinces ceased production in 2015 and the other is expected to stop in 2021. Therefore, the Government must find new ways of generating alternative source of revenues in order to sustain the development of the country in the near and medium future (IMF, 2013). Petroleum revenue collection consistently increased until 2012, with all petroleum resources accumulated in the PF and channelled through the state budget to strategic sectors for growth and development, including water, sanitation and hygiene (WASH). To date the Government has achieved high economic growth rates (averaging 12% between 2008 and 2011) (IMF, 2013). Government spending allocation for development is guided by the Strategic Development Plan 2011-2030 (SDP) and spending on its priority sectors, such as the social sector (and within it, WASH), has increased substantially. Estimates suggest WASH spending increased from $6.8 million in 2010 to $25.5 million in 2012 (WB/IBRD, 2015). 2 This in turn has resulted in improvements for the population: access to drinking water has risen from 54% of the population in 2000 to around 72% in 2015 (WB/IBRD, 2015). However, the country is still struggling to overcome the many challenges it faces. First, there is a need for basic infrastructure provision, given the fact that about 70% of the infrastructure in the country was destroyed during the Indonesian occupation. Although advances have been made in some areas (such as the provision of electricity), other areas are still lagging. For example, only around 50% of the population currently has access to improved sanitation facilities (WHO/UNICEF, 2015). Second, living standards and human development measures have improved, but they still remain low. As seen in Table 1, life expectancy at birth has increased from 59.4 in 2000 to 68.3 in 2014 (UNDP, 2015) and child mortality has reduced at one of the fastest rates in the world in the past few years, falling to 54.5 deaths per 1,000 habitants in 2014.3 Poverty, malnutrition and maternal mortality in particular remain a great challenge in the country, however. The 2014 Millennium Development Goal (MDG) report determined that 37.7% of children under 5 were underweight, 41% of the population still lived under the poverty line and maternal mortality rates remained at 557 per 100,000 (almost double the MDG target of 252 maternal deaths per 100,000) (MoF, 2014).
1 This is further discussed in Section 3.2.2.
2 This includes both actual recurrent and capital expenditure for water and sanitation as based on WB/IBRD (2015) estimates.
3 Under-five mortality decreased from 125.0 to 64.0 per 1,000 live births between 2001 and 2009 (MoF, 2014).
Case Study: Timor-Leste
5
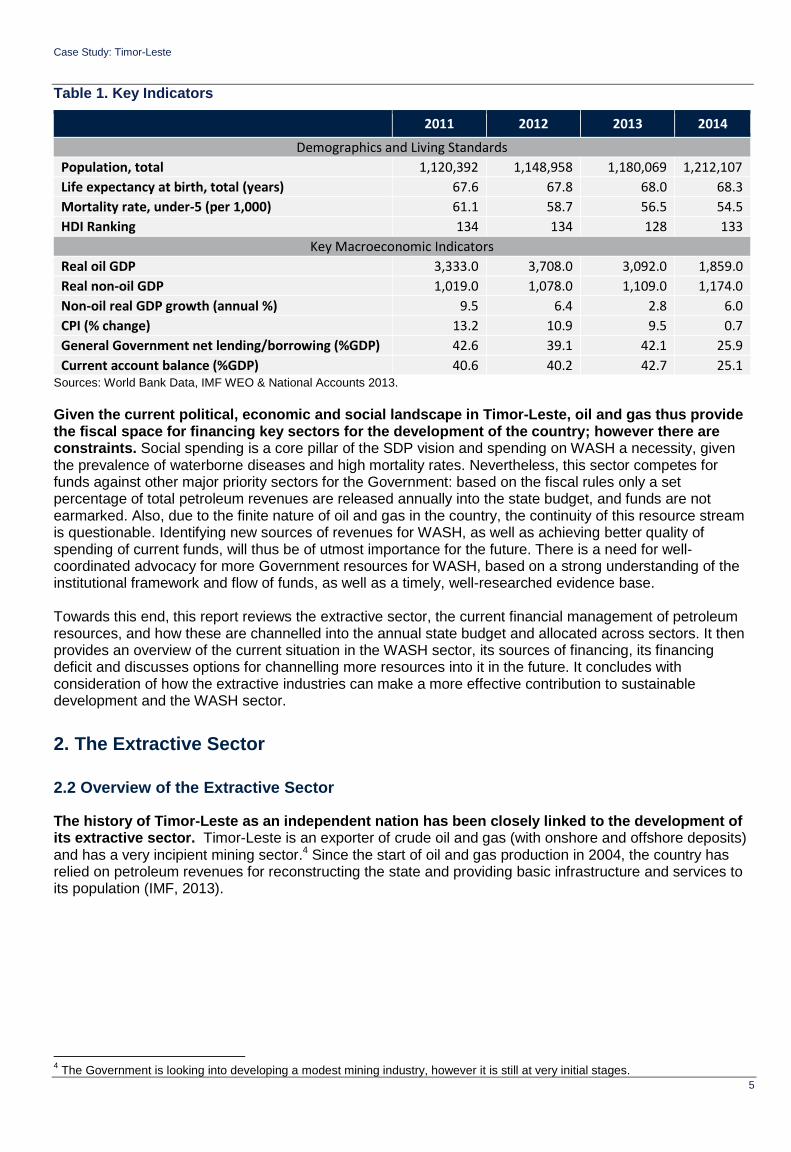
Table 1. Key Indicators
2011 2012 2013 2014
Demographics and Living Standards
Population, total 1,120,392 1,148,958 1,180,069 1,212,107
Life expectancy at birth, total (years) 67.6 67.8 68.0 68.3
Mortality rate, under-5 (per 1,000) 61.1 58.7 56.5 54.5
HDI Ranking 134 134 128 133
Key Macroeconomic Indicators
Real oil GDP 3,333.0 3,708.0 3,092.0 1,859.0
Real non-oil GDP 1,019.0 1,078.0 1,109.0 1,174.0
Non-oil real GDP growth (annual %) 9.5 6.4 2.8 6.0
CPI (% change) 13.2 10.9 9.5 0.7
General Government net lending/borrowing (%GDP) 42.6 39.1 42.1 25.9
Current account balance (%GDP) 40.6 40.2 42.7 25.1 Sources: World Bank Data, IMF WEO & National Accounts 2013.
Given the current political, economic and social landscape in Timor-Leste, oil and gas thus provide the fiscal space for financing key sectors for the development of the country; however there are constraints. Social spending is a core pillar of the SDP vision and spending on WASH a necessity, given the prevalence of waterborne diseases and high mortality rates. Nevertheless, this sector competes for funds against other major priority sectors for the Government: based on the fiscal rules only a set percentage of total petroleum revenues are released annually into the state budget, and funds are not earmarked. Also, due to the finite nature of oil and gas in the country, the continuity of this resource stream is questionable. Identifying new sources of revenues for WASH, as well as achieving better quality of spending of current funds, will thus be of utmost importance for the future. There is a need for well-coordinated advocacy for more Government resources for WASH, based on a strong understanding of the institutional framework and flow of funds, as well as a timely, well-researched evidence base. Towards this end, this report reviews the extractive sector, the current financial management of petroleum resources, and how these are channelled into the annual state budget and allocated across sectors. It then provides an overview of the current situation in the WASH sector, its sources of financing, its financing deficit and discusses options for channelling more resources into it in the future. It concludes with consideration of how the extractive industries can make a more effective contribution to sustainable development and the WASH sector.
2. The Extractive Sector
2.2 Overview of the Extractive Sector
The history of Timor-Leste as an independent nation has been closely linked to the development of its extractive sector. Timor-Leste is an exporter of crude oil and gas (with onshore and offshore deposits) and has a very incipient mining sector.4 Since the start of oil and gas production in 2004, the country has relied on petroleum revenues for reconstructing the state and providing basic infrastructure and services to its population (IMF, 2013).
4 The Government is looking into developing a modest mining industry, however it is still at very initial stages.
Case Study: Timor-Leste
6
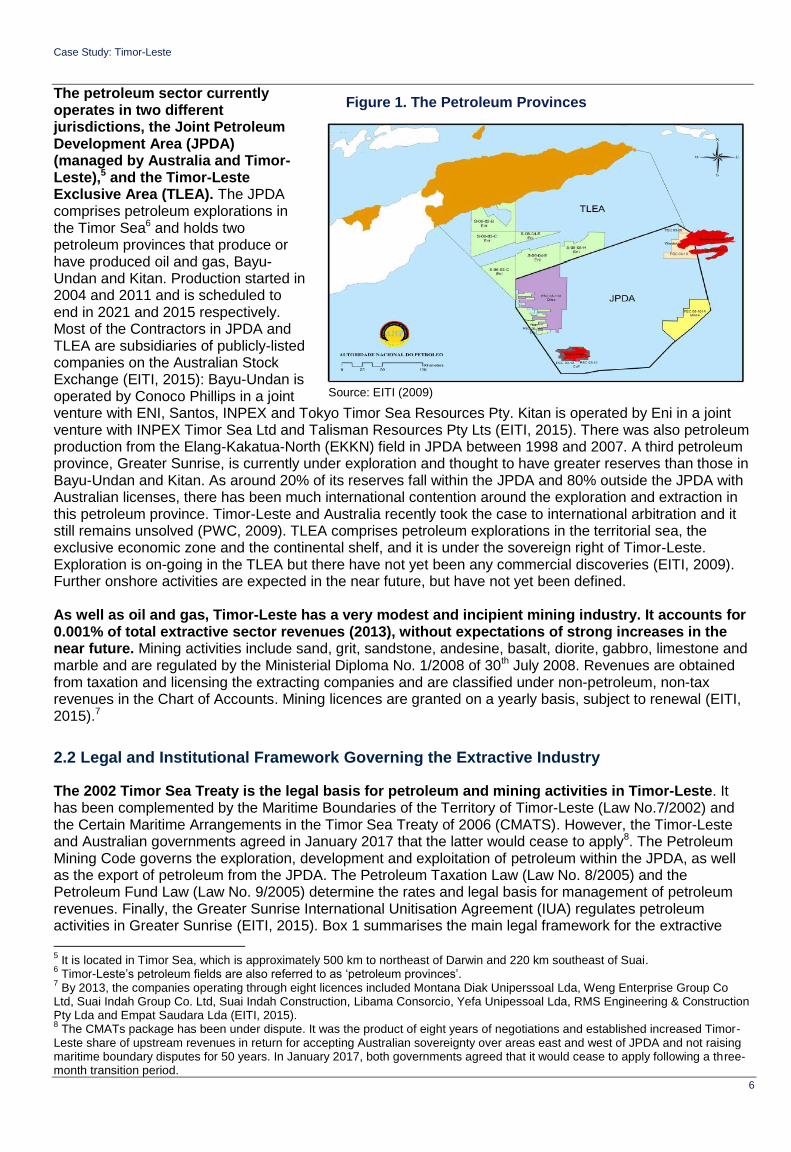
The petroleum sector currently operates in two different jurisdictions, the Joint Petroleum Development Area (JPDA) (managed by Australia and Timor-Leste),5 and the Timor-Leste Exclusive Area (TLEA). The JPDA comprises petroleum explorations in the Timor Sea6 and holds two petroleum provinces that produce or have produced oil and gas, Bayu-Undan and Kitan. Production started in 2004 and 2011 and is scheduled to end in 2021 and 2015 respectively. Most of the Contractors in JPDA and TLEA are subsidiaries of publicly-listed companies on the Australian Stock Exchange (EITI, 2015): Bayu-Undan is operated by Conoco Phillips in a joint venture with ENI, Santos, INPEX and Tokyo Timor Sea Resources Pty. Kitan is operated by Eni in a joint venture with INPEX Timor Sea Ltd and Talisman Resources Pty Lts (EITI, 2015). There was also petroleum production from the Elang-Kakatua-North (EKKN) field in JPDA between 1998 and 2007. A third petroleum province, Greater Sunrise, is currently under exploration and thought to have greater reserves than those in Bayu-Undan and Kitan. As around 20% of its reserves fall within the JPDA and 80% outside the JPDA with Australian licenses, there has been much international contention around the exploration and extraction in this petroleum province. Timor-Leste and Australia recently took the case to international arbitration and it still remains unsolved (PWC, 2009). TLEA comprises petroleum explorations in the territorial sea, the exclusive economic zone and the continental shelf, and it is under the sovereign right of Timor-Leste. Exploration is on-going in the TLEA but there have not yet been any commercial discoveries (EITI, 2009). Further onshore activities are expected in the near future, but have not yet been defined. As well as oil and gas, Timor-Leste has a very modest and incipient mining industry. It accounts for 0.001% of total extractive sector revenues (2013), without expectations of strong increases in the near future. Mining activities include sand, grit, sandstone, andesine, basalt, diorite, gabbro, limestone and marble and are regulated by the Ministerial Diploma No. 1/2008 of 30th July 2008. Revenues are obtained from taxation and licensing the extracting companies and are classified under non-petroleum, non-tax revenues in the Chart of Accounts. Mining licences are granted on a yearly basis, subject to renewal (EITI, 2015).7
2.2 Legal and Institutional Framework Governing the Extractive Industry
The 2002 Timor Sea Treaty is the legal basis for petroleum and mining activities in Timor-Leste. It has been complemented by the Maritime Boundaries of the Territory of Timor-Leste (Law No.7/2002) and the Certain Maritime Arrangements in the Timor Sea Treaty of 2006 (CMATS). However, the Timor-Leste and Australian governments agreed in January 2017 that the latter would cease to apply8. The Petroleum Mining Code governs the exploration, development and exploitation of petroleum within the JPDA, as well as the export of petroleum from the JPDA. The Petroleum Taxation Law (Law No. 8/2005) and the Petroleum Fund Law (Law No. 9/2005) determine the rates and legal basis for management of petroleum revenues. Finally, the Greater Sunrise International Unitisation Agreement (IUA) regulates petroleum activities in Greater Sunrise (EITI, 2015). Box 1 summarises the main legal framework for the extractive
5 It is located in Timor Sea, which is approximately 500 km to northeast of Darwin and 220 km southeast of Suai.
6 Timor-Leste’s petroleum fields are also referred to as ‘petroleum provinces’.
7 By 2013, the companies operating through eight licences included Montana Diak Uniperssoal Lda, Weng Enterprise Group Co
Ltd, Suai Indah Group Co. Ltd, Suai Indah Construction, Libama Consorcio, Yefa Unipessoal Lda, RMS Engineering & Construction Pty Lda and Empat Saudara Lda (EITI, 2015). 8 The CMATs package has been under dispute. It was the product of eight years of negotiations and established increased Timor-
Leste share of upstream revenues in return for accepting Australian sovereignty over areas east and west of JPDA and not raising maritime boundary disputes for 50 years. In January 2017, both governments agreed that it would cease to apply following a three-month transition period.
Figure 1. The Petroleum Provinces
Source: EITI (2009)
Case Study: Timor-Leste
7
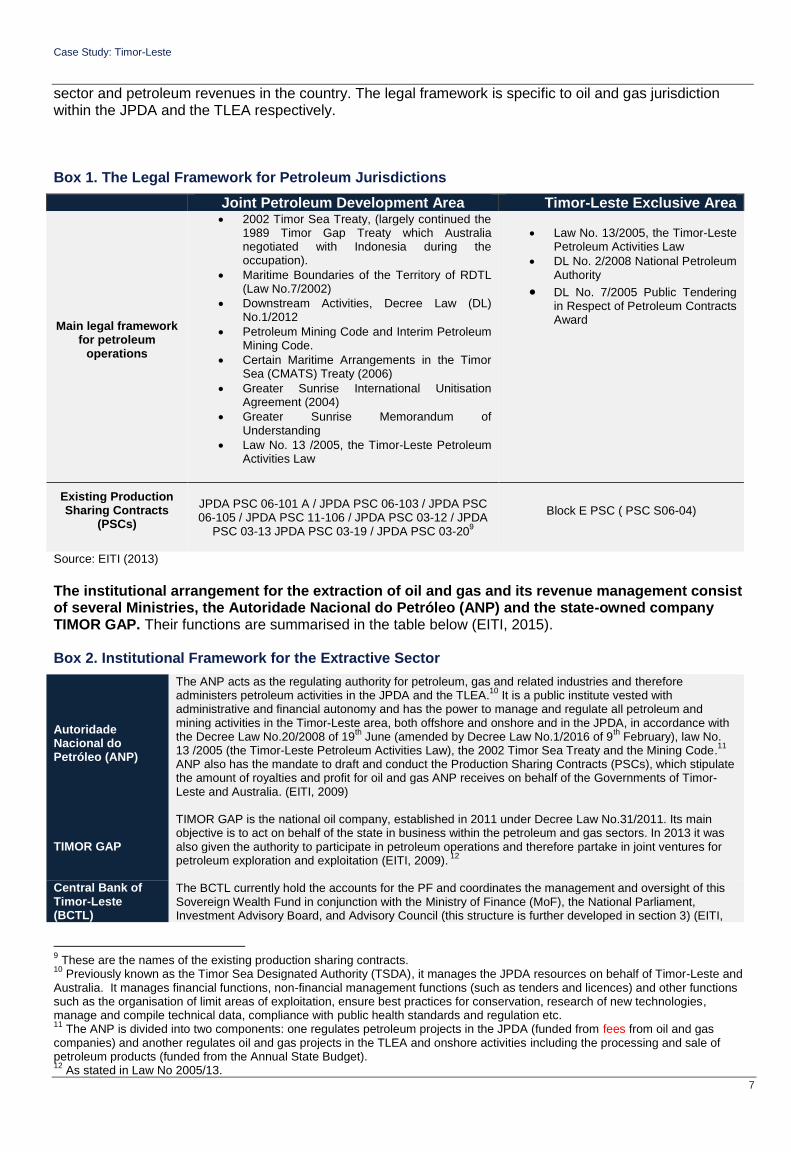
sector and petroleum revenues in the country. The legal framework is specific to oil and gas jurisdiction within the JPDA and the TLEA respectively. Box 1. The Legal Framework for Petroleum Jurisdictions
Joint Petroleum Development Area Timor-Leste Exclusive Area
Main legal framework for petroleum
operations
2002 Timor Sea Treaty, (largely continued the 1989 Timor Gap Treaty which Australia negotiated with Indonesia during the occupation).
Maritime Boundaries of the Territory of RDTL (Law No.7/2002)
Downstream Activities, Decree Law (DL) No.1/2012
Petroleum Mining Code and Interim Petroleum Mining Code.
Certain Maritime Arrangements in the Timor Sea (CMATS) Treaty (2006)
Greater Sunrise International Unitisation Agreement (2004)
Greater Sunrise Memorandum of Understanding
Law No. 13 /2005, the Timor-Leste Petroleum Activities Law
Law No. 13/2005, the Timor-Leste Petroleum Activities Law
DL No. 2/2008 National Petroleum Authority
DL No. 7/2005 Public Tendering in Respect of Petroleum Contracts Award
Existing Production Sharing Contracts
(PSCs)
JPDA PSC 06-101 A / JPDA PSC 06-103 / JPDA PSC 06-105 / JPDA PSC 11-106 / JPDA PSC 03-12 / JPDA
PSC 03-13 JPDA PSC 03-19 / JPDA PSC 03-209
Block E PSC ( PSC S06-04)
Source: EITI (2013)
The institutional arrangement for the extraction of oil and gas and its revenue management consist of several Ministries, the Autoridade Nacional do Petróleo (ANP) and the state-owned company TIMOR GAP. Their functions are summarised in the table below (EITI, 2015). Box 2. Institutional Framework for the Extractive Sector
Autoridade Nacional do Petróleo (ANP)
The ANP acts as the regulating authority for petroleum, gas and related industries and therefore administers petroleum activities in the JPDA and the TLEA.
10 It is a public institute vested with
administrative and financial autonomy and has the power to manage and regulate all petroleum and mining activities in the Timor-Leste area, both offshore and onshore and in the JPDA, in accordance with the Decree Law No.20/2008 of 19
th June (amended by Decree Law No.1/2016 of 9
th February), law No.
13 /2005 (the Timor-Leste Petroleum Activities Law), the 2002 Timor Sea Treaty and the Mining Code.11
ANP also has the mandate to draft and conduct the Production Sharing Contracts (PSCs), which stipulate the amount of royalties and profit for oil and gas ANP receives on behalf of the Governments of Timor-Leste and Australia. (EITI, 2009)
TIMOR GAP
TIMOR GAP is the national oil company, established in 2011 under Decree Law No.31/2011. Its main objective is to act on behalf of the state in business within the petroleum and gas sectors. In 2013 it was also given the authority to participate in petroleum operations and therefore partake in joint ventures for petroleum exploration and exploitation (EITI, 2009).
12
Central Bank of Timor-Leste (BCTL)
The BCTL currently hold the accounts for the PF and coordinates the management and oversight of this Sovereign Wealth Fund in conjunction with the Ministry of Finance (MoF), the National Parliament, Investment Advisory Board, and Advisory Council (this structure is further developed in section 3) (EITI,
9 These are the names of the existing production sharing contracts.
10 Previously known as the Timor Sea Designated Authority (TSDA), it manages the JPDA resources on behalf of Timor-Leste and
Australia. It manages financial functions, non-financial management functions (such as tenders and licences) and other functions such as the organisation of limit areas of exploitation, ensure best practices for conservation, research of new technologies, manage and compile technical data, compliance with public health standards and regulation etc. 11
The ANP is divided into two components: one regulates petroleum projects in the JPDA (funded from fees from oil and gas companies) and another regulates oil and gas projects in the TLEA and onshore activities including the processing and sale of petroleum products (funded from the Annual State Budget). 12
As stated in Law No 2005/13.
Case Study: Timor-Leste
8
2009).
Government of Timor-Leste Ministries
Several ministries also work with the oil and gas industry, including the Ministry of Finance (includes the National Directorate for Petroleum and Minerals Revenue, the National Directorate for Economic Policy and the Petroleum Fund Administration Unit), the Ministry of Petroleum and Mineral Resources and the Maritime Boundary Office.
2.3 The Role of the Extractive Sector in the Economy
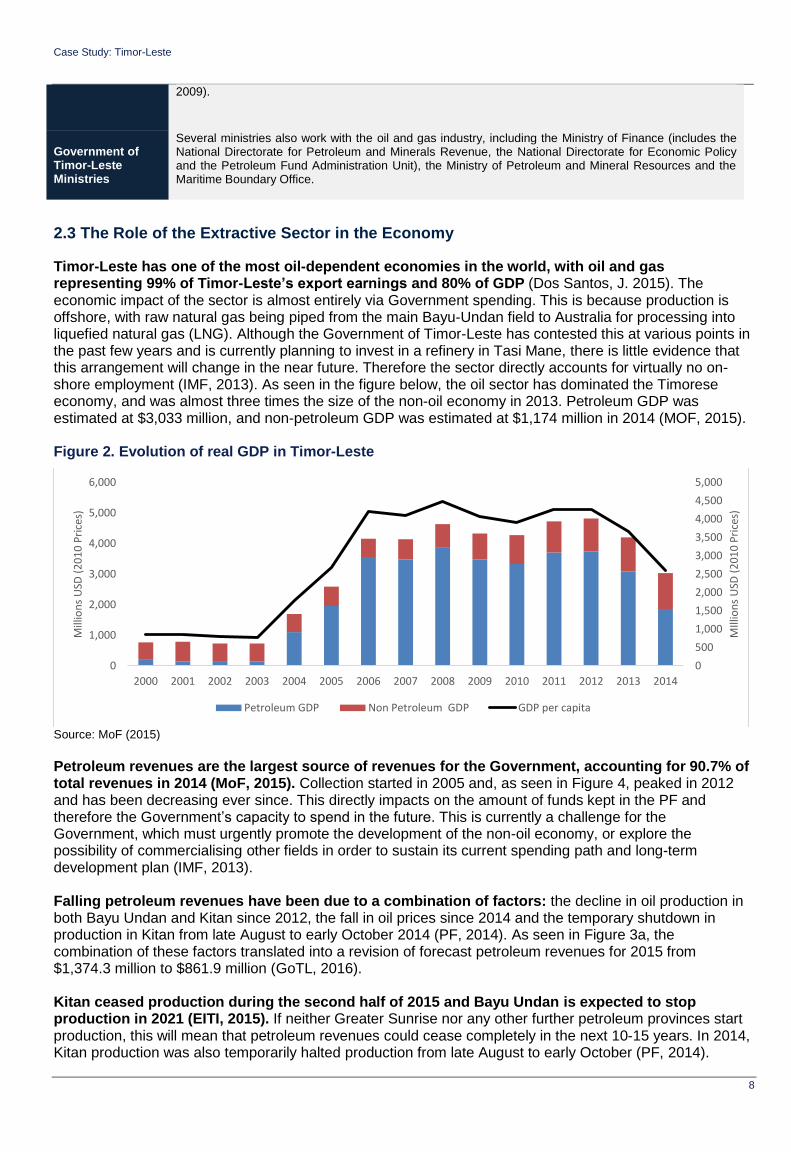
Timor-Leste has one of the most oil-dependent economies in the world, with oil and gas representing 99% of Timor-Leste’s export earnings and 80% of GDP (Dos Santos, J. 2015). The economic impact of the sector is almost entirely via Government spending. This is because production is offshore, with raw natural gas being piped from the main Bayu-Undan field to Australia for processing into liquefied natural gas (LNG). Although the Government of Timor-Leste has contested this at various points in the past few years and is currently planning to invest in a refinery in Tasi Mane, there is little evidence that this arrangement will change in the near future. Therefore the sector directly accounts for virtually no on-shore employment (IMF, 2013). As seen in the figure below, the oil sector has dominated the Timorese economy, and was almost three times the size of the non-oil economy in 2013. Petroleum GDP was estimated at $3,033 million, and non-petroleum GDP was estimated at $1,174 million in 2014 (MOF, 2015). Figure 2. Evolution of real GDP in Timor-Leste
Source: MoF (2015)
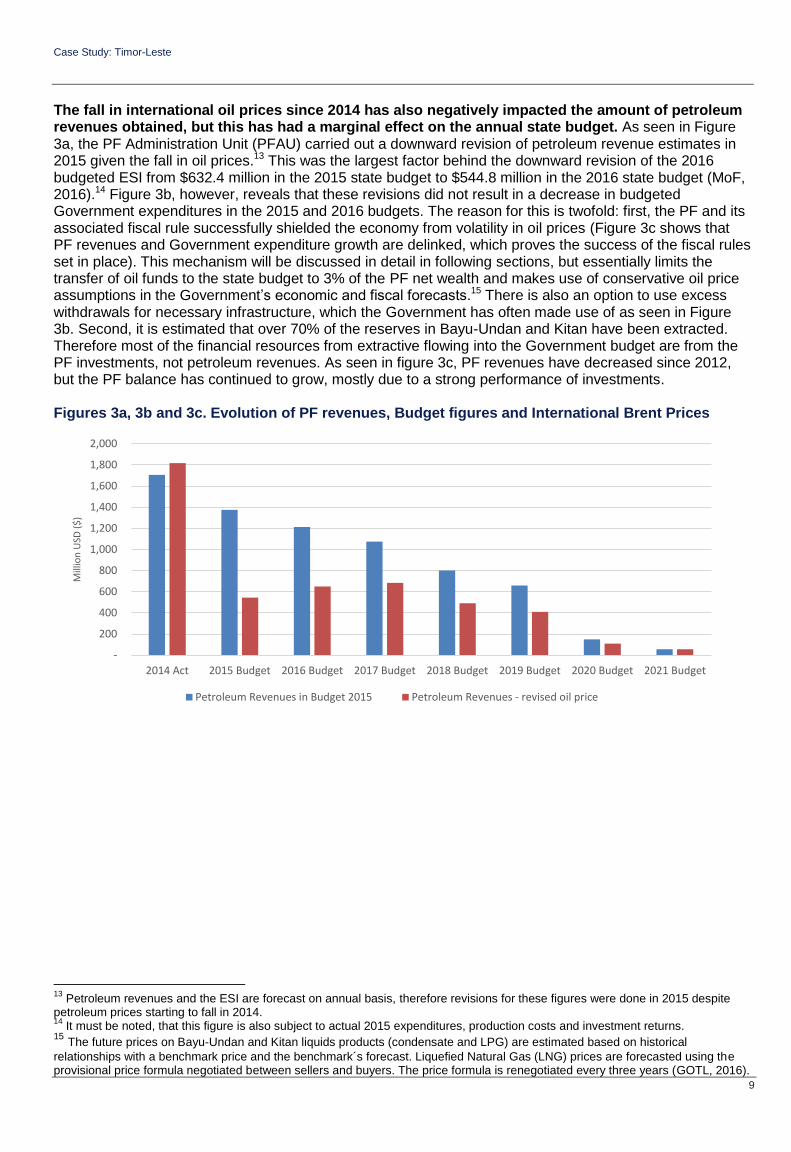
Petroleum revenues are the largest source of revenues for the Government, accounting for 90.7% of total revenues in 2014 (MoF, 2015). Collection started in 2005 and, as seen in Figure 4, peaked in 2012 and has been decreasing ever since. This directly impacts on the amount of funds kept in the PF and therefore the Government’s capacity to spend in the future. This is currently a challenge for the Government, which must urgently promote the development of the non-oil economy, or explore the possibility of commercialising other fields in order to sustain its current spending path and long-term development plan (IMF, 2013). Falling petroleum revenues have been due to a combination of factors: the decline in oil production in both Bayu Undan and Kitan since 2012, the fall in oil prices since 2014 and the temporary shutdown in production in Kitan from late August to early October 2014 (PF, 2014). As seen in Figure 3a, the combination of these factors translated into a revision of forecast petroleum revenues for 2015 from $1,374.3 million to $861.9 million (GoTL, 2016). Kitan ceased production during the second half of 2015 and Bayu Undan is expected to stop production in 2021 (EITI, 2015). If neither Greater Sunrise nor any other further petroleum provinces start production, this will mean that petroleum revenues could cease completely in the next 10-15 years. In 2014, Kitan production was also temporarily halted production from late August to early October (PF, 2014).
0
500
1,000
1,500
2,000
2,500
3,000
3,500
4,000
4,500
5,000
0
1,000
2,000
3,000
4,000
5,000
6,000
2000 2001 2002 2003 2004 2005 2006 2007 2008 2009 2010 2011 2012 2013 2014
MIll
ion
s U
SD (
20
10
Pri
ces)
Mill
ion
s U
SD (
20
10
Pri
ces)
Petroleum GDP Non Petroleum GDP GDP per capita
Case Study: Timor-Leste
9
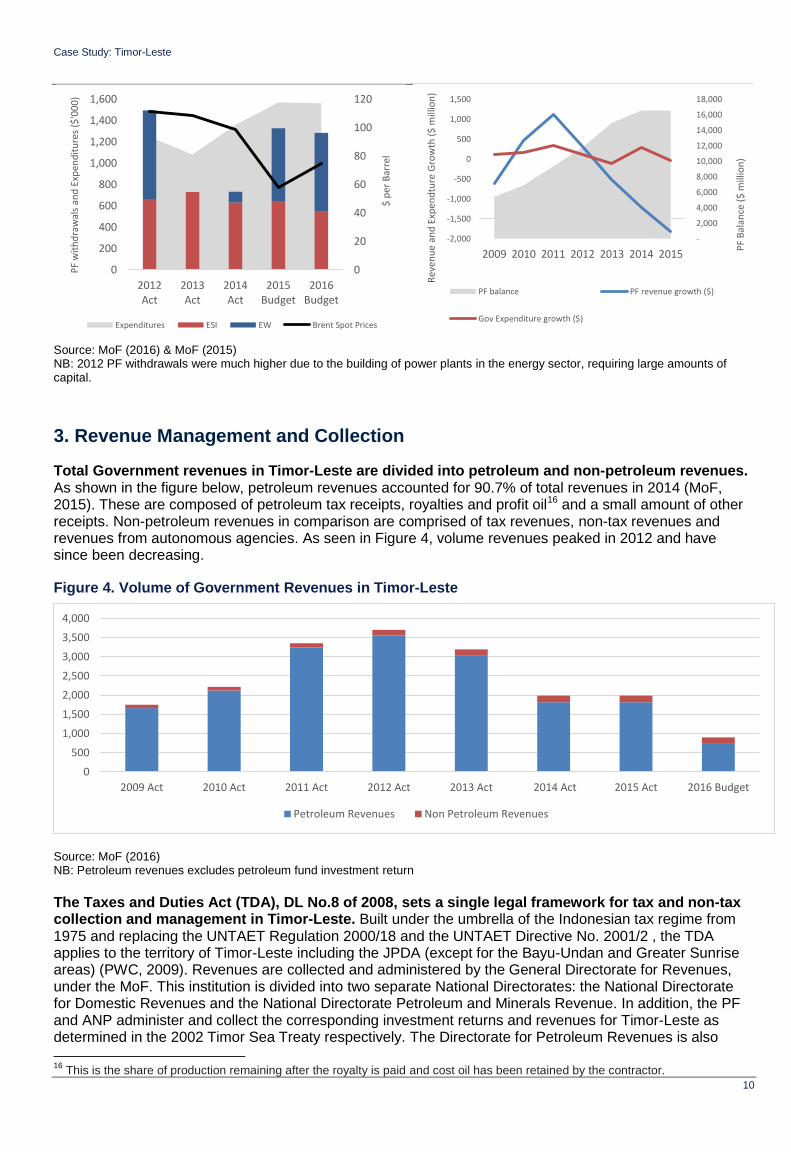
The fall in international oil prices since 2014 has also negatively impacted the amount of petroleum revenues obtained, but this has had a marginal effect on the annual state budget. As seen in Figure 3a, the PF Administration Unit (PFAU) carried out a downward revision of petroleum revenue estimates in 2015 given the fall in oil prices.13 This was the largest factor behind the downward revision of the 2016 budgeted ESI from $632.4 million in the 2015 state budget to $544.8 million in the 2016 state budget (MoF, 2016).14 Figure 3b, however, reveals that these revisions did not result in a decrease in budgeted Government expenditures in the 2015 and 2016 budgets. The reason for this is twofold: first, the PF and its associated fiscal rule successfully shielded the economy from volatility in oil prices (Figure 3c shows that PF revenues and Government expenditure growth are delinked, which proves the success of the fiscal rules set in place). This mechanism will be discussed in detail in following sections, but essentially limits the transfer of oil funds to the state budget to 3% of the PF net wealth and makes use of conservative oil price assumptions in the Government’s economic and fiscal forecasts.15 There is also an option to use excess withdrawals for necessary infrastructure, which the Government has often made use of as seen in Figure 3b. Second, it is estimated that over 70% of the reserves in Bayu-Undan and Kitan have been extracted. Therefore most of the financial resources from extractive flowing into the Government budget are from the PF investments, not petroleum revenues. As seen in figure 3c, PF revenues have decreased since 2012, but the PF balance has continued to grow, mostly due to a strong performance of investments. Figures 3a, 3b and 3c. Evolution of PF revenues, Budget figures and International Brent Prices
13
Petroleum revenues and the ESI are forecast on annual basis, therefore revisions for these figures were done in 2015 despite petroleum prices starting to fall in 2014. 14
It must be noted, that this figure is also subject to actual 2015 expenditures, production costs and investment returns. 15 The future prices on Bayu-Undan and Kitan liquids products (condensate and LPG) are estimated based on historical
relationships with a benchmark price and the benchmark´s forecast. Liquefied Natural Gas (LNG) prices are forecasted using the provisional price formula negotiated between sellers and buyers. The price formula is renegotiated every three years (GOTL, 2016).
-
200
400
600
800
1,000
1,200
1,400
1,600
1,800
2,000
2014 Act 2015 Budget 2016 Budget 2017 Budget 2018 Budget 2019 Budget 2020 Budget 2021 Budget
Mill
ion
USD
($
)
Petroleum Revenues in Budget 2015 Petroleum Revenues - revised oil price
Case Study: Timor-Leste
10
Source: MoF (2016) & MoF (2015) NB: 2012 PF withdrawals were much higher due to the building of power plants in the energy sector, requiring large amounts of capital.
3. Revenue Management and Collection
Total Government revenues in Timor-Leste are divided into petroleum and non-petroleum revenues. As shown in the figure below, petroleum revenues accounted for 90.7% of total revenues in 2014 (MoF, 2015). These are composed of petroleum tax receipts, royalties and profit oil16 and a small amount of other receipts. Non-petroleum revenues in comparison are comprised of tax revenues, non-tax revenues and revenues from autonomous agencies. As seen in Figure 4, volume revenues peaked in 2012 and have since been decreasing.
Figure 4. Volume of Government Revenues in Timor-Leste
Source: MoF (2016) NB: Petroleum revenues excludes petroleum fund investment return
The Taxes and Duties Act (TDA), DL No.8 of 2008, sets a single legal framework for tax and non-tax collection and management in Timor-Leste. Built under the umbrella of the Indonesian tax regime from 1975 and replacing the UNTAET Regulation 2000/18 and the UNTAET Directive No. 2001/2 , the TDA applies to the territory of Timor-Leste including the JPDA (except for the Bayu-Undan and Greater Sunrise areas) (PWC, 2009). Revenues are collected and administered by the General Directorate for Revenues, under the MoF. This institution is divided into two separate National Directorates: the National Directorate for Domestic Revenues and the National Directorate Petroleum and Minerals Revenue. In addition, the PF and ANP administer and collect the corresponding investment returns and revenues for Timor-Leste as determined in the 2002 Timor Sea Treaty respectively. The Directorate for Petroleum Revenues is also
16
This is the share of production remaining after the royalty is paid and cost oil has been retained by the contractor.
0
20
40
60
80
100
120
0
200
400
600
800
1,000
1,200
1,400
1,600
2012Act
2013Act
2014Act
2015Budget
2016Budget
$ p
er B
arre
l
PF
wit
hd
raw
als
and
Exp
end
itu
res
($'0
00
)
Expenditures ESI EW Brent Spot Prices
-
2,000
4,000
6,000
8,000
10,000
12,000
14,000
16,000
18,000
-2,000
-1,500
-1,000
-500
0
500
1,000
1,500
2009 2010 2011 2012 2013 2014 2015
PF
Bal
ance
($
mill
ion
)
Rev
enu
e an
d E
xpen
dtu
re G
row
th (
$ m
illio
n)
PF balance PF revenue growth ($)
Gov Expenditure growth ($)
0
500
1,000
1,500
2,000
2,500
3,000
3,500
4,000
2009 Act 2010 Act 2011 Act 2012 Act 2013 Act 2014 Act 2015 Act 2016 Budget
Petroleum Revenues Non Petroleum Revenues
Case Study: Timor-Leste
11
responsible for conducting tax audits, although these have been hampered by the recent disputes with Australia over the petroleum revenues.
3.1 Non-Petroleum Revenues
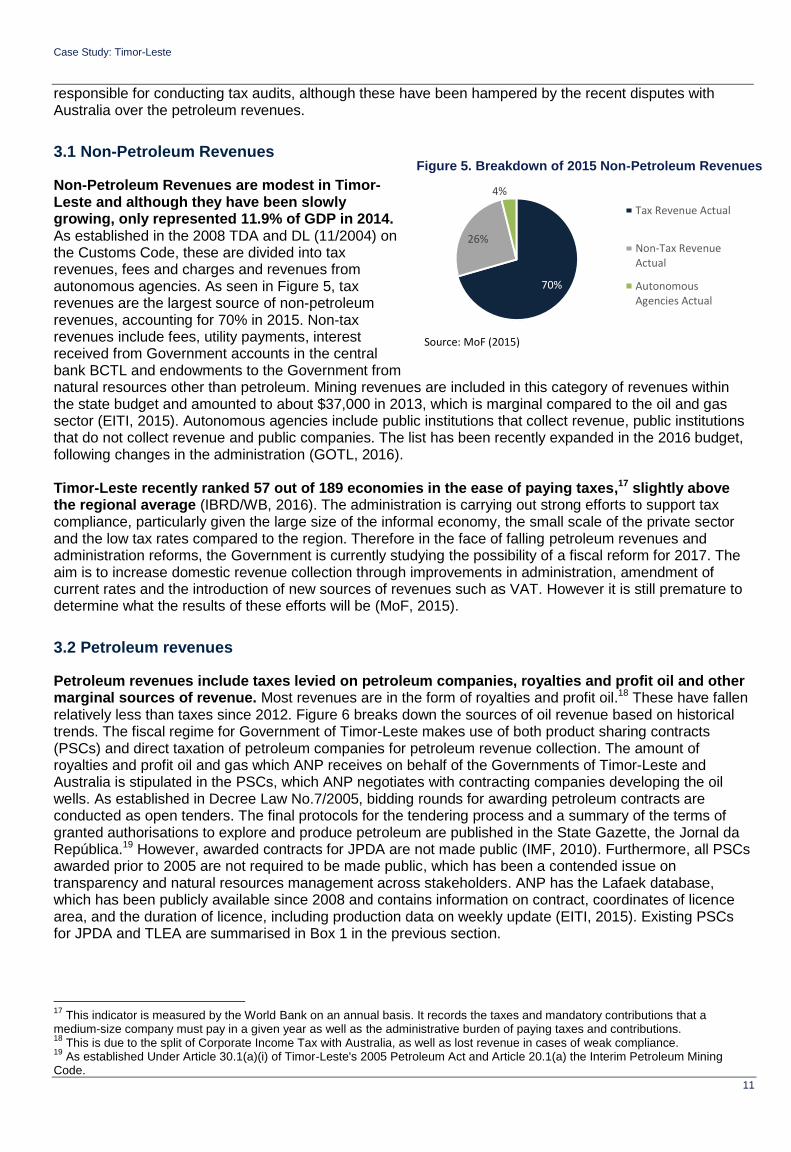
Non-Petroleum Revenues are modest in Timor-Leste and although they have been slowly growing, only represented 11.9% of GDP in 2014. As established in the 2008 TDA and DL (11/2004) on the Customs Code, these are divided into tax revenues, fees and charges and revenues from autonomous agencies. As seen in Figure 5, tax revenues are the largest source of non-petroleum revenues, accounting for 70% in 2015. Non-tax revenues include fees, utility payments, interest received from Government accounts in the central bank BCTL and endowments to the Government from natural resources other than petroleum. Mining revenues are included in this category of revenues within the state budget and amounted to about $37,000 in 2013, which is marginal compared to the oil and gas sector (EITI, 2015). Autonomous agencies include public institutions that collect revenue, public institutions that do not collect revenue and public companies. The list has been recently expanded in the 2016 budget, following changes in the administration (GOTL, 2016). Timor-Leste recently ranked 57 out of 189 economies in the ease of paying taxes,17 slightly above the regional average (IBRD/WB, 2016). The administration is carrying out strong efforts to support tax compliance, particularly given the large size of the informal economy, the small scale of the private sector and the low tax rates compared to the region. Therefore in the face of falling petroleum revenues and administration reforms, the Government is currently studying the possibility of a fiscal reform for 2017. The aim is to increase domestic revenue collection through improvements in administration, amendment of current rates and the introduction of new sources of revenues such as VAT. However it is still premature to determine what the results of these efforts will be (MoF, 2015).
3.2 Petroleum revenues
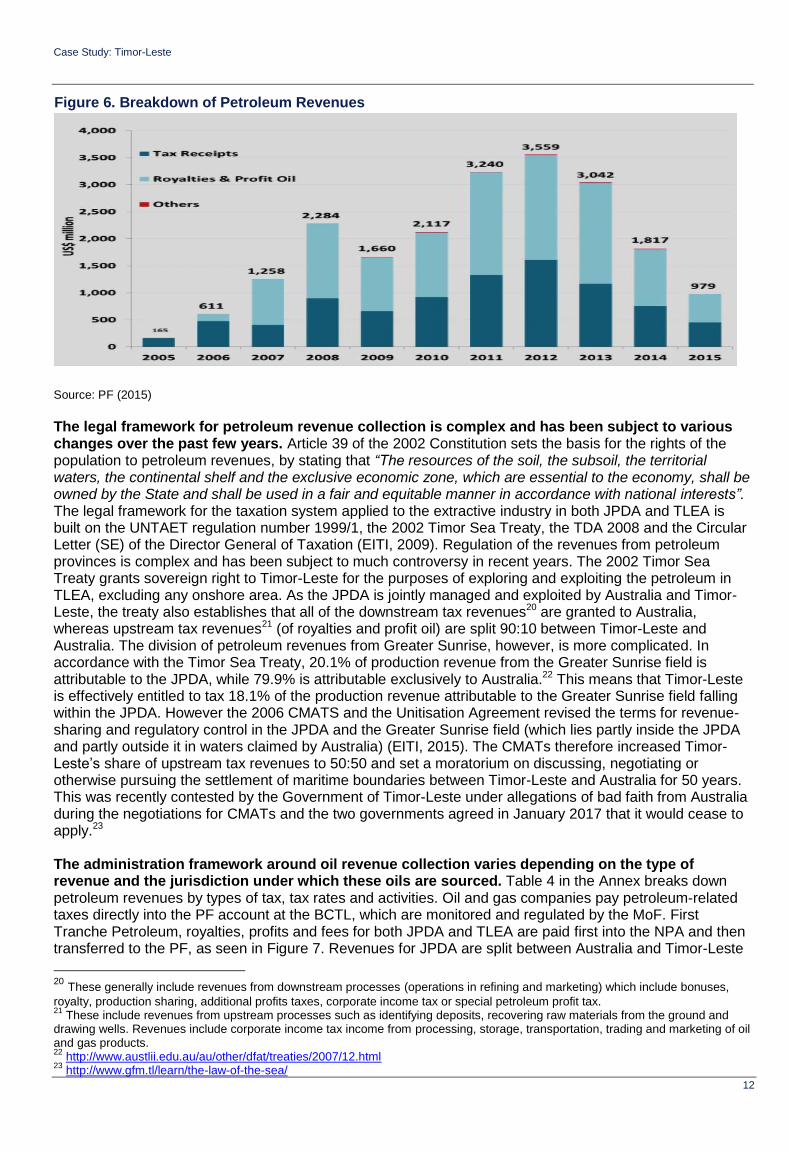
Petroleum revenues include taxes levied on petroleum companies, royalties and profit oil and other marginal sources of revenue. Most revenues are in the form of royalties and profit oil.18 These have fallen relatively less than taxes since 2012. Figure 6 breaks down the sources of oil revenue based on historical trends. The fiscal regime for Government of Timor-Leste makes use of both product sharing contracts (PSCs) and direct taxation of petroleum companies for petroleum revenue collection. The amount of royalties and profit oil and gas which ANP receives on behalf of the Governments of Timor-Leste and Australia is stipulated in the PSCs, which ANP negotiates with contracting companies developing the oil wells. As established in Decree Law No.7/2005, bidding rounds for awarding petroleum contracts are conducted as open tenders. The final protocols for the tendering process and a summary of the terms of granted authorisations to explore and produce petroleum are published in the State Gazette, the Jornal da República.19 However, awarded contracts for JPDA are not made public (IMF, 2010). Furthermore, all PSCs awarded prior to 2005 are not required to be made public, which has been a contended issue on transparency and natural resources management across stakeholders. ANP has the Lafaek database, which has been publicly available since 2008 and contains information on contract, coordinates of licence area, and the duration of licence, including production data on weekly update (EITI, 2015). Existing PSCs for JPDA and TLEA are summarised in Box 1 in the previous section.
17
This indicator is measured by the World Bank on an annual basis. It records the taxes and mandatory contributions that a medium-size company must pay in a given year as well as the administrative burden of paying taxes and contributions. 18
This is due to the split of Corporate Income Tax with Australia, as well as lost revenue in cases of weak compliance. 19
As established Under Article 30.1(a)(i) of Timor-Leste's 2005 Petroleum Act and Article 20.1(a) the Interim Petroleum Mining Code.
70%
26%
4%
Tax Revenue Actual
Non-Tax RevenueActual
AutonomousAgencies Actual
Source: MoF (2015)
Figure 5. Breakdown of 2015 Non-Petroleum Revenues
Case Study: Timor-Leste
12
Source: PF (2015)
The legal framework for petroleum revenue collection is complex and has been subject to various changes over the past few years. Article 39 of the 2002 Constitution sets the basis for the rights of the population to petroleum revenues, by stating that “The resources of the soil, the subsoil, the territorial waters, the continental shelf and the exclusive economic zone, which are essential to the economy, shall be owned by the State and shall be used in a fair and equitable manner in accordance with national interests”. The legal framework for the taxation system applied to the extractive industry in both JPDA and TLEA is built on the UNTAET regulation number 1999/1, the 2002 Timor Sea Treaty, the TDA 2008 and the Circular Letter (SE) of the Director General of Taxation (EITI, 2009). Regulation of the revenues from petroleum provinces is complex and has been subject to much controversy in recent years. The 2002 Timor Sea Treaty grants sovereign right to Timor-Leste for the purposes of exploring and exploiting the petroleum in TLEA, excluding any onshore area. As the JPDA is jointly managed and exploited by Australia and Timor-Leste, the treaty also establishes that all of the downstream tax revenues20 are granted to Australia, whereas upstream tax revenues21 (of royalties and profit oil) are split 90:10 between Timor-Leste and Australia. The division of petroleum revenues from Greater Sunrise, however, is more complicated. In accordance with the Timor Sea Treaty, 20.1% of production revenue from the Greater Sunrise field is attributable to the JPDA, while 79.9% is attributable exclusively to Australia.22 This means that Timor-Leste is effectively entitled to tax 18.1% of the production revenue attributable to the Greater Sunrise field falling within the JPDA. However the 2006 CMATS and the Unitisation Agreement revised the terms for revenue-sharing and regulatory control in the JPDA and the Greater Sunrise field (which lies partly inside the JPDA and partly outside it in waters claimed by Australia) (EITI, 2015). The CMATs therefore increased Timor-Leste’s share of upstream tax revenues to 50:50 and set a moratorium on discussing, negotiating or otherwise pursuing the settlement of maritime boundaries between Timor-Leste and Australia for 50 years. This was recently contested by the Government of Timor-Leste under allegations of bad faith from Australia during the negotiations for CMATs and the two governments agreed in January 2017 that it would cease to apply.23
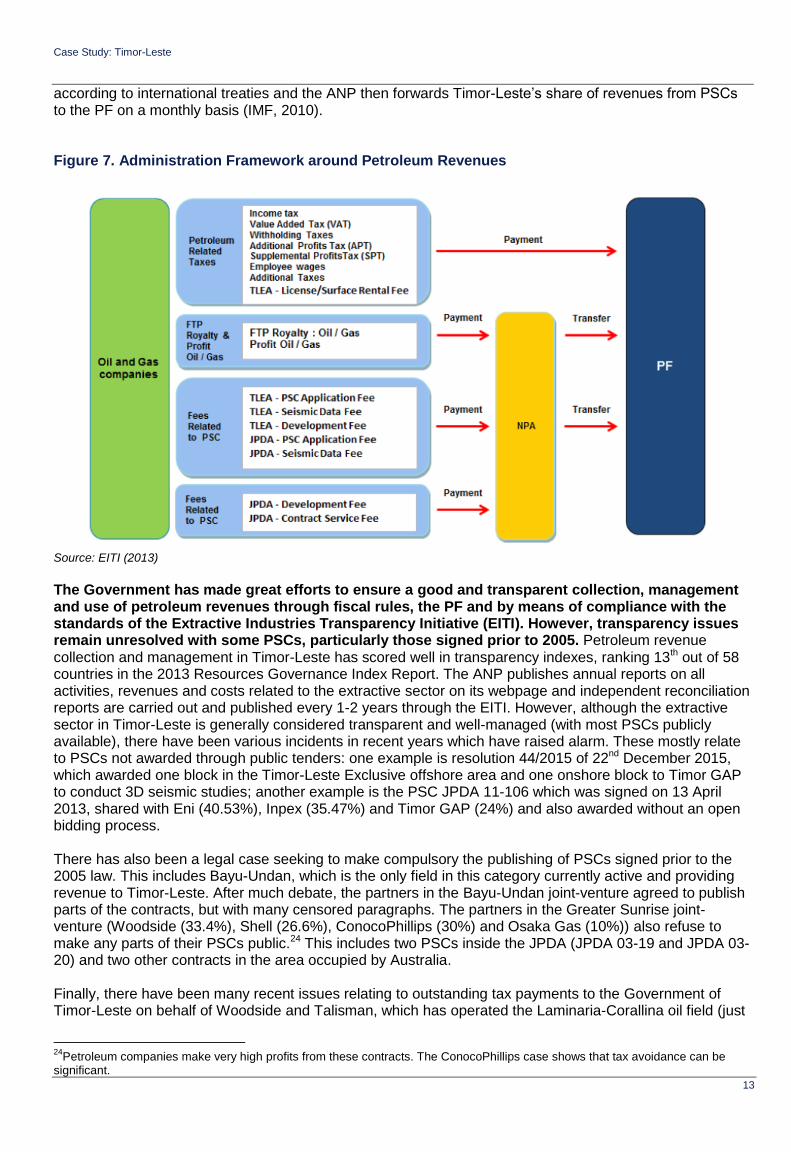
The administration framework around oil revenue collection varies depending on the type of revenue and the jurisdiction under which these oils are sourced. Table 4 in the Annex breaks down petroleum revenues by types of tax, tax rates and activities. Oil and gas companies pay petroleum-related taxes directly into the PF account at the BCTL, which are monitored and regulated by the MoF. First Tranche Petroleum, royalties, profits and fees for both JPDA and TLEA are paid first into the NPA and then transferred to the PF, as seen in Figure 7. Revenues for JPDA are split between Australia and Timor-Leste
20 These generally include revenues from downstream processes (operations in refining and marketing) which include bonuses,
royalty, production sharing, additional profits taxes, corporate income tax or special petroleum profit tax. 21
These include revenues from upstream processes such as identifying deposits, recovering raw materials from the ground and drawing wells. Revenues include corporate income tax income from processing, storage, transportation, trading and marketing of oil and gas products. 22
http://www.austlii.edu.au/au/other/dfat/treaties/2007/12.html 23
http://www.gfm.tl/learn/the-law-of-the-sea/
Figure 6. Breakdown of Petroleum Revenues
Case Study: Timor-Leste
13
according to international treaties and the ANP then forwards Timor-Leste’s share of revenues from PSCs to the PF on a monthly basis (IMF, 2010). Figure 7. Administration Framework around Petroleum Revenues
Source: EITI (2013) The Government has made great efforts to ensure a good and transparent collection, management and use of petroleum revenues through fiscal rules, the PF and by means of compliance with the standards of the Extractive Industries Transparency Initiative (EITI). However, transparency issues remain unresolved with some PSCs, particularly those signed prior to 2005. Petroleum revenue collection and management in Timor-Leste has scored well in transparency indexes, ranking 13th out of 58 countries in the 2013 Resources Governance Index Report. The ANP publishes annual reports on all activities, revenues and costs related to the extractive sector on its webpage and independent reconciliation reports are carried out and published every 1-2 years through the EITI. However, although the extractive sector in Timor-Leste is generally considered transparent and well-managed (with most PSCs publicly available), there have been various incidents in recent years which have raised alarm. These mostly relate to PSCs not awarded through public tenders: one example is resolution 44/2015 of 22nd December 2015, which awarded one block in the Timor-Leste Exclusive offshore area and one onshore block to Timor GAP to conduct 3D seismic studies; another example is the PSC JPDA 11-106 which was signed on 13 April 2013, shared with Eni (40.53%), Inpex (35.47%) and Timor GAP (24%) and also awarded without an open bidding process. There has also been a legal case seeking to make compulsory the publishing of PSCs signed prior to the 2005 law. This includes Bayu-Undan, which is the only field in this category currently active and providing revenue to Timor-Leste. After much debate, the partners in the Bayu-Undan joint-venture agreed to publish parts of the contracts, but with many censored paragraphs. The partners in the Greater Sunrise joint-venture (Woodside (33.4%), Shell (26.6%), ConocoPhillips (30%) and Osaka Gas (10%)) also refuse to make any parts of their PSCs public.24 This includes two PSCs inside the JPDA (JPDA 03-19 and JPDA 03-20) and two other contracts in the area occupied by Australia. Finally, there have been many recent issues relating to outstanding tax payments to the Government of Timor-Leste on behalf of Woodside and Talisman, which has operated the Laminaria-Corallina oil field (just
24
Petroleum companies make very high profits from these contracts. The ConocoPhillips case shows that tax avoidance can be significant.
Case Study: Timor-Leste
14
outside the JPDA) since 1999. They paid revenues exclusively to the Government of Australia, despite claims that this field is closer to Timor-Leste than to any other country and should belong to Timor-Leste under international legal principles (Lao Hamutuk, 2016). Finally, petroleum tax audits have been extensively carried out in recent years and have yielded a large amount of outstanding revenue payments. In 2011, Timor-Leste initiated a series of tax audits covering the years 2005-2010 and yielded an outstanding $79 million in petroleum revenues in the first round. In 2012, the MoF reported receiving more than $400 million in audit-related activities and also launched a legal action against ConocoPhillips for $200 million of unpaid taxes. These audits highlight the difficulty of managing such a complex sector during times of instability and in the presence of growing institutions. Timor-Leste’s status as a newly-formed state when oil revenues were discovered, the civil conflict in 2006-2007 and the complexity of oil revenue management all contributed to the Government’s difficulties in ensuring compliance in the early years. These tax avoidance cases have resulted in missing revenues for the State of Timor-Leste and therefore income foregone from investments in the PF. Despite these challenges, 2016 nevertheless marked an important step in resolving disputes (Hubert, D. 2016). There is also a message of caution: for companies to comply with the relevant royalty and tax regimes, and for the Government to strengthen further revenue collection, management and monitoring systems going forward.
3.2.1 Fiscal Rules: The ESI
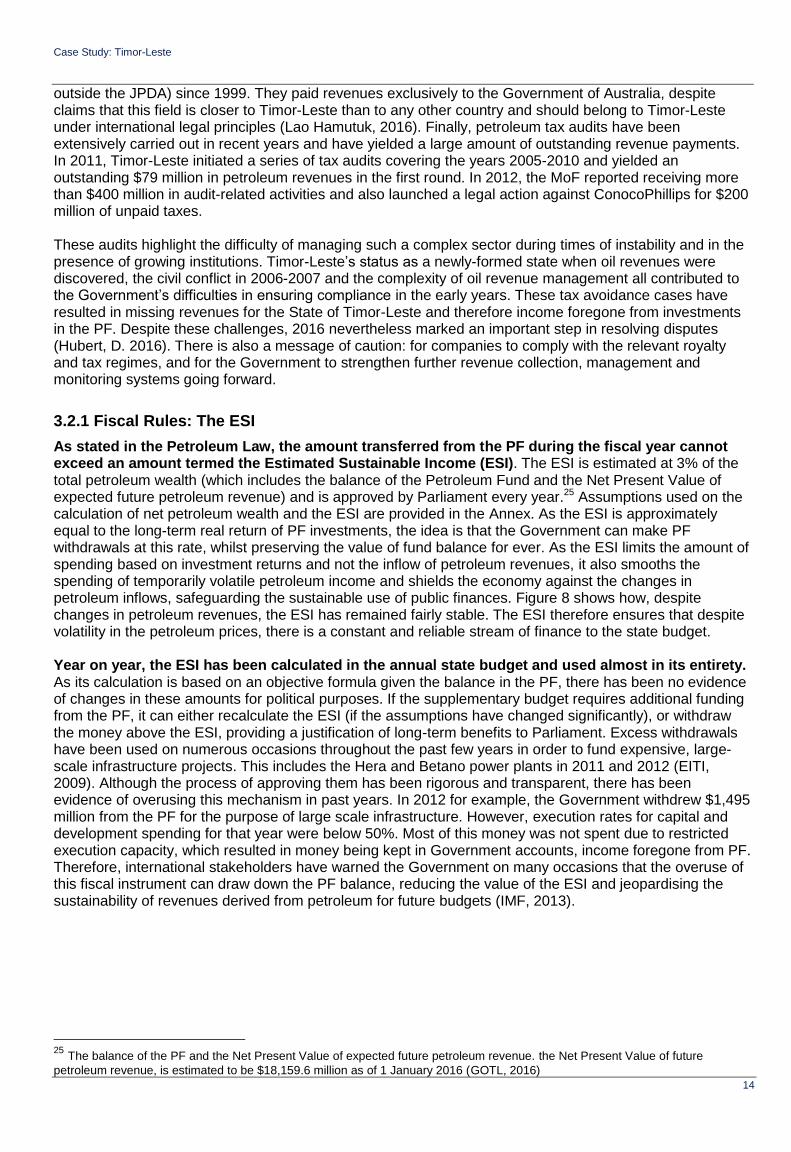
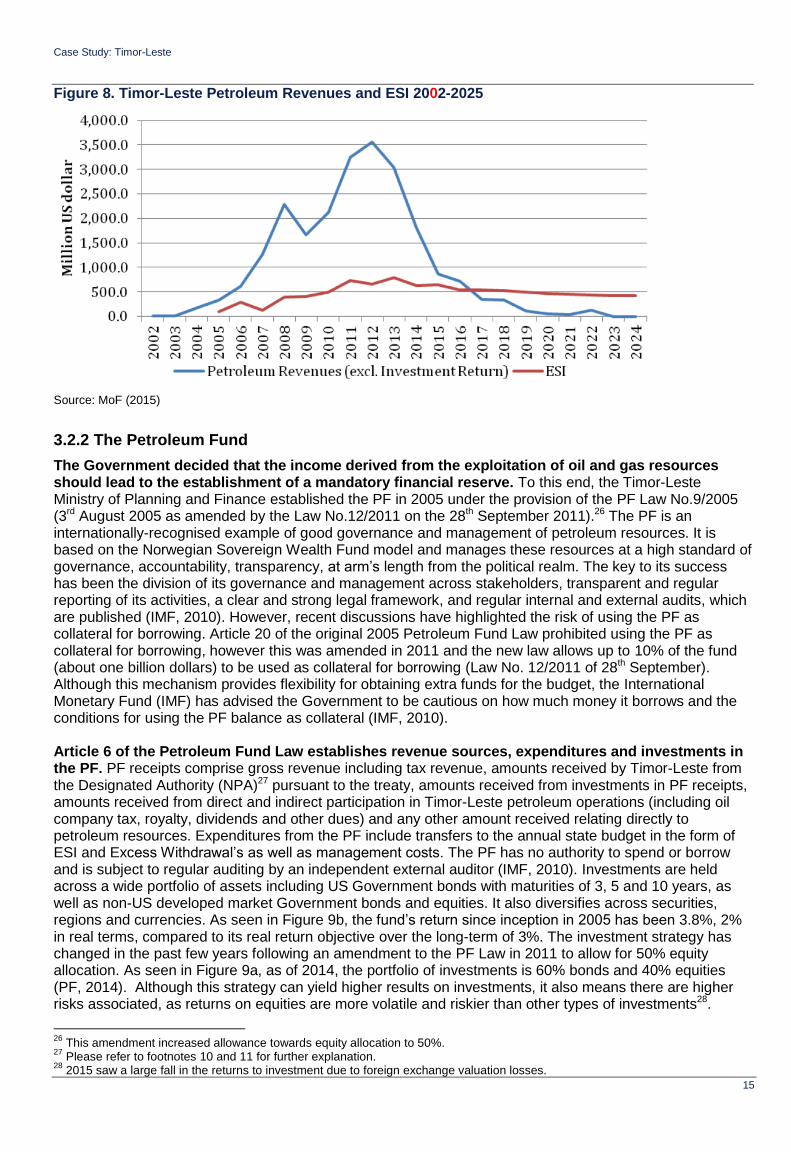
As stated in the Petroleum Law, the amount transferred from the PF during the fiscal year cannot exceed an amount termed the Estimated Sustainable Income (ESI). The ESI is estimated at 3% of the total petroleum wealth (which includes the balance of the Petroleum Fund and the Net Present Value of expected future petroleum revenue) and is approved by Parliament every year.25 Assumptions used on the calculation of net petroleum wealth and the ESI are provided in the Annex. As the ESI is approximately equal to the long-term real return of PF investments, the idea is that the Government can make PF withdrawals at this rate, whilst preserving the value of fund balance for ever. As the ESI limits the amount of spending based on investment returns and not the inflow of petroleum revenues, it also smooths the spending of temporarily volatile petroleum income and shields the economy against the changes in petroleum inflows, safeguarding the sustainable use of public finances. Figure 8 shows how, despite changes in petroleum revenues, the ESI has remained fairly stable. The ESI therefore ensures that despite volatility in the petroleum prices, there is a constant and reliable stream of finance to the state budget. Year on year, the ESI has been calculated in the annual state budget and used almost in its entirety. As its calculation is based on an objective formula given the balance in the PF, there has been no evidence of changes in these amounts for political purposes. If the supplementary budget requires additional funding from the PF, it can either recalculate the ESI (if the assumptions have changed significantly), or withdraw the money above the ESI, providing a justification of long-term benefits to Parliament. Excess withdrawals have been used on numerous occasions throughout the past few years in order to fund expensive, large-scale infrastructure projects. This includes the Hera and Betano power plants in 2011 and 2012 (EITI, 2009). Although the process of approving them has been rigorous and transparent, there has been evidence of overusing this mechanism in past years. In 2012 for example, the Government withdrew $1,495 million from the PF for the purpose of large scale infrastructure. However, execution rates for capital and development spending for that year were below 50%. Most of this money was not spent due to restricted execution capacity, which resulted in money being kept in Government accounts, income foregone from PF. Therefore, international stakeholders have warned the Government on many occasions that the overuse of this fiscal instrument can draw down the PF balance, reducing the value of the ESI and jeopardising the sustainability of revenues derived from petroleum for future budgets (IMF, 2013).
25 The balance of the PF and the Net Present Value of expected future petroleum revenue. the Net Present Value of future
petroleum revenue, is estimated to be $18,159.6 million as of 1 January 2016 (GOTL, 2016)
Case Study: Timor-Leste
15
Figure 8. Timor-Leste Petroleum Revenues and ESI 2002-2025
Source: MoF (2015)
3.2.2 The Petroleum Fund
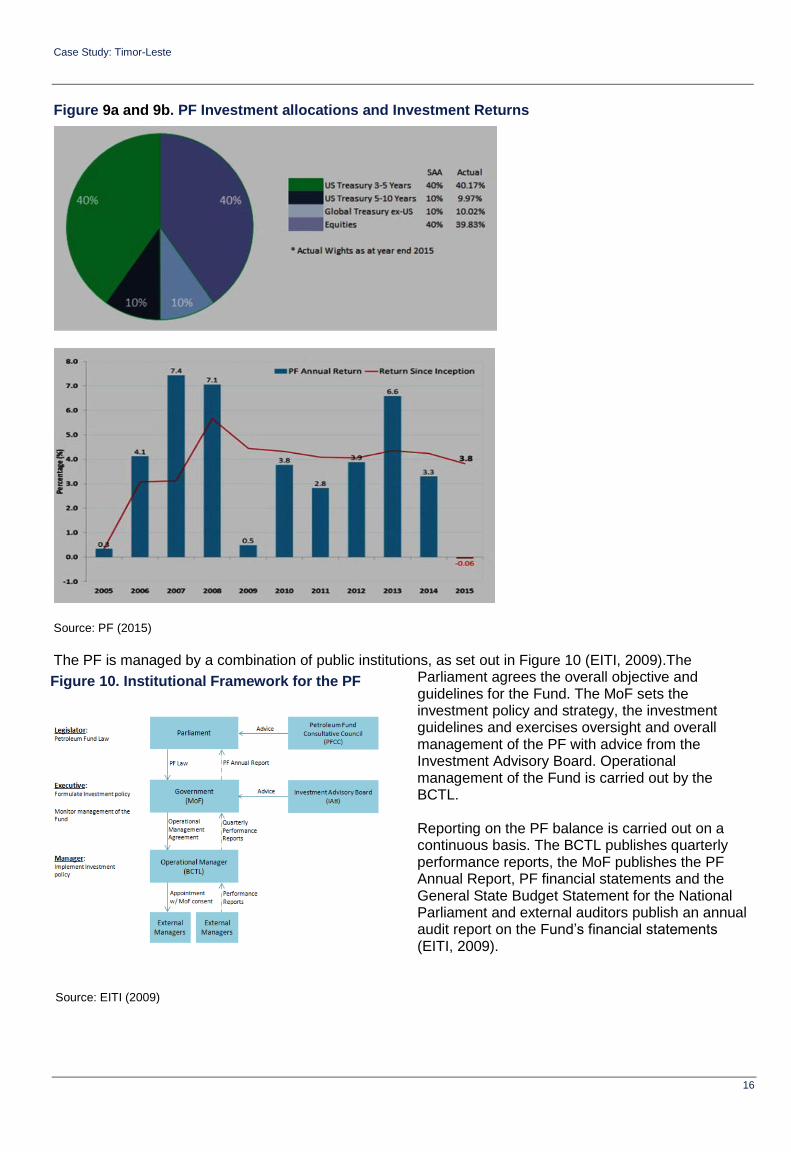
The Government decided that the income derived from the exploitation of oil and gas resources should lead to the establishment of a mandatory financial reserve. To this end, the Timor-Leste Ministry of Planning and Finance established the PF in 2005 under the provision of the PF Law No.9/2005 (3rd August 2005 as amended by the Law No.12/2011 on the 28th September 2011).26 The PF is an internationally-recognised example of good governance and management of petroleum resources. It is based on the Norwegian Sovereign Wealth Fund model and manages these resources at a high standard of governance, accountability, transparency, at arm’s length from the political realm. The key to its success has been the division of its governance and management across stakeholders, transparent and regular reporting of its activities, a clear and strong legal framework, and regular internal and external audits, which are published (IMF, 2010). However, recent discussions have highlighted the risk of using the PF as collateral for borrowing. Article 20 of the original 2005 Petroleum Fund Law prohibited using the PF as collateral for borrowing, however this was amended in 2011 and the new law allows up to 10% of the fund (about one billion dollars) to be used as collateral for borrowing (Law No. 12/2011 of 28th September). Although this mechanism provides flexibility for obtaining extra funds for the budget, the International Monetary Fund (IMF) has advised the Government to be cautious on how much money it borrows and the conditions for using the PF balance as collateral (IMF, 2010). Article 6 of the Petroleum Fund Law establishes revenue sources, expenditures and investments in the PF. PF receipts comprise gross revenue including tax revenue, amounts received by Timor-Leste from the Designated Authority (NPA)27 pursuant to the treaty, amounts received from investments in PF receipts, amounts received from direct and indirect participation in Timor-Leste petroleum operations (including oil company tax, royalty, dividends and other dues) and any other amount received relating directly to petroleum resources. Expenditures from the PF include transfers to the annual state budget in the form of ESI and Excess Withdrawal’s as well as management costs. The PF has no authority to spend or borrow and is subject to regular auditing by an independent external auditor (IMF, 2010). Investments are held across a wide portfolio of assets including US Government bonds with maturities of 3, 5 and 10 years, as well as non-US developed market Government bonds and equities. It also diversifies across securities, regions and currencies. As seen in Figure 9b, the fund’s return since inception in 2005 has been 3.8%, 2% in real terms, compared to its real return objective over the long-term of 3%. The investment strategy has changed in the past few years following an amendment to the PF Law in 2011 to allow for 50% equity allocation. As seen in Figure 9a, as of 2014, the portfolio of investments is 60% bonds and 40% equities (PF, 2014). Although this strategy can yield higher results on investments, it also means there are higher risks associated, as returns on equities are more volatile and riskier than other types of investments28.
26
This amendment increased allowance towards equity allocation to 50%. 27
Please refer to footnotes 10 and 11 for further explanation. 28
2015 saw a large fall in the returns to investment due to foreign exchange valuation losses.
Case Study: Timor-Leste
16
Figure 9a and 9b. PF Investment allocations and Investment Returns
Source: PF (2015)
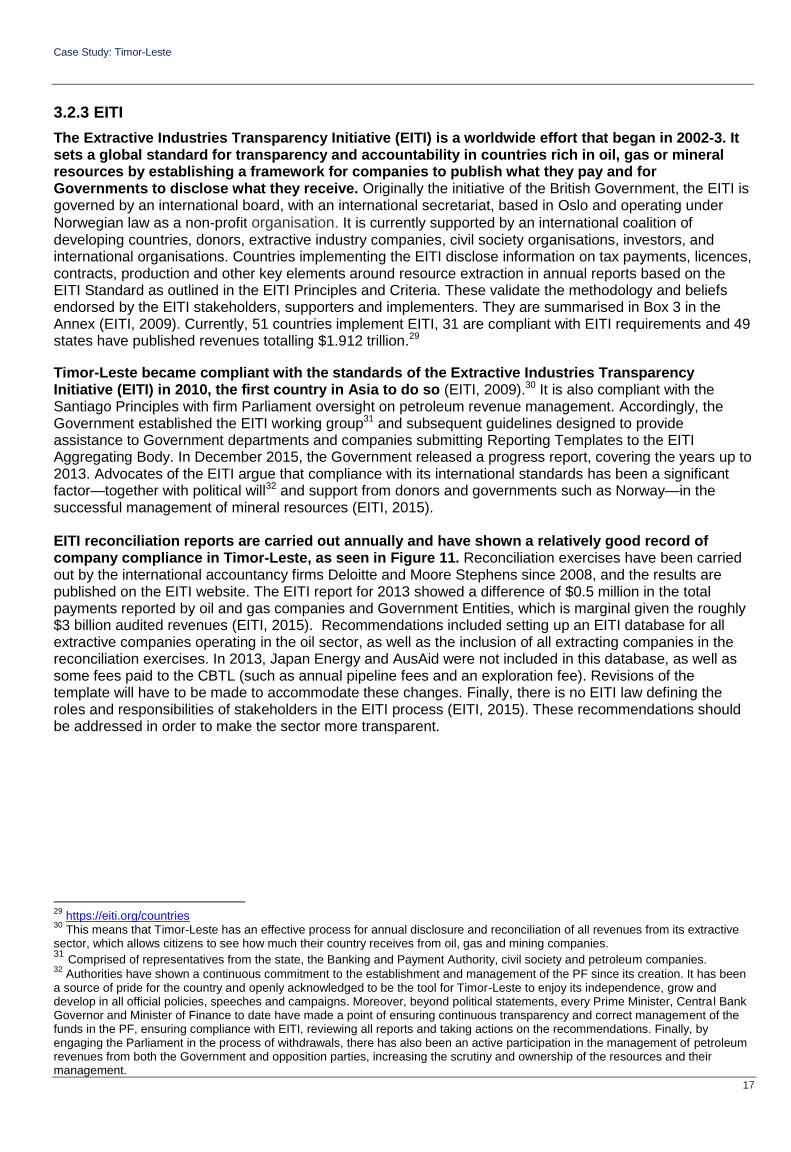
The PF is managed by a combination of public institutions, as set out in Figure 10 (EITI, 2009).The
Parliament agrees the overall objective and guidelines for the Fund. The MoF sets the investment policy and strategy, the investment guidelines and exercises oversight and overall management of the PF with advice from the Investment Advisory Board. Operational management of the Fund is carried out by the BCTL. Reporting on the PF balance is carried out on a continuous basis. The BCTL publishes quarterly performance reports, the MoF publishes the PF Annual Report, PF financial statements and the General State Budget Statement for the National Parliament and external auditors publish an annual audit report on the Fund’s financial statements (EITI, 2009).
Figure 10. Institutional Framework for the PF
Source: EITI (2009)
Case Study: Timor-Leste
17
3.2.3 EITI
The Extractive Industries Transparency Initiative (EITI) is a worldwide effort that began in 2002-3. It sets a global standard for transparency and accountability in countries rich in oil, gas or mineral resources by establishing a framework for companies to publish what they pay and for Governments to disclose what they receive. Originally the initiative of the British Government, the EITI is governed by an international board, with an international secretariat, based in Oslo and operating under
Norwegian law as a non-profit organisation. It is currently supported by an international coalition of developing countries, donors, extractive industry companies, civil society organisations, investors, and international organisations. Countries implementing the EITI disclose information on tax payments, licences, contracts, production and other key elements around resource extraction in annual reports based on the EITI Standard as outlined in the EITI Principles and Criteria. These validate the methodology and beliefs endorsed by the EITI stakeholders, supporters and implementers. They are summarised in Box 3 in the Annex (EITI, 2009). Currently, 51 countries implement EITI, 31 are compliant with EITI requirements and 49 states have published revenues totalling $1.912 trillion.29
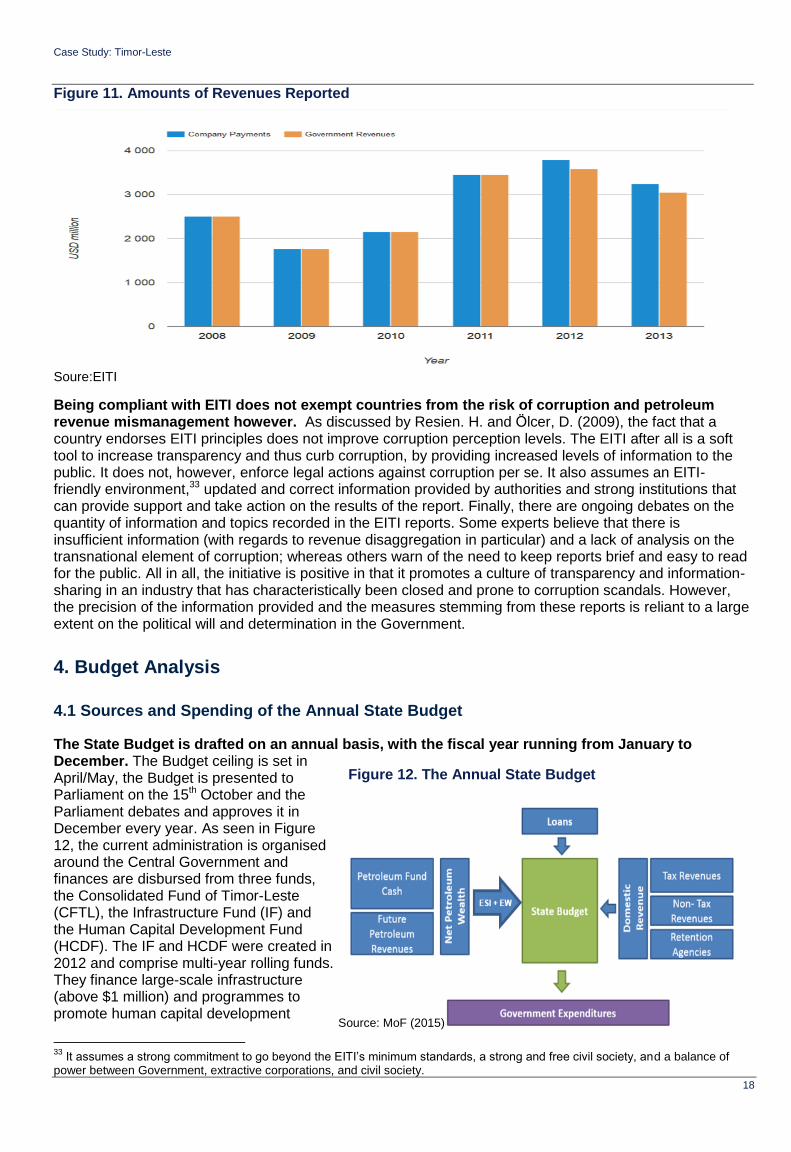
Timor-Leste became compliant with the standards of the Extractive Industries Transparency Initiative (EITI) in 2010, the first country in Asia to do so (EITI, 2009).30 It is also compliant with the Santiago Principles with firm Parliament oversight on petroleum revenue management. Accordingly, the Government established the EITI working group31 and subsequent guidelines designed to provide assistance to Government departments and companies submitting Reporting Templates to the EITI Aggregating Body. In December 2015, the Government released a progress report, covering the years up to 2013. Advocates of the EITI argue that compliance with its international standards has been a significant factor—together with political will32 and support from donors and governments such as Norway—in the successful management of mineral resources (EITI, 2015). EITI reconciliation reports are carried out annually and have shown a relatively good record of company compliance in Timor-Leste, as seen in Figure 11. Reconciliation exercises have been carried out by the international accountancy firms Deloitte and Moore Stephens since 2008, and the results are published on the EITI website. The EITI report for 2013 showed a difference of $0.5 million in the total payments reported by oil and gas companies and Government Entities, which is marginal given the roughly $3 billion audited revenues (EITI, 2015). Recommendations included setting up an EITI database for all extractive companies operating in the oil sector, as well as the inclusion of all extracting companies in the reconciliation exercises. In 2013, Japan Energy and AusAid were not included in this database, as well as some fees paid to the CBTL (such as annual pipeline fees and an exploration fee). Revisions of the template will have to be made to accommodate these changes. Finally, there is no EITI law defining the roles and responsibilities of stakeholders in the EITI process (EITI, 2015). These recommendations should be addressed in order to make the sector more transparent.
29
https://eiti.org/countries 30
This means that Timor-Leste has an effective process for annual disclosure and reconciliation of all revenues from its extractive sector, which allows citizens to see how much their country receives from oil, gas and mining companies. 31 Comprised of representatives from the state, the Banking and Payment Authority, civil society and petroleum companies. 32
Authorities have shown a continuous commitment to the establishment and management of the PF since its creation. It has been a source of pride for the country and openly acknowledged to be the tool for Timor-Leste to enjoy its independence, grow and develop in all official policies, speeches and campaigns. Moreover, beyond political statements, every Prime Minister, Central Bank Governor and Minister of Finance to date have made a point of ensuring continuous transparency and correct management of the funds in the PF, ensuring compliance with EITI, reviewing all reports and taking actions on the recommendations. Finally, by engaging the Parliament in the process of withdrawals, there has also been an active participation in the management of petroleum revenues from both the Government and opposition parties, increasing the scrutiny and ownership of the resources and their management.
Case Study: Timor-Leste
18
Figure 11. Amounts of Revenues Reported
Soure:EITI
Being compliant with EITI does not exempt countries from the risk of corruption and petroleum revenue mismanagement however. As discussed by Resien. H. and Ӧlcer, D. (2009), the fact that a country endorses EITI principles does not improve corruption perception levels. The EITI after all is a soft tool to increase transparency and thus curb corruption, by providing increased levels of information to the public. It does not, however, enforce legal actions against corruption per se. It also assumes an EITI-friendly environment,33 updated and correct information provided by authorities and strong institutions that can provide support and take action on the results of the report. Finally, there are ongoing debates on the quantity of information and topics recorded in the EITI reports. Some experts believe that there is insufficient information (with regards to revenue disaggregation in particular) and a lack of analysis on the transnational element of corruption; whereas others warn of the need to keep reports brief and easy to read for the public. All in all, the initiative is positive in that it promotes a culture of transparency and information-sharing in an industry that has characteristically been closed and prone to corruption scandals. However, the precision of the information provided and the measures stemming from these reports is reliant to a large extent on the political will and determination in the Government.
4. Budget Analysis
4.1 Sources and Spending of the Annual State Budget
The State Budget is drafted on an annual basis, with the fiscal year running from January to December. The Budget ceiling is set in April/May, the Budget is presented to Parliament on the 15th October and the Parliament debates and approves it in December every year. As seen in Figure 12, the current administration is organised around the Central Government and finances are disbursed from three funds, the Consolidated Fund of Timor-Leste (CFTL), the Infrastructure Fund (IF) and the Human Capital Development Fund (HCDF). The IF and HCDF were created in 2012 and comprise multi-year rolling funds. They finance large-scale infrastructure (above $1 million) and programmes to promote human capital development
33
It assumes a strong commitment to go beyond the EITI’s minimum standards, a strong and free civil society, and a balance of power between Government, extractive corporations, and civil society.
Source: MoF (2015)
Figure 12. The Annual State Budget
Case Study: Timor-Leste
19
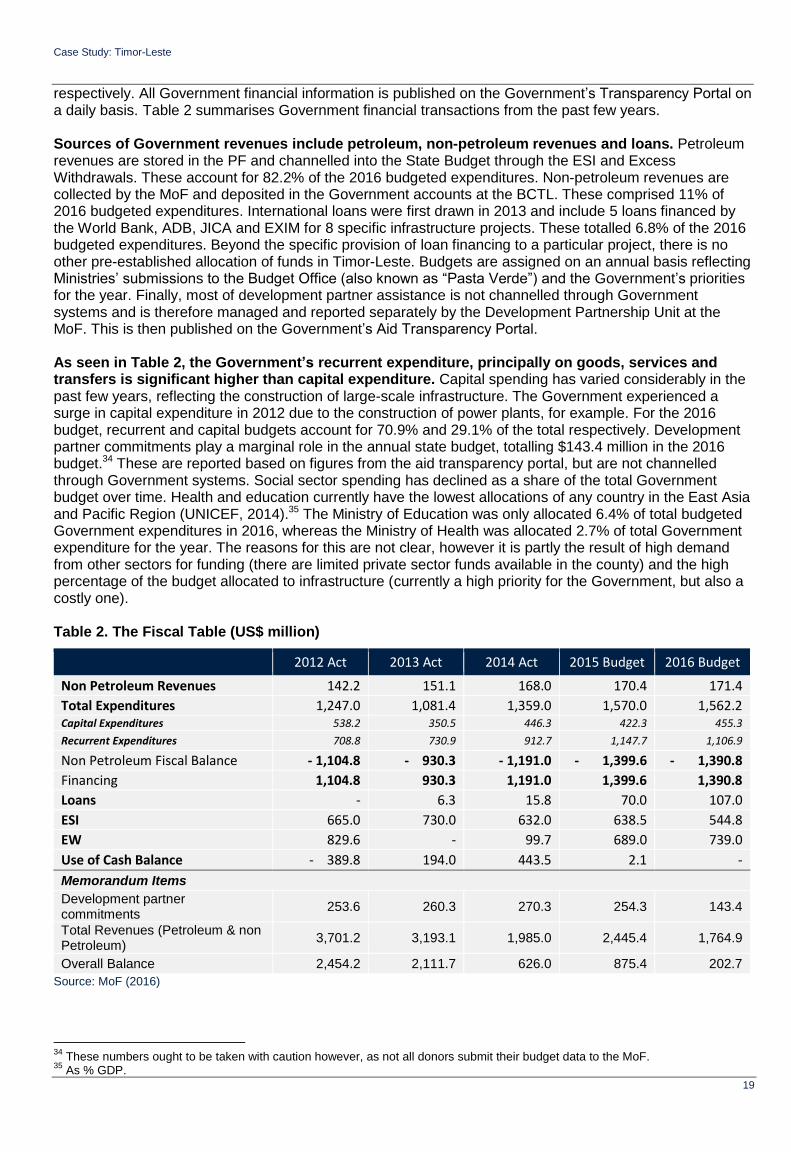
respectively. All Government financial information is published on the Government’s Transparency Portal on a daily basis. Table 2 summarises Government financial transactions from the past few years. Sources of Government revenues include petroleum, non-petroleum revenues and loans. Petroleum revenues are stored in the PF and channelled into the State Budget through the ESI and Excess Withdrawals. These account for 82.2% of the 2016 budgeted expenditures. Non-petroleum revenues are collected by the MoF and deposited in the Government accounts at the BCTL. These comprised 11% of 2016 budgeted expenditures. International loans were first drawn in 2013 and include 5 loans financed by the World Bank, ADB, JICA and EXIM for 8 specific infrastructure projects. These totalled 6.8% of the 2016 budgeted expenditures. Beyond the specific provision of loan financing to a particular project, there is no other pre-established allocation of funds in Timor-Leste. Budgets are assigned on an annual basis reflecting Ministries’ submissions to the Budget Office (also known as “Pasta Verde”) and the Government’s priorities for the year. Finally, most of development partner assistance is not channelled through Government systems and is therefore managed and reported separately by the Development Partnership Unit at the MoF. This is then published on the Government’s Aid Transparency Portal. As seen in Table 2, the Government’s recurrent expenditure, principally on goods, services and transfers is significant higher than capital expenditure. Capital spending has varied considerably in the past few years, reflecting the construction of large-scale infrastructure. The Government experienced a surge in capital expenditure in 2012 due to the construction of power plants, for example. For the 2016 budget, recurrent and capital budgets account for 70.9% and 29.1% of the total respectively. Development partner commitments play a marginal role in the annual state budget, totalling $143.4 million in the 2016 budget.34 These are reported based on figures from the aid transparency portal, but are not channelled through Government systems. Social sector spending has declined as a share of the total Government budget over time. Health and education currently have the lowest allocations of any country in the East Asia and Pacific Region (UNICEF, 2014).35 The Ministry of Education was only allocated 6.4% of total budgeted Government expenditures in 2016, whereas the Ministry of Health was allocated 2.7% of total Government expenditure for the year. The reasons for this are not clear, however it is partly the result of high demand from other sectors for funding (there are limited private sector funds available in the county) and the high percentage of the budget allocated to infrastructure (currently a high priority for the Government, but also a costly one). Table 2. The Fiscal Table (US$ million)
2012 Act 2013 Act 2014 Act 2015 Budget 2016 Budget
Non Petroleum Revenues 142.2 151.1 168.0 170.4 171.4
Total Expenditures 1,247.0 1,081.4 1,359.0 1,570.0 1,562.2 Capital Expenditures 538.2 350.5 446.3 422.3 455.3
Recurrent Expenditures 708.8 730.9 912.7 1,147.7 1,106.9
Non Petroleum Fiscal Balance - 1,104.8 - 930.3 - 1,191.0 - 1,399.6 - 1,390.8
Financing 1,104.8 930.3 1,191.0 1,399.6 1,390.8
Loans - 6.3 15.8 70.0 107.0
ESI 665.0 730.0 632.0 638.5 544.8
EW 829.6 - 99.7 689.0 739.0
Use of Cash Balance - 389.8 194.0 443.5 2.1 -
Memorandum Items
Development partner commitments
253.6 260.3 270.3 254.3 143.4
Total Revenues (Petroleum & non Petroleum)
3,701.2 3,193.1 1,985.0 2,445.4 1,764.9
Overall Balance 2,454.2 2,111.7 626.0 875.4 202.7
Source: MoF (2016)
34
These numbers ought to be taken with caution however, as not all donors submit their budget data to the MoF. 35
As % GDP.
Case Study: Timor-Leste
20
Spending allocations are based on a number of key policy documents which set out Government priorities over the short- and medium-term. The SDP 2011-2030 lays out the Government’s plan to reach middle-income country status by 2030. It highlights four pillars of action towards this goal by channelling investments in social capital, economic development, infrastructure development and the institutional framework.36 The Constitutional Government Programme formulates specific policy actions which the administration will follow during its mandate and provides a more concise picture of the actions the Government will take towards achieving the SDP.37 Finally, Ministry Action Plans define specific lines of action which each line ministry will follow and how they will structure the administration and work towards achieving the SDP. Since the swearing in of the VIth Constitutional Government in 2015, there have been a large set of administrative reforms. The structure of the Government now consists of four State Ministers who coordinate social affairs, economic affairs as well as state administration and justice affairs. These four ministries assist the Prime Minister and coordinate and direct the work of 15 line ministries (reduced from the 25 ministries in place during the previous administration).38
A major challenge in Timor-Leste has been the effective and efficient use of available funds for infrastructure investment and service provision. The country has run persistently high non-petroleum fiscal deficits, financed through the ESI and excess withdrawals. This in itself is not a problem if the volume of these deficits does not require excess withdrawals on a recurring basis. The Government withdrew large amounts for infrastructure from the PF in 2012, however, and faced significant capacity and absorptive
constraints. This led to the rollover of funds to subsequent years and interest income from the PF foregone.
Although the Government did scale back in 2013 and 2014, the 2015 and 2016 budgets have again seen an increase in excess withdrawals for large-scale infrastructure projects. Furthermore, the quality of recurrent spending (which forms the majority of Government expenditures) has also been called into question. The IMF has highlighted the relatively low levels of operation and maintenance (O&M) spending every year, particularly given the rate of capital investments, with this potentially putting at risk the long-term benefits of the large investments in infrastructure (IMF, 2013).
4.1.1 The Process of Deconcentration
Although the Government of Timor-Leste is centrally organised, there have been recent moves towards decentralisation of Government power and finances across the 13 districts. To date the main mechanism for devolving budgetary power to district Governments has been the Government programme Planeamento Desenvolvimento Integrado Distrital (PDID)39 and the Programa Nasional Dezenvolvimentu Suku (PNDS). These two programmes channel capital expenditure at district level and are under the Ministry of Planning and Strategic Investment and the Prime Minister’s Office respectively (MoF, 2015). The recent changes in the legal and institutional base for deconcentration, signal plans to further devolve administration powers to rural areas. The recently approved Decree Law No. 4/2014 on the Organic Statute of Administrative Pre-Deconcentration Structure and the establishment of the Deconcentration Unit at the MoF provide district managers with bigger budgets and direct authority over most of the offices operating at district level. The forthcoming Suco Law (village law) will also formally recognise village councils as an arm of the Government and there are plans for it to provide a monthly allowance to each village chief and sub-village chief, as well as other members of the Suco Council (Russel, T. 2015). The process of deconcentration potentially opens new opportunities for improved spending and service delivery in the districts. This can have a strong impact on social sectors such as WASH. However, although these changes suggest further devolution of administration and finances in the medium and long term, low capacity and slow bureaucratic processes are likely to delay this process in the coming years. The recently established Special Social Market Economy Zone in Oecussi will provide important lessons on how the deconcentration process ought to be handled if it is to succeed, as it has been granted a large budget allocation in the past two years (Russel, T. 2015).
36
http://timor-leste.gov.tl/?p=5289&lang=en 37
http://timor-leste.gov.tl/?p=11724&lang=en 38
http://www.laohamutuk.org/econ/OGE15/OR/VIGovOrgDL6-2015en.pdf 39
Previously the PDD1 and PDD2 programmes.
Case Study: Timor-Leste
21
4.2 The WASH sector in Timor-Leste
WASH programmes and spending include initiatives that increase access levels to safe water supply and sanitation and lead to better hygiene behaviour. Despite improvements in coverage for the past 20 years, basic provision of WASH services and infrastructure in Timor-Leste is amongst the lowest in
the Asia-Pacific region (ISF‐UTS, 2011). This impacts negatively on the whole economy; it contributes to the prevalence of waterborne diseases (which affect women and children disproportionally) and has an adverse effect on education attainment as well as future worker productivity (Harson, S. 2014). The problem is also becoming more acute given the growth of the population, the rapid rate of urbanisation (over 5% a year) and the uncertain impacts of climate change in the country (IBRD/WB, 2015).40
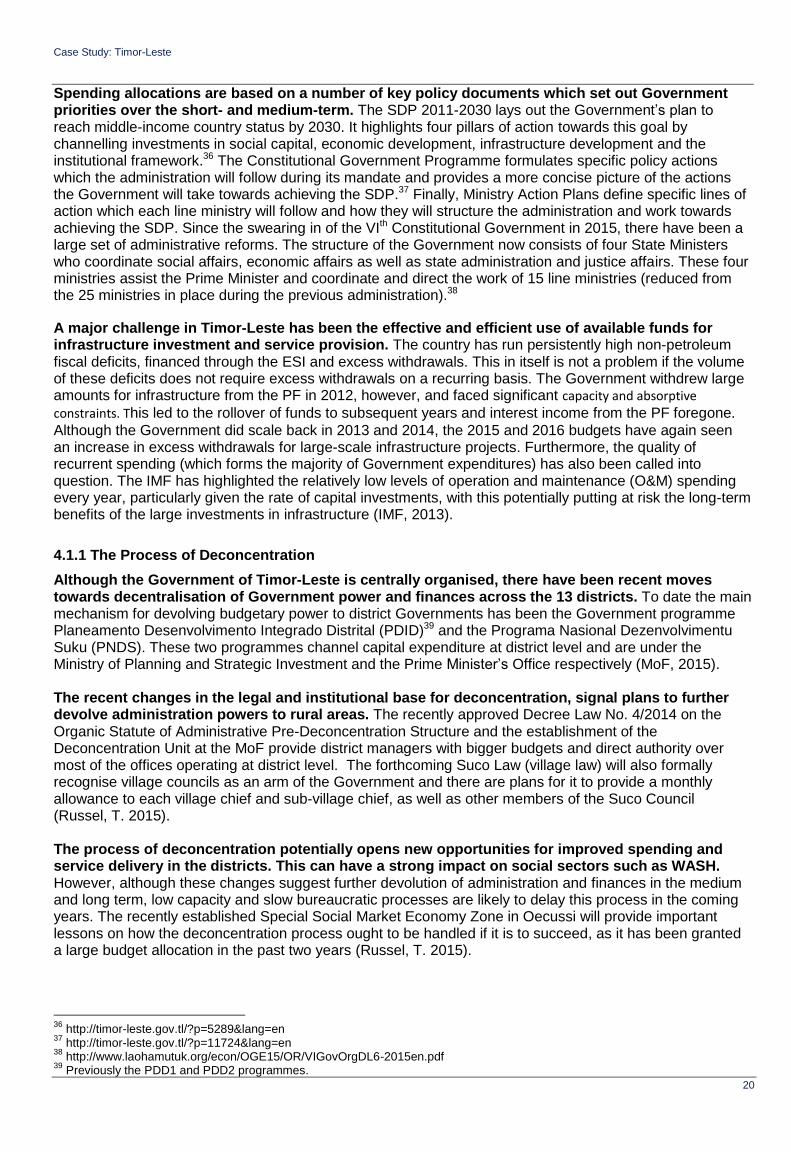
Access levels to drinking water have increased over the last decade. Based on the Joint Monitoring Programme (JMP) data, access levels to improved drinking water in Timor-Leste rose from 54% of the population in 2000 to around 72% in 2015. As seen in Figure 13a, this is the result of improvements in service delivery both in rural and urban areas.41 However this improvement fell short of achieving MDG 7, which aimed at providing water to 75% of the population (MoF, 2014).
Increasing access to sanitation has not been as successful as increasing access to drinking water. As seen in Figure 13b, the 2015 JMP data reveals that only around 50% of the population currently have access to adequate sanitation facilities, compared to 45% in 1995. There are no sewerage systems in Timor-Leste’s urban areas yet, with the most common types of improved toilets being pit latrines with slabs, pour flush to a pit or septic tank, and Ventilated Improved Pit (VIP) latrines. The situation is even more extreme in rural areas, where only 27% of the population have access to adequate sanitation facilities (IBRD/WB, 2015).42
Figure 13a and 13b. Population with Access to Improved Water Supply and Sanitation
Source, JMP (2015)
40
The country has one of the highest population growth rates in the Asia-Pacific region, with an annual growth rate of 2.41% between 2000 and 2010. 41
Piped water systems have contributed to these gains far more in rural areas than in urban areas. Access to improved water supply is 93% in urban areas, yet fewer than half of these households (45%) have a piped water connection to the yard or house, and for those that do, service quality is often poor. For rural areas, the most common types of improved water source are public tap/standpipe, and household yard connections. There are typically sourced from gravity-fed piped systems, protected well or spring, and boreholes. (IBRD/WB, 2015) 42
Even though these results are discouraging, they do mask a certain degree of improvement in sanitation facilities. Rural open defecation reduced from 55% to 37%, indicating an uptake in the use of basic sanitation facilities in rural areas, but not use of a toilet, which is considered “improved” and is more durable. A further 9% of households share improved toilets (generally shared be-tween two households from the same family), however these are not counted as “improved” in JMP estimates (IBRD/WB, 2015).
0
10
20
30
40
50
60
70
80
90
100
1995 2015
Improved Water Supply (%)
Urban Rural Total
0
10
20
30
40
50
60
70
80
90
100
1995 2015
Improved Sanitation (%)
Urban Rural Total
Case Study: Timor-Leste
22
Institutional arrangements for WASH
The policy agenda for WASH has developed significantly in Timor-Leste in recent years. The country has adopted the 2015 Sustainable Development Goals (SDGs), including Goal 6 with its targets for universal access to water supply and sanitation. It is also one of eight countries forming the High-Level Group on SDG Implementation (WaterAid, 2015). At national level, the SDP (2011) identifies water and sanitation as a national priority within the social capital investment pillar and established the goal of universal access to water and sanitation services by 2030. To achieve this there is a wide umbrella of policy initiatives and strategies. The Government Programme and Ministry Action Plans (5-year plans) specify actions to be taken in the medium-term by the Government as a whole and by the relevant ministries and public institutions. More specifically, there is a national Strategic Sanitation Plan (2020) and the Ministry of Public Works has a five-year Water and Sanitation Action Plan (2013-2017). These set out Government plans to increase access to drinking water to 87% and sanitation to 76% of the population by 2020 (IBRD/WB, 2015). Finally, the WASH sector has recently received a lot of attention in policy discussions and the media: masterplans for WASH have been launched in four districts, Baucau, Los Palos, Viqueque and Manufahi, and will be further developed in other districts (GoTL, 2016).
The Government is now the largest source of financing for the WASH sector, having surpassed
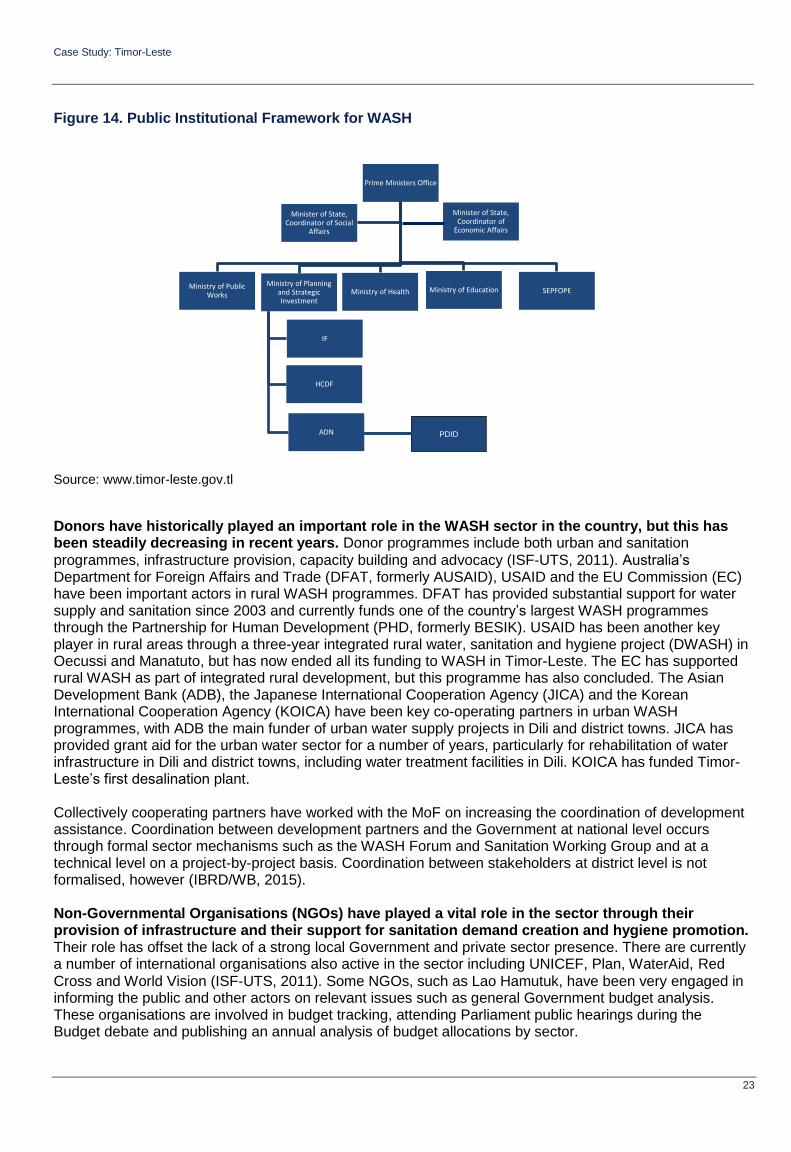
donor interventions in recent years (ISF‐UTS, 2011). WASH expenditure at Government level is carried out by a wide range of Ministries and public agencies, including the Minister of State, Coordinator of Social Affairs, the Prime Minister’s Office, the Ministry of Public Works, the Ministry of Health, the Ministry of Planning and Strategic Investment, the MoF, the Ministry of Education, SEPFOPE (Secretary of State for Employment Policy and Vocational Training), the Ministry of Interior and the Ministry of State Administration. These are depicted in Figure 14 with the new 2015 Government structure, following the VIth Constitutional Government’s administration reform. The institutions’ main roles and functions are summarised below.
The Minister of State, Coordinator of Economic Affairs, is in charge of harmonising work and plans for WASH within her or his mandate, directly under the supervision of the Prime Minister’s Office.43 Under this ministry the SEPFOPE is responsible for implementing a wide range of training courses for construction and plumbing for both individuals and organisations.
The Ministry of Public Works oversees water supply and sanitation in urban and rural areas with operational responsibility lying with the Directorate for Water and Sanitation (DNSA).
The Ministry of Health implements health and hygiene, rural sanitation and promotion, through the National Directorate for Community Health Services, and within it the Department for Environmental Health and the Department of Health Promotion. The Department for Health Promotion cover personal hygiene, sanitation, and healthy homes; this is extended into rural areas through mobile primary health clinics operated by professional health workers and volunteer Family Health Promot-ers under the Ministry of Health’s SISCA (Integrated Community Health System) programme. Work on sanitation and hygiene is expected to be expanded through the Ministry of Health’s Action Plan for Sanitation and Hygiene PAKSI (IBRD/WB, 2015).44
The Ministry of Planning and Strategic Investment provides infrastructure investment funded from the IF for projects above $1 million, and the Agencia Nacional de Desenvolvimento (ADN) for rural projects under the PDID programmes. The Ministry of Finance channels international loan funds towards the Dili sanitation and drainage programme. The Government is currently investing in a large-scale sanitation and drainage system in Dili. The total cost of this project is expected to reach $800 million, with drainage investments totalling $200-$300 million (SAPO, 2016).
The Ministry of Education is responsible for providing adequate WASH facilities in schools and for health education in schools.
The Ministry of Interior and Ministry of State Administration co-ordinate an increasing amount of programmes for WASH at district level within the context of decentralisation.
43
The Prime Minister’s Office is currently looking to introduce social audit monitoring systems, which will also cover the WASH sector. 44
PAKSI operationalizes the objectives of the National Basic Sanitation Policy, covering hygiene and solid waste, elimination of open defecation, building hygienic toilets, using handwashing facilities, disposing of solid waste safely and managing wastewater.
Case Study: Timor-Leste
23
Figure 14. Public Institutional Framework for WASH
Source: www.timor-leste.gov.tl
Donors have historically played an important role in the WASH sector in the country, but this has been steadily decreasing in recent years. Donor programmes include both urban and sanitation
programmes, infrastructure provision, capacity building and advocacy (ISF‐UTS, 2011). Australia’s Department for Foreign Affairs and Trade (DFAT, formerly AUSAID), USAID and the EU Commission (EC) have been important actors in rural WASH programmes. DFAT has provided substantial support for water supply and sanitation since 2003 and currently funds one of the country’s largest WASH programmes through the Partnership for Human Development (PHD, formerly BESIK). USAID has been another key player in rural areas through a three-year integrated rural water, sanitation and hygiene project (DWASH) in Oecussi and Manatuto, but has now ended all its funding to WASH in Timor-Leste. The EC has supported rural WASH as part of integrated rural development, but this programme has also concluded. The Asian Development Bank (ADB), the Japanese International Cooperation Agency (JICA) and the Korean International Cooperation Agency (KOICA) have been key co-operating partners in urban WASH programmes, with ADB the main funder of urban water supply projects in Dili and district towns. JICA has provided grant aid for the urban water sector for a number of years, particularly for rehabilitation of water infrastructure in Dili and district towns, including water treatment facilities in Dili. KOICA has funded Timor-Leste’s first desalination plant. Collectively cooperating partners have worked with the MoF on increasing the coordination of development assistance. Coordination between development partners and the Government at national level occurs through formal sector mechanisms such as the WASH Forum and Sanitation Working Group and at a technical level on a project-by-project basis. Coordination between stakeholders at district level is not formalised, however (IBRD/WB, 2015). Non-Governmental Organisations (NGOs) have played a vital role in the sector through their provision of infrastructure and their support for sanitation demand creation and hygiene promotion. Their role has offset the lack of a strong local Government and private sector presence. There are currently a number of international organisations also active in the sector including UNICEF, Plan, WaterAid, Red
Cross and World Vision (ISF‐UTS, 2011). Some NGOs, such as Lao Hamutuk, have been very engaged in informing the public and other actors on relevant issues such as general Government budget analysis. These organisations are involved in budget tracking, attending Parliament public hearings during the Budget debate and publishing an annual analysis of budget allocations by sector.
Prime Ministers Office
Ministry of Public Works Ministry of Health Ministry of Education
Ministry of Planning and Strategic Investment
IF
ADN
HCDF
SEPFOPE
Minister of State, Coordinator of Social
Affairs
Minister of State, Coordinator of
Economic Affairs
PDID
Case Study: Timor-Leste
24
The private sector is mostly absent in the WASH sector in Timor-Leste, except for small-scale hardware suppliers. The Government is looking into ways to promote private sector participation in water supply operations and maintenance through public private partnerships, performance-based service contracts and other management contracts (IBRD/WB, 2015).
Challenges for WASH
The provision of WASH infrastructure and services is still weak in Timor-Leste and this poses a major threat to public health and economic development. These shortfalls are particularly acute in rural areas, affecting women and children disproportionately. Although the Government and other stakeholders are channelling resources to improve this situation, there are still many challenges facing the country. These are expected to increase in the near future due to population growth, urbanisation and the negative impacts of climate change. For example, current water consumption in Dili is estimated at 20 litres per person, but the next few years are expected to see water demand increase to 150 litres per person (SAPO, 2016).
Funding allocations are limited, with pervasively strong rural-urban disparities, and a focus of funding towards infrastructure for urban water supply and sanitation. There are several areas experiencing major shortfalls in funding. First is the limited budgetary commitment to ongoing O&M of infrastructure, for which user fees are insufficient (IBRD/WB, 2015).45 Second, hygiene behaviour change campaign trials have had good results in recent years, but have yet to go to scale (IBRD/WB, 2015). Third, the sector suffers from inadequate human resource capacity, with managerial skills severely constraining the ability of the public sector to plan and manage WASH investments (ISF‐UTS, 2011).19 Finally, although procurement and monitoring practice have increased in recent years, there is still much work to be carried out to make sure investment and service delivery provide the expected results and translate into greater improvements for the population (DFAT, 2011). Several major bottlenecks weaken the institutional effectiveness of the sector. Government leadership suffers from a lack of clear ministerial responsibilities and fragmented interventions by different institutions across the board.46 Fostering ownership at the district level is also a challenge due to the lack of flexibility given to district offices to manage the resources they receive. Donor and NGO initiatives, although crucial, also raise questions about the sustainability of the interventions, with low coordination amongst agencies and organisations as well as the limited capacity of staff in smaller NGOs. Finally, the current institutional framework also lacks an independent regulator for urban water supply operations or consumer accountability (IBRD/WB, 2015). Provision of adequate water and sanitation facilities is vital given the threat of climate change in the region. Seasonal variation in the availability of freshwater, flooding, droughts, landslides, temperature changes and destruction from natural resources are common in the region and take a greater toll on the population in the face of inadequate provision of WASH services. Timor-Leste is a small island nation, with a mountainous landscape and a large portion of its population employed in subsistence farming and therefore vulnerable to a range of these hazards. Dili is also located at sea level and at risk of sea-level rise and flooding during rainy seasons, given the poor drainage systems. Climate change therefore poses a significant threat in terms of health, weather disasters, habitat loss and economic stress, with the country scoring the second highest and highest vulnerability rating for 2010 and 2030 respectively (ISF‐UTS, 2011).47 The Government established the Secretary of State for Environment and currently has a 2010
45
The World Bank argues that O&M is reactive, planned asset maintenance programmes are not implemented, and system functionality and service quality are declining. 46
For example, the process for executing approved projects is clear, with the Ministry of Public Works responsible for project super-vision; ADN responsible for checking and signing off the technical quality of works; and tendering carried out by the new National Procurement Commission. However there are bottlenecks due to poor procurement and contracting procedures and lack of adequate documentation by the Ministry of Public Works. While the Ministry of Finance payments are quick, it often rejects requests for payments due to poor documentation. Delays are also caused by the slow tender preparation through the National Procurement Commission (IBRD/WB, 2015). 47 These ratings refer to estimates from Climate Vulnerability Monitor 2010 http://daraint.org/climate‐vulnerability‐monitor/climate‐vulnerability‐monitor‐2010 (Countries are classified according to: ACUTE+, ACUTE, ACUTE‐, SEVERE+, SEVERE, SEVERE‐, HIGH+, HIGH, HIGH‐, MODERATE, LOW) and Environmental Vulnerability Index 2004 developed by SOPAC, UNEP and partners
http://www.vulnerabilityindex.net/ (Countries are classified according to: Extremely vulnerable, Highly vulnerable, Vulnerable, At risk, Resilient).
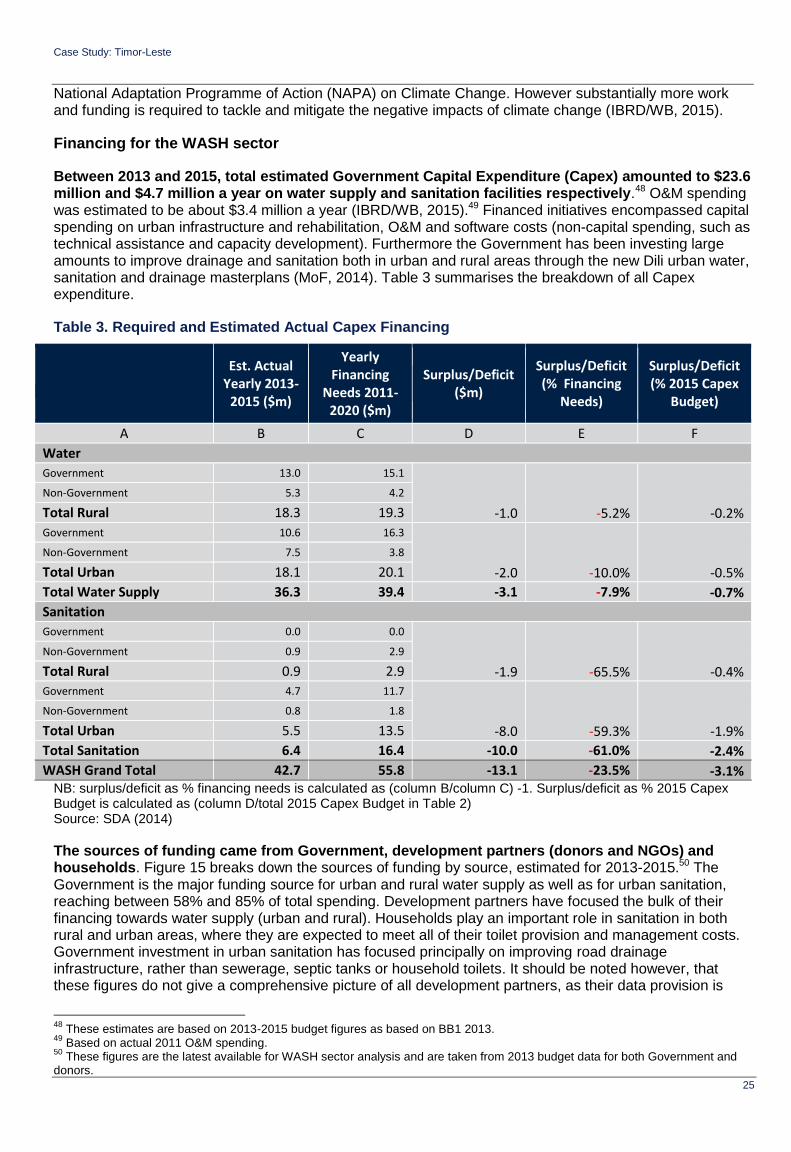
Case Study: Timor-Leste
25
National Adaptation Programme of Action (NAPA) on Climate Change. However substantially more work and funding is required to tackle and mitigate the negative impacts of climate change (IBRD/WB, 2015).
Financing for the WASH sector
Between 2013 and 2015, total estimated Government Capital Expenditure (Capex) amounted to $23.6 million and $4.7 million a year on water supply and sanitation facilities respectively.48 O&M spending was estimated to be about $3.4 million a year (IBRD/WB, 2015).49 Financed initiatives encompassed capital spending on urban infrastructure and rehabilitation, O&M and software costs (non-capital spending, such as technical assistance and capacity development). Furthermore the Government has been investing large amounts to improve drainage and sanitation both in urban and rural areas through the new Dili urban water, sanitation and drainage masterplans (MoF, 2014). Table 3 summarises the breakdown of all Capex expenditure.
Table 3. Required and Estimated Actual Capex Financing
Est. Actual Yearly 2013-
2015 ($m)
Yearly Financing
Needs 2011-2020 ($m)
Surplus/Deficit ($m)
Surplus/Deficit (% Financing
Needs)
Surplus/Deficit (% 2015 Capex
Budget)
A B C D E F
Water
Government 13.0 15.1
-1.0 -5.2% -0.2%
Non-Government 5.3 4.2
Total Rural 18.3 19.3
Government 10.6 16.3
-2.0 -10.0% -0.5%
Non-Government 7.5 3.8
Total Urban 18.1 20.1
Total Water Supply 36.3 39.4 -3.1 -7.9% -0.7%
Sanitation
Government 0.0 0.0
-1.9 -65.5% -0.4%
Non-Government 0.9 2.9
Total Rural 0.9 2.9
Government 4.7 11.7
-8.0 -59.3% -1.9%
Non-Government 0.8 1.8
Total Urban 5.5 13.5
Total Sanitation 6.4 16.4 -10.0 -61.0% -2.4%
WASH Grand Total 42.7 55.8 -13.1 -23.5% -3.1% NB: surplus/deficit as % financing needs is calculated as (column B/column C) -1. Surplus/deficit as % 2015 Capex Budget is calculated as (column D/total 2015 Capex Budget in Table 2) Source: SDA (2014)
The sources of funding came from Government, development partners (donors and NGOs) and households. Figure 15 breaks down the sources of funding by source, estimated for 2013-2015.50 The Government is the major funding source for urban and rural water supply as well as for urban sanitation, reaching between 58% and 85% of total spending. Development partners have focused the bulk of their financing towards water supply (urban and rural). Households play an important role in sanitation in both rural and urban areas, where they are expected to meet all of their toilet provision and management costs. Government investment in urban sanitation has focused principally on improving road drainage infrastructure, rather than sewerage, septic tanks or household toilets. It should be noted however, that these figures do not give a comprehensive picture of all development partners, as their data provision is
48
These estimates are based on 2013-2015 budget figures as based on BB1 2013. 49
Based on actual 2011 O&M spending. 50
These figures are the latest available for WASH sector analysis and are taken from 2013 budget data for both Government and donors.
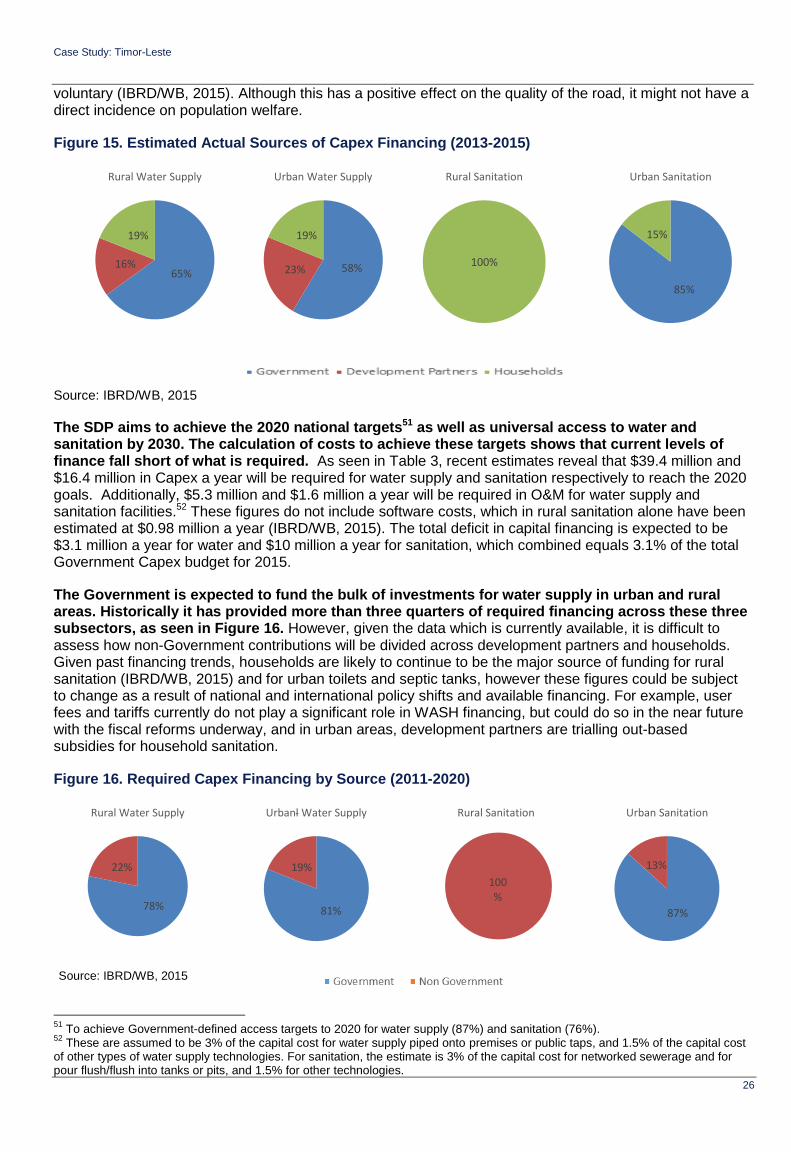
Case Study: Timor-Leste
26
voluntary (IBRD/WB, 2015). Although this has a positive effect on the quality of the road, it might not have a direct incidence on population welfare.
Figure 15. Estimated Actual Sources of Capex Financing (2013-2015)
Source: IBRD/WB, 2015
The SDP aims to achieve the 2020 national targets51 as well as universal access to water and sanitation by 2030. The calculation of costs to achieve these targets shows that current levels of finance fall short of what is required. As seen in Table 3, recent estimates reveal that $39.4 million and $16.4 million in Capex a year will be required for water supply and sanitation respectively to reach the 2020 goals. Additionally, $5.3 million and $1.6 million a year will be required in O&M for water supply and sanitation facilities.52 These figures do not include software costs, which in rural sanitation alone have been estimated at $0.98 million a year (IBRD/WB, 2015). The total deficit in capital financing is expected to be $3.1 million a year for water and $10 million a year for sanitation, which combined equals 3.1% of the total Government Capex budget for 2015.
The Government is expected to fund the bulk of investments for water supply in urban and rural areas. Historically it has provided more than three quarters of required financing across these three subsectors, as seen in Figure 16. However, given the data which is currently available, it is difficult to assess how non-Government contributions will be divided across development partners and households. Given past financing trends, households are likely to continue to be the major source of funding for rural sanitation (IBRD/WB, 2015) and for urban toilets and septic tanks, however these figures could be subject to change as a result of national and international policy shifts and available financing. For example, user fees and tariffs currently do not play a significant role in WASH financing, but could do so in the near future with the fiscal reforms underway, and in urban areas, development partners are trialling out-based subsidies for household sanitation.
Figure 16. Required Capex Financing by Source (2011-2020)
51
To achieve Government-defined access targets to 2020 for water supply (87%) and sanitation (76%). 52
These are assumed to be 3% of the capital cost for water supply piped onto premises or public taps, and 1.5% of the capital cost of other types of water supply technologies. For sanitation, the estimate is 3% of the capital cost for networked sewerage and for pour flush/flush into tanks or pits, and 1.5% for other technologies.
65% 16%
19%
Rural Water Supply
58% 23%
19%
Urban Water Supply
100%
Rural Sanitation
85%
15%
Urban Sanitation
78%
22%
Rural Water Supply
81%
19%
Urbanl Water Supply
100%
Rural Sanitation
87%
13%
Urban Sanitation
Source: IBRD/WB, 2015
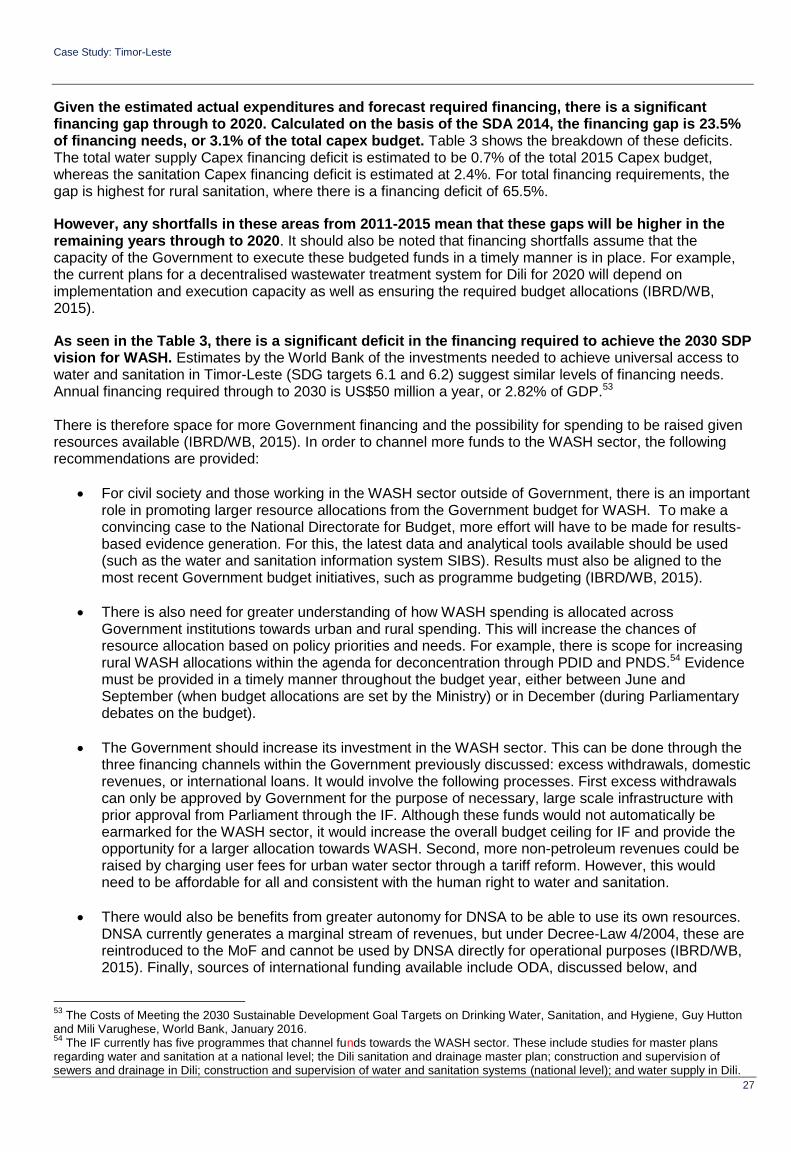
Case Study: Timor-Leste
27
Given the estimated actual expenditures and forecast required financing, there is a significant financing gap through to 2020. Calculated on the basis of the SDA 2014, the financing gap is 23.5% of financing needs, or 3.1% of the total capex budget. Table 3 shows the breakdown of these deficits. The total water supply Capex financing deficit is estimated to be 0.7% of the total 2015 Capex budget, whereas the sanitation Capex financing deficit is estimated at 2.4%. For total financing requirements, the gap is highest for rural sanitation, where there is a financing deficit of 65.5%.
However, any shortfalls in these areas from 2011-2015 mean that these gaps will be higher in the remaining years through to 2020. It should also be noted that financing shortfalls assume that the capacity of the Government to execute these budgeted funds in a timely manner is in place. For example, the current plans for a decentralised wastewater treatment system for Dili for 2020 will depend on implementation and execution capacity as well as ensuring the required budget allocations (IBRD/WB, 2015).
As seen in the Table 3, there is a significant deficit in the financing required to achieve the 2030 SDP vision for WASH. Estimates by the World Bank of the investments needed to achieve universal access to water and sanitation in Timor-Leste (SDG targets 6.1 and 6.2) suggest similar levels of financing needs. Annual financing required through to 2030 is US$50 million a year, or 2.82% of GDP.53 There is therefore space for more Government financing and the possibility for spending to be raised given resources available (IBRD/WB, 2015). In order to channel more funds to the WASH sector, the following recommendations are provided:
For civil society and those working in the WASH sector outside of Government, there is an important role in promoting larger resource allocations from the Government budget for WASH. To make a convincing case to the National Directorate for Budget, more effort will have to be made for results-based evidence generation. For this, the latest data and analytical tools available should be used (such as the water and sanitation information system SIBS). Results must also be aligned to the most recent Government budget initiatives, such as programme budgeting (IBRD/WB, 2015).
There is also need for greater understanding of how WASH spending is allocated across Government institutions towards urban and rural spending. This will increase the chances of resource allocation based on policy priorities and needs. For example, there is scope for increasing rural WASH allocations within the agenda for deconcentration through PDID and PNDS.54 Evidence must be provided in a timely manner throughout the budget year, either between June and September (when budget allocations are set by the Ministry) or in December (during Parliamentary debates on the budget).
The Government should increase its investment in the WASH sector. This can be done through the three financing channels within the Government previously discussed: excess withdrawals, domestic revenues, or international loans. It would involve the following processes. First excess withdrawals can only be approved by Government for the purpose of necessary, large scale infrastructure with prior approval from Parliament through the IF. Although these funds would not automatically be earmarked for the WASH sector, it would increase the overall budget ceiling for IF and provide the opportunity for a larger allocation towards WASH. Second, more non-petroleum revenues could be raised by charging user fees for urban water sector through a tariff reform. However, this would need to be affordable for all and consistent with the human right to water and sanitation.
There would also be benefits from greater autonomy for DNSA to be able to use its own resources. DNSA currently generates a marginal stream of revenues, but under Decree-Law 4/2004, these are reintroduced to the MoF and cannot be used by DNSA directly for operational purposes (IBRD/WB, 2015). Finally, sources of international funding available include ODA, discussed below, and
53
The Costs of Meeting the 2030 Sustainable Development Goal Targets on Drinking Water, Sanitation, and Hygiene, Guy Hutton and Mili Varughese, World Bank, January 2016. 54
The IF currently has five programmes that channel funds towards the WASH sector. These include studies for master plans regarding water and sanitation at a national level; the Dili sanitation and drainage master plan; construction and supervision of sewers and drainage in Dili; construction and supervision of water and sanitation systems (national level); and water supply in Dili.
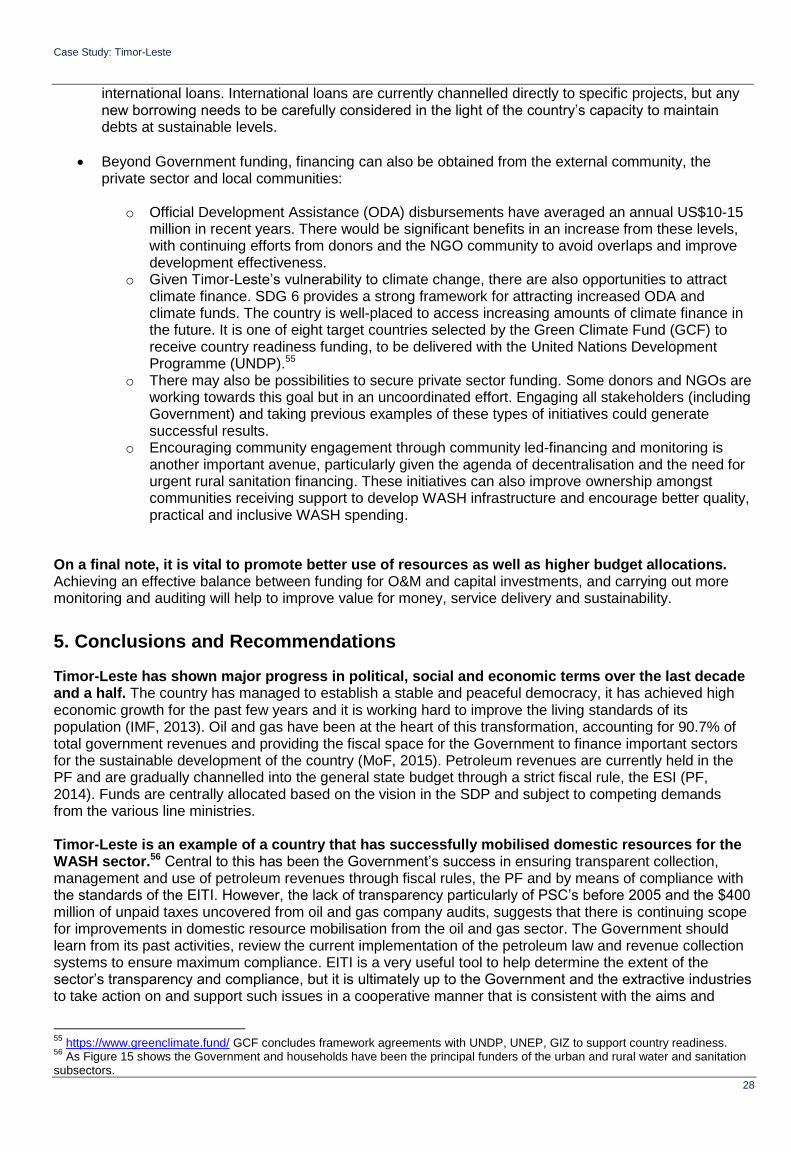
Case Study: Timor-Leste
28
international loans. International loans are currently channelled directly to specific projects, but any new borrowing needs to be carefully considered in the light of the country’s capacity to maintain debts at sustainable levels.
Beyond Government funding, financing can also be obtained from the external community, the private sector and local communities:
o Official Development Assistance (ODA) disbursements have averaged an annual US$10-15
million in recent years. There would be significant benefits in an increase from these levels, with continuing efforts from donors and the NGO community to avoid overlaps and improve development effectiveness.
o Given Timor-Leste’s vulnerability to climate change, there are also opportunities to attract climate finance. SDG 6 provides a strong framework for attracting increased ODA and climate funds. The country is well-placed to access increasing amounts of climate finance in the future. It is one of eight target countries selected by the Green Climate Fund (GCF) to receive country readiness funding, to be delivered with the United Nations Development Programme (UNDP).55
o There may also be possibilities to secure private sector funding. Some donors and NGOs are working towards this goal but in an uncoordinated effort. Engaging all stakeholders (including Government) and taking previous examples of these types of initiatives could generate successful results.
o Encouraging community engagement through community led-financing and monitoring is another important avenue, particularly given the agenda of decentralisation and the need for urgent rural sanitation financing. These initiatives can also improve ownership amongst communities receiving support to develop WASH infrastructure and encourage better quality, practical and inclusive WASH spending.
On a final note, it is vital to promote better use of resources as well as higher budget allocations. Achieving an effective balance between funding for O&M and capital investments, and carrying out more monitoring and auditing will help to improve value for money, service delivery and sustainability.
5. Conclusions and Recommendations
Timor-Leste has shown major progress in political, social and economic terms over the last decade and a half. The country has managed to establish a stable and peaceful democracy, it has achieved high economic growth for the past few years and it is working hard to improve the living standards of its population (IMF, 2013). Oil and gas have been at the heart of this transformation, accounting for 90.7% of total government revenues and providing the fiscal space for the Government to finance important sectors for the sustainable development of the country (MoF, 2015). Petroleum revenues are currently held in the PF and are gradually channelled into the general state budget through a strict fiscal rule, the ESI (PF, 2014). Funds are centrally allocated based on the vision in the SDP and subject to competing demands from the various line ministries. Timor-Leste is an example of a country that has successfully mobilised domestic resources for the WASH sector.56 Central to this has been the Government’s success in ensuring transparent collection, management and use of petroleum revenues through fiscal rules, the PF and by means of compliance with the standards of the EITI. However, the lack of transparency particularly of PSC’s before 2005 and the $400 million of unpaid taxes uncovered from oil and gas company audits, suggests that there is continuing scope for improvements in domestic resource mobilisation from the oil and gas sector. The Government should learn from its past activities, review the current implementation of the petroleum law and revenue collection systems to ensure maximum compliance. EITI is a very useful tool to help determine the extent of the sector’s transparency and compliance, but it is ultimately up to the Government and the extractive industries to take action on and support such issues in a cooperative manner that is consistent with the aims and
55
https://www.greenclimate.fund/ GCF concludes framework agreements with UNDP, UNEP, GIZ to support country readiness. 56
As Figure 15 shows the Government and households have been the principal funders of the urban and rural water and sanitation subsectors.
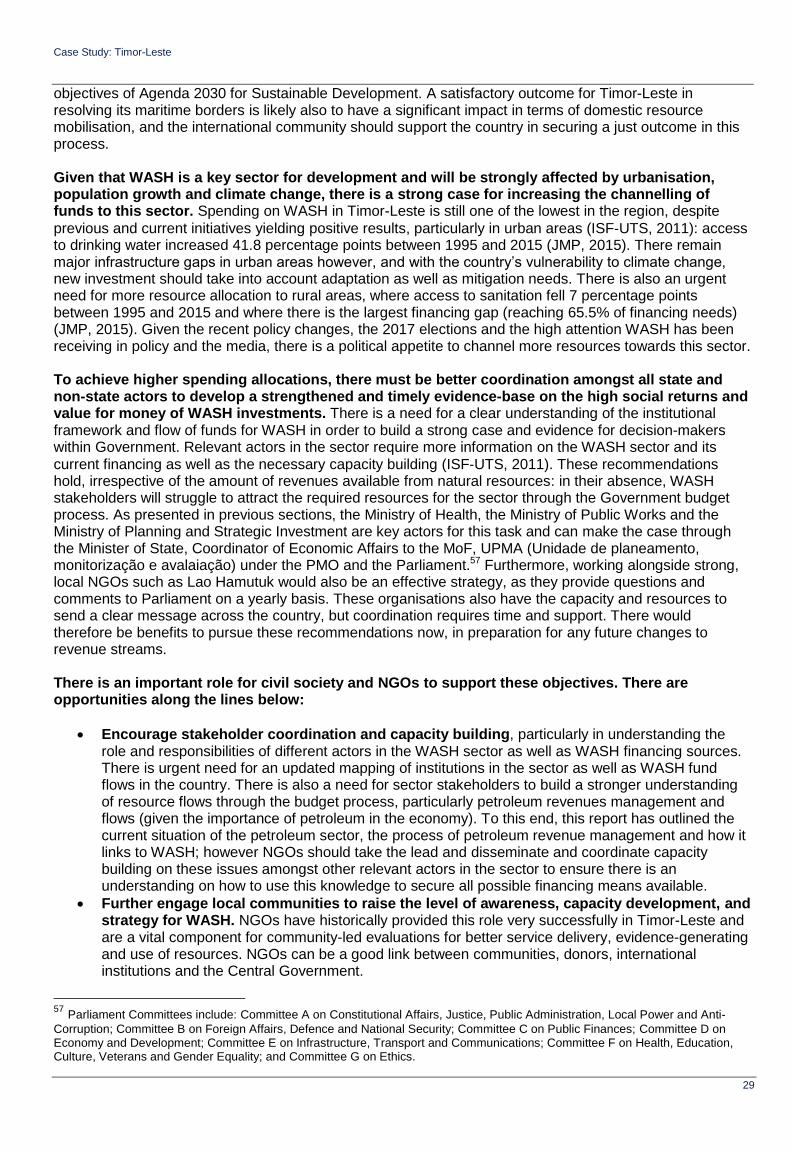
Case Study: Timor-Leste
29
objectives of Agenda 2030 for Sustainable Development. A satisfactory outcome for Timor-Leste in resolving its maritime borders is likely also to have a significant impact in terms of domestic resource mobilisation, and the international community should support the country in securing a just outcome in this process. Given that WASH is a key sector for development and will be strongly affected by urbanisation, population growth and climate change, there is a strong case for increasing the channelling of funds to this sector. Spending on WASH in Timor-Leste is still one of the lowest in the region, despite
previous and current initiatives yielding positive results, particularly in urban areas (ISF‐UTS, 2011): access to drinking water increased 41.8 percentage points between 1995 and 2015 (JMP, 2015). There remain major infrastructure gaps in urban areas however, and with the country’s vulnerability to climate change, new investment should take into account adaptation as well as mitigation needs. There is also an urgent need for more resource allocation to rural areas, where access to sanitation fell 7 percentage points between 1995 and 2015 and where there is the largest financing gap (reaching 65.5% of financing needs) (JMP, 2015). Given the recent policy changes, the 2017 elections and the high attention WASH has been receiving in policy and the media, there is a political appetite to channel more resources towards this sector. To achieve higher spending allocations, there must be better coordination amongst all state and non-state actors to develop a strengthened and timely evidence-base on the high social returns and value for money of WASH investments. There is a need for a clear understanding of the institutional framework and flow of funds for WASH in order to build a strong case and evidence for decision-makers within Government. Relevant actors in the sector require more information on the WASH sector and its
current financing as well as the necessary capacity building (ISF‐UTS, 2011). These recommendations hold, irrespective of the amount of revenues available from natural resources: in their absence, WASH stakeholders will struggle to attract the required resources for the sector through the Government budget process. As presented in previous sections, the Ministry of Health, the Ministry of Public Works and the Ministry of Planning and Strategic Investment are key actors for this task and can make the case through the Minister of State, Coordinator of Economic Affairs to the MoF, UPMA (Unidade de planeamento, monitorização e avalaiação) under the PMO and the Parliament.57 Furthermore, working alongside strong, local NGOs such as Lao Hamutuk would also be an effective strategy, as they provide questions and comments to Parliament on a yearly basis. These organisations also have the capacity and resources to send a clear message across the country, but coordination requires time and support. There would therefore be benefits to pursue these recommendations now, in preparation for any future changes to revenue streams. There is an important role for civil society and NGOs to support these objectives. There are opportunities along the lines below:
Encourage stakeholder coordination and capacity building, particularly in understanding the role and responsibilities of different actors in the WASH sector as well as WASH financing sources. There is urgent need for an updated mapping of institutions in the sector as well as WASH fund flows in the country. There is also a need for sector stakeholders to build a stronger understanding of resource flows through the budget process, particularly petroleum revenues management and flows (given the importance of petroleum in the economy). To this end, this report has outlined the current situation of the petroleum sector, the process of petroleum revenue management and how it links to WASH; however NGOs should take the lead and disseminate and coordinate capacity building on these issues amongst other relevant actors in the sector to ensure there is an understanding on how to use this knowledge to secure all possible financing means available.
Further engage local communities to raise the level of awareness, capacity development, and strategy for WASH. NGOs have historically provided this role very successfully in Timor-Leste and are a vital component for community-led evaluations for better service delivery, evidence-generating and use of resources. NGOs can be a good link between communities, donors, international institutions and the Central Government.
57 Parliament Committees include: Committee A on Constitutional Affairs, Justice, Public Administration, Local Power and Anti-
Corruption; Committee B on Foreign Affairs, Defence and National Security; Committee C on Public Finances; Committee D on Economy and Development; Committee E on Infrastructure, Transport and Communications; Committee F on Health, Education, Culture, Veterans and Gender Equality; and Committee G on Ethics.
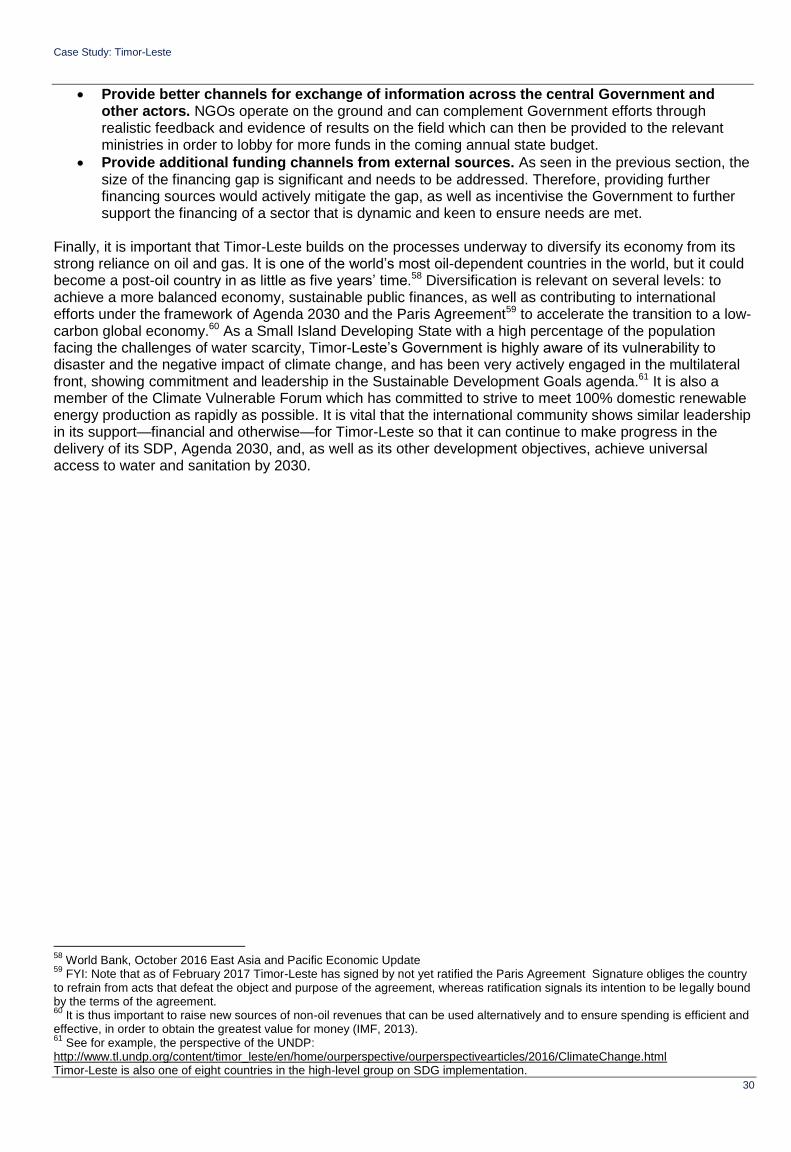
Case Study: Timor-Leste
30
Provide better channels for exchange of information across the central Government and other actors. NGOs operate on the ground and can complement Government efforts through realistic feedback and evidence of results on the field which can then be provided to the relevant ministries in order to lobby for more funds in the coming annual state budget.
Provide additional funding channels from external sources. As seen in the previous section, the size of the financing gap is significant and needs to be addressed. Therefore, providing further financing sources would actively mitigate the gap, as well as incentivise the Government to further support the financing of a sector that is dynamic and keen to ensure needs are met.
Finally, it is important that Timor-Leste builds on the processes underway to diversify its economy from its strong reliance on oil and gas. It is one of the world’s most oil-dependent countries in the world, but it could become a post-oil country in as little as five years’ time.58 Diversification is relevant on several levels: to achieve a more balanced economy, sustainable public finances, as well as contributing to international efforts under the framework of Agenda 2030 and the Paris Agreement59 to accelerate the transition to a low-carbon global economy.60 As a Small Island Developing State with a high percentage of the population facing the challenges of water scarcity, Timor-Leste’s Government is highly aware of its vulnerability to disaster and the negative impact of climate change, and has been very actively engaged in the multilateral front, showing commitment and leadership in the Sustainable Development Goals agenda.61 It is also a member of the Climate Vulnerable Forum which has committed to strive to meet 100% domestic renewable energy production as rapidly as possible. It is vital that the international community shows similar leadership in its support—financial and otherwise—for Timor-Leste so that it can continue to make progress in the delivery of its SDP, Agenda 2030, and, as well as its other development objectives, achieve universal access to water and sanitation by 2030.
58
World Bank, October 2016 East Asia and Pacific Economic Update 59
FYI: Note that as of February 2017 Timor-Leste has signed by not yet ratified the Paris Agreement Signature obliges the country to refrain from acts that defeat the object and purpose of the agreement, whereas ratification signals its intention to be legally bound by the terms of the agreement. 60
It is thus important to raise new sources of non-oil revenues that can be used alternatively and to ensure spending is efficient and effective, in order to obtain the greatest value for money (IMF, 2013). 61
See for example, the perspective of the UNDP: http://www.tl.undp.org/content/timor_leste/en/home/ourperspective/ourperspectivearticles/2016/ClimateChange.html Timor-Leste is also one of eight countries in the high-level group on SDG implementation.
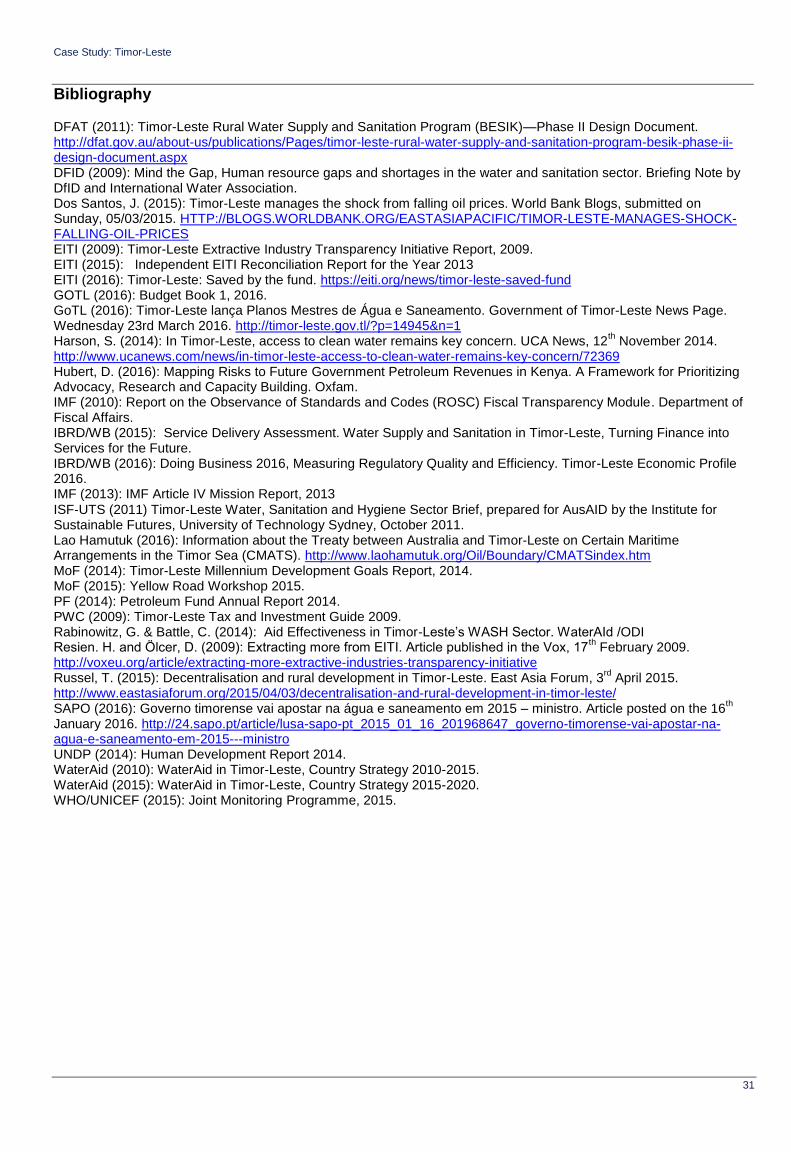
Case Study: Timor-Leste
31
Bibliography
DFAT (2011): Timor-Leste Rural Water Supply and Sanitation Program (BESIK)—Phase II Design Document. http://dfat.gov.au/about-us/publications/Pages/timor-leste-rural-water-supply-and-sanitation-program-besik-phase-ii-design-document.aspx DFID (2009): Mind the Gap, Human resource gaps and shortages in the water and sanitation sector. Briefing Note by DfID and International Water Association. Dos Santos, J. (2015): Timor-Leste manages the shock from falling oil prices. World Bank Blogs, submitted on Sunday, 05/03/2015. HTTP://BLOGS.WORLDBANK.ORG/EASTASIAPACIFIC/TIMOR-LESTE-MANAGES-SHOCK-FALLING-OIL-PRICES EITI (2009): Timor-Leste Extractive Industry Transparency Initiative Report, 2009. EITI (2015): Independent EITI Reconciliation Report for the Year 2013 EITI (2016): Timor-Leste: Saved by the fund. https://eiti.org/news/timor-leste-saved-fund GOTL (2016): Budget Book 1, 2016. GoTL (2016): Timor-Leste lança Planos Mestres de Água e Saneamento. Government of Timor-Leste News Page. Wednesday 23rd March 2016. http://timor-leste.gov.tl/?p=14945&n=1 Harson, S. (2014): In Timor-Leste, access to clean water remains key concern. UCA News, 12
th November 2014.
http://www.ucanews.com/news/in-timor-leste-access-to-clean-water-remains-key-concern/72369 Hubert, D. (2016): Mapping Risks to Future Government Petroleum Revenues in Kenya. A Framework for Prioritizing Advocacy, Research and Capacity Building. Oxfam. IMF (2010): Report on the Observance of Standards and Codes (ROSC) Fiscal Transparency Module. Department of Fiscal Affairs. IBRD/WB (2015): Service Delivery Assessment. Water Supply and Sanitation in Timor-Leste, Turning Finance into Services for the Future. IBRD/WB (2016): Doing Business 2016, Measuring Regulatory Quality and Efficiency. Timor-Leste Economic Profile 2016. IMF (2013): IMF Article IV Mission Report, 2013
ISF‐UTS (2011) Timor‐Leste Water, Sanitation and Hygiene Sector Brief, prepared for AusAID by the Institute for Sustainable Futures, University of Technology Sydney, October 2011. Lao Hamutuk (2016): Information about the Treaty between Australia and Timor-Leste on Certain Maritime Arrangements in the Timor Sea (CMATS). http://www.laohamutuk.org/Oil/Boundary/CMATSindex.htm MoF (2014): Timor-Leste Millennium Development Goals Report, 2014. MoF (2015): Yellow Road Workshop 2015. PF (2014): Petroleum Fund Annual Report 2014. PWC (2009): Timor-Leste Tax and Investment Guide 2009. Rabinowitz, G. & Battle, C. (2014): Aid Effectiveness in Timor-Leste’s WASH Sector. WaterAId /ODI Resien. H. and Ӧlcer, D. (2009): Extracting more from EITI. Article published in the Vox, 17
th February 2009.
http://voxeu.org/article/extracting-more-extractive-industries-transparency-initiative Russel, T. (2015): Decentralisation and rural development in Timor-Leste. East Asia Forum, 3
rd April 2015.
http://www.eastasiaforum.org/2015/04/03/decentralisation-and-rural-development-in-timor-leste/ SAPO (2016): Governo timorense vai apostar na água e saneamento em 2015 – ministro. Article posted on the 16
th
January 2016. http://24.sapo.pt/article/lusa-sapo-pt_2015_01_16_201968647_governo-timorense-vai-apostar-na-agua-e-saneamento-em-2015---ministro UNDP (2014): Human Development Report 2014. WaterAid (2010): WaterAid in Timor-Leste, Country Strategy 2010-2015. WaterAid (2015): WaterAid in Timor-Leste, Country Strategy 2015-2020. WHO/UNICEF (2015): Joint Monitoring Programme, 2015.
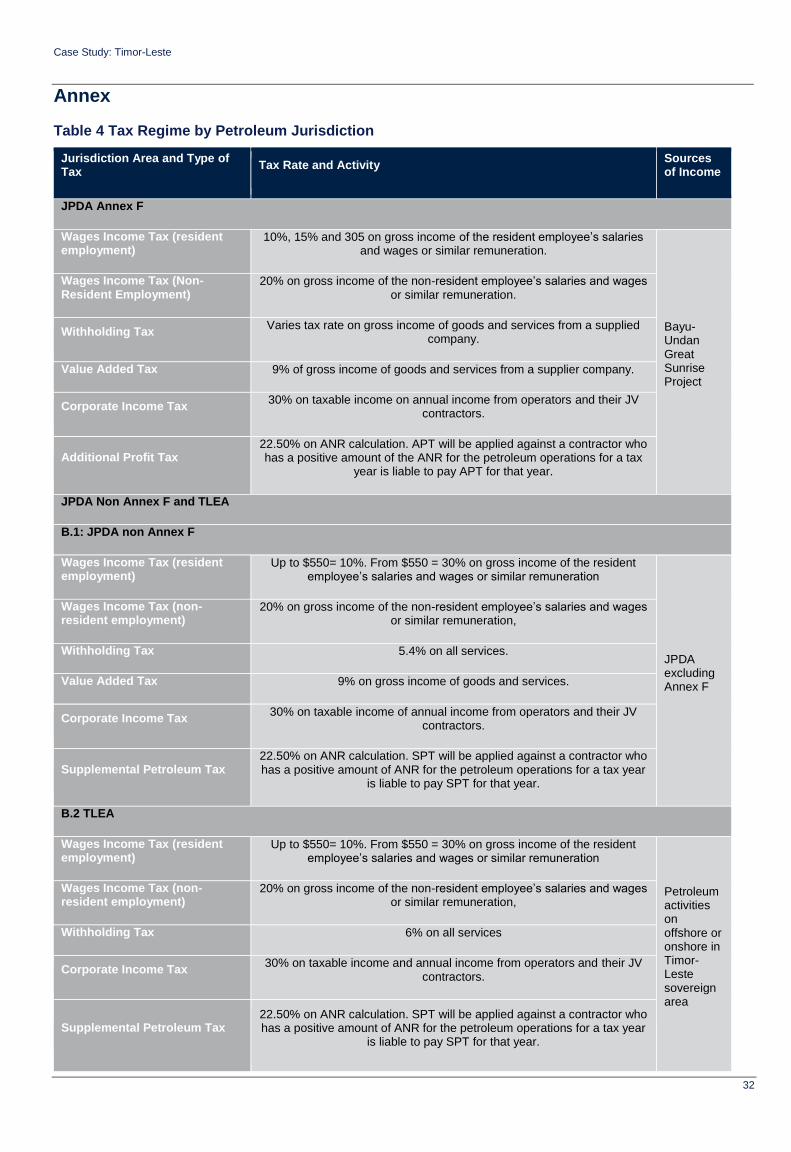
Case Study: Timor-Leste
32
Annex
Table 4 Tax Regime by Petroleum Jurisdiction
Jurisdiction Area and Type of Tax
Tax Rate and Activity Sources of Income
JPDA Annex F
Wages Income Tax (resident employment)
10%, 15% and 305 on gross income of the resident employee’s salaries and wages or similar remuneration.
Bayu-Undan Great Sunrise Project
Wages Income Tax (Non-Resident Employment)
20% on gross income of the non-resident employee’s salaries and wages or similar remuneration.
Withholding Tax Varies tax rate on gross income of goods and services from a supplied
company.
Value Added Tax 9% of gross income of goods and services from a supplier company.
Corporate Income Tax 30% on taxable income on annual income from operators and their JV
contractors.
Additional Profit Tax 22.50% on ANR calculation. APT will be applied against a contractor who has a positive amount of the ANR for the petroleum operations for a tax
year is liable to pay APT for that year.
JPDA Non Annex F and TLEA
B.1: JPDA non Annex F
Wages Income Tax (resident employment)
Up to $550= 10%. From $550 = 30% on gross income of the resident employee’s salaries and wages or similar remuneration
JPDA excluding Annex F
Wages Income Tax (non-resident employment)
20% on gross income of the non-resident employee’s salaries and wages or similar remuneration,
Withholding Tax 5.4% on all services.
Value Added Tax 9% on gross income of goods and services.
Corporate Income Tax 30% on taxable income of annual income from operators and their JV
contractors.
Supplemental Petroleum Tax 22.50% on ANR calculation. SPT will be applied against a contractor who has a positive amount of ANR for the petroleum operations for a tax year
is liable to pay SPT for that year.
B.2 TLEA
Wages Income Tax (resident employment)
Up to $550= 10%. From $550 = 30% on gross income of the resident employee’s salaries and wages or similar remuneration
Petroleum activities on offshore or onshore in Timor-Leste sovereign area
Wages Income Tax (non-resident employment)
20% on gross income of the non-resident employee’s salaries and wages or similar remuneration,
Withholding Tax 6% on all services
Corporate Income Tax 30% on taxable income and annual income from operators and their JV
contractors.
Supplemental Petroleum Tax 22.50% on ANR calculation. SPT will be applied against a contractor who has a positive amount of ANR for the petroleum operations for a tax year
is liable to pay SPT for that year.
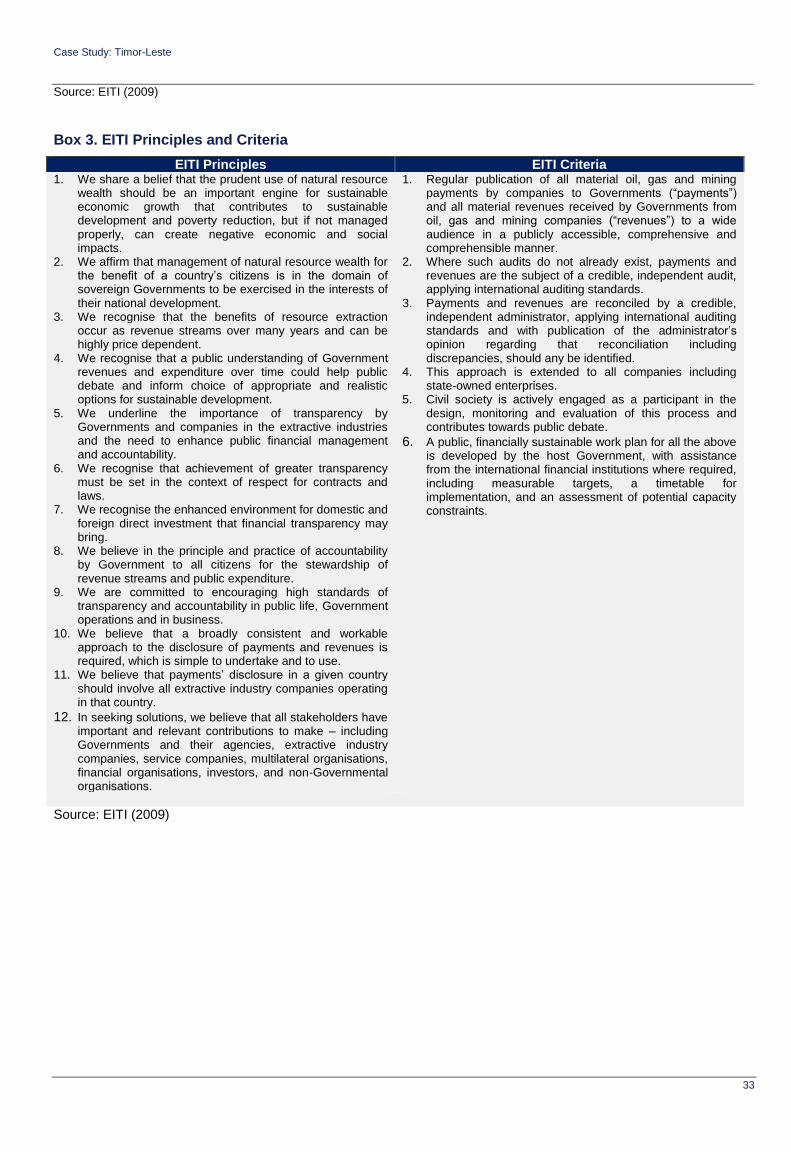
Case Study: Timor-Leste
33
Source: EITI (2009)
Box 3. EITI Principles and Criteria
EITI Principles EITI Criteria 1. We share a belief that the prudent use of natural resource
wealth should be an important engine for sustainable economic growth that contributes to sustainable development and poverty reduction, but if not managed properly, can create negative economic and social impacts.
2. We affirm that management of natural resource wealth for the benefit of a country’s citizens is in the domain of sovereign Governments to be exercised in the interests of their national development.
3. We recognise that the benefits of resource extraction occur as revenue streams over many years and can be highly price dependent.
4. We recognise that a public understanding of Government revenues and expenditure over time could help public debate and inform choice of appropriate and realistic options for sustainable development.
5. We underline the importance of transparency by Governments and companies in the extractive industries and the need to enhance public financial management and accountability.
6. We recognise that achievement of greater transparency must be set in the context of respect for contracts and laws.
7. We recognise the enhanced environment for domestic and foreign direct investment that financial transparency may bring.
8. We believe in the principle and practice of accountability by Government to all citizens for the stewardship of revenue streams and public expenditure.
9. We are committed to encouraging high standards of transparency and accountability in public life, Government operations and in business.
10. We believe that a broadly consistent and workable approach to the disclosure of payments and revenues is required, which is simple to undertake and to use.
11. We believe that payments’ disclosure in a given country should involve all extractive industry companies operating in that country.
12. In seeking solutions, we believe that all stakeholders have important and relevant contributions to make – including Governments and their agencies, extractive industry companies, service companies, multilateral organisations, financial organisations, investors, and non-Governmental organisations.
1. Regular publication of all material oil, gas and mining payments by companies to Governments (“payments”) and all material revenues received by Governments from oil, gas and mining companies (“revenues”) to a wide audience in a publicly accessible, comprehensive and comprehensible manner.
2. Where such audits do not already exist, payments and revenues are the subject of a credible, independent audit, applying international auditing standards.
3. Payments and revenues are reconciled by a credible, independent administrator, applying international auditing standards and with publication of the administrator’s opinion regarding that reconciliation including discrepancies, should any be identified.
4. This approach is extended to all companies including state-owned enterprises.
5. Civil society is actively engaged as a participant in the design, monitoring and evaluation of this process and contributes towards public debate.
6. A public, financially sustainable work plan for all the above is developed by the host Government, with assistance from the international financial institutions where required, including measurable targets, a timetable for implementation, and an assessment of potential capacity constraints.
Source: EITI (2009)
Case Study: Timor-Leste
34
Table 5. Anticipated and Required WASH Financing
Anticipated Yearly 2013-2015 Required Yearly 2011-2020
Gov
Donors /NGOs
Private Sector
HH Total Gov Donors /NGOs
Private Sector
HH Total Surplus /Deficit
Water Supply
Rural 13.0 1.7 0.0 3.6 18.3 13.0 1.7 0.0 4.6 19.3 -1.0
Urban 10.6 4.1 0.0 3.4 18.1 10.6 4.1 0.0 5.4 20.1 -2.0
Total 23.6 5.8 0.0 6.9 36.3 23.6 5.8 0.0 10.0 39.4 -3.1
Sanitation
Rural 0.0 0.0 0.0 1.0 1.0 0.0 0.0 0.0 2.9 2.9 -1.9
Urban 4.7 0.0 0.0 0.8 5.5 4.7 5.8 0.0 3.0 13.5 -8.0
Total 4.7 0.0 0.0 1.7 6.4 4.7 5.8 0.0 5.9 16.4 -10.0 Source: STA (2014).
Table 6. Companies with awarded PSCs
Company Founding Date Activity Nationality
ConocoPhillips 1917 Oil & Gas USA
Eni 1926 Oil & Gas Italy
Santos 1954 Oil & Gas Australia
Inpex 1986 Oil & Gas Australia
Tokyo Timor Sea Resources Pty 1970 Oil & Gas Australia
Talisman Resources Pty/Ltd 2004 Oil & Gas Australia
Source: EITI (2009).
Table 7. Operators and Joint Ventures by Field
Field Operator Joint Venture with
Bayu-Undan ConocoPhillips ENI/Santos/INPEX/Tokyo Timor Sea
Resources Pty
Kitan Eni INPEX Timor Sea Ltd/Talisman
Resources Pty/Ltd
Source: EITI (2009).
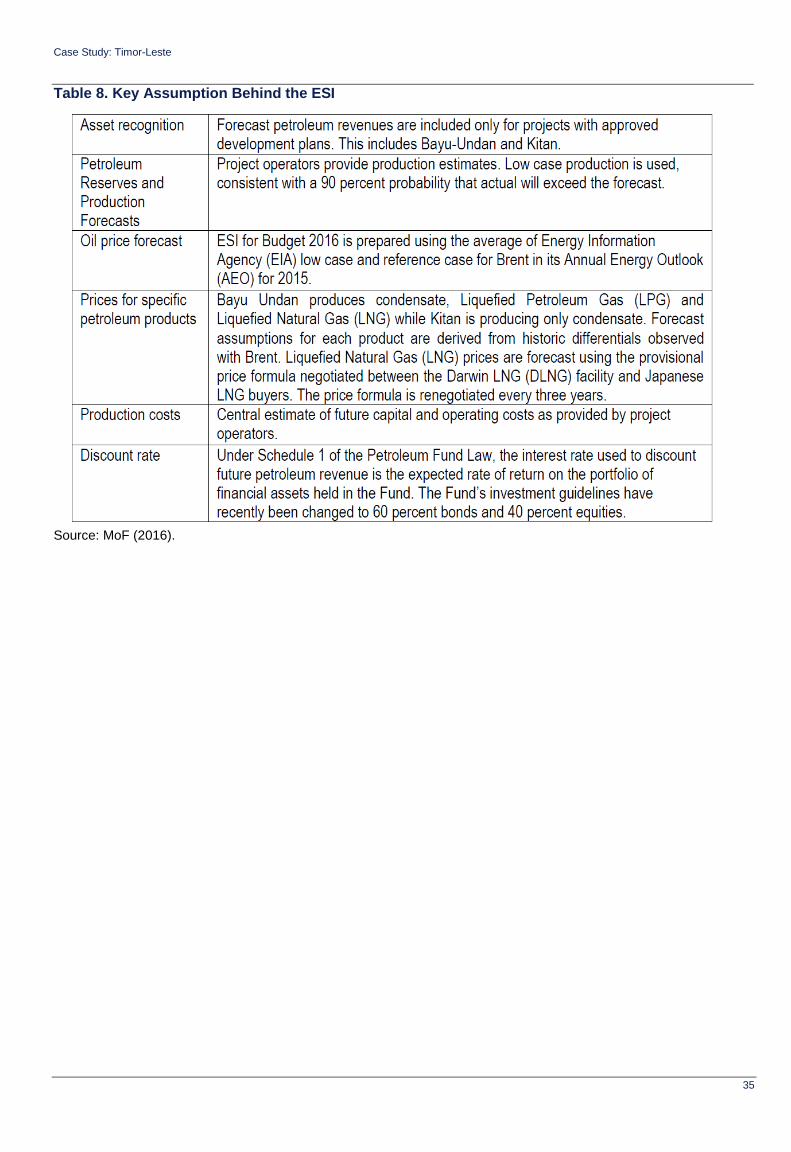
Case Study: Timor-Leste
35
Table 8. Key Assumption Behind the ESI
Source: MoF (2016).