Embed Size (px)
Citation preview
Governmentof Canada
Gouvernementdu Canada
Re s o u r c e sF r o m M i n e r a l
Toward a Value-Added Mineral and Metal Strategy for Canada
Pr o d u c t sT o M a n u f a c t u r e d
From Mineral Resources toManufactured Products:
Toward a Value-Added Mineral and Metal Strategy for Canada
© Minister of Public Works and Government Services Canada — 1998
Additional copies of this publication are available in limited quantities at no charge from:
Minerals and Metals SectorNatural Resources CanadaOttawa, Ontario K1A 0E4Facsimile: (613) 952-7501
Cette publication est aussi disponible en français, sous le titreDe la ressource minérale au produit manufacturé :
Vers une stratégie canadienne de la valeur ajoutée dans l’industrie des minéraux et des métaux
This publication is printedon recycled paper.
PREFACE
Toward a Va lue-Added Minera l and Meta l S t rategy for Canada
T his issues paper is designed as a vehicle to stimulate additionaldialogue between the Government and the mineral and metal
processing (MMP) sector on issues concerning value-added processing. The analysis and proposals contained herein are meant to act as a stimulus for discussion. They do not represent official government policy. They are being put forward simply to act as a starting point for discussion with the MMP sector.
This paper provides a very broad overview of the sector, illustrating itsimportance to employment in Canada and some dynamic trends. It alsodescribes some of the challenges to growth of value-added activities within the direct chain of production or in ancillary spin-off industries.Finally, it suggests several routes for government-industry collaboration that may lead to an increase in MMP value-added activities.
III
V
CONTENTS
1.0 INTRODUCTION...............................................................................................................................1
2.0 THE MINERAL AND METAL SECTOR ........................................................................................3
2.1 MMP Structure and Linkages .....................................................................................................3
2.2 Economic Contribution of the MMP Sector..............................................................................6
2.2.1 Employment and Gross Domestic Product ..................................................................6
2.2.2 International Trade.........................................................................................................8
2.2.3 Industry Structure ........................................................................................................10
2.2.4 Capital Investment Trends...........................................................................................11
2.3 Value Added, Innovation and Productivity ...............................................................................11
2.4 MMP Sector Productivity and Innovation Performance .........................................................12
2.4.1 Productivity ..................................................................................................................12
2.4.2 Innovation.....................................................................................................................14
2.5 Summary of Industry Profiles....................................................................................................16
3.0 VALUE-ADDED CHALLENGES — THE INDUSTRY PERSPECTIVE.................................17
3.1 Positive Factors ..........................................................................................................................17
3.2 Potential Barriers........................................................................................................................18
3.2.1 Business Climate...........................................................................................................18
3.2.2 Trade .............................................................................................................................18
3.2.3 Regulations and Government Programs .....................................................................19
3.2.4 Human Resources ........................................................................................................19
3.2.5 Technology and Innovation .........................................................................................20
4.0 STRATEGIES FOR VALUE ADDED..............................................................................................21
4.1 A Partnership for Industry .........................................................................................................21
4.1.1 Trade Development......................................................................................................22
4.1.2 Human Resources ........................................................................................................22
4.1.3 Environmental Challenges...........................................................................................23
4.1.4 Innovation, Science and Technology...........................................................................23
4.1.5 Comparative Economic/Business Climate ..................................................................23
4.1.6 The Need for Action....................................................................................................24
5.0 JOIN THE DIALOGUE ....................................................................................................................25
1.0INTRODUCTION
Toward a Va lue-Added Minera l and Meta l S t rategy for Canada
From the mining and processing of ore through parts manufacturing andfinal assembly into sophisticated consumer products, the sector makes avital contribution to wealth generation and employment in both urbanand rural regions of the country. Hundreds of rural communities owetheir existence to MMP activities. Scores of them are single-industrycities and towns whose viability depends on one MMP enterprise. MMPfirms often provide the only non-government source of salaried employ-ment in those communities. In many cases, they also account for the bulk of local tax revenues.
The Government of Canada recognizes the importance of the MMP sector. Securing Our Future Together: Preparing Canada for the 21st Centuryis the Liberal policy platform for the Government’s current term. SecuringOur Future Together commits the Government to working with this sectorto remove barriers and capitalize on opportunities for value-added growthand development:
“The new Liberal government will review the constraints facing value-added production in Canada to meet the needs of an evolving manufacturing sector more effectively . . .
A new Liberal government will take a similar integratedapproach [to that taken in agriculture] in other resource sectors to promote value-added production . . . (and) will work withindustry and other governments to promote exports in areassuch as . . . enhanced mineral and metal product manufacturingand mining, smelting, and refining technology.”
Immediately following its re-election, the Government took steps toimplement its value-added policy. Industry Canada and Natural ResourcesCanada (NRCan) arranged a series of consultations with representativesof companies and organizations in the MMP sector. The consultations
Canada’s mineral and metal processing (MMP) sector is one of the major contributors to the Canadian economy.
From Minera l Resources to Manufactured Products :
helped to identify challenges that the sector is facing. The two departments also pulledtogether key statistics and competitiveinformation to shed further light on sector challenges and opportunities.
Before embarking on the main themes ofthis paper, it is useful to define what is meantby “value added.” In economic terms, thevalue added imparted by an operation can be described as the difference between thevalue of the outputs and the value of theinputs. The cumulative total of these differ-ences for a whole economy is called theGross Domestic Product (GDP). Anothercommonly held view is that “value added”refers to the increase in material priceresulting from processing or manufacturingprocesses. Hence, an electronic circuit isworth considerably more per unit weightthan the minerals and metals of which it
was made, or a crafted bronze statue isworth more than the metal alloy from whichit was cast. This paper takes a fairly broadview of what is intended by “value added,”and assumes that it refers to any economic,environmental or social benefit that resultsfrom the further processing and manufacturingof minerals and metals. Therefore, the goalis not only to increase the GDP associateddirectly with mineral and metal processing,but also to increase the employment and otherbenefits that accrue from processing andmanufacturing with minerals and metals, andfrom the many supplier industries, such asengineering, design, environmental tech-nologies, equipment supply and others, thatdepend on the MMP sector for their survival.
2
2.0THE MINERAL AND METAL SECTOR
Toward a Va lue-Added Minera l and Meta l S t rategy for Canada
2.1 MMP Structure and Linkages
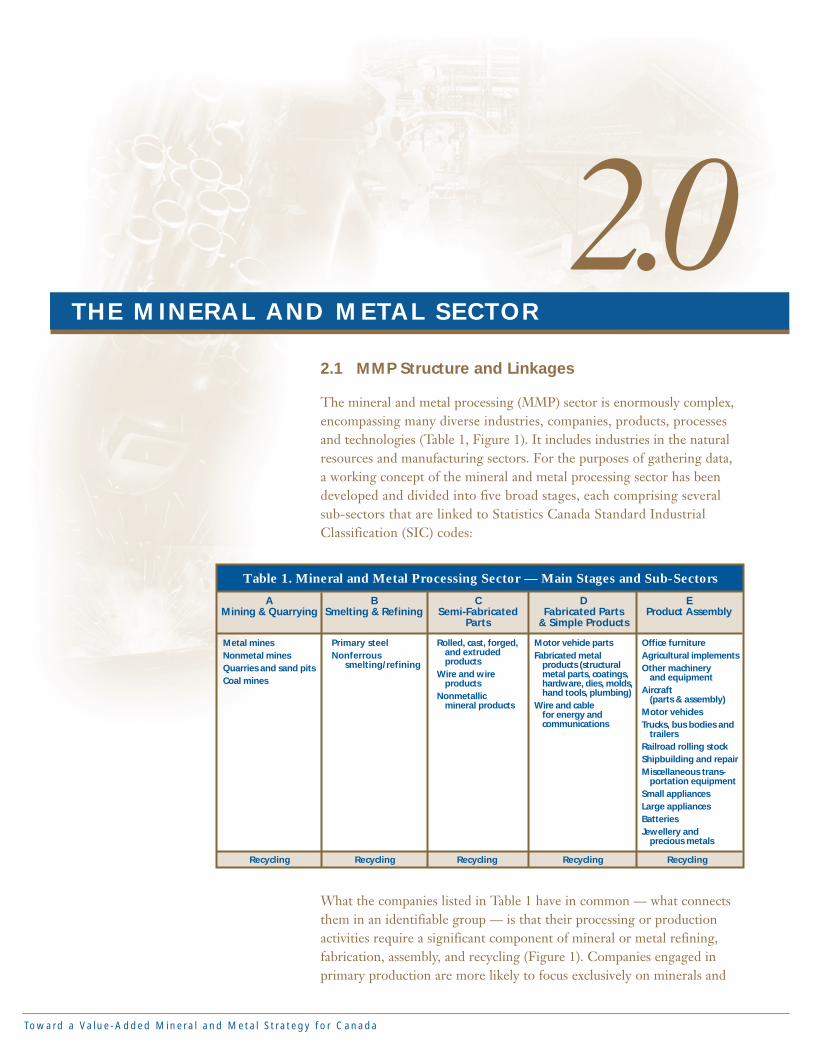
The mineral and metal processing (MMP) sector is enormously complex,encompassing many diverse industries, companies, products, processesand technologies (Table 1, Figure 1). It includes industries in the naturalresources and manufacturing sectors. For the purposes of gathering data,a working concept of the mineral and metal processing sector has beendeveloped and divided into five broad stages, each comprising several sub-sectors that are linked to Statistics Canada Standard IndustrialClassification (SIC) codes:
What the companies listed in Table 1 have in common — what connectsthem in an identifiable group — is that their processing or productionactivities require a significant component of mineral or metal refining,fabrication, assembly, and recycling (Figure 1). Companies engaged in primary production are more likely to focus exclusively on minerals and
Table 1. Mineral and Metal Processing Sector — Main Stages and Sub-Sectors
Metal minesNonmetal minesQuarries and sand pitsCoal mines
Primary steelNonferrous
smelting/refining
Rolled, cast, forged,and extrudedproducts
Wire and wireproducts
Nonmetallicmineral products
Motor vehicle partsFabricated metal
products (structuralmetal parts, coatings,hardware, dies, molds,hand tools, plumbing)
Wire and cablefor energy andcommunications
Office furnitureAgricultural implementsOther machinery
and equipmentAircraft
(parts & assembly)Motor vehiclesTrucks, bus bodies and
trailersRailroad rolling stockShipbuilding and repairMiscellaneous trans-
portation equipmentSmall appliancesLarge appliancesBatteriesJewellery and
precious metals
AMining & Quarrying
BSmelting & Refining
CSemi-Fabricated
Parts
DFabricated Parts
& Simple Products
EProduct Assembly
Recycling Recycling Recycling Recycling Recycling
From Minera l Resources to Manufactured Products :
opportunities for value added, and will not be ignored in the development of a value-added strategy. Most Stage Eindustries use a significant fraction of other materials, such as plastics and fabrics.They are included here because it is notpossible to achieve any understanding ofthe upstream stages without consideringthe performance of the end-use industries.
To illustrate how the MMP sector functions, a simplified example of final demand in the automotive industry is provided below.However, many other industries could also be used as an example.
The automotive example begins with a tonne of iron ore mined in Labrador that is upgraded from 30% iron to 65% iron. It is pelletized in Quebec and is then sent to an integrated steel mill in Ontario. Thereit is processed into 300 kg of steel ingot.
metals, while those engaged inmanufacturing will incorporateother materials into theirprocesses or products. Table 1 is far from being an exhaustivelist of all products that containminerals and metals, since thiswould include almost all ofmanufacturing. In particular,certain key sectors that relyheavily on nonmetallic minerals,such as construction, paints,chemicals and pharmaceuticals,have been excluded. These sub-sectors have been omittedbecause the mineral content of the final product is often acritical, but minor, contributionto the final product, and their
inclusion would distort the data beyondthe point of credibility. Nevertheless, these sub-sectors present significant
Nonmetallic Minerals — One Sector’s Story
The nonmetallic mineral sectorrepresents a vast and variedgroup of industries from the
highly diverse mineral-producingsector to more than 100 end-use
industries that include the prominent construction sectoralong with specialized impor-
tant manufacturing sectors.
The mineral-producing sector isan important contributor to theeconomy; it provides more than
50 000 jobs, and generates morethan $3 billion to the economy.
This sector contributes to the eco-nomic welfare of more than 400
rural communities across Canada.
Only 10% of Canada’s totalmineral production is consideredto be value added. The potentialexists to increase this ratio by
5 to 10 percentage points, reflecting a possibleincrease in the domestic production value
of close to $100 million. According to NaturalResources Canada, sectors of possible growth
include silica products, fused minerals (magnesia, zirconia, etc.), high-grade lime,
semi-finished natural graphite products andsynthetic diamonds (produced from high-purity
graphite), cut and polished diamonds and semi-precious stones (e.g., amethyst, jade and garnet),
asbestos-containing parts, and enhanced sulphur and potash specialty nutrients.
Among other factors, advanced materials technology, stringent environmental regula-tions, and elaborate product specifications inthe fabrication of semi-finished and finishedproducts (automobile, aerospace) provide
opportunities for the value-added manu-facturing of nonmetallic products in Canada.
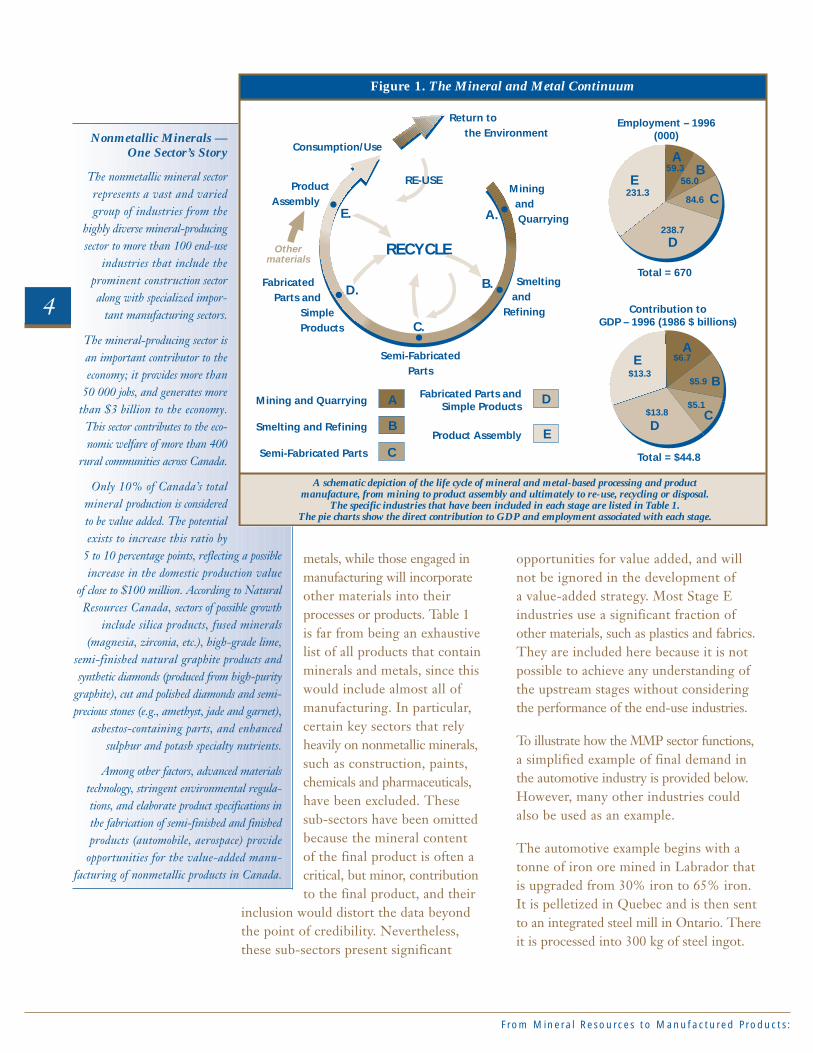
Figure 1. The Mineral and Metal Continuum
A schematic depiction of the life cycle of mineral and metal-based processing and productmanufacture, from mining to product assembly and ultimately to re-use, recycling or disposal.
The specific industries that have been included in each stage are listed in Table 1.The pie charts show the direct contribution to GDP and employment associated with each stage.
Smeltingand
Refining
Return tothe Environment
Othermaterials
Semi-FabricatedParts
FabricatedParts and
SimpleProducts
ProductAssembly
Consumption/Use
Mining and Quarrying
RE-USE
RECYCLE
A.
B.
C.
D.
E.
Mining and Quarrying
Smelting and Refining
Semi-Fabricated Parts
Fabricated Parts andSimple Products
Product Assembly
Contribution toGDP – 1996 (1986 $ billions)
Total = $44.8
A
B
CD
E $6.7
$5.9
$5.1$13.8
$13.3
Total = 670
Employment – 1996(000)
AB
C
D
E59.3
56.0
84.6
238.7
231.3
A
B
C
D
E
4
Toward a Va lue-Added Minera l and Meta l S t rategy for Canada
That steel is shipped to a nearby castingplant where it is formed into a rough partfor an automobile. The casting is thentransferred to another factory where it ismachined into a finished part. That part is shipped back to Quebec, where it isinstalled on a car that is sold to an autodealer in Alberta. A number of years later,the vehicle wears out and is shipped to aplant in Saskatchewan to be recycled intoscrap. A steelworks in Regina melts thescrap and produces new steel to be madeinto new products.
In the above example, each company onthe continuum applies labour and techno-logy to the (mineral or metal) materials itprocesses. Thus, each company “adds value”to those materials. As a result, at eachstage in the processing chain, the finishedproduct is worth more than the value of the raw steel input materials. One measure of the importance of the MMPsector is the employment and GDP associated with each industry in the direct chain of production.
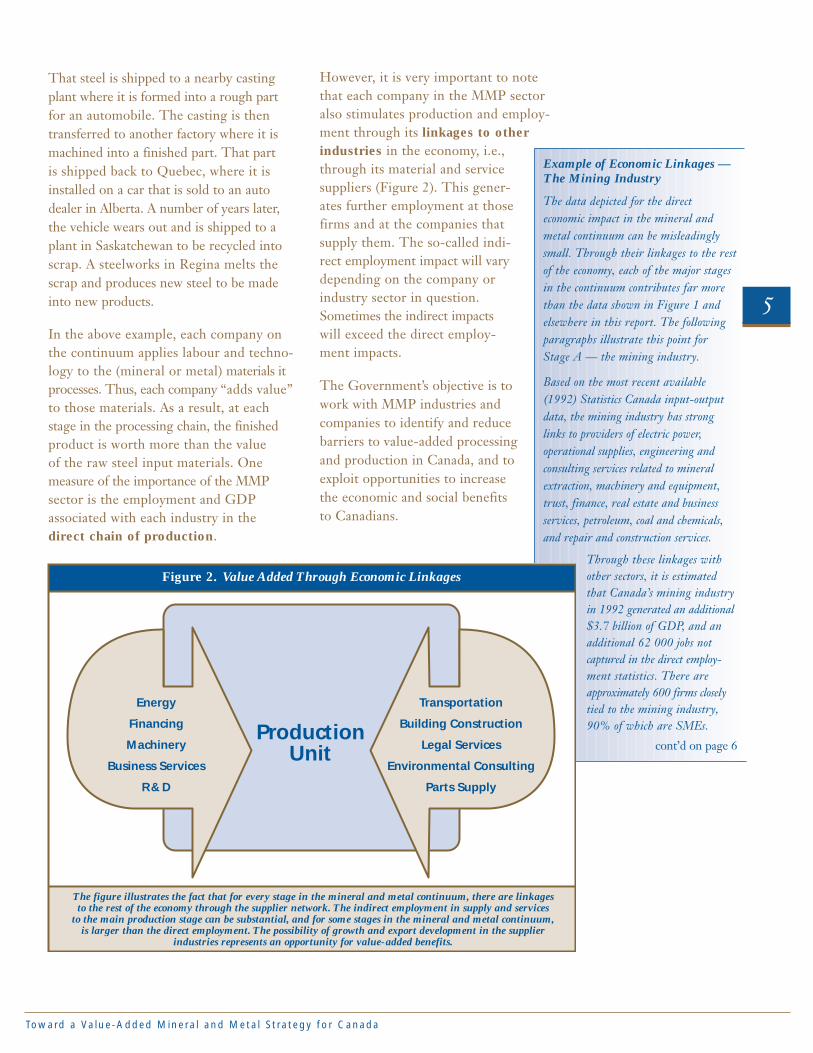
However, it is very important to note that each company in the MMP sector also stimulates production and employ-ment through its linkages to otherindustries in the economy, i.e.,through its material and servicesuppliers (Figure 2). This gener-ates further employment at thosefirms and at the companies thatsupply them. The so-called indi-rect employment impact will varydepending on the company orindustry sector in question.Sometimes the indirect impacts will exceed the direct employ-ment impacts.
The Government’s objective is towork with MMP industries andcompanies to identify and reducebarriers to value-added processingand production in Canada, and toexploit opportunities to increasethe economic and social benefitsto Canadians.
Example of Economic Linkages — The Mining Industry
The data depicted for the direct economic impact in the mineral andmetal continuum can be misleadinglysmall. Through their linkages to the restof the economy, each of the major stagesin the continuum contributes far morethan the data shown in Figure 1 andelsewhere in this report. The followingparagraphs illustrate this point forStage A — the mining industry.
Based on the most recent available (1992) Statistics Canada input-outputdata, the mining industry has strong links to providers of electric power, operational supplies, engineering and consulting services related to mineralextraction, machinery and equipment,trust, finance, real estate and businessservices, petroleum, coal and chemicals,and repair and construction services.
Through these linkages withother sectors, it is estimatedthat Canada’s mining industryin 1992 generated an additional$3.7 billion of GDP, and anadditional 62 000 jobs not captured in the direct employ-ment statistics. There areapproximately 600 firms closelytied to the mining industry,90% of which are SMEs.
cont’d on page 6
5
Figure 2. Value Added Through Economic Linkages
The figure illustrates the fact that for every stage in the mineral and metal continuum, there are linkagesto the rest of the economy through the supplier network. The indirect employment in supply and services
to the main production stage can be substantial, and for some stages in the mineral and metal continuum,is larger than the direct employment. The possibility of growth and export development in the supplier
industries represents an opportunity for value-added benefits.
Transportation
Building Construction
Legal Services
Environmental Consulting
Parts Supply
ProductionUnit
Energy
Financing
Machinery
Business Services
R & D
2.2 Economic Contribution of the MMP Sector
2.2.1 Employment and Gross Domestic Product
The mineral and metal processing sector has a far-reaching impact on Canada’seconomy and society. Considerthat companies in the sector provided direct employment for 670 000 people in 1996(Figure 1), and indirect employ-ment for hundreds of thousandsmore. Mineral and metal process-ing firms in total employ morepeople than companies engaged in agriculture, construction, transportation and storage, or communications.
Employment in the MMP sectoris on par with that in wholesaletrade, finance, insurance and
From Minera l Resources to Manufactured Products :
real estate, and government services.Overall, it is estimated that well over one million jobs depend on the performance of the MMP sector.
The MMP sector has a huge impact on Canada’s economy. In 1996, the sectorcontributed the equivalent of nearly $44.8 billion to GDP (in 1986 dollars),which was over 8% of the country’s total GDP in the year.1 Moreover, MMP companies and their employeescontribute billions of dollars annually in the form of municipal, provincial and federal taxes. As such, they under-write a large part of the cost of the public services that are so important to Canadians.
Since the MMP sector in total is very complex, including literally thousands of firms ranging in size from a fewemployees to tens of thousands of
cont’d from page 5
Canada has become the world’s centre formine financing, raising $8.8 billion on capital
markets for domestic and foreign minefinancing in 1996. Moreover, in 1997, theshares of more than 300 mining companiestraded on the Toronto Stock Exchange andaccounted for 27% of the trading volume,second only to the financial services sector.
The mining industry also finances research in value-added products. In fact, seven
mining and smelting firms were listed amongCanada’s top 100 R&D spenders in 1995.
For example, through in-house research or inpartnership with academia and governmentresearch laboratories, the mining industry has been involved in research programs onautomated drilling, heavy equipment and
robotics, rechargeable batteries, specialty mineral powders and coatings, galvanized
metals for automotive and constructionapplications, reduced diesel emis-
sions, underground communications,and metals and tailings recycling.
Furthermore, research on exploration technologies has led to
the development of knowledge-basedindustries in geomatics and map-ping. Environmental research onsubjects such as acid mine drainage,aquatic effects, and metals in theenvironment has enabled Canada to become a world leader in theunderstanding of environmentalimpacts and remediation technolo-gies. A 1995 study showed that
17 000 people were employed inminerals- and metals-related envi-ronmental consulting firms that
generated $2 billion in sales.
All in all, the benefits to Canada ofhaving a major production industry
like mining far exceed the directbenefits captured in statistical data.
6
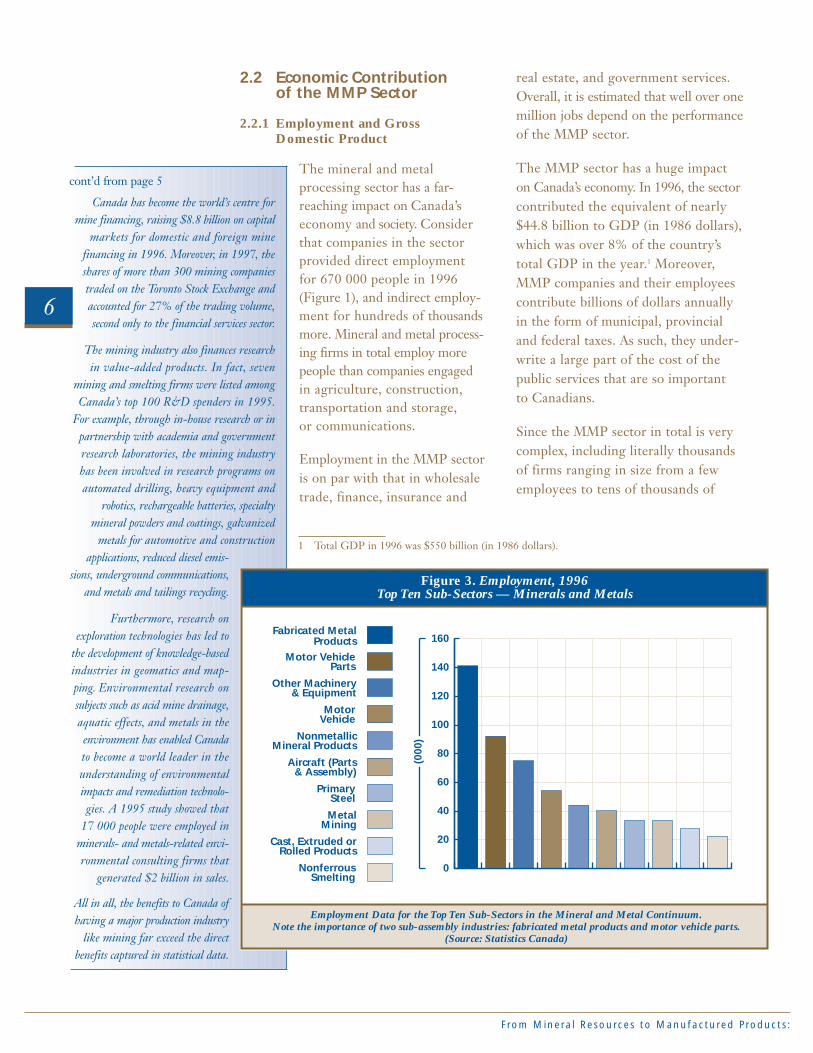
Figure 3. Employment, 1996Top Ten Sub-Sectors — Minerals and Metals
Employment Data for the Top Ten Sub-Sectors in the Mineral and Metal Continuum.Note the importance of two sub-assembly industries: fabricated metal products and motor vehicle parts.
(Source: Statistics Canada)
0
20
40
60
80
100
120
140
160Fabricated Metal
ProductsMotor Vehicle
Parts
Other Machinery& Equipment
MotorVehicle
NonmetallicMineral Products
Aircraft (Parts& Assembly)
PrimarySteel
MetalMining
Cast, Extruded orRolled Products
NonferrousSmelting
(000
)
1 Total GDP in 1996 was $550 billion (in 1986 dollars).
Toward a Va lue-Added Minera l and Meta l S t rategy for Canada
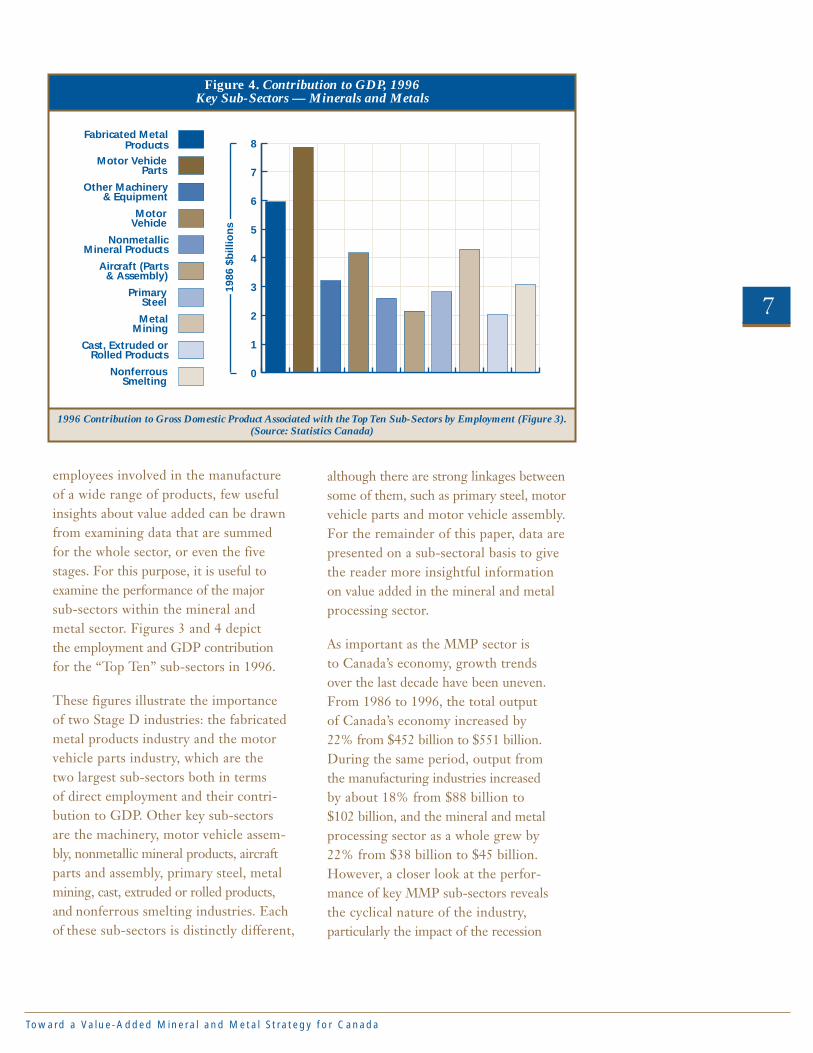
employees involved in the manufacture of a wide range of products, few usefulinsights about value added can be drawnfrom examining data that are summed for the whole sector, or even the fivestages. For this purpose, it is useful toexamine the performance of the major sub-sectors within the mineral and metal sector. Figures 3 and 4 depict the employment and GDP contribution for the “Top Ten” sub-sectors in 1996.
These figures illustrate the importance of two Stage D industries: the fabricatedmetal products industry and the motorvehicle parts industry, which are the two largest sub-sectors both in terms of direct employment and their contri-bution to GDP. Other key sub-sectors are the machinery, motor vehicle assem-bly, nonmetallic mineral products, aircraftparts and assembly, primary steel, metalmining, cast, extruded or rolled products,and nonferrous smelting industries. Eachof these sub-sectors is distinctly different,
although there are strong linkages betweensome of them, such as primary steel, motorvehicle parts and motor vehicle assembly.For the remainder of this paper, data arepresented on a sub-sectoral basis to givethe reader more insightful informationon value added in the mineral and metalprocessing sector.
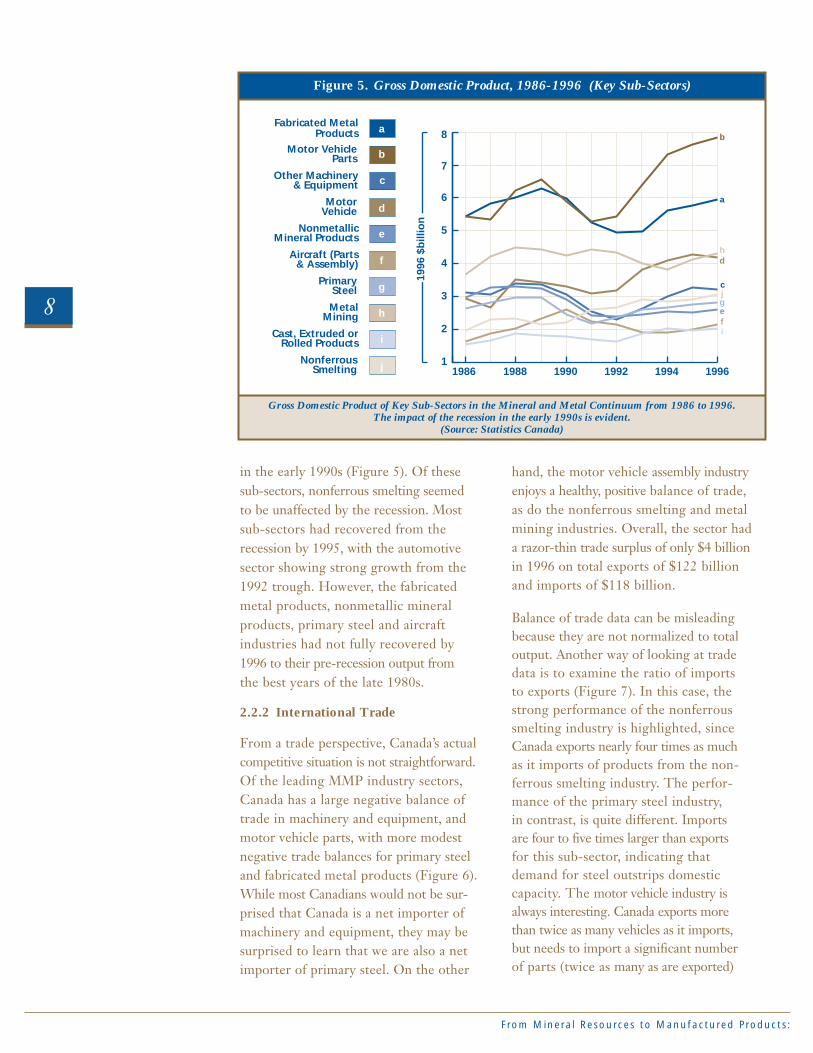
As important as the MMP sector is to Canada’s economy, growth trends over the last decade have been uneven.From 1986 to 1996, the total output of Canada’s economy increased by 22% from $452 billion to $551 billion.During the same period, output from the manufacturing industries increased by about 18% from $88 billion to $102 billion, and the mineral and metalprocessing sector as a whole grew by22% from $38 billion to $45 billion.However, a closer look at the perfor-mance of key MMP sub-sectors revealsthe cyclical nature of the industry, particularly the impact of the recession
7
Fabricated MetalProducts
Motor VehicleParts
Other Machinery& Equipment
MotorVehicle
NonmetallicMineral Products
Aircraft (Parts& Assembly)
PrimarySteel
MetalMining
Cast, Extruded orRolled Products
NonferrousSmelting
Figure 4. Contribution to GDP, 1996Key Sub-Sectors — Minerals and Metals
1996 Contribution to Gross Domestic Product Associated with the Top Ten Sub-Sectors by Employment (Figure 3).(Source: Statistics Canada)
0
1
2
3
4
5
6
7
8
1986
$b
illio
ns
From Minera l Resources to Manufactured Products :
in the early 1990s (Figure 5). Of these sub-sectors, nonferrous smelting seemed to be unaffected by the recession. Most sub-sectors had recovered from the recession by 1995, with the automotive sector showing strong growth from the1992 trough. However, the fabricated metal products, nonmetallic mineral products, primary steel and aircraft industries had not fully recovered by 1996 to their pre-recession output from the best years of the late 1980s.
2.2.2 International Trade
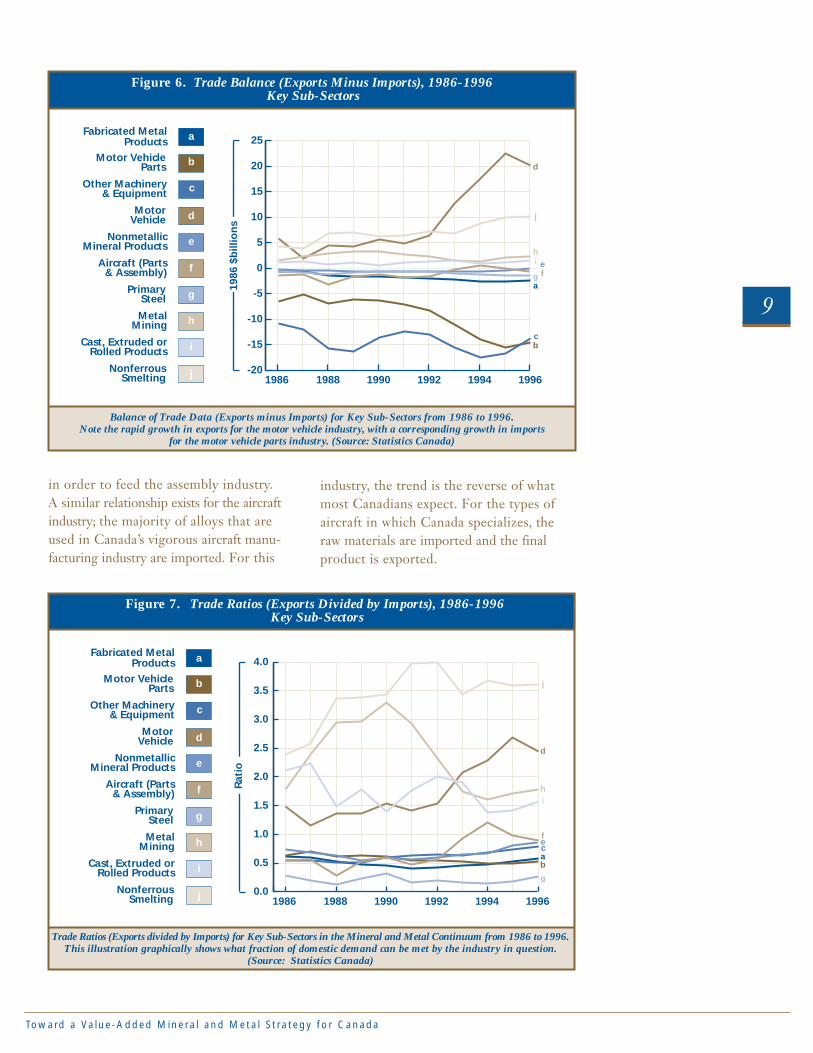
From a trade perspective, Canada’s actualcompetitive situation is not straightforward. Of the leading MMP industry sectors,Canada has a large negative balance oftrade in machinery and equipment, andmotor vehicle parts, with more modest negative trade balances for primary steeland fabricated metal products (Figure 6).While most Canadians would not be sur-prised that Canada is a net importer ofmachinery and equipment, they may be surprised to learn that we are also a netimporter of primary steel. On the other
hand, the motor vehicle assembly industryenjoys a healthy, positive balance of trade, as do the nonferrous smelting and metalmining industries. Overall, the sector had a razor-thin trade surplus of only $4 billion in 1996 on total exports of $122 billion and imports of $118 billion.
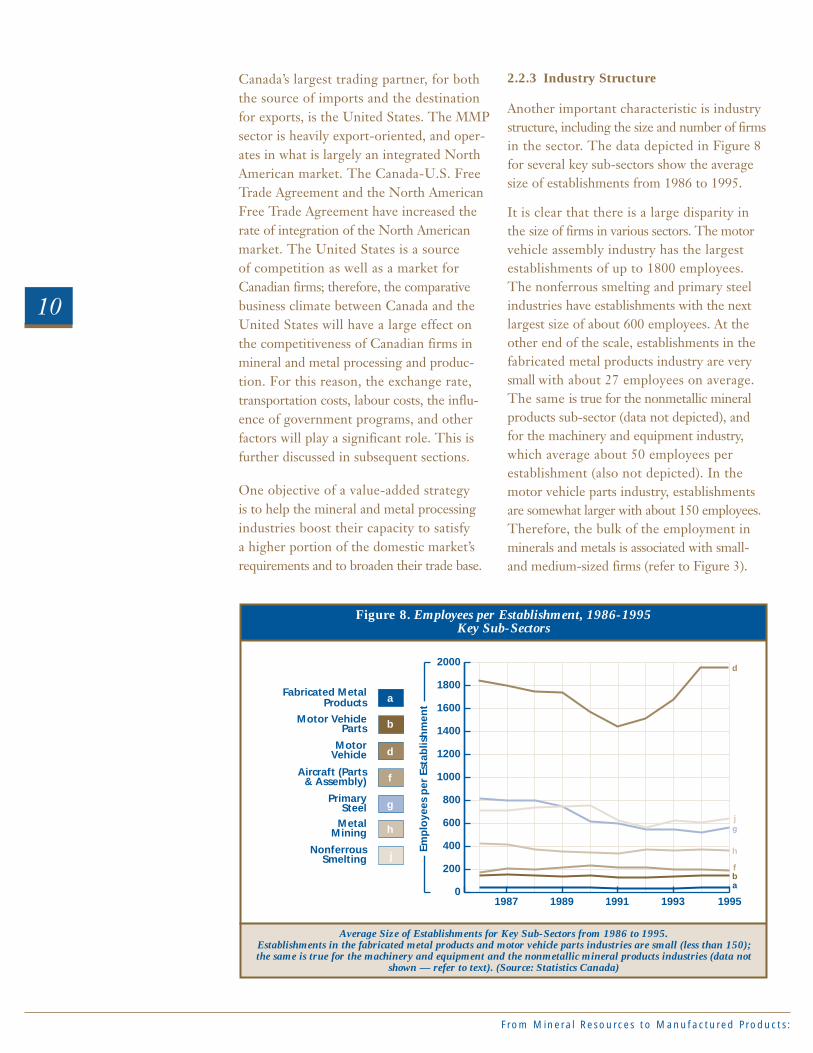
Balance of trade data can be misleadingbecause they are not normalized to total output. Another way of looking at tradedata is to examine the ratio of imports to exports (Figure 7). In this case, thestrong performance of the nonferroussmelting industry is highlighted, sinceCanada exports nearly four times as much as it imports of products from the non-ferrous smelting industry. The perfor-mance of the primary steel industry, in contrast, is quite different. Imports are four to five times larger than exports for this sub-sector, indicating thatdemand for steel outstrips domesticcapacity. The motor vehicle industry isalways interesting. Canada exports morethan twice as many vehicles as it imports,but needs to import a significant number of parts (twice as many as are exported)
8
Figure 5. Gross Domestic Product, 1986-1996 (Key Sub-Sectors)
1
2
3
4
5
6
7
8
1986 1988 1990 1992 1994 1996
Gross Domestic Product of Key Sub-Sectors in the Mineral and Metal Continuum from 1986 to 1996.The impact of the recession in the early 1990s is evident.
(Source: Statistics Canada)
Fabricated MetalProducts
Motor VehicleParts
Other Machinery& Equipment
MotorVehicle
NonmetallicMineral Products
Aircraft (Parts& Assembly)
PrimarySteel
MetalMining
Cast, Extruded orRolled Products
NonferrousSmelting
a
b
c
d
e
f
g
h
i
j
1996
$b
illio
n
a
b
hd
cj
if
ge
Toward a Va lue-Added Minera l and Meta l S t rategy for Canada
in order to feed the assembly industry. A similar relationship exists for the aircraftindustry; the majority of alloys that are used in Canada’s vigorous aircraft manu-facturing industry are imported. For this
industry, the trend is the reverse of whatmost Canadians expect. For the types ofaircraft in which Canada specializes, theraw materials are imported and the finalproduct is exported.
9
Fabricated MetalProducts
Motor VehicleParts
Other Machinery& Equipment
MotorVehicle
NonmetallicMineral Products
Aircraft (Parts& Assembly)
PrimarySteel
MetalMining
Cast, Extruded orRolled Products
NonferrousSmelting
Figure 6. Trade Balance (Exports Minus Imports), 1986-1996Key Sub-Sectors
-20
-15
-10
-5
0
5
10
15
20
25
1986 1988 1990 1992 1994 1996
1986
$b
illio
ns
Balance of Trade Data (Exports minus Imports) for Key Sub-Sectors from 1986 to 1996.Note the rapid growth in exports for the motor vehicle industry, with a corresponding growth in imports
for the motor vehicle parts industry. (Source: Statistics Canada)
a
h
d
j
ifg
e
bc
a
b
c
d
e
f
g
h
i
j
Fabricated MetalProducts
Motor VehicleParts
Other Machinery& Equipment
MotorVehicle
NonmetallicMineral Products
Aircraft (Parts& Assembly)
PrimarySteel
MetalMining
Cast, Extruded orRolled Products
NonferrousSmelting
Trade Ratios (Exports divided by Imports) for Key Sub-Sectors in the Mineral and Metal Continuum from 1986 to 1996.This illustration graphically shows what fraction of domestic demand can be met by the industry in question.
(Source: Statistics Canada)
0.0
0.5
1.0
1.5
2.0
2.5
3.0
3.5
4.0
1986 1988 1990 1992 1994 1996
Rat
io
Figure 7. Trade Ratios (Exports Divided by Imports), 1986-1996Key Sub-Sectors
a
h
d
j
i
f
g
b
ce
a
b
c
d
e
f
g
h
i
j
From Minera l Resources to Manufactured Products :
Canada’s largest trading partner, for boththe source of imports and the destinationfor exports, is the United States. The MMPsector is heavily export-oriented, and oper-ates in what is largely an integrated NorthAmerican market. The Canada-U.S. FreeTrade Agreement and the North AmericanFree Trade Agreement have increased therate of integration of the North Americanmarket. The United States is a source of competition as well as a market forCanadian firms; therefore, the comparativebusiness climate between Canada and theUnited States will have a large effect on the competitiveness of Canadian firms inmineral and metal processing and produc-tion. For this reason, the exchange rate,transportation costs, labour costs, the influ-ence of government programs, and otherfactors will play a significant role. This isfurther discussed in subsequent sections.
One objective of a value-added strategy is to help the mineral and metal processingindustries boost their capacity to satisfy a higher portion of the domestic market’srequirements and to broaden their trade base.
2.2.3 Industry Structure
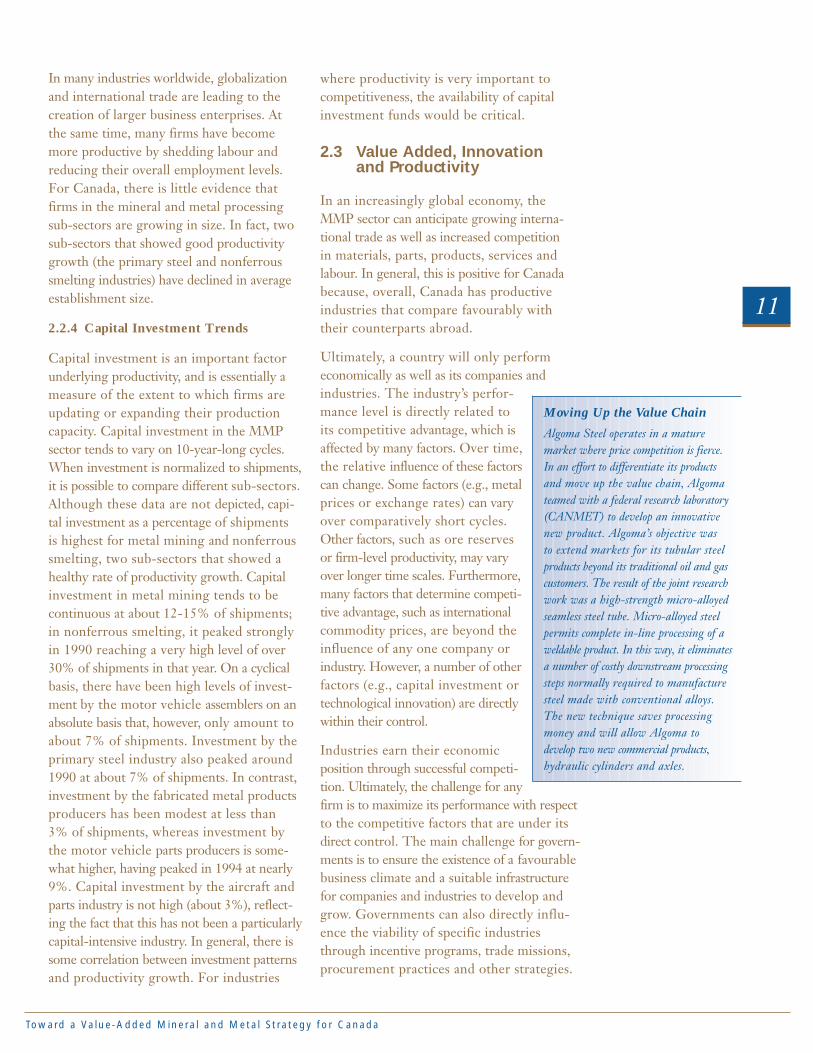
Another important characteristic is industrystructure, including the size and number of firmsin the sector. The data depicted in Figure 8for several key sub-sectors show the averagesize of establishments from 1986 to 1995.
It is clear that there is a large disparity in the size of firms in various sectors. The motorvehicle assembly industry has the largestestablishments of up to 1800 employees. The nonferrous smelting and primary steelindustries have establishments with the nextlargest size of about 600 employees. At theother end of the scale, establishments in thefabricated metal products industry are verysmall with about 27 employees on average.The same is true for the nonmetallic mineralproducts sub-sector (data not depicted), andfor the machinery and equipment industry,which average about 50 employees per establishment (also not depicted). In the motor vehicle parts industry, establishments are somewhat larger with about 150 employees.Therefore, the bulk of the employment inminerals and metals is associated with small-and medium-sized firms (refer to Figure 3).
10
NonferrousSmelting j
MetalMining h
PrimarySteel g
Aircraft (Parts& Assembly)
MotorVehicle d
Motor VehicleParts
Fabricated MetalProducts
Figure 8. Employees per Establishment, 1986-1995Key Sub-Sectors
Average Size of Establishments for Key Sub-Sectors from 1986 to 1995.Establishments in the fabricated metal products and motor vehicle parts industries are small (less than 150);the same is true for the machinery and equipment and the nonmetallic mineral products industries (data not
shown — refer to text). (Source: Statistics Canada)
0
200
400
600
800
1000
1200
1400
1600
1800
2000
1987 1989 1991 1993 1995
Emp
loye
es p
er E
stab
lish
men
t
f
b
a
a
h
d
j
f
g
b
Toward a Va lue-Added Minera l and Meta l S t rategy for Canada
In many industries worldwide, globalizationand international trade are leading to thecreation of larger business enterprises. Atthe same time, many firms have becomemore productive by shedding labour andreducing their overall employment levels.For Canada, there is little evidence thatfirms in the mineral and metal processingsub-sectors are growing in size. In fact, twosub-sectors that showed good productivitygrowth (the primary steel and nonferroussmelting industries) have declined in averageestablishment size.
2.2.4 Capital Investment Trends
Capital investment is an important factorunderlying productivity, and is essentially ameasure of the extent to which firms areupdating or expanding their productioncapacity. Capital investment in the MMP sector tends to vary on 10-year-long cycles.When investment is normalized to shipments,it is possible to compare different sub-sectors.Although these data are not depicted, capi-tal investment as a percentage of shipments is highest for metal mining and nonferroussmelting, two sub-sectors that showed ahealthy rate of productivity growth. Capitalinvestment in metal mining tends to becontinuous at about 12-15% of shipments;in nonferrous smelting, it peaked stronglyin 1990 reaching a very high level of over30% of shipments in that year. On a cyclicalbasis, there have been high levels of invest-ment by the motor vehicle assemblers on anabsolute basis that, however, only amount toabout 7% of shipments. Investment by theprimary steel industry also peaked around1990 at about 7% of shipments. In contrast,investment by the fabricated metal productsproducers has been modest at less than 3% of shipments, whereas investment bythe motor vehicle parts producers is some-what higher, having peaked in 1994 at nearly9%. Capital investment by the aircraft andparts industry is not high (about 3%), reflect-ing the fact that this has not been a particularlycapital-intensive industry. In general, there issome correlation between investment patternsand productivity growth. For industries
where productivity is very important tocompetitiveness, the availability of capitalinvestment funds would be critical.
2.3 Value Added, Innovation and Productivity
In an increasingly global economy, theMMP sector can anticipate growing interna-tional trade as well as increased competition in materials, parts, products, services andlabour. In general, this is positive for Canadabecause, overall, Canada has productiveindustries that compare favourably withtheir counterparts abroad.
Ultimately, a country will only perform economically as well as its companies andindustries. The industry’s perfor-mance level is directly related toits competitive advantage, which isaffected by many factors. Over time,the relative influence of these factorscan change. Some factors (e.g., metalprices or exchange rates) can varyover comparatively short cycles.Other factors, such as ore reservesor firm-level productivity, may varyover longer time scales. Furthermore,many factors that determine competi-tive advantage, such as internationalcommodity prices, are beyond theinfluence of any one company orindustry. However, a number of otherfactors (e.g., capital investment ortechnological innovation) are directlywithin their control.
Industries earn their economicposition through successful competi-tion. Ultimately, the challenge for anyfirm is to maximize its performance with respectto the competitive factors that are under itsdirect control. The main challenge for govern-ments is to ensure the existence of a favourablebusiness climate and a suitable infrastructurefor companies and industries to develop andgrow. Governments can also directly influ-ence the viability of specific industriesthrough incentive programs, trade missions,procurement practices and other strategies.
11
Moving Up the Value ChainAlgoma Steel operates in a mature market where price competition is fierce. In an effort to differentiate its products and move up the value chain, Algomateamed with a federal research laboratory(CANMET) to develop an innovativenew product. Algoma’s objective was to extend markets for its tubular steelproducts beyond its traditional oil and gascustomers. The result of the joint researchwork was a high-strength micro-alloyedseamless steel tube. Micro-alloyed steelpermits complete in-line processing of aweldable product. In this way, it eliminatesa number of costly downstream processingsteps normally required to manufacturesteel made with conventional alloys. The new technique saves processingmoney and will allow Algoma to develop two new commercial products,hydraulic cylinders and axles.
From Minera l Resources to Manufactured Products :
Whether at the level of an individual firm, an industry or a nation, increasing value-addedactivities demands increasing competitiveness.What, then, is the source of competitiveness,and how can it be increased?
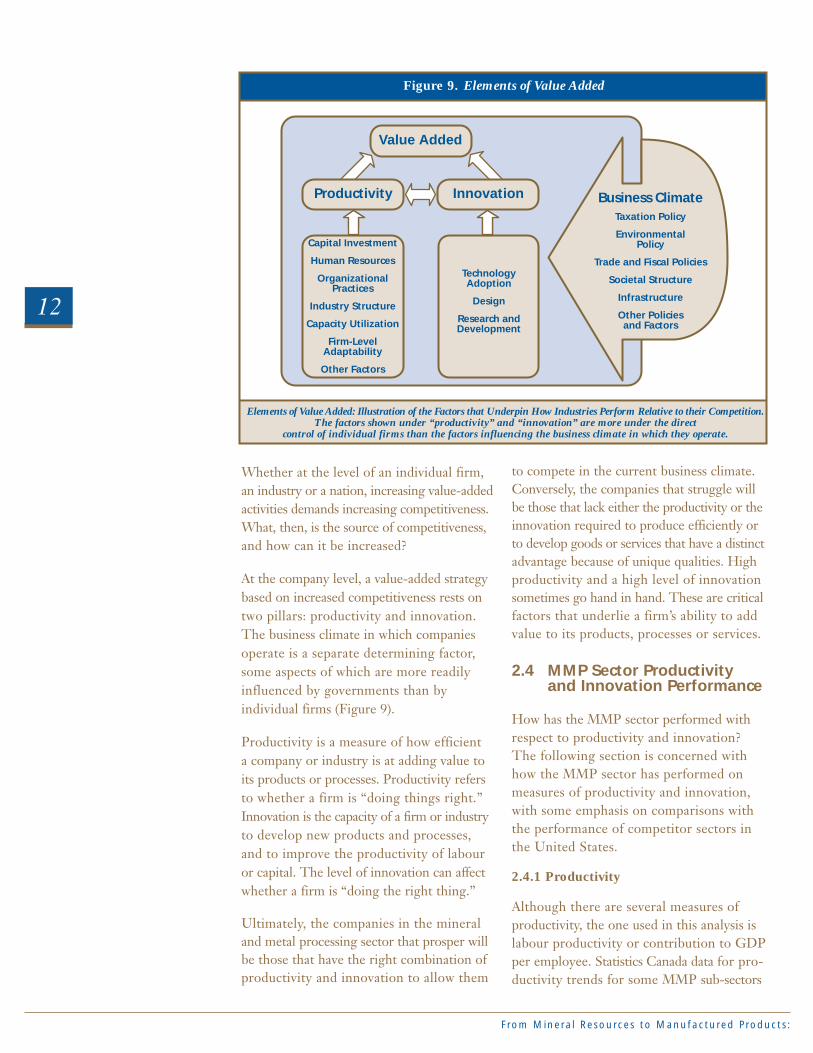
At the company level, a value-added strategybased on increased competitiveness rests ontwo pillars: productivity and innovation.The business climate in which companiesoperate is a separate determining factor,some aspects of which are more readilyinfluenced by governments than byindividual firms (Figure 9).
Productivity is a measure of how efficient a company or industry is at adding value toits products or processes. Productivity refersto whether a firm is “doing things right.”Innovation is the capacity of a firm or industryto develop new products and processes, and to improve the productivity of labour or capital. The level of innovation can affectwhether a firm is “doing the right thing.”
Ultimately, the companies in the mineraland metal processing sector that prosper willbe those that have the right combination ofproductivity and innovation to allow them
to compete in the current business climate.Conversely, the companies that struggle willbe those that lack either the productivity or theinnovation required to produce efficiently orto develop goods or services that have a distinctadvantage because of unique qualities. Highproductivity and a high level of innovationsometimes go hand in hand. These are criticalfactors that underlie a firm’s ability to addvalue to its products, processes or services.
2.4 MMP Sector Productivityand Innovation Performance
How has the MMP sector performed withrespect to productivity and innovation?The following section is concerned withhow the MMP sector has performed onmeasures of productivity and innovation, with some emphasis on comparisons with the performance of competitor sectors in the United States.
2.4.1 Productivity
Although there are several measures of productivity, the one used in this analysis islabour productivity or contribution to GDPper employee. Statistics Canada data for pro-ductivity trends for some MMP sub-sectors
12
Figure 9. Elements of Value Added
Elements of Value Added: Illustration of the Factors that Underpin How Industries Perform Relative to their Competition.The factors shown under “productivity” and “innovation” are more under the direct
control of individual firms than the factors influencing the business climate in which they operate.
Value Added
Capital Investment
Human Resources
OrganizationalPractices
Industry Structure
Capacity Utilization
Firm-LevelAdaptability
Other Factors
TechnologyAdoption
Design
Research andDevelopment
InnovationProductivity Business ClimateTaxation Policy
EnvironmentalPolicy
Trade and Fiscal Policies
Societal Structure
Infrastructure
Other Policiesand Factors
Toward a Va lue-Added Minera l and Meta l S t rategy for Canada
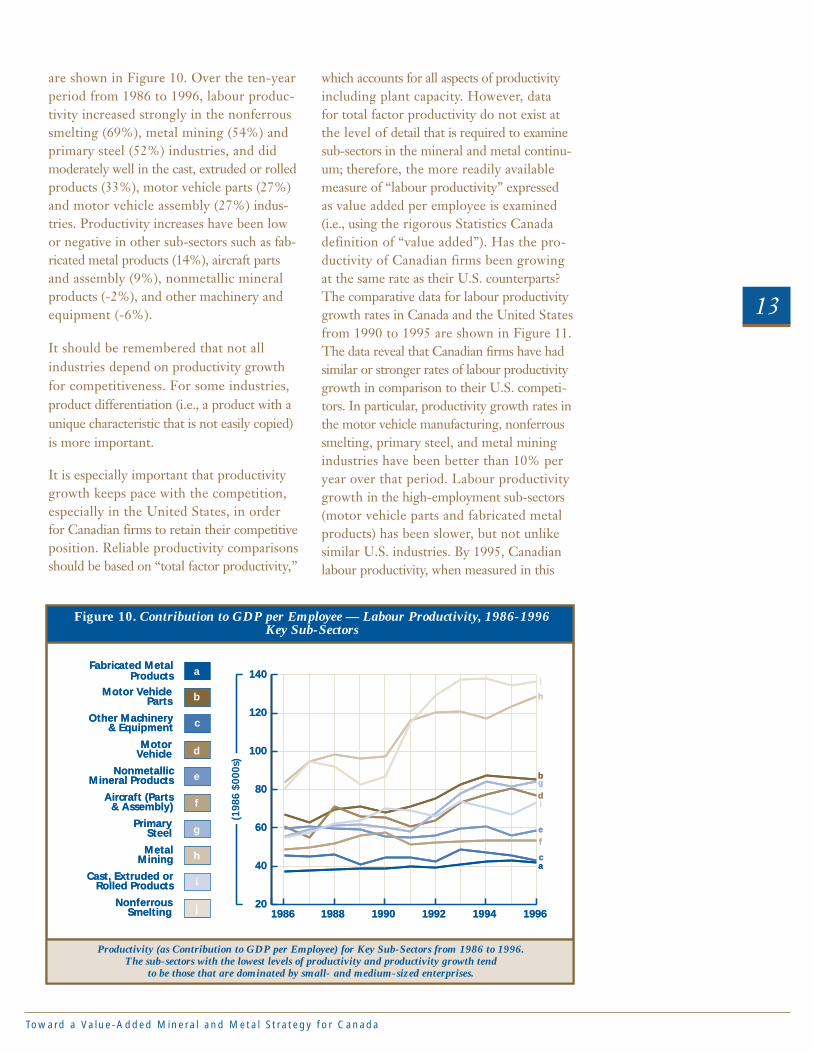
are shown in Figure 10. Over the ten-yearperiod from 1986 to 1996, labour produc-tivity increased strongly in the nonferroussmelting (69%), metal mining (54%) andprimary steel (52%) industries, and didmoderately well in the cast, extruded or rolledproducts (33%), motor vehicle parts (27%)and motor vehicle assembly (27%) indus-tries. Productivity increases have been low or negative in other sub-sectors such as fab-ricated metal products (14%), aircraft partsand assembly (9%), nonmetallic mineralproducts (-2%), and other machinery andequipment (-6%).
It should be remembered that not allindustries depend on productivity growthfor competitiveness. For some industries,product differentiation (i.e., a product with aunique characteristic that is not easily copied)is more important.
It is especially important that productivitygrowth keeps pace with the competition,especially in the United States, in order for Canadian firms to retain their competitiveposition. Reliable productivity comparisonsshould be based on “total factor productivity,”
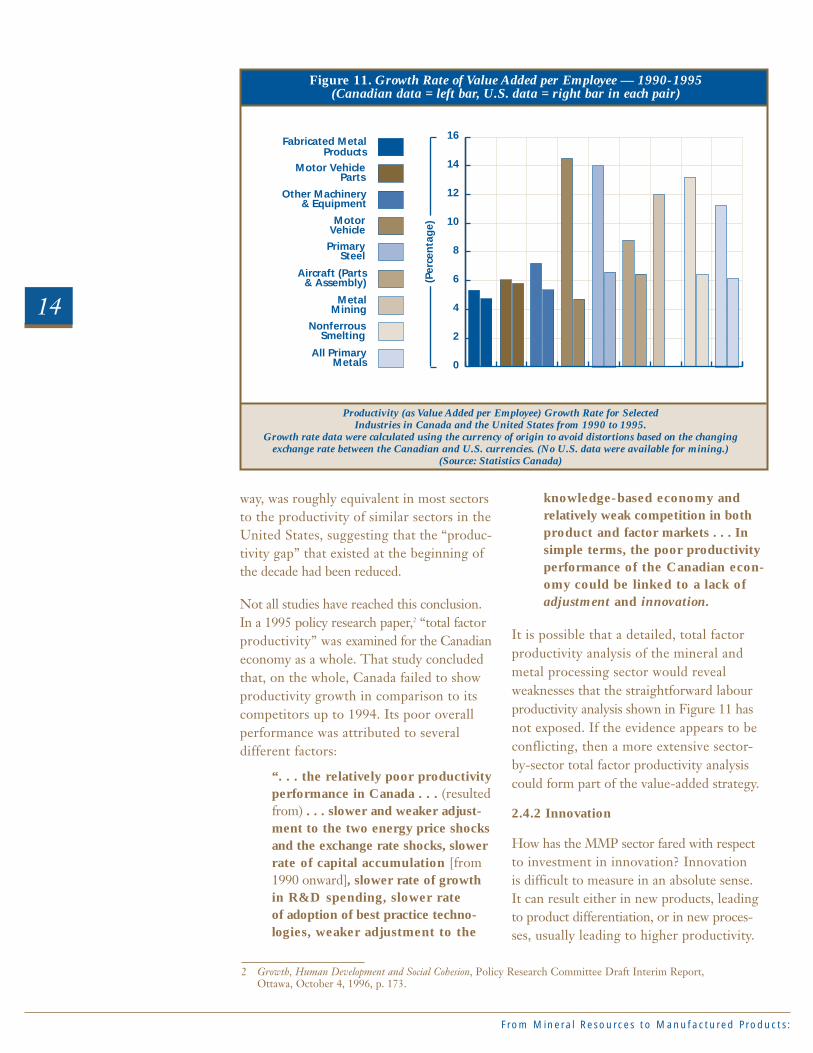
which accounts for all aspects of productivityincluding plant capacity. However, data for total factor productivity do not exist atthe level of detail that is required to examinesub-sectors in the mineral and metal continu-um; therefore, the more readily availablemeasure of “labour productivity” expressedas value added per employee is examined(i.e., using the rigorous Statistics Canadadefinition of “value added”). Has the pro-ductivity of Canadian firms been growingat the same rate as their U.S. counterparts?The comparative data for labour productivitygrowth rates in Canada and the United Statesfrom 1990 to 1995 are shown in Figure 11.The data reveal that Canadian firms have hadsimilar or stronger rates of labour productivitygrowth in comparison to their U.S. competi-tors. In particular, productivity growth rates inthe motor vehicle manufacturing, nonferroussmelting, primary steel, and metal miningindustries have been better than 10% peryear over that period. Labour productivitygrowth in the high-employment sub-sectors(motor vehicle parts and fabricated metalproducts) has been slower, but not unlikesimilar U.S. industries. By 1995, Canadianlabour productivity, when measured in this
13
Fabricated MetalProducts
Motor VehicleParts
Other Machinery& Equipment
MotorVehicle
NonmetallicMineral Products
Aircraft (Parts& Assembly)
PrimarySteel
MetalMining
Cast, Extruded orRolled Products
NonferrousSmelting
a
b
c
d
e
f
g
h
i
j
Figure 10. Contribution to GDP per Employee — Labour Productivity, 1986-1996Key Sub-Sectors
Productivity (as Contribution to GDP per Employee) for Key Sub-Sectors from 1986 to 1996.The sub-sectors with the lowest levels of productivity and productivity growth tend
to be those that are dominated by small- and medium-sized enterprises.
20
40
60
80
100
120
140
1986 1988 1990 1992 1994 1996
(198
6 $0
00s)
a
h
d
j
i
f
g
e
b
c
From Minera l Resources to Manufactured Products :
way, was roughly equivalent in most sectorsto the productivity of similar sectors in theUnited States, suggesting that the “produc-tivity gap” that existed at the beginning ofthe decade had been reduced.
Not all studies have reached this conclusion.In a 1995 policy research paper,2 “total factorproductivity” was examined for the Canadianeconomy as a whole. That study concludedthat, on the whole, Canada failed to showproductivity growth in comparison to itscompetitors up to 1994. Its poor overall performance was attributed to several different factors:
“. . . the relatively poor productivityperformance in Canada . . . (resultedfrom) . . . slower and weaker adjust-ment to the two energy price shocksand the exchange rate shocks, slowerrate of capital accumulation [from1990 onward], slower rate of growthin R&D spending, slower rate of adoption of best practice techno-logies, weaker adjustment to the
knowledge-based economy and relatively weak competition in bothproduct and factor markets . . . Insimple terms, the poor productivityperformance of the Canadian econ-omy could be linked to a lack ofadjustment and innovation.
It is possible that a detailed, total factor productivity analysis of the mineral andmetal processing sector would reveal weaknesses that the straightforward labourproductivity analysis shown in Figure 11 hasnot exposed. If the evidence appears to beconflicting, then a more extensive sector-by-sector total factor productivity analysiscould form part of the value-added strategy.
2.4.2 Innovation
How has the MMP sector fared with respectto investment in innovation? Innovation is difficult to measure in an absolute sense. It can result either in new products, leadingto product differentiation, or in new proces-ses, usually leading to higher productivity.
14
2 Growth, Human Development and Social Cohesion, Policy Research Committee Draft Interim Report, Ottawa, October 4, 1996, p. 173.
Figure 11. Growth Rate of Value Added per Employee — 1990-1995(Canadian data = left bar, U.S. data = right bar in each pair)
Productivity (as Value Added per Employee) Growth Rate for SelectedIndustries in Canada and the United States from 1990 to 1995.
Growth rate data were calculated using the currency of origin to avoid distortions based on the changingexchange rate between the Canadian and U.S. currencies. (No U.S. data were available for mining.)
(Source: Statistics Canada)
0
2
4
6
8
10
12
14
16
(Per
cen
tag
e)
All PrimaryMetals
NonferrousSmelting
MetalMining
PrimarySteel
Fabricated MetalProducts
Motor VehicleParts
Other Machinery& Equipment
MotorVehicle
Aircraft (Parts& Assembly)
Toward a Va lue-Added Minera l and Meta l S t rategy for Canada
It is generally accepted that research anddevelopment (R&D) expenditures are anapproximate indicator of innovation. As with productivity, it is not absolute levels of innovation that are important, but ratherinnovation in comparison to competition.
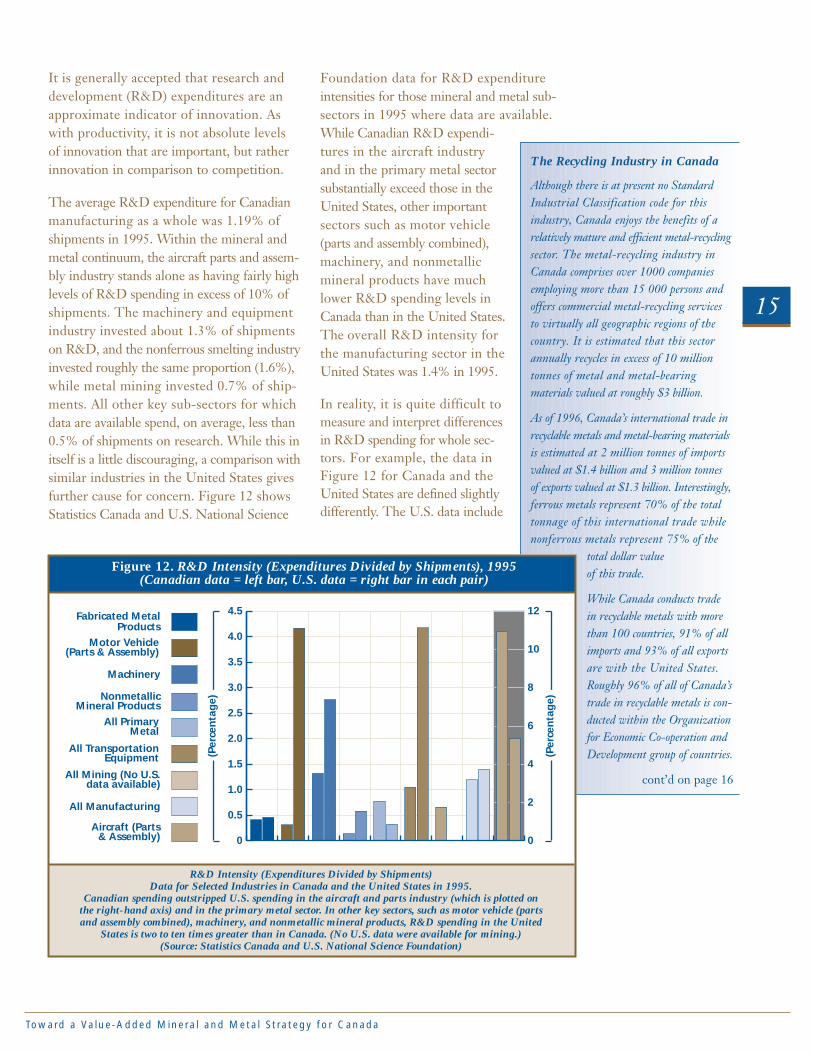
The average R&D expenditure for Canadianmanufacturing as a whole was 1.19% ofshipments in 1995. Within the mineral andmetal continuum, the aircraft parts and assem-bly industry stands alone as having fairly highlevels of R&D spending in excess of 10% ofshipments. The machinery and equipmentindustry invested about 1.3% of shipmentson R&D, and the nonferrous smelting industryinvested roughly the same proportion (1.6%),while metal mining invested 0.7% of ship-ments. All other key sub-sectors for whichdata are available spend, on average, less than0.5% of shipments on research. While this initself is a little discouraging, a comparison withsimilar industries in the United States givesfurther cause for concern. Figure 12 showsStatistics Canada and U.S. National Science
Foundation data for R&D expenditureintensities for those mineral and metal sub-sectors in 1995 where data are available.While Canadian R&D expendi-tures in the aircraft industry and in the primary metal sectorsubstantially exceed those in theUnited States, other importantsectors such as motor vehicle(parts and assembly combined),machinery, and nonmetallicmineral products have muchlower R&D spending levels inCanada than in the United States.The overall R&D intensity forthe manufacturing sector in theUnited States was 1.4% in 1995.
In reality, it is quite difficult tomeasure and interpret differencesin R&D spending for whole sec-tors. For example, the data inFigure 12 for Canada and theUnited States are defined slightlydifferently. The U.S. data include
15
The Recycling Industry in Canada
Although there is at present no StandardIndustrial Classification code for this industry, Canada enjoys the benefits of arelatively mature and efficient metal-recyclingsector. The metal-recycling industry inCanada comprises over 1000 companiesemploying more than 15 000 persons andoffers commercial metal-recycling servicesto virtually all geographic regions of thecountry. It is estimated that this sectorannually recycles in excess of 10 milliontonnes of metal and metal-bearing materials valued at roughly $3 billion.
As of 1996, Canada’s international trade inrecyclable metals and metal-bearing materialsis estimated at 2 million tonnes of importsvalued at $1.4 billion and 3 million tonnes of exports valued at $1.3 billion. Interestingly,ferrous metals represent 70% of the totaltonnage of this international trade whilenonferrous metals represent 75% of the
total dollar value of this trade.
While Canada conducts trade in recyclable metals with morethan 100 countries, 91% of allimports and 93% of all exportsare with the United States.Roughly 96% of all of Canada’strade in recyclable metals is con-ducted within the Organizationfor Economic Co-operation andDevelopment group of countries.
cont’d on page 16
All Manufacturing
All Mining (No U.S.data available)
All PrimaryMetal
NonmetallicMineral Products
All TransportationEquipment
Aircraft (Parts& Assembly)
Machinery
Motor Vehicle(Parts & Assembly)
Fabricated MetalProducts
Figure 12. R&D Intensity (Expenditures Divided by Shipments), 1995(Canadian data = left bar, U.S. data = right bar in each pair)
(Per
cen
tag
e)
(Per
cen
tag
e)
R&D Intensity (Expenditures Divided by Shipments)Data for Selected Industries in Canada and the United States in 1995.
Canadian spending outstripped U.S. spending in the aircraft and parts industry (which is plotted onthe right-hand axis) and in the primary metal sector. In other key sectors, such as motor vehicle (partsand assembly combined), machinery, and nonmetallic mineral products, R&D spending in the United
States is two to ten times greater than in Canada. (No U.S. data were available for mining.)(Source: Statistics Canada and U.S. National Science Foundation)
0
2
4
6
8
10
12
0
0.5
1.0
1.5
2.0
2.5
3.0
3.5
4.0
4.5
From Minera l Resources to Manufactured Products :
spending by industry and organizations otherthan the federal government. The Canadiandata include only spending by industry. Otherfactors come into play, not the least of whichis the degree of foreign ownership and theimpact of government programs in othernations. It is known, for example, that researchspending by the motor vehicle assemblyindustry in Canada is low because its researchcentres are located in the United Statesnear home offices. This has not impactednegatively on the competitiveness of Canadianassembly operations since there is no hesita-tion on the part of foreign owners to utilizerecent technology in Canadian plants, which
have an excellent reputation forproductivity. Nevertheless, theimpact on the Canadian motorvehicle parts industry is perhapsmore subtle. There is concern thatthe Canadian motor vehicle partsindustry has not developed its rela-tive share of the higher-technologyautomotive parts and sub-systems,such as transmission components,electronics and exterior skinstampings. Does the absence ofR&D spending in Canada by thebig motor vehicle assembly com-panies influence the extent towhich Canadian parts suppliersreceive development contractswhen new technologies are beingdisseminated to suppliers? Couldthis in turn impact on the long-term growth of the parts sectorin Canada? Although the datashown here are not conclusive,they do suggest that Canadianfirms in certain key mineral andmetal sub-sectors (associated withhigh levels of employment) maybe failing to move into the higher-technology end of the product chainwithin their industry. Research todetermine the answers to thesequestions with respect to motorvehicle parts and other sub-sectorscould form part of a federal strategyto increase value added in Canada.
On the basis of the limited data shown here,Canadians have been relatively successful inimproving productivity since the recessionin the late 1980s and early 1990s, but invest-ments in future product development havebeen weaker, except for the primary metals and aircraft industries.
2.5 Summary of IndustryProfiles
To summarize, the mineral and metal continuum is comprised of a tremendousdiversity of firms that produce a wide arrayof products. Firms in the upstream (miningand smelting) stages tend to be large compa-nies that are capable of making significantcapital and R&D investments. These firmshave shown good labour productivitygrowth over the past decade, which hasallowed them to remain competitive buthas resulted in an overall loss of directemployment. Their dependency on thedomestic Canadian market for the sale of their products is minimal as most oftheir production is exported. It appears that the bulk of employment associated withminerals and metals resides in small- andmedium-sized firms in the semi-fabricatedparts, fabricated parts and products, andnonmetallic mineral products sub-sectors in the middle of the continuum. These firmsexperience much more difficulty in finding the resources to make significant capital or R&D investments. These small firmsdepend on the large firms in the downstreamproduct-assembly end of the continuum for their survival. Canadian companies are quite successful in the downstream end of the continuum, such as in motorvehicle and aircraft assembly, which tends to be dominated by large and often foreign-owned firms.
16
cont’d from page 15
In common with other key value-addedsectors in the mineral and metal processingchain, the metal-recycling industry consists
predominantly of a large number of verysmall, technically unsophisticated companies.
Materials, once collected, are crudely segregated by the small collectors and aresubsequently sold to larger, more integratedmetal-recycling firms. The larger recycling
enterprises consolidate these materials withtheir own domestic and imported industrial
supply sources. Once processed, segregatedand packaged, these metal commodities are
sold domestically and internationally for con-sumption by metallurgical industries, semi-manufacturing operations and for direct use
by consumer product manufacturers.
Many value-added opportunities exist in therecycling of materials arising from the post-
consumer sectors. Employment documentationresulting from a U.S.-based regional studyindicates that on a per-ton basis, recycling
operations create more than ten times asmany jobs as disposal operations. Developmentof this field is relatively new and the potentialfor significant job creation and value-added
activities is high. Since more and more mate-rials are being diverted from final landfill
disposal operations, there is an increasing needfor upgraded collection and sorting systems,better processing technologies and improvedoperational facilities to segregate and recycle
these former waste materials into raw mate-rial products destined for commercial use.
3.0VALUE-ADDED CHALLENGES — THE INDUSTRY PERSPECTIVE
Toward a Va lue-Added Minera l and Meta l S t rategy for Canada
In December 1997, Industry Canada and Natural Resources Canadasponsored three MMP industry consultations. Participants were asked to respond to a number of questions:
What factors are affecting your future competitiveness?
• Enabling factors/helpers?
• Hindering factors/obstacles?
What are you doing to:
• Maximize the enabling factors?
• Minimize the hindering factors?
- What has worked?
- What didn’t?
How can we work together to resolve these competitiveness issues?
The following is a synopsis of the results of the consultations.
3.1 Positive Factors
Companies and organizations that took part in the consultations indicatedthat a number of competitive factors are working in their favour. A lowCanadian dollar, free trade, and the large North American market arespurring exports. Access to high-quality raw materials and inexpensiveenergy is good. Low interest rates and balanced government budgets have reduced the cost of capital. In some industries, consolidation of thesupplier base has increased sales levels. Canadian universities have goodresearch capabilities that are well linked to the needs of industry in somesectors. A good communications infrastructure makes it easy to do busi-ness. Canada has a well-educated, flexible work force with a good work
From Minera l Resources to Manufactured Products :
ethic. Working relations between industryand federal and provincial governmentsappear to be improving. Canada also enjoys a good reputation abroad, and the TeamCanada model is helping to promoteCanadian firms. The country also has abilingual, sometimes multilingual, workforce, which makes it easier to do business in other countries. Finally, because Canadaadheres to the metric and ISO systems,Canadian products and companies aresaleable in most of the world.
Clearly, there is much in the current businessclimate that favours the growth of companiesin the MMP sector. At the same time, though,industry participants were not reluctant to
identify factors that they believedwere affecting their competitive-ness in a negative way.
3.2 Potential Barriers
In spite of the many favourableaspects of doing business in Canada,companies identified a number ofchallenges facing their sector. Insome cases, participants in the consultations also pointed toactions they are taking to addressthe challenges. The following is a summary of the challenges andindustry’s responses.
3.2.1 Business Climate
Industry is not uniformly positiveabout the business climate inCanada. A number of firms pointedto the high level of payroll, incomeand property taxes. Some com-plained about a lack of financingavailable to SMEs.3 The lowCanadian dollar can be a double-edged sword; although it makesCanadian products more pricecompetitive, it can result in reduced
income and increases the cost of importingspecialty materials and equipment from
abroad. Some firms are negatively affected by transportation costs and a relatively small,dispersed market. Others believe thatCanada lacks an efficient port infrastructure.Although low by world standards, energycosts have been rising steadily. The global-ization of markets has introduced morecompetition for manufacturers of commo-dity products. The small size of Canadianfirms, compared to their U.S. counterparts,also makes it harder for some to sell offshore.Some firms believe that lingering uncertaintyrelated to national unity has put a damperon foreign investment in Canada.
3.2.2 Trade
The MMP sector is clearly concerned withsome aspects of Canada’s trade situation.Globalization is forcing (smaller) Canadianfirms to compete with (larger) firms abroad.Subsidized imports and outright dumpinghave adversely affected some industries (e.g., the steel industry). Some organizationsbelieve the MMP sector has developed anover-reliance on the U.S. market to theexclusion of other opportunities. In someparts of the world, local content rules makeit difficult to sell Canadian goods. Therewas also a feeling that Canadian trade representatives abroad are not providing sufficient support for overseas marketing.
The companies also reported on initiativesthey are taking to address trade challenges.They are participating in international trade missions to develop markets outside of North America. In the past four years,one firm has increased its non-U.S. businessfrom zero to 50% of sales. Another firmworked with Canadian and U.S. Customs to streamline border-crossing procedures in order to meet “just-in-time” deliveryschedules. Some firms are cooperating toform industry alliances to stimulate exportsby collecting trade information and carryingout market studies. Others are working withtrade specialists in government to gather
18
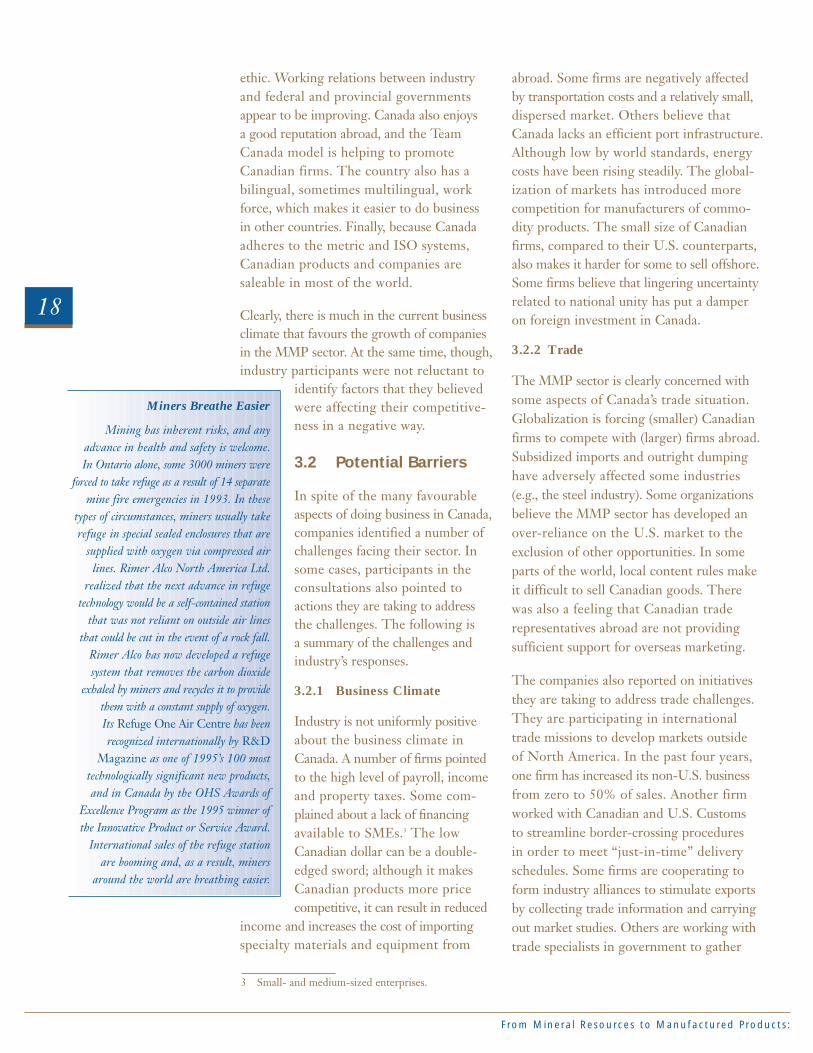
Miners Breathe Easier
Mining has inherent risks, and anyadvance in health and safety is welcome.In Ontario alone, some 3000 miners were
forced to take refuge as a result of 14 separatemine fire emergencies in 1993. In these
types of circumstances, miners usually takerefuge in special sealed enclosures that are
supplied with oxygen via compressed airlines. Rimer Alco North America Ltd.
realized that the next advance in refugetechnology would be a self-contained station
that was not reliant on outside air linesthat could be cut in the event of a rock fall.
Rimer Alco has now developed a refugesystem that removes the carbon dioxide
exhaled by miners and recycles it to providethem with a constant supply of oxygen.Its Refuge One Air Centre has been recognized internationally by R&D
Magazine as one of 1995’s 100 mosttechnologically significant new products,and in Canada by the OHS Awards of
Excellence Program as the 1995 winner ofthe Innovative Product or Service Award.
International sales of the refuge stationare booming and, as a result, miners
around the world are breathing easier.
3 Small- and medium-sized enterprises.
Toward a Va lue-Added Minera l and Meta l S t rategy for Canada
market and other information of interest to companies. One firm has entered intojoint ventures with foreign companies inorder to tap into offshore markets.
3.2.3 Regulations and GovernmentPrograms
Many in industry believe they are subject to domestic over-regulation. One examplegiven was a municipal hydro developmentlevy for a greenfield industrial development.Cumbersome and overlapping federal,provincial and municipal environmental regulations are a source of concern to somein industry. Many firms believe that non-tariff barriers in other countries, such as the “Buy America” program, make it diffi-cult for them to win business abroad. Inaddition, some firms find that customs andimmigration practices sometimes overridethe intent of trade agreements and make it difficult to move goods and personnel.
One company complained about feesimposed by the federal government onmaterials entering Canada for recycling.Another firm was concerned about theimplications of the hazardous waste provisionsof the Basel Convention. Some participantsin the consultations argued for the need fora sound scientific approach to setting envi-ronmental regulations. Firms want IndustryCanada and Natural Resources Canada to be actively involved in the development ofenvironmental policies.
A number of participants in the consulta-tions are concerned with what they feel areoverlapping, and in some cases redundant,standards within industry, for example, with respect to container sizes or product fasteners. Non-recognition of someCanadian standards was also cited as a problem in some instances. In addition, the non-alignment of some Canadian andinternational standards has caused problems for some sectors.
Industry is concerned with what itperceives to be a lack of programand policy coordination betweenand within governments. It is alsoconcerned with what it views aslengthy delays in governmentdecision-making. Some participantsin the consultations complainedthat provincial government pro-grams and policies sometimes createan uneven playing field betweenprovinces. A lack of continuityand difficulty in accessing gov-ernment programs was anothersource of complaint.
Many firms have found thatbecoming ISO registered hasbeen advantageous to domesticand international sales. Some companies are working on com-mittees to develop national andinternational standards, and topromote mutual standards recog-nition. By sub-contracting workto European and U.S. companies,one firm has produced productsto both metric and ISO standards.
3.2.4 Human Resources
Industry voiced many concernsabout its human resource situa-tion. Even though general humanresource conditions are positive,there is a high level of dissatisfactionwith some aspects of training andthe labour market. Some firms areexperiencing a critical shortage ofcertain categories of skilled work-ers, especially tool and die makers,and computer-aided design (CAD)and environmental technicians,where knowledge requirementshave increased dramatically. Manyfirms have recognized they havean aging work force, but have
19
Influence of InternationalRegulatory Framework
While there are many commercial opportuni-ties in the recycling sector, these and otherbenefits of recycling cannot be realized without a supportive regulatory regime.
Although Canada’s trade activity in recyclable metals has been increasing over the past five years, the industry has identified several important factors that limit its future growth potential in domestic and international markets.Ironically, one of these is the negative impact of legislation that was intended to help protect the environment.
In 1989, as a consequence of the Basel Convention on the Transboundary Movements of Hazardous Wastes and theirDisposal, Canada redefined the term“waste” to include recyclable materials.The impact of this has been that the inter-national movement of any recyclable metalthat has a hazard characteristic must bemanaged as though it was hazardous wastedestined for final disposal. Since many valu-able metals have hazardous characteristics,these recyclable metals now fall under the definition of “hazardous wastes” and are subject to several restrictive measures.
For example, prior to the import or export ofany hazardous recyclable resource, Canadianindustry must follow a number of expensiveprocedures, such as operating in a priorinformed consent regime, utilizing hazardouswaste licenced carriers for transportation, andobtaining a minimum of $1 million inenvironmental liability insurance. Moreover,several international treaties do not recognizethese recyclable materials as valuableresources and are imposing restrictive bans on their transboundary movement. Theseregulatory actions, combined with the negativestigma associated with the term “waste” asapplied to recyclable resources, may actually behampering efforts to increase the recycling ofmetals, not only limiting commercialopportunities, but also the obvious environ-mental benefits of recycling metals.
From Minera l Resources to Manufactured Products :
no concrete plans to deal with successionand replacement. Certain types of skillstraining and apprenticeship programs are not available locally, which exacerbates
the skill shortages.
Many in industry believe that theprestige of blue-collar jobs hasdeclined, and that talented youngpeople no longer seek them out.They believe that skilled manualtrades have an image problemdespite good employment andsalary prospects, and the increasingtechnical challenge of these jobs.They feel that such careers are nolonger promoted in high schools.There is also concern in some sectors that reduced funding foruniversity research may lead to a shortage of graduate studentswith a knowledge of leading-edge technologies.
Faced with what they consider aresignificant human resource problems,MMP companies are taking action.Some have established scholarshipsand co-op training arrangementswith colleges. Others have initiat-ed efforts to promote careers tohigh school students. Companies insome industries have establishedapprenticeship programs, althoughsmaller firms sometimes have difficulty making use of these.
Some MMP sectors have taken theinitiative to develop stronger allianceswith universities and colleges toenhance education and skills train-ing. These include co-op programs,support of university research Chairs,and centres of excellence. One firmhas established an employee bulletin
board to facilitate internal and externalrecruitment of employees. Some companieshire summer students, while others partici-pate in Bring a Child to Work days in orderto promote careers in their industry.
3.2.5 Technology and Innovation
Some MMP organizations are concernedabout the inability of SMEs to financeresearch and development on a scale that is competitive with large firms. In some sectors, they believe there is an over-relianceon government support to provide resourcesfor research. Some feel that there is an over-reliance on foreign technology. A numberof comments pointed to what industry perceives to be the lack of a long-term,coordinated strategy by provincial and federalgovernments to promote R&D. Meanwhile,there is a distinct need to develop new tech-nologies to deal with environmental, productand process challenges and opportunities.Many believe that industry lacks sufficientknowledge of government and universityprograms that support research, includingthe Scientific Research and ExperimentalDevelopment (SR&ED) tax credit program.
MMP companies are responding to theirtechnology and innovation challenges. Some companies have worked with RevenueCanada to re-define aspects of SR&ED taxcredit eligibility. A number of firms havebanded together to establish a consortium offoundries. The consortium is collaboratingwith NRCan’s Canada Centre for Mineraland Energy Technology (CANMET) to solve shared problems. Companies in the aluminum sector are working togetherto sponsor university research of interest to them. In other sectors, companies arecooperating to establish specialized researchcentres to address their needs.
20
Chopping Wires for Profit
Philip Services Ltd., an Ontario-basedcompany, identified an opportunity to addvalue from a former waste material. Philip
Services operates one of North America’slargest wire-chopping lines at its granulation
facilities in Hamilton. It sources copper and aluminum insulated wires from
industrial sources across North America.Through an investment in R&D, Philip
Services developed a technology to separatepolyethylene from polypropylene plastics.
The plastic covering on wires can represent from 5% to 70% of the grossweight of the raw material. This plastic
portion, together with any contained fibre,is removed from the copper or aluminum
wire by granulation. The copper and aluminum metal is marketed interna-tionally and the plastic/fibre “chopping
line residue” has traditionally been sent to landfill for final disposal.
While there is significant economic value contained in both of the plastic resinmaterials, the specifications required for
further use are quite strict. Typically, a 99.7% resin purity is required for
any major industrial application.
Philip Services developed a separationtechnology that can effectively achieve thispurity level. The company has now created a new market for what was formerly a
waste material. The “chopping line residue”arising from most granulating lines will contain between 3% and 5% of
unrecoverable copper content togetherwith the associated plastic residue. Philip
Services can now effectively recover theremaining copper metal and the plasticpolymers for sale into commercial use.
Toward a Va lue-Added Minera l and Meta l S t rategy for Canada
4.0STRATEGIES FOR VALUE ADDED
Throughout the 1980s and 1990s, productivity gains in the MMP sectorhave been uneven. Overall, Canada continues to show a negative balanceof trade in some areas, indicating that there are opportunities for growth.The preceding sections of this report have outlined a number of challengesconfronting the mineral and metal processing sector. A process forresponding to some of those challenges is outlined below.
4.1 A Partnership for Industry
The Government of Canada is committed to work in partnership withindustry and other governments to review the constraints to value-addedprocessing. This report is an initial response to that commitment and,through it, the Government is proposing the development of a much-neededvalue-added strategy. NRCan and Industry Canada are cooperating inthis initiative, which will involveother departments, provincial andterritorial governments, academiaand industry, to develop an under-standing of the barriers to valueadded in Canada, and to proposespecific activities that will reducethese barriers or help Canadianfirms surmount them and takeadvantage of emerging opportuni-ties in a knowledge-based, globaleconomy. Furthermore, NRCan and Industry Canada recognize thatthey have an important advocacyrole to play in order to ensure thatthe mineral and metal processingsector is fairly represented where its interests are at stake.
Recycling Adds Value
Recycling industrial waste is paying handsomely for Kuntz Electroplating Inc.This Kitchener-based company platesbumpers and wheels for the automotiveindustry. The sludge that is created duringthe electroplating process contains around15% nickel. Until 1990, Kuntz waspaying $65-$75 per tonne to dispose ofthe sludge in a secure landfill. Now it isselling its sludge to Inco for re-smelting.Not only does Kuntz avoid the landfillcharge, but the company actually earns a small return for the sludge. The realwinner is the environment. Value addedthrough recycling is the way of the future.
From Minera l Resources to Manufactured Products :
Major action themes have emerged from the government/industry consultations that have been held to date. Specific recommendations for in-depth research are being made and, in areas where clearaction can be taken, plans will be developedover the coming year. It is not too late to influence these plans. Your input to the formulation of these action plans iswelcomed and encouraged.
Of the several themes that were identifiedin the government/industry consultations, thefollowing seemed to predominate and warranta focussed effort. These themes are:
• Trade Development;
• Human Resources;
• Environmental Challenges;
• Innovation, Science and Technology; and
• Comparative Economic/BusinessClimate.
It is proposed that multi-stakeholder teamsbe established to address the key themes.The objective of each team would be tobuild on the insights developed in earlierconsultations, and to propose specific ini-tiatives to improve the industry’s situationin each of the theme areas. In addition,these teams will serve as ongoing “advisorybodies” to help implement, monitor andcontinually adapt those initiatives that are undertaken.
To give readers an idea of the type of initiatives that might be undertaken, each of the theme areas are discussed briefly.
4.1.1 Trade Development
Canadians in the mineral and metal processing sector depend heavily on tradewith the United States. Although there areopportunities to develop export markets inother countries, many of them are small and uncertain about how to expand their
exports. The Trade Team would includeparticipants from industry and the financialsector, the provinces, and several federaldepartments, notably Industry Canada,Natural Resources Canada, Foreign Affairs and International Trade, the ExportDevelopment Corporation, and InvestmentsPartnerships Canada. Possible actions couldinclude examining tariff and non-tariff tradebarriers, helping MMP firms increase theiruse of government instruments for expandingtheir export base, developing team approachesto enhance exports, and sharing knowledgeon best practices in industry.
4.1.2 Human Resources
A theme that emerged consistently in allconsultations was the need for skilled labour,including the full range of skills from shopfloor work, tool and die making, metalworking, computer simulation and design,and sound management practices. Someemployers feel that new employees are notacquiring in school the best range of skillsfor the work world. There is also consider-able anxiety in industry over the decliningsocial status of blue-collar jobs in general,which are perceived to be “old technology,”but in fact are becoming increasingly techni-cally demanding. In the long term, this threat-ens to constrain the supply of young peoplepreparing for MMP careers. Furthermore,MMP companies need to give serious thoughtto how they can improve productivity andoutput, and encourage innovation throughbetter management skills.
To make a real difference in this area, a Human Resources Team will need a cooperative effort from industry, labour,academia, the provinces, Human ResourcesDevelopment Canada, Industry Canada, andNatural Resources Canada. Potential initia-tives in this study area could include an in-depth analysis of labour needs compared tocurrent educational capacity, how to raiseawareness of the quality of careers in the
22
Toward a Va lue-Added Minera l and Meta l S t rategy for Canada
mineral and metal processing sector, andrecommending the development of specifictraining or apprenticeship programs.
4.1.3 Environmental Challenges
A wide range of topics could be studiedunder this theme, including the impact of the domestic regulatory framework andspecific initiatives to deal with climate change,increase recycling, and reduce effluent emis-sions from mineral and metal processing andmanufacturing activities. This theme hasstrong overlap with the innovation, scienceand technology initiative. The EnvironmentTeam would include participants from indus-try, the provinces and territories, non-governmental organizations, EnvironmentCanada, Natural Resources Canada, andIndustry Canada. Examples of actions thatcould be undertaken are: an examination of the influence and effectiveness of currentdomestic regulations and conventions; coor-dination with the Climate Change ActionPlan; support to the recycling industry; actionsto encourage more recycling in general;and the development of technologicalresearch and implementation programs.
4.1.4 Innovation, Science and Technology
One of the key challenges to the mineral andmetal processing sector in the next decadewill be to better utilize science and tech-nology to overcome competitive obstacles,increase innovation and improve productivity.By doing so, the industry will be betterequipped to respond to emerging opportu-nities in the global market. Innovation —adopting best practice technologies, anddeveloping and designing new products andprocesses — is a fundamental aspect of anMMP value-added strategy. MMP sectorinvestment in Canadian research and devel-opment tends to be low relative to the UnitedStates. To attempt to better coordinateexpenditures of scarce research dollars, the Technology Team would include representatives from industry, Natural
Resources Canada (CANMET), TechnologyPartnerships Canada, the National ResearchCouncil, Industry Canada, academia, and the provinces and territories.Initiatives under this themecould be: the coordination ofprograms to develop expertise inkey areas, the development of avirtual R&D network on Strategis,and improved dissemination ofinformation on, and access to, government S&T programs.
4.1.5 ComparativeEconomic/BusinessClimate
This theme deals with the under-lying economic climate in Canadaand its influence on value-addedactivities in the mineral and metalprocessing sector. Some areasunder the control of Canadiangovernments, such as fiscal andtaxation policy, labour regulations,trade agreements and the like, couldbe studied, as well as other factorsunder the control of foreign gov-ernments that would influence thecomparative advantage of doingbusiness in Canada in compari-son with competitor nations.Additional issues such as exchangerates, climate, geography, socialattitudes, availability of invest-ment financing, degree of foreignownership, distance to market,etc., could also be reviewed.
The challenge for governments inCanada is to optimize those factorsunder their control for the greaterbenefit of Canada as a whole, andto seek to minimize the negativeimpact of factors outside theirdirect control. A BusinessClimate Team would includerepresentatives from industry,
23
Turning Steel into Lead
Nova Pb Inc., located in Ste-Catherine,Quebec, a suburb of Montréal, is Canada’slargest secondary lead smelter. Nova producesapproximately 80 000 tonnes of lead per year.
Nova requires a source of iron to use as areducing agent in the smelting of lead. Morespecifically, the role of iron is to capture thesulphur from the feed. With the use of bothspent oil filter casings and soda ash, Nova has been able to achieve 99.999% sulphurdioxide control. The company has an on-sitecapacity to process and consume over 16 mil-lion spent oil filters per year. This programbenefits the environment in two ways: first,it diverts an important volume of hazardouswaste from landfill; and secondly, it recoversthe residual calorific value from both the oiland the cartridge within the waste oil filter.In combination with the waste oil from filtersand other waste liquids with high BTU val-ues, over 50% of Nova’s BTU requirementsfor the rotary kiln during 1998 will besourced from liquid waste materials, signi-ficantly reducing the use of natural gas.
In terms of the carbon unit sources, which arealso required in the smelting process, trialsare currently under way to replace a signifi-cant portion of metallurgical coke with spenttires and waste industrial rubber.
Nova has also installed state-of-the-artbattery breaking equipment to allowrecovery of the 5% co-polymer polypropy-lene plastic exterior of used battery cases.Over 99.9% of all the plastic from spentautomotive battery cases is recovered andmarketed for re-use in commercial plasticproducts, including new battery cases.Further value-added opportunities stillexist to re-granulate the recovered plastic.
In summary, instead of being simply a secondary lead smelter that recycles deadbatteries, Nova has become a resource recov-ery facility that recycles several waste streamsgenerated by the transportation industry.
From Minera l Resources to Manufactured Products :
24
Natural Resources Canada, IndustryCanada, the Department of Finance, and the provinces and territories. Initiatives in this area could include: research on thefactors that influence the development of value-added products in the mineral and metal processing sector, and tabling recommendations to improve the impact offactors under the control of governments.
4.1.6 The Need For Action
Decisions made in the next few years willinfluence the long-term viability and futureprospects for the industries in the mineral
and metal continuum. Over thepast decade, the sector has gonethrough some difficult times and has responded to many of thechallenges it faced. Along withexpanded trade has come greatercompetition. The pace of techno-logical change is relentless. Humanresources are under pressure.Traditional customer-supplierarrangements are changing.Investment requirements are frequently high. Environmentalconcerns are ever-present andgrowing. There have been somenotable successes, but the challengeto increase productivity and innovation has not diminished.Furthermore, it must be acknowl-edged that the economic contribu-tions of this sector, with its diversesmall- and medium-sized firms
in the Stage C and D industries, havetended not to receive the attention fromgovernment that is warranted by their highlevel of employment.
The time is now ripe for industry, governmentand other stakeholders to launch a new ini-tiative — a value-added strategy — that willhelp the sector exploit tomorrow’s opportu-nities. Each industry sector, together withgovernment, must recommend initiatives thatare tailored to help it address the challengesand exploit the opportunities.
The MMP sector needs a strong advocacyvoice within government. A new strategywill mark a turning point. Both IndustryCanada and Natural Resources Canada have undertaken to more effectively promote the sector.
Too much of Canada’s economy depends on the success of the MMP sector to let thisopportunity pass. The time to act is now.
Better Battery Technology
Cominco Ltd. is a Vancouver-based integrated mining and metals companywhose principal activities are mineral
exploration, mining, smelting andrefining. Working with a federal labora-tory (CANMET), the company’s BatteryTechnology Division developed a technique
to continuously cast highly corrosion-resistant lead-alloy strip used for makingbattery plate electrodes. The collaboration
effort progressed from a lab technique to thedevelopment and rapid commercialization
of a strip production process. Termed the“Multi-Alloy Strip Caster,” this equipment
has been sold to major battery manu-facturers around the world for the produc-
tion of automotive starting batteries. Thenew caster provides high output of a qualityproduct at a cost substantially less than com-
peting systems. Due in part to this newtechnology, Cominco is now the world’sleading supplier of automated productionlines for manufacturing lead-acid batteryplate electrodes. The Multi-Alloy StripCaster is the product of a very successfulcollaborative effort between a federal
government lab and private industry.
5.0JOIN THE DIALOGUE
Toward a Va lue-Added Minera l and Meta l S t rategy for Canada
The Government of Canada wants your organization to participate in this dialogue. Do you have an idea that would support value-added activities in the MMP sector? Do you want to provide input to one of the “Work Teams” described above? Let us know. Here’s who to contact:
Jenny Jackman
Mineral Technology Branch — CANMET
Minerals and Metals Sector
Natural Resource Canada
568 Booth Street
Ottawa, Ontario
K1A 0G1
Tel.: (613) 996-8997
Fax: (613) 992-8735
E-mail: [email protected]
Charles Ethier
Metals and Minerals Processing Branch
Industry Sector
Industry Canada
235 Queen Street
Ottawa, Ontario
K1A 0H5
Tel.: (613) 954-3176
Fax: (613) 954-3079
E-mail: [email protected]

–––––––––––––––––––––––––––––––––––––––––––––––––––––––––––––––––––––––––––––––
–––––––––––––––––––––––––––––––––––––––––––––––––––––––––––––––––––––––––––––––
–––––––––––––––––––––––––––––––––––––––––––––––––––––––––––––––––––––––––––––––
–––––––––––––––––––––––––––––––––––––––––––––––––––––––––––––––––––––––––––––––
–––––––––––––––––––––––––––––––––––––––––––––––––––––––––––––––––––––––––––––––
–––––––––––––––––––––––––––––––––––––––––––––––––––––––––––––––––––––––––––––––
–––––––––––––––––––––––––––––––––––––––––––––––––––––––––––––––––––––––––––––––
–––––––––––––––––––––––––––––––––––––––––––––––––––––––––––––––––––––––––––––––
–––––––––––––––––––––––––––––––––––––––––––––––––––––––––––––––––––––––––––––––
–––––––––––––––––––––––––––––––––––––––––––––––––––––––––––––––––––––––––––––––
–––––––––––––––––––––––––––––––––––––––––––––––––––––––––––––––––––––––––––––––
–––––––––––––––––––––––––––––––––––––––––––––––––––––––––––––––––––––––––––––––
–––––––––––––––––––––––––––––––––––––––––––––––––––––––––––––––––––––––––––––––
–––––––––––––––––––––––––––––––––––––––––––––––––––––––––––––––––––––––––––––––
–––––––––––––––––––––––––––––––––––––––––––––––––––––––––––––––––––––––––––––––
–––––––––––––––––––––––––––––––––––––––––––––––––––––––––––––––––––––––––––––––
–––––––––––––––––––––––––––––––––––––––––––––––––––––––––––––––––––––––––––––––
–––––––––––––––––––––––––––––––––––––––––––––––––––––––––––––––––––––––––––––––
–––––––––––––––––––––––––––––––––––––––––––––––––––––––––––––––––––––––––––––––
–––––––––––––––––––––––––––––––––––––––––––––––––––––––––––––––––––––––––––––––
–––––––––––––––––––––––––––––––––––––––––––––––––––––––––––––––––––––––––––––––
–––––––––––––––––––––––––––––––––––––––––––––––––––––––––––––––––––––––––––––––
–––––––––––––––––––––––––––––––––––––––––––––––––––––––––––––––––––––––––––––––
–––––––––––––––––––––––––––––––––––––––––––––––––––––––––––––––––––––––––––––––
–––––––––––––––––––––––––––––––––––––––––––––––––––––––––––––––––––––––––––––––
–––––––––––––––––––––––––––––––––––––––––––––––––––––––––––––––––––––––––––––––
–––––––––––––––––––––––––––––––––––––––––––––––––––––––––––––––––––––––––––––––
NOTES