Embed Size (px)
Citation preview
Resources equities –
June 2011
An attractive way to play the commodity super cycle
For professional investors or advisers only
Sam Catalano
Portfolio Manager, Global Resources Equities
Gavin Marriott
Product Manager, Global and International Equities
2
Investing to maximise returnsLife in the New Normal
What is the New Normal
– Changes to the fundamental structure of the global economy
– An era of shifting geo-political power and influence
Implications for investors
– An era of lower returns on stocks and bonds
– Challenge to pre-conceived wisdom which will require investors to think differently
33
-
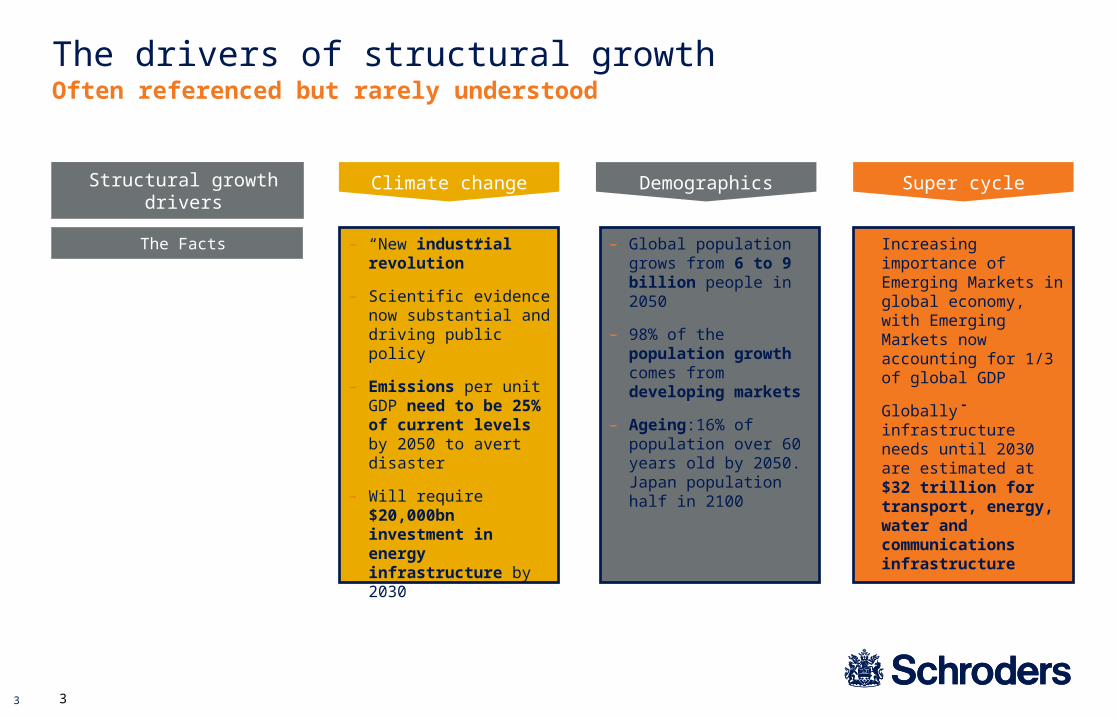
The drivers of structural growthOften referenced but rarely understood
Structural growth drivers
The Facts – Global population grows from 6 to 9 billion people in 2050
– 98% of the population growth comes from developing markets
– Ageing:16% of population over 60 years old by 2050. Japan population half in 2100
– “New industrial revolution”
– Scientific evidence now substantial and driving public policy
– Emissions per unit GDP need to be 25% of current levels by 2050 to avert disaster
– Will require $20,000bn investment in energy infrastructure by 2030
– Increasing importance of Emerging Markets in global economy, with Emerging Markets now accounting for 1/3 of global GDP
– Globally infrastructure needs until 2030 are estimated at $32 trillion for transport, energy, water and communications infrastructure
Climate change Demographics Super cycle
4
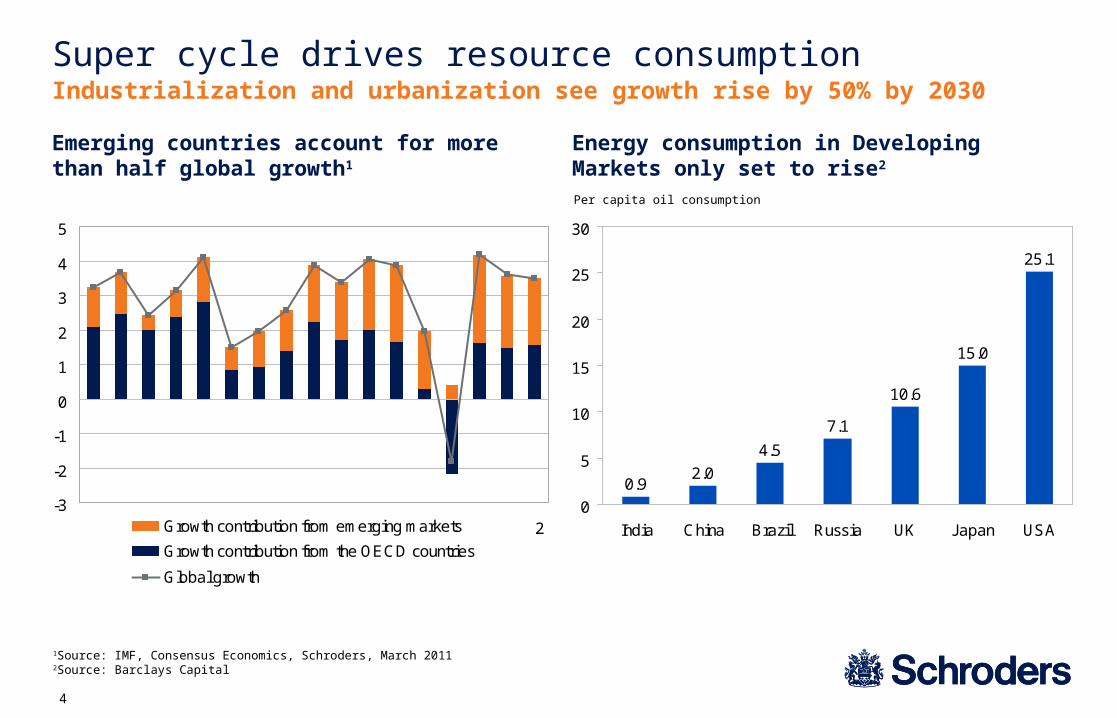
Super cycle drives resource consumptionIndustrialization and urbanization see growth rise by 50% by 2030
0.92.0
4.5
7.1
10.6
15.0
25.1
0
5
10
15
20
25
30
India China Brazil Russia UK Japan USA
Per capita oil consumption
Energy consumption in Developing Markets only set to rise2
-3
-2
-1
0
1
2
3
4
5
96 97 98 99 00 01 02 03 04 05 06 07 08 09 10 11 12Growth contribution from emerging markets
Growth contribution from the OECD countries
Global growth
Emerging countries account for more than half global growth1
1Source: IMF, Consensus Economics, Schroders, March 20112Source: Barclays Capital
5
0
100
200
300
400
500
600
700
800
900
19
00
19
04
19
08
19
12
19
16
19
20
19
24
19
28
19
32
19
36
19
40
19
44
19
48
19
52
19
56
19
60
19
64
19
68
19
72
19
76
19
80
19
84
19
88
19
92
19
96
20
00
20
04
20
08
USA China
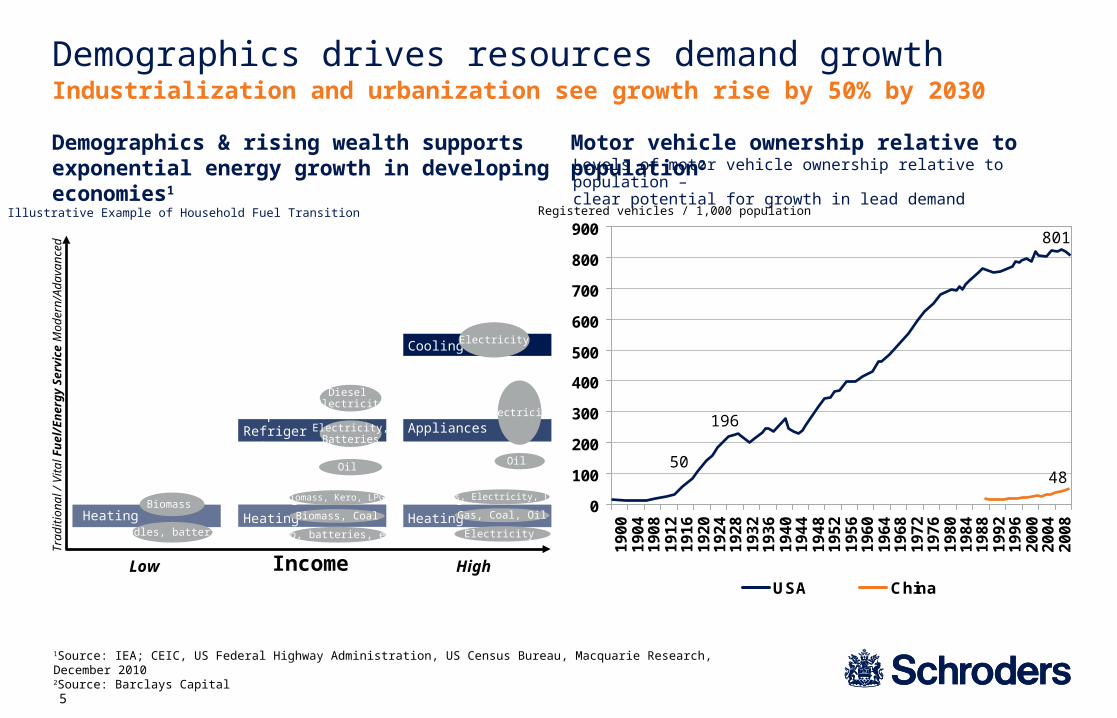
Demographics drives resources demand growth
Demographics & rising wealth supports exponential energy growth in developing economies1
Motor vehicle ownership relative to population2
1Source: IEA; CEIC, US Federal Highway Administration, US Census Bureau, Macquarie Research, December 20102Source: Barclays Capital
50
196
48
801
Registered vehicles / 1,000 population
Levels of motor vehicle ownership relative to population – clear potential for growth in lead demand
Tra
diti
on
al /
Vita
l Fu
el/
En
erg
y S
erv
ice
Mo
de
rn/A
da
van
ced
IncomeLow High
Cooking
Heating
Lighting
Biomass
Candles, batteries
Cooking
Heating
Lighting
Biomass, Kero, LPG
Biomass, Coal
Kero, batteries, elec
Water PumpRefrigerationBasic AppliancesTransport
Diesel Electricity
Electricity,Batteries
Oil
Cooking
Heating
Lighting
Gas, Electricity, LPG
Gas, Coal, Oil
Electricity
RefrigerationBasic Appliances
Transport
Other Appliances
Cooling
ICT
Electricity
Oil
Electricity
Illustrative Example of Household Fuel Transition
Industrialization and urbanization see growth rise by 50% by 2030
6
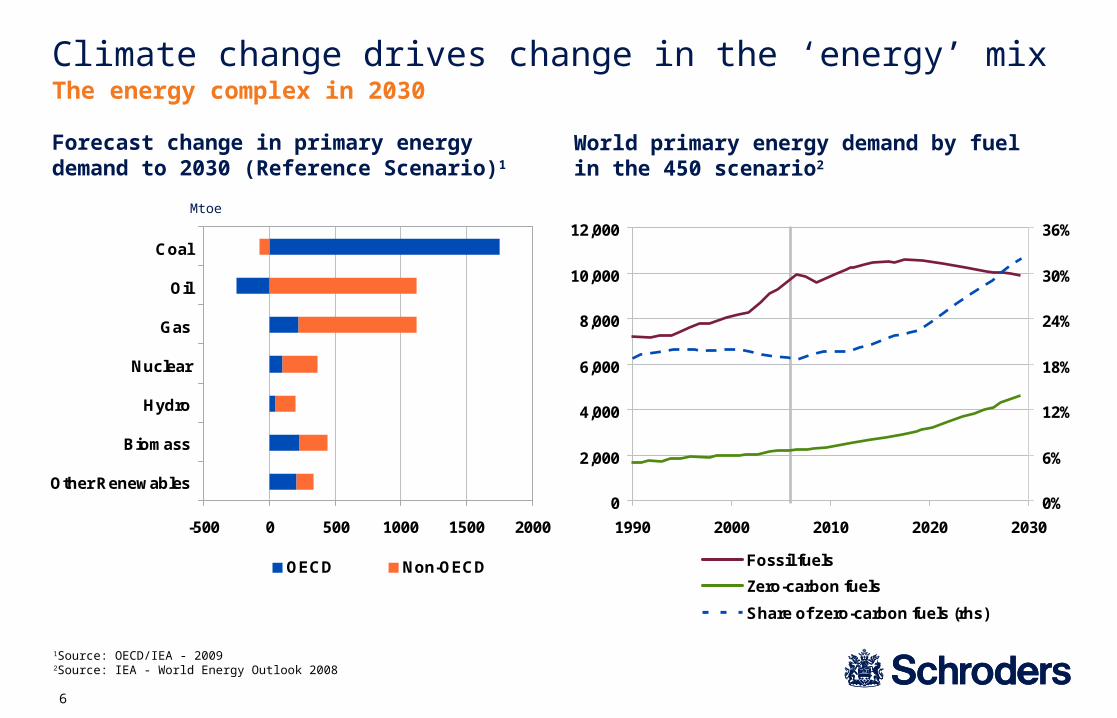
World primary energy demand by fuel in the 450 scenario2
Climate change drives change in the ‘energy’ mixThe energy complex in 2030
-500 0 500 1000 1500 2000
Other Renewables
Biomass
Hydro
Nuclear
Gas
Oil
Coal
OECD Non-OECD
Forecast change in primary energy demand to 2030 (Reference Scenario)1
Mtoe
1Source: OECD/IEA - 20092Source: IEA - World Energy Outlook 2008
0
2,000
4,000
6,000
8,000
10,000
12,000
1990 2000 2010 2020 2030
0%
6%
12%
18%
24%
30%
36%
Fossil fuels
Zero-carbon fuels
Share of zero-carbon fuels (rhs)
7
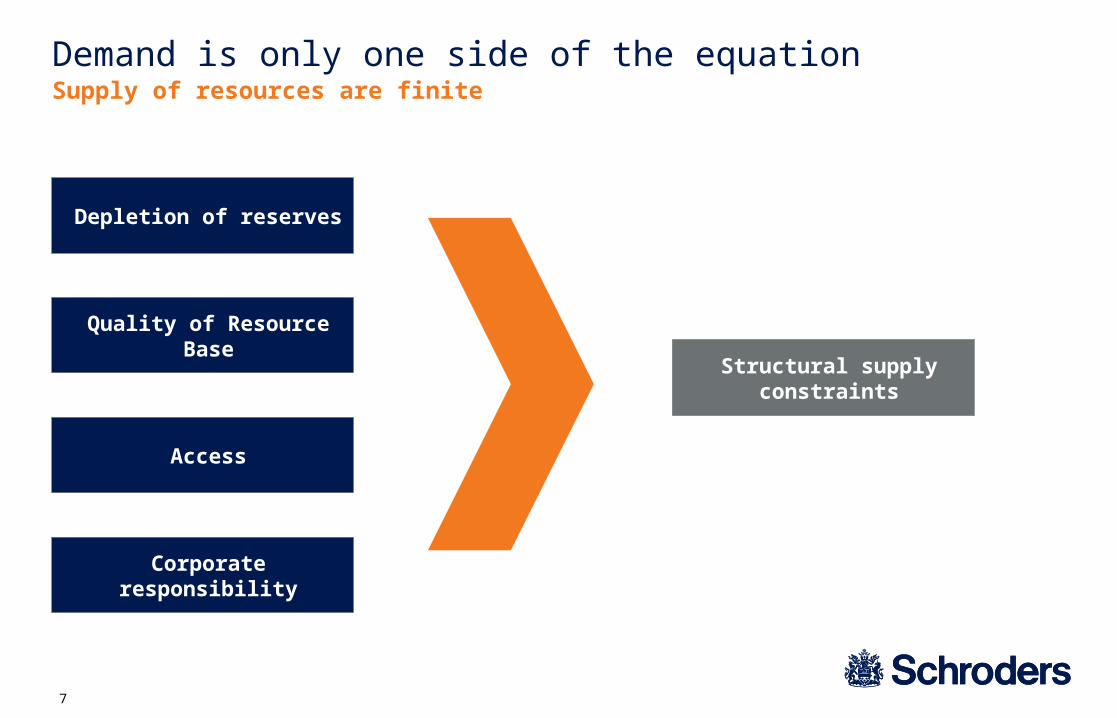
Demand is only one side of the equationSupply of resources are finite
Access
Quality of Resource Base
Depletion of reserves
Corporate responsibility
Structural supply constraints
8
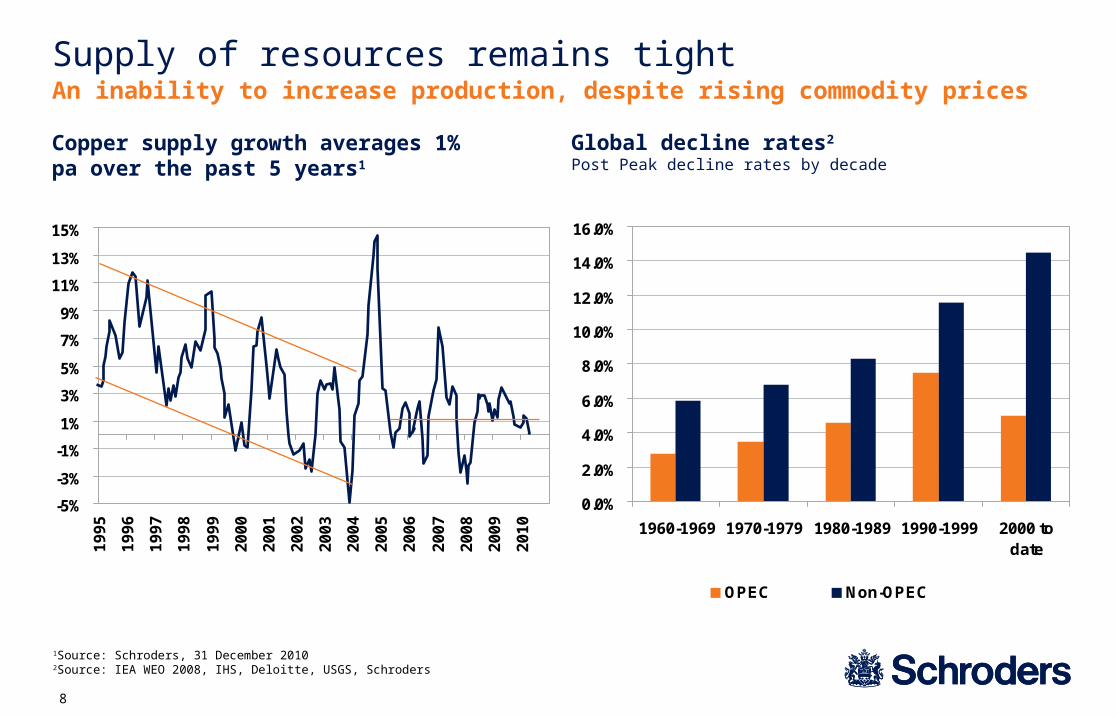
Supply of resources remains tightAn inability to increase production, despite rising commodity prices
-5%
-3%
-1%
1%
3%
5%
7%
9%
11%
13%
15%
19
95
19
96
19
97
19
98
19
99
20
00
20
01
20
02
20
03
20
04
20
05
20
06
20
07
20
08
20
09
20
10
Copper supply growth averages 1% pa over the past 5 years1
1Source: Schroders, 31 December 20102Source: IEA WEO 2008, IHS, Deloitte, USGS, Schroders
Global decline rates2
Post Peak decline rates by decade
0.0%
2.0%
4.0%
6.0%
8.0%
10.0%
12.0%
14.0%
16.0%
1960-1969 1970-1979 1980-1989 1990-1999 2000 todate
OPEC Non-OPEC
9
What this means in practiceResources are a key beneficiary of structural growth drivers
Demand
– Demand for resources continues to rise
– Although cyclical in nature, structural drivers dominate
Supply
– Resources increasingly constrained
– Limited capacity to deal with demand shocks
Implications for investors
– Resource prices set to rise in the long term
– Demand/supply imbalance creates opportunities for investors
– A source of visible growth underpinning a strategic allocation
– An efficient hedge against inflation
10
10
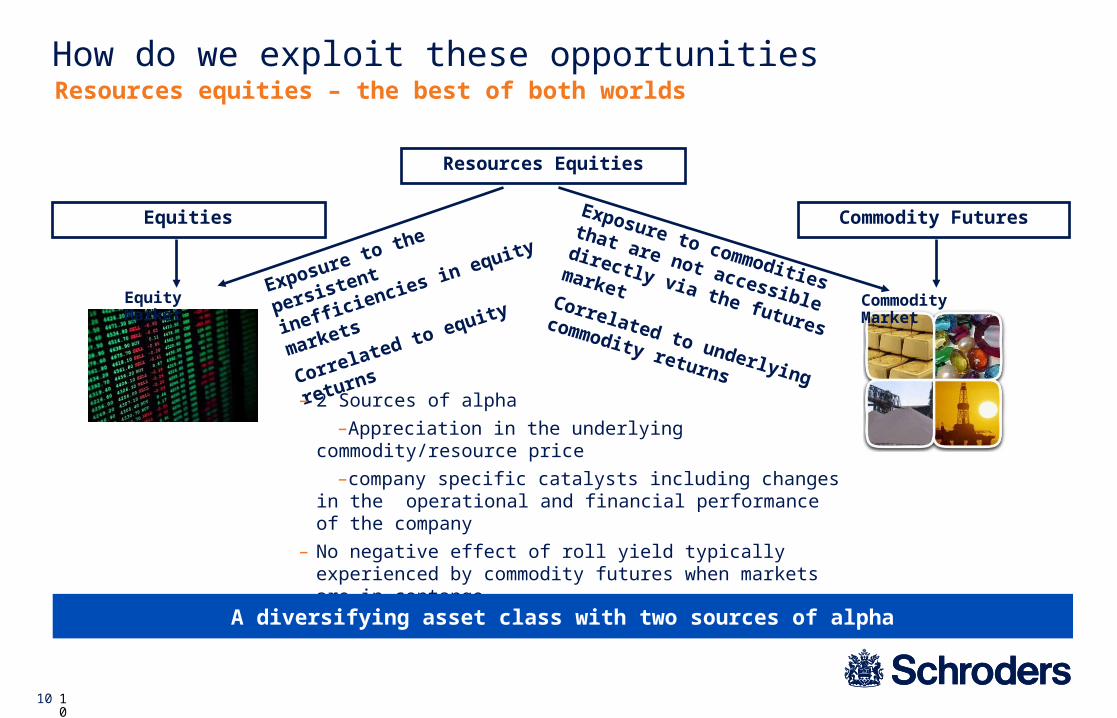
How do we exploit these opportunitiesResources equities – the best of both worlds
Equities
Resources Equities
Commodity Futures
Exposure to the persistent
inefficiencies in equity
markets
Correlated to equity returns
Exposure to commodities that
are not accessible directly via
the futures marketCorrelated to underlying
commodity returns
– 2 Sources of alpha
–Appreciation in the underlying commodity/resource price
–company specific catalysts including changes in the operational and financial performance of the company
– No negative effect of roll yield typically experienced by commodity futures when markets are in contango
– Can accommodate long term strategic positions
Equity Market Commodity Market
A diversifying asset class with two sources of alpha

11
Copper Price compared to First Quantum Minerals
100
120
140
160
180
200
220
240
Sep-10 Nov-10 Jan-11 Mar-11
Copper First Quantum Minerals
For illustrative purposes only and not a recommendation to buy or sell sharesSource: Datastream, USD, 14 April 2011
Why resources equitiesThe best of all worlds – 2 sources of alpha
Rebased to 100

12
The importance of the growth gapForward growth – an indicator of share price performance
0.0
0.5
1.0
1.5
2.0
2.5
3.0
3.5
4.0
4.5
5.0
Mar 02 Jun 03 Sep 04 Dec 05 Mar 07 Jun 08 Sep 09
0
5
10
15
20
25
30
35
40
45
Fwd EPS (rhs) Price
Xstrata share price
(£,x) (£/ps)
Source: Macquarie Research, December 2010
13
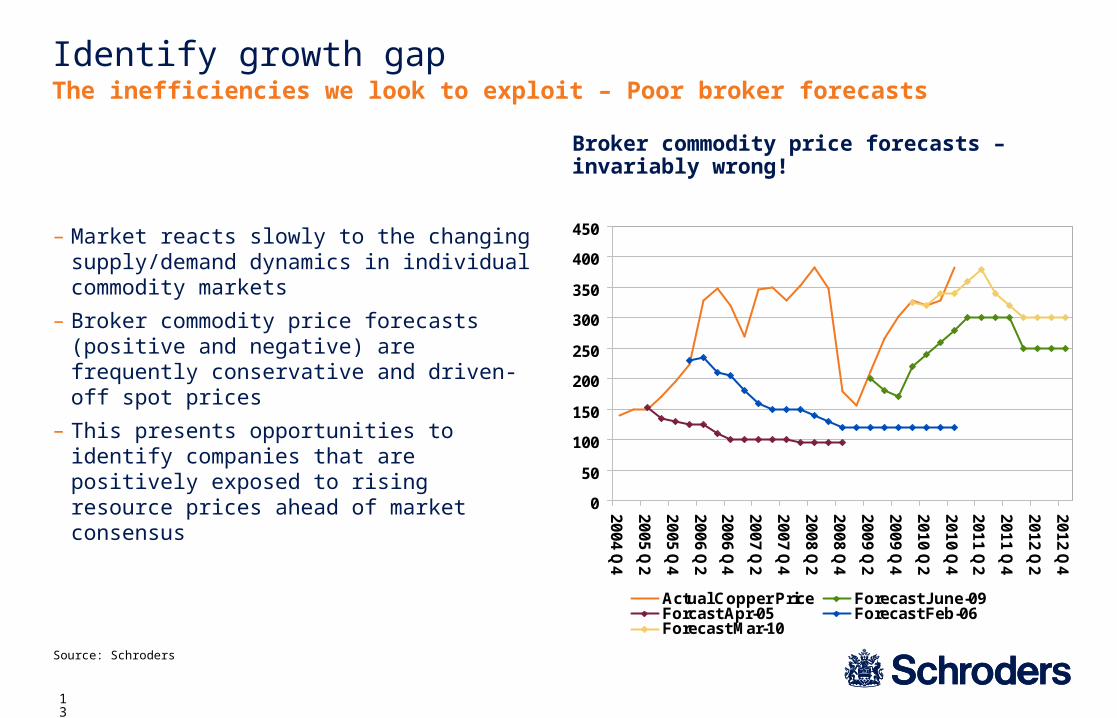
Identify growth gapThe inefficiencies we look to exploit – Poor broker forecasts
– Market reacts slowly to the changing supply/demand dynamics in individual commodity markets
– Broker commodity price forecasts (positive and negative) are frequently conservative and driven-off spot prices
– This presents opportunities to identify companies that are positively exposed to rising resource prices ahead of market consensus
Broker commodity price forecasts – invariably wrong!
0
50
100
150
200
250
300
350
400
450
20
04
Q4
20
05
Q2
20
05
Q4
20
06
Q2
20
06
Q4
20
07
Q2
20
07
Q4
20
08
Q2
20
08
Q4
20
09
Q2
20
09
Q4
20
10
Q2
20
10
Q4
20
11
Q2
20
11
Q4
20
12
Q2
20
12
Q4
Actual Copper Price Forecast June-09Forcast Apr-05 Forecast Feb-06Forecast Mar-10
Source: Schroders

14
0
200
400
600
800
1,000
1,200
1,400
Mar 10 May 10 Jul 10 Sep 10 Nov 10
100
150
200
250
300
350
400
450
This year
Identify growth gapPoor broker forecasts – Stock example
Walter Energy WLT
– Adverse weather affecting a number of regions & starting to have significant effect on supply
– Floods in Queensland have major impact on coking & thermal coal supplies. The state supplies two thirds of the world’s coking coal and 8% of the world’s thermal coal
– Approximately 75% of Queensland mines are not operating because of flooding
– In 2008, flooding reduced coal production by roughly 8-10 million tonnes. The recent flood appears to be worse. Market slow to recognise the impact of unseasonal weather & price forecasts for coking coal fail to keep pace with deteriorating supply outlook
For illustrative purposes only and not a recommendation to buy or sell sharesSource: Datastream, USD, 31 December 2010, Australian Bureau of Meteorology (Comet Post Office Station)
Market slow to anticipate supply constraintsRainfall Accumulation (mm)
Rainfall Accumulation (mm) RHS
♦♦♦
♦
2011 consensus forecasts for Hard Coking Coal♦
Coking Coal Price in USD LHS
Current Coking Coal Price (Jan 2011)♦
15
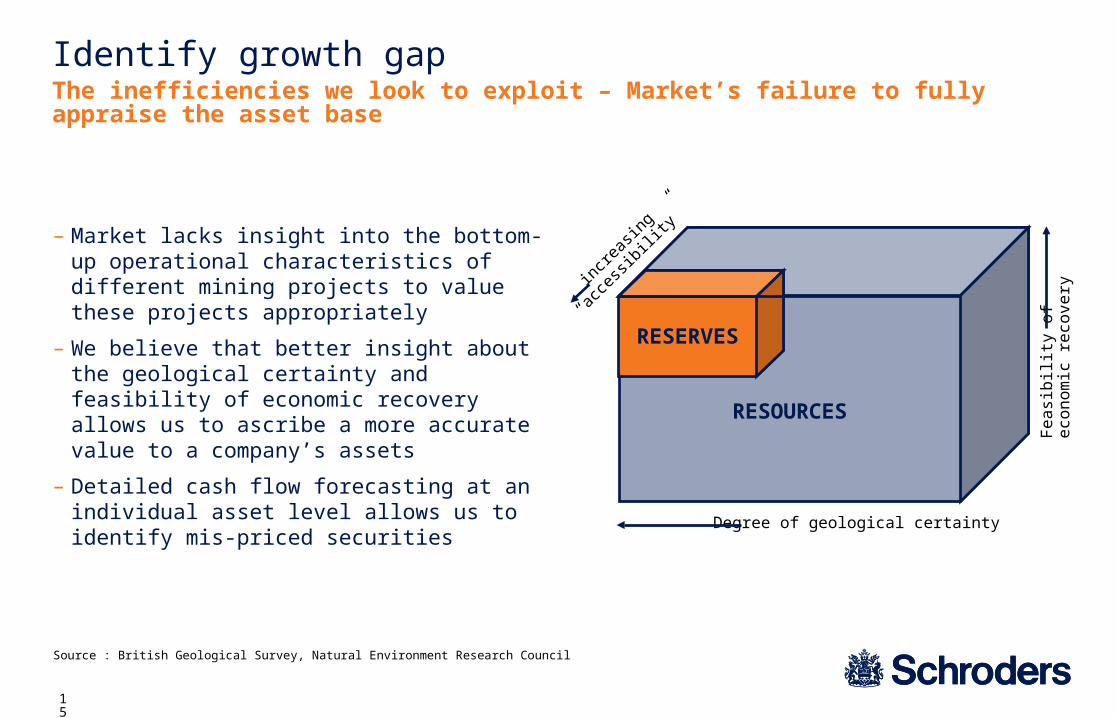
Identify growth gapThe inefficiencies we look to exploit – Market’s failure to fully appraise the asset base
– Market lacks insight into the bottom-up operational characteristics of different mining projects to value these projects appropriately
– We believe that better insight about the geological certainty and feasibility of economic recovery allows us to ascribe a more accurate value to a company’s assets
– Detailed cash flow forecasting at an individual asset level allows us to identify mis-priced securities
Source : British Geological Survey, Natural Environment Research Council
RESOURCES
RESERVES
Degree of geological certainty
Fe
asi
bili
ty o
f e
con
om
ic r
eco
very
incre
asing
“acc
essib
ility”
16
0
25
50
75
100
125
150
Dec-07
Apr-08
Aug-08
Dec-08
Apr-09
Aug-09
Dec-09
Apr-10
Aug-10
Dec-10
Apr-11
First Quantum Share Price
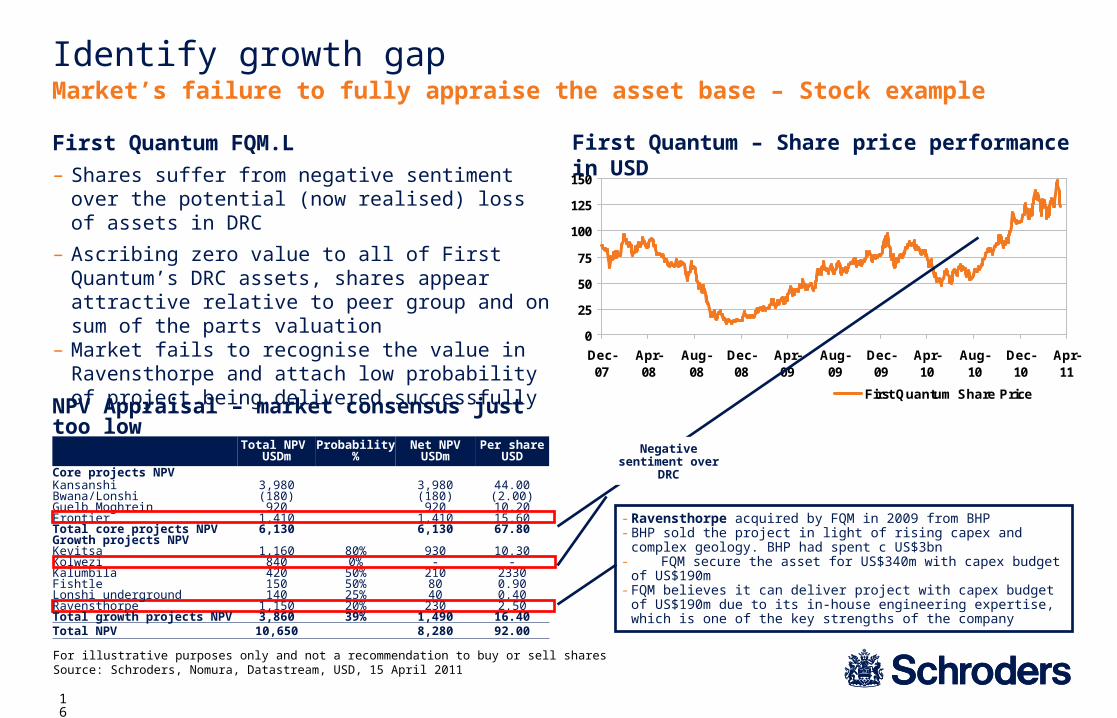
Identify growth gapMarket’s failure to fully appraise the asset base – Stock example
For illustrative purposes only and not a recommendation to buy or sell sharesSource: Schroders, Nomura, Datastream, USD, 15 April 2011
NPV Appraisal – market consensus just too low
Total NPV USDm Probability % Net NPV
USDmPer share
USDCore projects NPVKansanshi 3,980 3,980 44.00Bwana/Lonshi (180) (180) (2.00)Guelb Moghrein 920 920 10.20Frontier 1,410 1,410 15.60Total core projects NPV 6,130 6,130 67.80Growth projects NPVKevitsa 1,160 80% 930 10.30Kolwezi 840 0% - -Kalumbila 420 50% 210 2330Fishtle 150 50% 80 0.90Lonshi underground 140 25% 40 0.40Ravensthorpe 1,150 20% 230 2.50Total growth projects NPV 3,860 39% 1,490 16.40Total NPV 10,650 8,280 92.00
First Quantum – Share price performance in USDFirst Quantum FQM.L
– Shares suffer from negative sentiment over the potential (now realised) loss of assets in DRC
– Ascribing zero value to all of First Quantum’s DRC assets, shares appear attractive relative to peer group and on sum of the parts valuation
– Market fails to recognise the value in Ravensthorpe and attach low probability of project being delivered successfully
Negative sentiment over DRC
- Ravensthorpe acquired by FQM in 2009 from BHP- BHP sold the project in light of rising capex and complex geology. BHP
had spent c US$3bn - FQM secure the asset for US$340m with capex budget of US$190m- FQM believes it can deliver project with capex budget of US$190m due to
its in-house engineering expertise, which is one of the key strengths of the company

17
Global Resources – Near term outlookShort term positive – Waiting for the Chinese Rebound
Demand
– Underlying demand drivers remains robust. Data remains solid (i.e. PMI indices, IP)
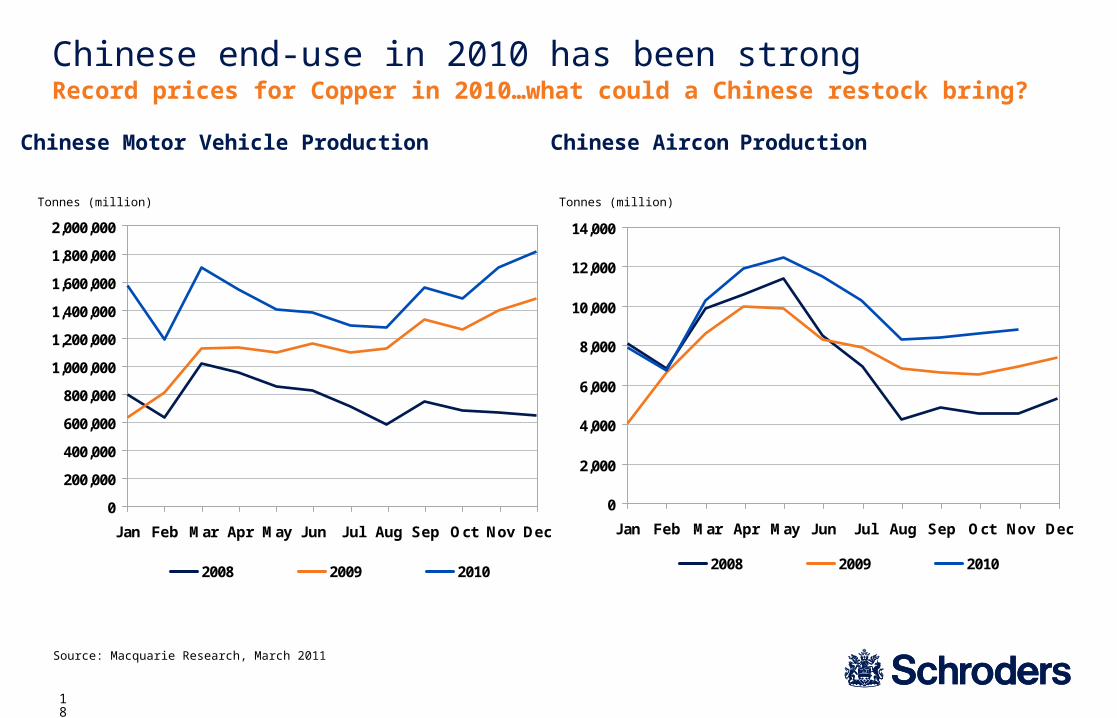
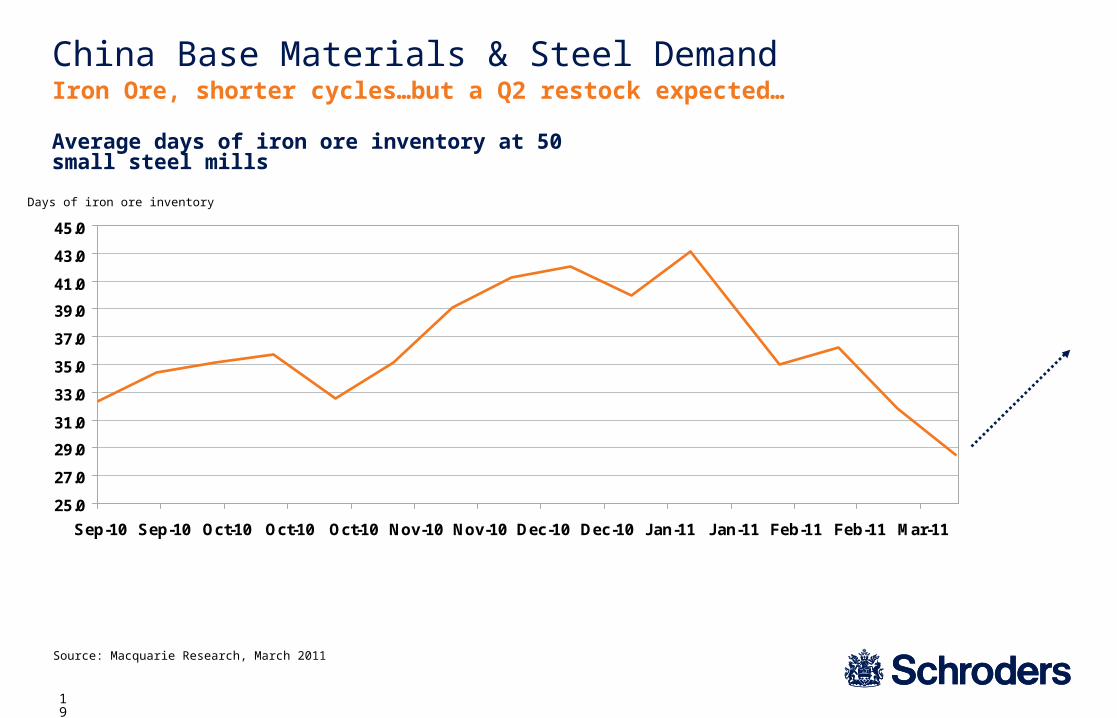
– Strong restock in China expected Q2 2011. Significant destocking seen through 2010
– Commodity prices have remained at historically elevated levels (and in some cases record levels), despite mass Chinese destocking during 2010 and with anaemic demand in the developed world
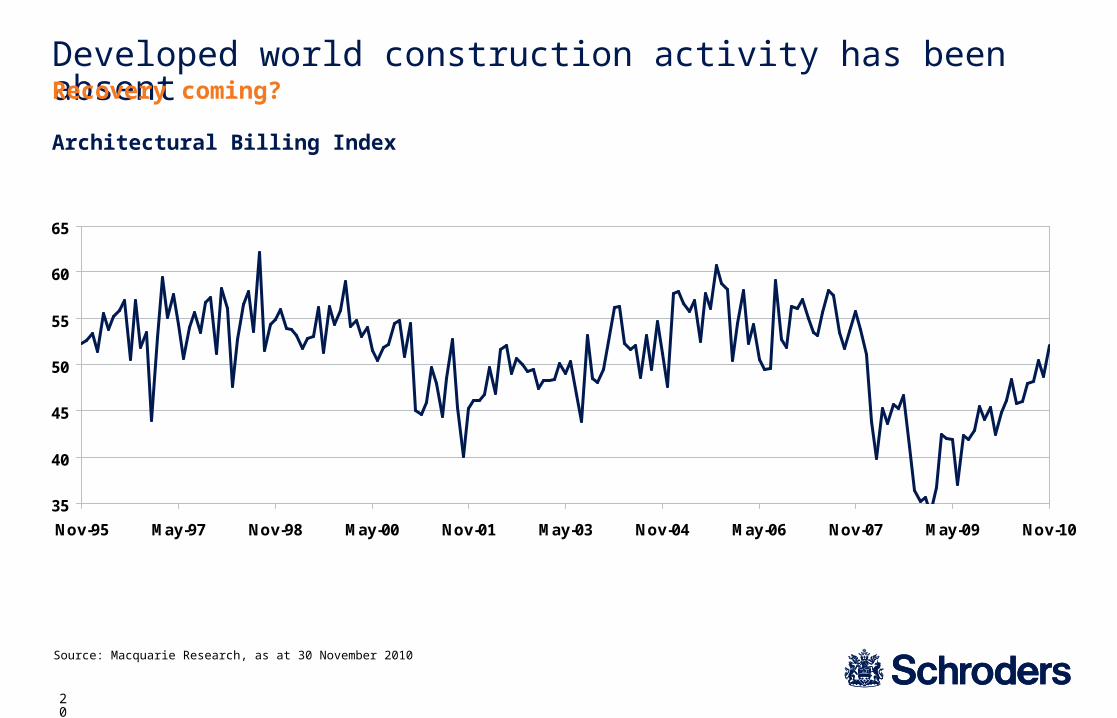
– Western world (specifically US) recovery has been largely ex-construction based to date. Lead indicators suggest this might be turning
Supply
– Supply side will continue to disappoint. Supply disruption risk remains – there is limited flexibility in the supply chain
Valuation
– Sentiment has been very weak in recent months given caution over MENA activity and Chinese tightening activity
– We stick to the fundamentals. When sentiment turns, significant upside for many resources equities. We are well positioned
18
0
200,000
400,000
600,000
800,000
1,000,000
1,200,000
1,400,000
1,600,000
1,800,000
2,000,000
Jan Feb Mar Apr May Jun Jul Aug Sep Oct Nov Dec
2008 2009 2010
Chinese end-use in 2010 has been strong
Source: Macquarie Research, March 2011
Record prices for Copper in 2010…what could a Chinese restock bring?
Chinese Motor Vehicle Production
0
2,000
4,000
6,000
8,000
10,000
12,000
14,000
Jan Feb Mar Apr May Jun Jul Aug Sep Oct Nov Dec
2008 2009 2010
Chinese Aircon Production
Tonnes (million)Tonnes (million)
19
25.0
27.0
29.0
31.0
33.0
35.0
37.0
39.0
41.0
43.0
45.0
Sep-10 Sep-10 Oct-10 Oct-10 Oct-10 Nov-10 Nov-10 Dec-10 Dec-10 Jan-11 Jan-11 Feb-11 Feb-11 Mar-11
China Base Materials & Steel Demand
Source: Macquarie Research, March 2011
Iron Ore, shorter cycles…but a Q2 restock expected…
Days of iron ore inventory
Average days of iron ore inventory at 50 small steel mills
20
35
40
45
50
55
60
65
Nov-95 May-97 Nov-98 May-00 Nov-01 May-03 Nov-04 May-06 Nov-07 May-09 Nov-10
Developed world construction activity has been absent
Architectural Billing Index
Source: Macquarie Research, as at 30 November 2010
Recovery coming?

21
4
8
12
16
20
Jan-97 Jan-99 Jan-01 Jan-03 Jan-05 Jan-07 Jan-09 Jan-11
Mining 12m Fwd PE Average
Resources equity valuations attractiveUpside is material
Mining Sector Forward PE Multiples – a discounted sector
Source: Datastream
22
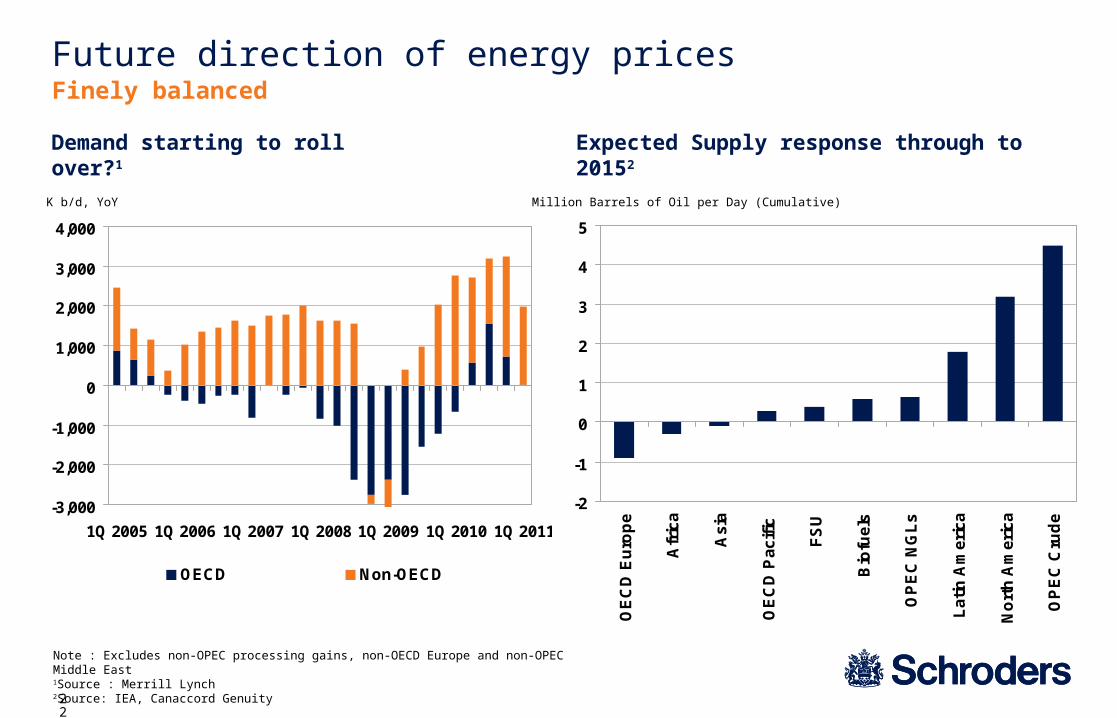
Future direction of energy pricesFinely balanced
Demand starting to roll over?1 Expected Supply response through to 20152
-2
-1
0
1
2
3
4
5
OE
CD
Eu
rop
e
Afr
ica
As
ia
OE
CD
Pa
cif
ic
FS
U
Bio
fue
ls
OP
EC
NG
Ls
La
tin
Am
eri
ca
No
rth
Am
eri
ca
OP
EC
Cru
de
Note : Excludes non-OPEC processing gains, non-OECD Europe and non-OPEC Middle East1Source : Merrill Lynch2Source: IEA, Canaccord Genuity
Million Barrels of Oil per Day (Cumulative)
-3,000
-2,000
-1,000
0
1,000
2,000
3,000
4,000
1Q 2005 1Q 2006 1Q 2007 1Q 2008 1Q 2009 1Q 2010 1Q 2011
OECD Non-OECD
K b/d, YoY
23
25
30
35
40
45
50
55
Se
p-0
4
Se
p-0
5
Se
p-0
6
Se
p-0
7
Se
p-0
8
Se
p-0
9
Se
p-1
0
OPEC Supply Non-OPEC Supply
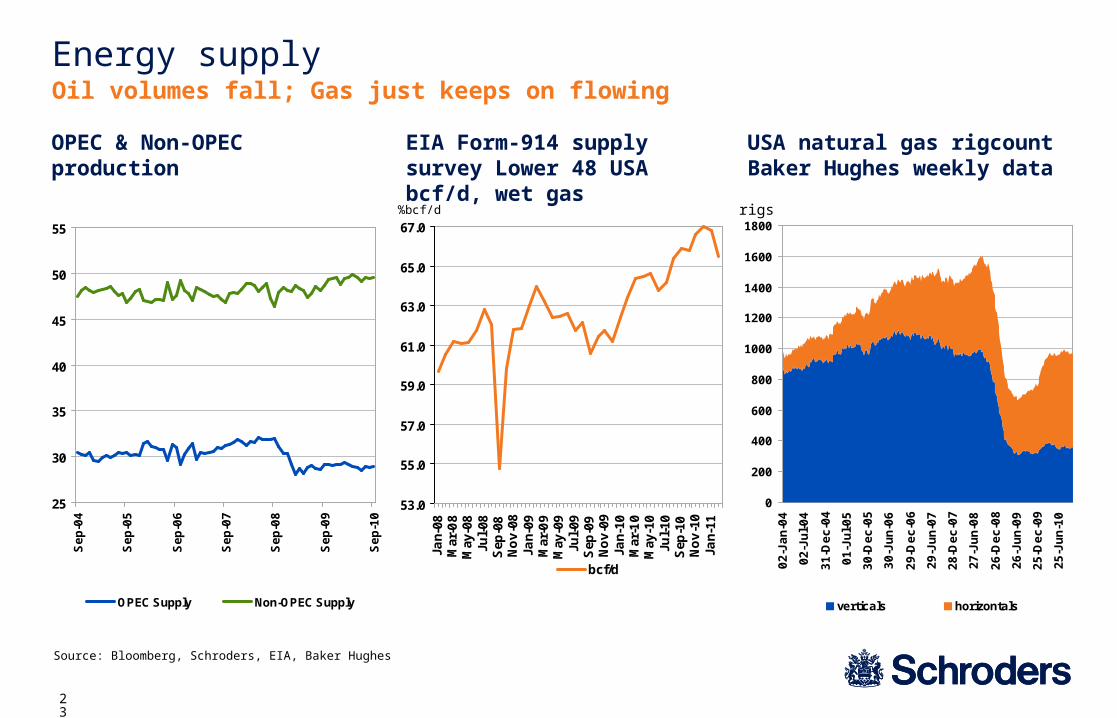
Oil volumes fall; Gas just keeps on flowing
Source: Bloomberg, Schroders, EIA, Baker Hughes
USA natural gas rigcountBaker Hughes weekly data
0
200
400
600
800
1000
1200
1400
1600
1800
02
-Ja
n-0
4
02
-Ju
l-0
4
31
-De
c-0
4
01
-Ju
l-0
5
30
-De
c-0
5
30
-Ju
n-0
6
29
-De
c-0
6
29
-Ju
n-0
7
28
-De
c-0
7
27
-Ju
n-0
8
26
-De
c-0
8
26
-Ju
n-0
9
25
-De
c-0
9
25
-Ju
n-1
0
verticals horizontals
rigs
OPEC & Non-OPEC production EIA Form-914 supply survey Lower 48 USA bcf/d, wet gas
53.0
55.0
57.0
59.0
61.0
63.0
65.0
67.0
Jan-
08M
ar-0
8M
ay-0
8Ju
l-08
Sep
-08
No
v-0
8Ja
n-09
Mar
-09
May
-09
Jul-
09S
ep-0
9N
ov
-09
Jan-
10M
ar-1
0M
ay-1
0Ju
l-10
Sep
-10
No
v-1
0Ja
n-11
bcf/d
%bcf/d
Energy supply
24
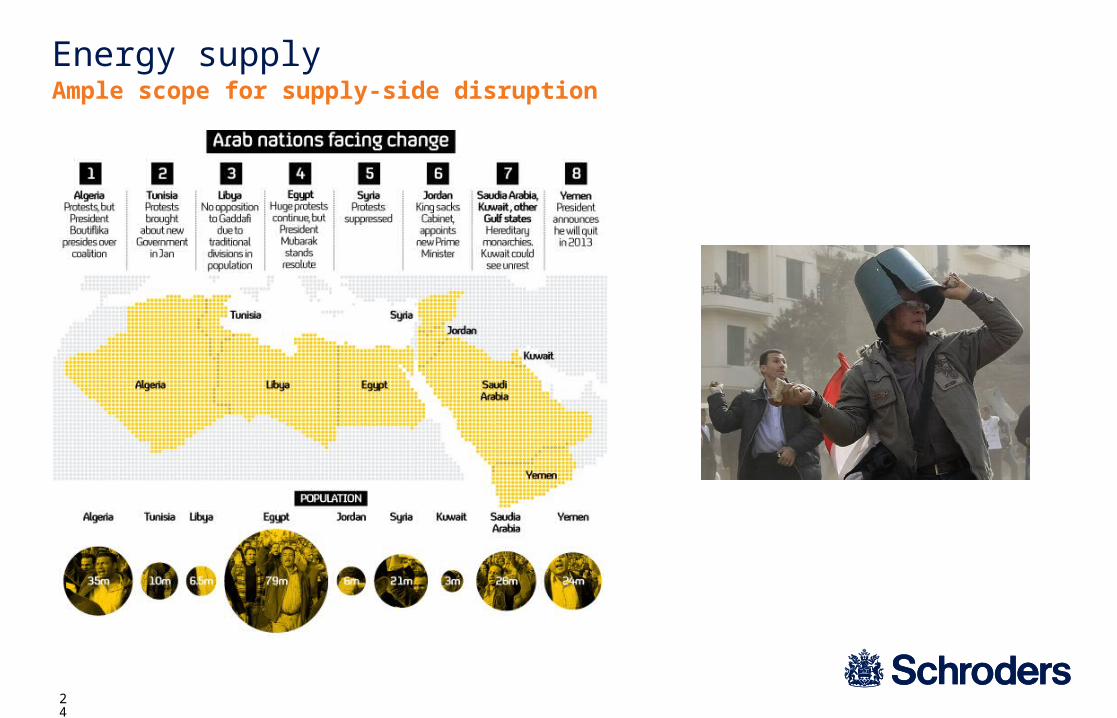
Energy supplyAmple scope for supply-side disruption
25
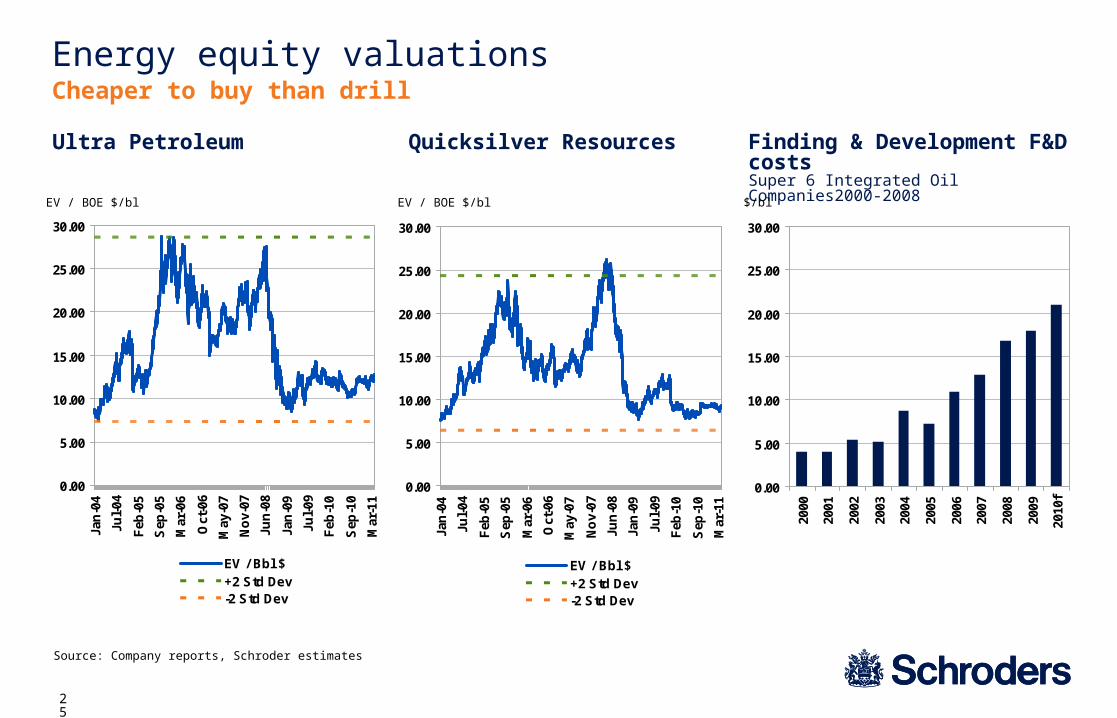
Energy equity valuationsCheaper to buy than drill
Finding & Development F&D costs Super 6 Integrated Oil Companies2000-2008$/bl
Ultra Petroleum
EV / BOE $/bl
Quicksilver Resources
EV / BOE $/bl
Source: Company reports, Schroder estimates
0.00
5.00
10.00
15.00
20.00
25.00
30.00
2000
2001
2002
2003
2004
2005
2006
2007
2008
2009
2010
f
0.00
5.00
10.00
15.00
20.00
25.00
30.00
Jan
-04
Jul-
04
Feb
-05
Sep
-05
Mar
-06
Oct
-06
May
-07
No
v-07
Jun
-08
Jan
-09
Jul-
09
Feb
-10
Sep
-10
Mar
-11
EV / Bbl $+2 Std Dev-2 Std Dev
0.00
5.00
10.00
15.00
20.00
25.00
30.00
Jan
-04
Jul-
04
Feb
-05
Sep
-05
Mar
-06
Oct
-06
May
-07
No
v-07
Jun
-08
Jan
-09
Jul-
09
Feb
-10
Sep
-10
Mar
-11
EV / Bbl $+2 Std Dev-2 Std Dev
26
NameUpside Risked
1 Stock 1 365%
2 Stock 2 326%
3 Stock 3 288%
4 Stock 4 287%
5 Stock 5 278%
6 Stock 6 260%
7 Stock 7 256%
8 Stock 8 177%
9 Stock 9 146%
10 Stock 10 144%
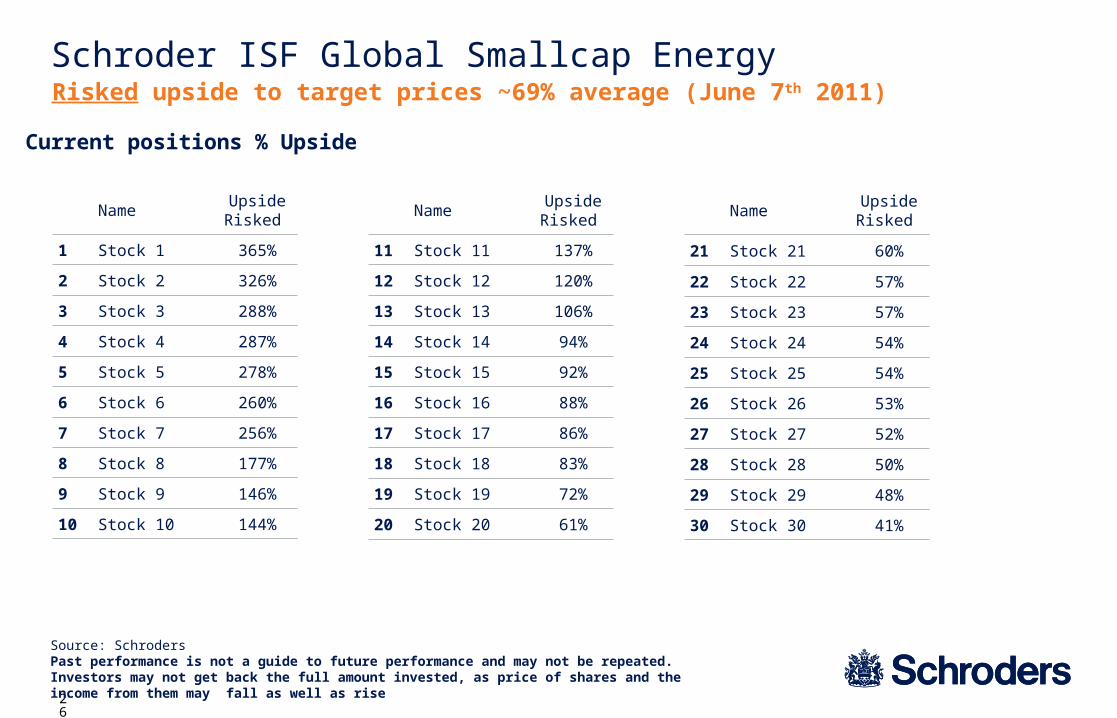
Current positions % Upside
Schroder ISF Global Smallcap EnergyRisked upside to target prices ~69% average (June 7th 2011)
Source: SchrodersPast performance is not a guide to future performance and may not be repeated. Investors may not get back the full amount invested, as price of shares and the income from them may fall as well as rise
NameUpside Risked
11 Stock 11 137%
12 Stock 12 120%
13 Stock 13 106%
14 Stock 14 94%
15 Stock 15 92%
16 Stock 16 88%
17 Stock 17 86%
18 Stock 18 83%
19 Stock 19 72%
20 Stock 20 61%
NameUpside Risked
21 Stock 21 60%
22 Stock 22 57%
23 Stock 23 57%
24 Stock 24 54%
25 Stock 25 54%
26 Stock 26 53%
27 Stock 27 52%
28 Stock 28 50%
29 Stock 29 48%
30 Stock 30 41%
27
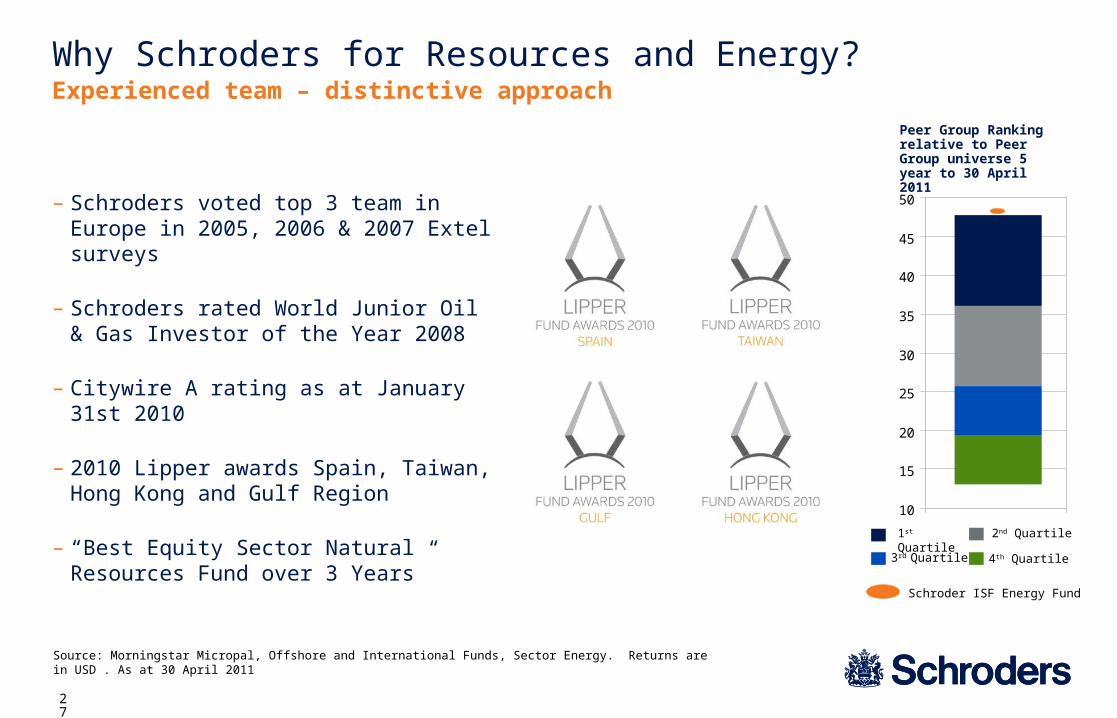
Why Schroders for Resources and Energy?
Source: Morningstar Micropal, Offshore and International Funds, Sector Energy. Returns are in USD . As at 30 April 2011
Experienced team – distinctive approach
1st Quartile 2nd Quartile
3rd Quartile 4th Quartile
Schroder ISF Energy Fund
– Schroders voted top 3 team in Europe in 2005, 2006 & 2007 Extel surveys
– Schroders rated World Junior Oil & Gas Investor of the Year 2008
– Citywire A rating as at January 31st 2010
– 2010 Lipper awards Spain, Taiwan, Hong Kong and Gulf Region
– “Best Equity Sector Natural Resources Fund over 3 Years” 10
15
20
25
30
35
40
45
50
Peer Group Ranking relative to Peer Group universe 5 year to 30 April 2011

28
Performance credentialsBuilding on Schroders’ proven capability in commodities & energy equities
0
10
20
30
40
50
3 months 6 months Since Inception**
Schroder ISF Global Resources Equity Benchmark***
%
Global Resources EquitiesPeriods to 31 May 2011 in USD
3 Months(%)
6 Months (%)
Since Inception** (%)
Schroder ISF Global Resources Equity * +2.0 +17.4 +39.6
Benchmark*** +0.3 +16.3 +34.6
Relative +1.7 +1.1 +5.0
Performance shown is past performance. Past performance is not a guide to future performance. The value of investment can go down as well as up and is not guaranteed. *Schroder ISF Global Resources Equity Fund. Acc C-class, Based on bid to bid prices, net income reinvested. ** Inception 17 May 2010. ***MSCI AC World 35% Energy and 65% Materials. Fund is benchmark unconstrained and that the benchmark is shown for performance comparison.
Periods to 31 May 2011 in USD
29
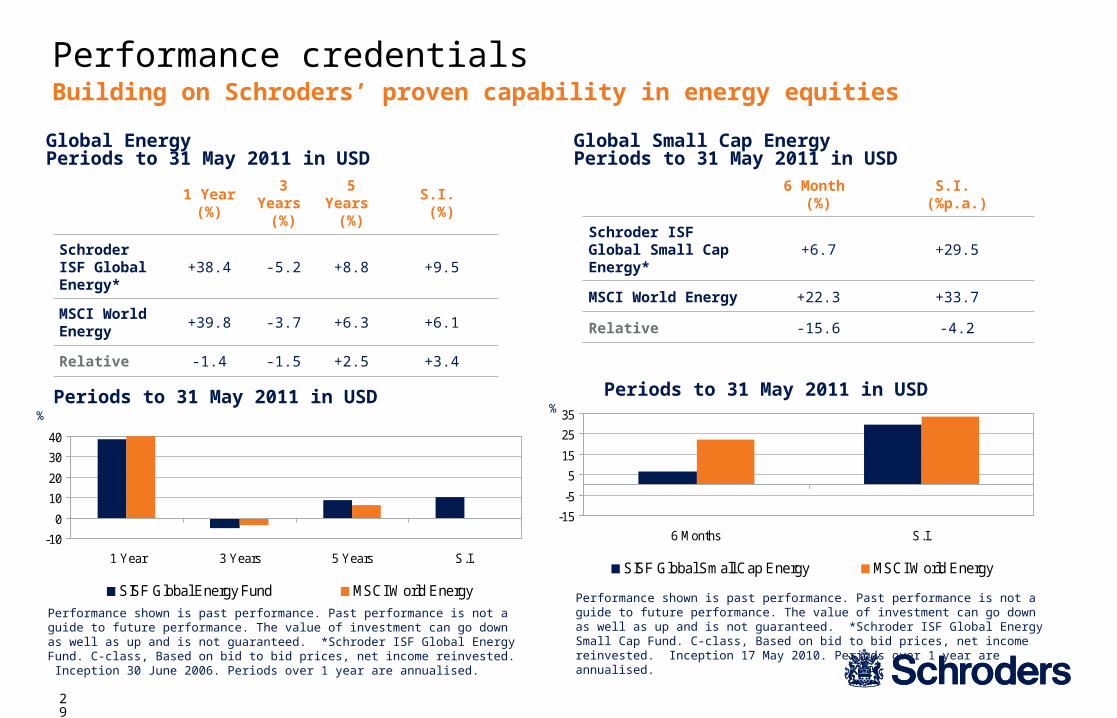
Performance credentialsBuilding on Schroders’ proven capability in energy equities
-10
0
10
20
30
40
1 Year 3 Years 5 Years S.I.
SISF Global Energy Fund MSCI World Energy
%
Global EnergyPeriods to 31 May 2011 in USD
1 Year(%)
3 Years (%)
5 Years (%)
S.I. (%)
Schroder ISF Global Energy*
+38.4 -5.2 +8.8 +9.5
MSCI World Energy
+39.8 -3.7 +6.3 +6.1
Relative -1.4 -1.5 +2.5 +3.4
Performance shown is past performance. Past performance is not a guide to future performance. The value of investment can go down as well as up and is not guaranteed. *Schroder ISF Global Energy Fund. C-class, Based on bid to bid prices, net income reinvested. Inception 30 June 2006. Periods over 1 year are annualised.
Periods to 31 May 2011 in USD
-15
-5
5
15
25
35
6 Months S.I.
SISF Global Small Cap Energy MSCI World Energy
Global Small Cap EnergyPeriods to 31 May 2011 in USD
6 Month (%)
S.I. (%p.a.)
Schroder ISF Global Small Cap Energy*
+6.7 +29.5
MSCI World Energy +22.3 +33.7
Relative -15.6 -4.2
Performance shown is past performance. Past performance is not a guide to future performance. The value of investment can go down as well as up and is not guaranteed. *Schroder ISF Global Energy Small Cap Fund. C-class, Based on bid to bid prices, net income reinvested. Inception 17 May 2010. Periods over 1 year are annualised.
Periods to 31 May 2011 in USD%
30
Investing to maximise returnsConclusion
– Structural growth increases certainty of long term returns
– Resources are key beneficiaries of structural growth drivers
– Resource related equities are an attractive way to exploit the opportunities
– Strong argument for making a strategic allocation

31
Important information
Risk warning: Investments in equities are subject to market risk and, potentially, to currency exchange rate risk. This fund may use financial derivative instruments as a part of the investment process. This may increase the fund’s price volatility by amplifying market events.
Important Information: This presentation does not constitute an offer to anyone, or a solicitation by anyone, to subscribe for shares of Schroder International Selection Fund (the “Company”). Nothing in this presentation should be construed as advice and is therefore not a recommendation to buy or sell shares.
Subscriptions for shares of the Company can only be made on the basis of its latest prospectus together with the latest audited annual report (and subsequent unaudited semi-annual report, if published), copies of which can be obtained, free of charge, from Schroder Investment Management (Luxembourg) S.A.
An investment in the Company entails risks, which are fully described in the prospectus.
Past performance is not a reliable indicator of future results, prices of shares and the income from them may fall as well as rise and investors may not get the amount originally invested.
Third party data is owned or licensed by the data provider and may not be reproduced or extracted and used for any other purpose without the data provider's consent. Third party data is provided without any warranties of any kind. The data provider and issuer of the document shall have no liability in connection with the third party data. The Prospectus and/or www.schroders.com contains additional disclaimers which apply to the third party data.
This presentation is issued by Schroder Investment Management Limited, 31, Gresham Street, EC2V 7QA, who is authorised and regulated by the Financial Services Authority. For your security, all telephone calls are recorded.