Embed Size (px)
Citation preview
Resource and Energy Economics 35 (2013) 217– 234
Contents lists available at SciVerse ScienceDirect
Resource and Energy Economics
j ournal homepage: www.elsev ier .com/ locate / ree
Renewable energy subsidies: Second-best policyor fatal aberration for mitigation?
Matthias Kalkuhla,b,∗, Ottmar Edenhofera,c,d, Kai Lessmanna
a Potsdam Institute for Climate Impact Research, P.O. Box 601203, 14412 Potsdam, Germanyb Center for Development Research, University of Bonn, Walter-Flex-Str. 3, 53113 Bonn, Germanyc Technische Universität Berlin, Strasse des 17. Juni 135, 10623 Berlin, Germanyd Mercator Research Institute on Global Commons and Climate Change (MCC) gGmbH, Torgauer Str. 12 –15, 10829 Berlin, Germany
a r t i c l e i n f o
Article history:Received 16 September 2011Received in revised form 27 January 2013Accepted 30 January 2013
Available online xxx
JEL classification:Q4Q52Q54Q58D58H21
Keywords:Carbon pricingCarbon trustClimate policyFeed-in-tariffGreen paradoxEnergy prices
a b s t r a c t
This paper evaluates the consequences of renewable energy poli-cies on welfare and energy prices in a world where carbon pricingis imperfect and the regulator seeks to limit emissions to a (cumu-lative) target. The imperfectness of the carbon price is motivatedby political concerns regarding distributional effects of increasedenergy prices. Hence, carbon prices are considered to be tempo-rarily or permanently absent or endogenously constrained by theireffect on energy prices. We use a global general equilibrium modelwith an intertemporal fossil resource sector and calculate intertem-porally optimal policies from a broad set of policy instrumentsincluding carbon taxes, renewable energy subsidies and feed-in-tariffs, among others. If carbon pricing is permanently missing,mitigation costs increase by a multiple (compared to the optimalcarbon pricing policy) for a wide range of parameters describingextraction costs, renewable energy costs, substitution possibilitiesand normative attitudes. Furthermore, we show that small devia-tions from the second-best subsidy can lead to strong increases inemissions and consumption losses. This confirms the rising con-cerns about the occurrence of unintended side effects of climate
Abbreviations: ETS, emissions trading scheme; FIT, feed-in-tariff; CES, constant elasticity of substitution; FOC, first-orderconditions; BAU, business-as-usual; BGE, balanced growth equivalent; RE, renewable energy.
∗ Corresponding author at: Center for Development Research, University of Bonn, Walter-Flex-Str. 3, 53113 Bonn, Germany.Tel.: +49 228 73 1841; fax: +49 228 73 1869.
E-mail address: [email protected] (M. Kalkuhl).
0928-7655/$ – see front matter © 2013 Published by Elsevier B.V.http://dx.doi.org/10.1016/j.reseneeco.2013.01.002
218 M. Kalkuhl et al. / Resource and Energy Economics 35 (2013) 217– 234
policy – a new version of the green paradox. Smart combinationsof carbon prices and renewable energy subsidies, however, canachieve ambitious mitigation targets at moderate additional costswithout leading to high energy price increases.
© 2013 Published by Elsevier B.V.
1. Introduction
Policies to promote renewable energy technologies have a long tradition in many OECD countries.Even before carbon pricing instruments (like the EU-ETS in 2005) were implemented to reduce carbonemissions, many countries had used subsidies, feed-in-tariffs (FIT) or public research and developmentspending to increase the share of renewable energy (IEA, 1997). As concerns about global warmingintensify due to new research results such as the latest IPCC (2007b) report and the Stern (2007).Review, politicians and economists are debating about the most effective mitigation policy. Manyeconomists recommend putting a price on carbon in form of taxes or emissions trading schemes (ETS)to mitigate emissions at least costs (e.g. IPCC, 2007a, p. 747).
Basically, there are two strands of argumentations for implementing renewable energy specificpolicies: one is based on efficiency grounds, the other relies on pragmatic considerations promot-ing second-best policies that are politically more feasible.1 The first argumentation claims that theenergy sector is subject to multiple externalities like carbon emissions, local air pollution, innova-tion and learning spillovers, imperfect competition, network effects or energy security concerns (e.g.Fischer and Preonas, 2010; Sorrell and Sijm, 2003; Unruh, 2000). If the regulator implements onlyPigouvian carbon taxes, emissions will be higher than under the first-best optimum (Grimaud et al.,2011). Likewise, if the regulator seeks to achieve a certain emission target (by an ETS or by appropri-ate carbon taxes) without further policy instruments, compliance costs will be higher than sociallyoptimal (Fischer and Newell, 2008; Kalkuhl et al., 2012; Kverndokk and Rosendahl, 2007). The sec-ond, pragmatic argumentation stresses that distributional concerns and missing stakeholder supportfor (efficient) carbon pricing may constitute political constraints which prevent the implementationof the first-best policy: High carbon prices reduce profits and income primarily in the fossil energyindustry and lower-income households (Burtraw et al., 2009; Metcalf, 2008; Parry, 2004; Parry andWilliams III, 2010). Boeters and Koornneef (2011) give further political arguments for the implemen-tation of the EU renewable energy policy such as increase in energy security (through less importsof fossil resources), job creation and technology leadership, among others. Additionally, unilateralcarbon pricing can induce relocation of energy-intensive industries (e.g. Markusen et al., 1993). A uni-form global carbon tax or a global ETS could solve the relocation problem, but might be Utopian inthe short term as there is no practical experience how to negotiate and distribute rent incomes andcost burdens. Ideological attitudes against carbon pricing policies also play an important role: Carbontaxes face high opposition as taxes in general are unpopular in wide parts of the US society (Newellet al., 2005). The alternative to taxes, emissions trading, is criticized similarly by many environmen-talists and developing countries as being institutionally infeasible or unfair. Technology-optimisticconsiderations about the progress of the learning renewable energy technologies might further leadto the perception that a temporary renewable deployment stimulus could be a more manageable wayto foster mitigation.2
The importance of a thorough investigation of the welfare effects of second-best policies is knownfrom the more specific literature on ethanol fuel policies in the United States, where first-best policiesare most likely not politically feasible but a second-best setting is given due to environmental external-ities and energy security concerns. Vedenov and Wetzstein (2008), for example, compute the optimalethanol subsidy for the United States. They stress that in particular rebound effects (i.e. increased fuel
1 Bennear and Stavins (2007) provide a general discussion on the use of second-best instruments.2 Farmer and Trancik (2007), for example, estimate that the “costs of reaching parity between photovoltaics and current
electricity prices are on the order of $200 billion” – which is 1.4% of US GDP in 2009.
M. Kalkuhl et al. / Resource and Energy Economics 35 (2013) 217– 234 219
consumption) have strong implications for the welfare analysis and consequently for the level of theoptimal subsidy. Lapan and Moschini (2012) analyze the welfare performance of portfolios of subsidy,mandates, and fuel tax, showing analytically that mandates outperform subsidies, particularly whencomplemented by a fuel tax. Fischer and Newell (2008) calculate the costs of achieving low emissionreductions (approx. 5%) in the US with carbon pricing and technology policies. They report that carbonprices are the most efficient stand-alone policy; renewable energy subsidies can double mitigationcosts. Likewise, Palmer and Burtraw (2005) consider renewable portfolio standards (RPS), subsidies(renewable energy production tax credits) and cap-and-trade for reducing emissions in the US in 2020.The application of a comprehensive US energy market model shows that subsidies are the most expen-sive policy. Due to decreased energy prices, however, subsidies lead to the highest consumer surplus.Galinato and Yoder (2010) focus on revenue-neutral second-best tax-subsidy combinations to reducecarbon emissions. Finally, Boeters and Koornneef (2011) analyze the interplay of the existing EU ETSand the proposed renewable energy policies to increase the renewable energy share to 20% by 2020.
This paper contributes to the assessment of second-best policies by considering alternatives to car-bon pricing for the energy sector and weighing (theoretical) efficiency against (practical) feasibilityaspects. We conduct a cost-effectiveness analysis which takes a certain mitigation target as exoge-nously given. On the one hand, cost-benefit-analysis depends highly on the assumed damage functionand probability distribution of uncertain parameters. As Weitzman (2010) elaborated, this may notonly lead to a wide range of optimal temperature targets but may also make cost-benefit analysisimpossible if probability distributions are fat-tailed. On the other hand, governments focus in interna-tional negotiations and national implementations often on temperature or emissions targets as theyare less abstract than cost-benefit analysis.
We differ from the existing studies cited above by calculating (intertemporally) optimal second-best instruments that provide a valuable numerical estimation of the (optimistic) least-cost potentialof these emission mitigation instruments. Existing numerical policy assessments of renewable energypolicies focus usually on a medium-term horizon (e.g. emission targets in 2020) for a specific countryor region (US or EU). The medium-term and regional scope is important for national governments butneglects two crucial characteristics of the climate problem: (i) Fossil resource markets are globallyintegrated; hence, domestic policies affect global resource prices (being exogenous in most models)that may trigger adverse supply-response reactions (green paradox). (ii) As a large fraction of car-bon emissions remains for several centuries in the atmosphere, temperature stabilization requires toeventually achieve almost zero (net) emissions, which is a far more demanding goal than a rather‘marginal’ reduction of emissions by 5–15%. Second-best policies that are tolerable for such moderatemitigation targets might turn out to be prohibitively expensive for achieving a zero-carbon economyin the long-term.
In order to focus on the welfare effects of second-best policies, we assume that possible secondarymarket failures like innovation spillovers or network effects are completely internalized by firmsor already addressed by an efficient policy instrument. Hence, renewable energy technologies arenot subject to uncorrected additional market failures besides the climate target which rules out theimplementation of renewable energy subsidies for efficiency reasons. Instead, we consider a second-best (i.e. the welfare maximizing) renewable energy subsidy when carbon pricing is missing, delayedor imperfect. We further analyze a second-best feed-in-tariff system and carbon trust scheme wherefossil tax income is used to cross-finance renewable energy subsidies. We evaluate these instrumentswith respect to their impact on welfare and energy prices compared to an optimal carbon pricingscheme as efficient first-best benchmark. As the impact of climate policy on energy prices is a majorconcern and motivation for the analysis of second-best policies in the literature, we integrate thisaspect explicitly: By formulating an energy price constraint (additionally to the emissions constraint),we can compare ad-hoc policy instruments (like feed-in-tariffs or renewable energy subsidies) withan optimal portfolio subject to emission and price constraints.
It is not obvious how second-best instruments affect the energy price: Fischer (2010) analyzes theeffect of renewable portfolios standards on energy prices. This study offers an explanation why previ-ous investigations of the effect delivered contradicting results. She shows that the effect of renewableportfolios standards (RPS) on energy prices is ambiguous (RPS simultaneously subsidize renewablewhile taxing non-renewable energy sources which has counteracting effects on the electricity price).
220 M. Kalkuhl et al. / Resource and Energy Economics 35 (2013) 217– 234
This is an important clue that combined subsidy/tax instruments may not have the intended effect onenergy prices.3
One of the key findings of our paper is that renewable energy subsidies are indeed capable tolessen the energy price effect of mitigation at moderate costs – if implemented as an optimal portfoliotogether with carbon pricing. Permanent renewable energy subsidies, however, are a very poor andrisky substitute for missing carbon prices in the long-run. Mitigation costs increase by a multiple if nocarbon price is available for variations in a wide range of plausible parameters. Additionally, subsidiesthat deviate only slightly from the optimal subsidy can lead to a severe increase in emissions or to highconsumption losses. Hence, although high carbon prices are hard to establish in reality, permanentsubsidies are no practical alternative. However, feed-in-tariff systems, carbon trusts or (temporary)subsidies combined with long-term carbon pricing can be designed in a way to ease distributionalconflicts at reasonable additional costs.
We perform our analysis within an integrated policy assessment model described in Kalkuhl et al.(2012). Section 2 introduces the economic sectors and the relevant basic equations. In our intertem-poral general equilibrium model, we consider three stylized energy technologies: (i) a fossil energytechnology causing carbon emissions, (ii) a renewable energy technology with high learning-by-doing potential, and (iii) a nuclear power technology as a capital-intensive non-learning carbon-freetechnology. An intertemporal fossil resource extraction sector is integrated to account for possiblesupply-side responses to climate policies as motivated by Sinn (2008). The model is parameterized on aglobal-economy scale to reproduce business-as-usual and mitigation scenarios from typical integratedassessment models. The global dimension is crucial for appropriately considering the intertemporalsupply-side dynamics of fossil resource owners. Although policies have to be implemented nation-ally, considering the global perspective gives a useful upper bound for the efficiency of second-bestinstruments. In contrast to Kalkuhl et al. (2012), we assume no additional market failures for learningtechnologies. Instead, we explore the potential of several renewable energy policies to compensatefor missing or suboptimal carbon prices in order to achieve ambitious mitigation targets. Section 3elaborates the costs of optimal energy subsidies to reduce emissions by simultaneously considering anenergy price constraint. In Section 4, the impact of several second-best policies on welfare and energyprices is discussed, with special emphasis on pure renewable energy subsidies. Finally, we concludeour paper by summing up important insights and implications for climate policy.
2. The model
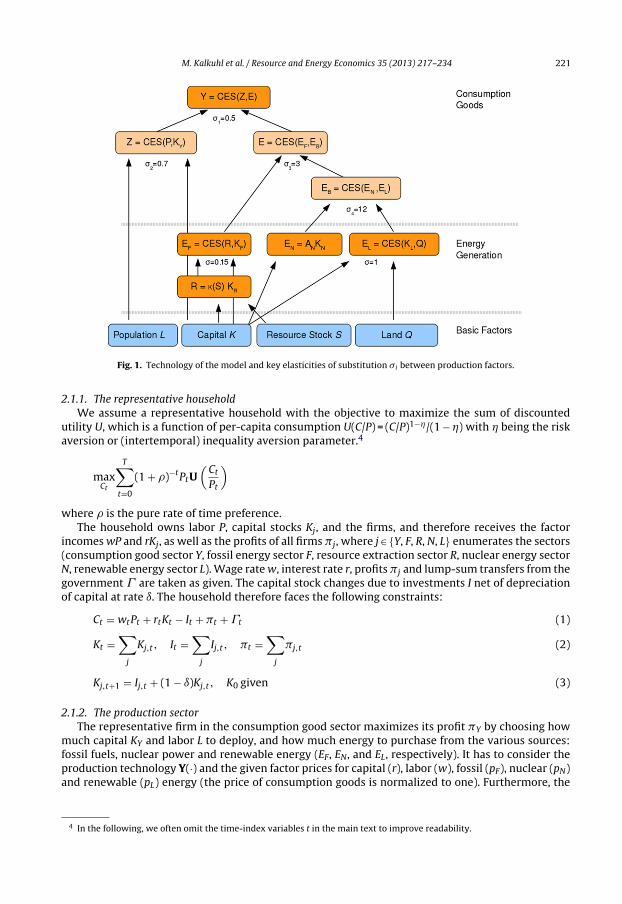
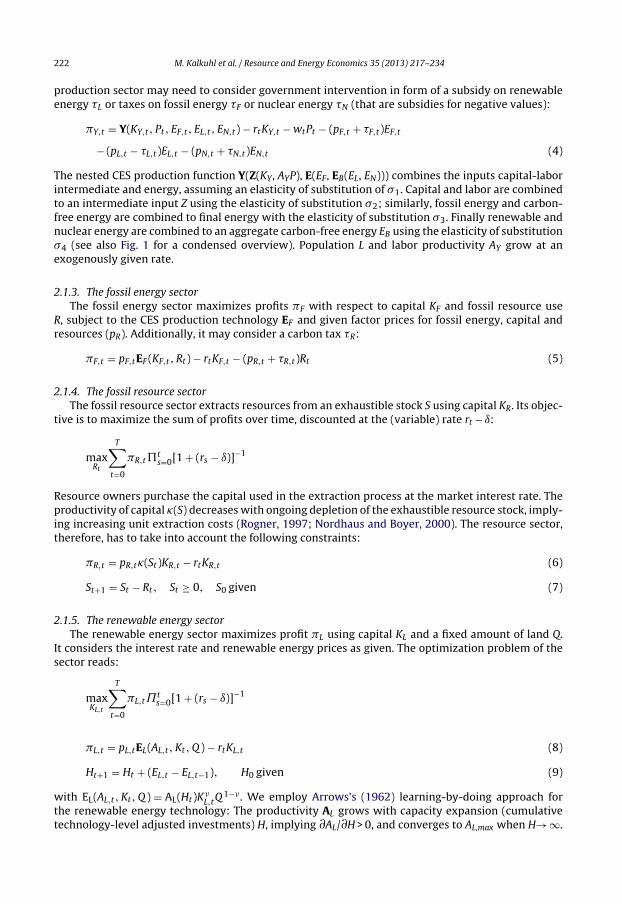
We use an intertemporal general equilibrium model that distinguishes a household, a productionsector, fossil resource extraction and several energy sectors. In addition to energy generated by com-bustion of fossil resources that causes carbon emissions, there are two carbon-free energy sources: anon-learning nuclear energy sector, and a more expensive yet learning renewable technology with ahigh cost-decreasing potential. A further sector extracts fossil resources from a finite resource stock.We assume standard constant elasticity of substitution (CES) production functions (see Fig. 1 for anoverview of the technology used).
For our cost-effectiveness analysis, the mitigation target is expressed by an upper bound for cumu-lative extraction. In contrast to Kalkuhl et al. (2012), there is no emissions trading scheme or ‘carbonbank’ that provides a first-best carbon price according to the Hotelling rule. The government, whichanticipates the equilibrium response of the economy, imposes policy instruments on the economy tomaximize welfare subject to the mitigation target.
2.1. The economic sectors
In the following, we concentrate on a short description of the agents’ optimization problem andthe interplay with the government’s policies. A detailed and more formal description of productiontechnology, market equilibrium and parameter choices can be found in Kalkuhl et al. (2012).
3 The RPS policy in Fischer (2010) is equivalent to the feed-in-tariff policy in our deterministic setting (see Kalkuhl et al., 2012for a formal proof).
M. Kalkuhl et al. / Resource and Energy Economics 35 (2013) 217– 234 221
Fig. 1. Technology of the model and key elasticities of substitution � i between production factors.
2.1.1. The representative householdWe assume a representative household with the objective to maximize the sum of discounted
utility U, which is a function of per-capita consumption U(C/P) = (C/P)1−�/(1 − �) with � being the riskaversion or (intertemporal) inequality aversion parameter.4
maxCt
T∑t=0
(1 + �)−tPtU(
Ct
Pt
)
where � is the pure rate of time preference.The household owns labor P, capital stocks Kj, and the firms, and therefore receives the factor
incomes wP and rKj, as well as the profits of all firms �j, where j ∈ {Y, F, R, N, L} enumerates the sectors(consumption good sector Y, fossil energy sector F, resource extraction sector R, nuclear energy sectorN, renewable energy sector L). Wage rate w, interest rate r, profits �j and lump-sum transfers from thegovernment � are taken as given. The capital stock changes due to investments I net of depreciationof capital at rate ı. The household therefore faces the following constraints:
Ct = wtPt + rtKt − It + �t + �t (1)
Kt =∑
j
Kj,t, It =∑
j
Ij,t , �t =∑
j
�j,t (2)
Kj,t+1 = Ij,t + (1 − ı)Kj,t, K0 given (3)
2.1.2. The production sectorThe representative firm in the consumption good sector maximizes its profit �Y by choosing how
much capital KY and labor L to deploy, and how much energy to purchase from the various sources:fossil fuels, nuclear power and renewable energy (EF, EN, and EL, respectively). It has to consider theproduction technology Y(·) and the given factor prices for capital (r), labor (w), fossil (pF), nuclear (pN)and renewable (pL) energy (the price of consumption goods is normalized to one). Furthermore, the
4 In the following, we often omit the time-index variables t in the main text to improve readability.
222 M. Kalkuhl et al. / Resource and Energy Economics 35 (2013) 217– 234
production sector may need to consider government intervention in form of a subsidy on renewableenergy �L or taxes on fossil energy �F or nuclear energy �N (that are subsidies for negative values):
�Y,t = Y(KY,t, Pt, EF,t, EL,t, EN,t) − rtKY,t − wtPt − (pF,t + �F,t)EF,t
− (pL,t − �L,t)EL,t − (pN,t + �N,t)EN,t (4)
The nested CES production function Y(Z(KY, AYP), E(EF, EB(EL, EN))) combines the inputs capital-laborintermediate and energy, assuming an elasticity of substitution of �1. Capital and labor are combinedto an intermediate input Z using the elasticity of substitution �2; similarly, fossil energy and carbon-free energy are combined to final energy with the elasticity of substitution �3. Finally renewable andnuclear energy are combined to an aggregate carbon-free energy EB using the elasticity of substitution�4 (see also Fig. 1 for a condensed overview). Population L and labor productivity AY grow at anexogenously given rate.
2.1.3. The fossil energy sectorThe fossil energy sector maximizes profits �F with respect to capital KF and fossil resource use
R, subject to the CES production technology EF and given factor prices for fossil energy, capital andresources (pR). Additionally, it may consider a carbon tax �R:
�F,t = pF,tEF (KF,t, Rt) − rtKF,t − (pR,t + �R,t)Rt (5)
2.1.4. The fossil resource sectorThe fossil resource sector extracts resources from an exhaustible stock S using capital KR. Its objec-
tive is to maximize the sum of profits over time, discounted at the (variable) rate rt − ı:
maxRt
T∑t=0
�R,t�ts=0[1 + (rs − ı)]−1
Resource owners purchase the capital used in the extraction process at the market interest rate. Theproductivity of capital (S) decreases with ongoing depletion of the exhaustible resource stock, imply-ing increasing unit extraction costs (Rogner, 1997; Nordhaus and Boyer, 2000). The resource sector,therefore, has to take into account the following constraints:
�R,t = pR,t(St)KR,t − rtKR,t (6)
St+1 = St − Rt, St ≥ 0, S0 given (7)
2.1.5. The renewable energy sectorThe renewable energy sector maximizes profit �L using capital KL and a fixed amount of land Q.
It considers the interest rate and renewable energy prices as given. The optimization problem of thesector reads:
maxKL,t
T∑t=0
�L,t˘ts=0[1 + (rs − ı)]−1
�L,t = pL,tEL(AL,t, Kt, Q ) − rtKL,t (8)
Ht+1 = Ht + (EL,t − EL,t−1), H0 given (9)
with EL(AL,t, Kt, Q ) = AL(Ht)KL,tQ
1−. We employ Arrows’s (1962) learning-by-doing approach forthe renewable energy technology: The productivity AL grows with capacity expansion (cumulativetechnology-level adjusted investments) H, implying ∂AL/∂H > 0, and converges to AL,max when H→ ∞.
M. Kalkuhl et al. / Resource and Energy Economics 35 (2013) 217– 234 223
2.1.6. The nuclear energy sectorThe nuclear energy sector maximizes profit �N subject to energy price and capital input KN with
an AK-technology function:
�N,t = pN,tAN,tKN,t − rtKN,t (10)
2.2. The government
In this study, we are interested in optimal first-best and second-best policies and their impact onwelfare. We therefore calculate the Stackelberg equilibrium where a welfare-maximizing governmentselects the optimal trajectory of policy instruments from a pre-defined subset of available policyinstruments given the implicit reaction functions of the economic sectors (see for example Dockneret al., 2000, p. 111).
The first-order conditions (FOCs) of the previously described sectors (that are listed in detailin Kalkuhl et al. (2012)) define an intertemporal market equilibrium for given policy instruments.The government considers all technology constraints, budget constraints, equations of motion, andfirst-order and transversality conditions and chooses policy instruments (and not investment andextraction) to maximize welfare. Furthermore, the government balances income and expenditure atevery point in time with households’ lump-sum tax � .
�t = �N,tEN,t + �F,tEF,t − �L,tEL,t + �R,tRt (11)
The mitigation target B is considered by a constraint on cumulative resource extraction:
T∑t=0
Rt ≤ B (12)
Considering the amount of cumulative emissions of the next decades is a robust indicator for achiev-ing ambitious temperature targets (Meinshausen et al., 2009). Hence, the government’s optimizationproblem is described by:
max�
T∑t=0
(1 + �)−tPtU(
Ct
Pt
)subject to Eqs.(1) − (12), FOCs (13)
� is the set of government policies and comprises all variables the government has direct access to, e.g.carbon taxes �R, renewable energy subsidies �L, fossil and nuclear energy taxes �F, �N. The descriptionof concrete policies � used in this paper follows below.
2.3. Calibration and implementation of the model
Model parameters are chosen from Kalkuhl et al. (2012). We use a carbon budget of 450 GtC asclimate stabilization target for the mitigation scenario. This limits global warming to 2 ◦C above thepre-industrial level with a probability of roughly 50%.5 The endogenous fossil energy price starts at4 ct/kWh in 2010 and increases up to 8 ct/kWh in 2100 (under business as usual) due to increasingextraction costs. The cost of nuclear energy is mostly constant at 15 ct/kWh which is at the upperbound of the IEA’s cost estimate (IEA, 2010) that ignores external costs of nuclear power, e.g. externalcosts due to the limited accident liability for operators.6 For renewable energy we consider a 17%
5 The chosen carbon budget refers to the entire planning horizon. For B = 450, the resulting cumulative emissions for2010–2050 are 337 GtC. Together with cumulative 2000–2009 emissions of 77 GtC (Boden et al., 2010), 2000–2050 emis-sions are 414 GtC. Meinshausen et al. (2009) suggest that limiting cumulative emissions for 2000–2049 to 392 GtC yields a 50%probability of not exceeding the two-degree target. This probability increases to 75% if cumulative 2000–2049 emissions arelower than 273 GtC.
6 Heyes and Heyes (2000) estimate the magnitude of the implicit subsidy to be 0.01–3.58 ct/kWh for nuclear reactor operatorsin Canada.
224 M. Kalkuhl et al. / Resource and Energy Economics 35 (2013) 217– 234
learning rate which leads to generation costs of 9 ct/kWh in 2100. Initially, the generation costs arearound 28 ct/kWh. The chosen parameterization implies that renewable energy is the dominatingcarbon-free technology under an optimal mitigation policy while nuclear energy plays a limited role.7
In this paper, we focus on the costs of alternative policies to carbon pricing in the absence ofadditional externalities in the renewable energy sector. Hence, we assume perfect anticipation oflearning and therefore neglect potential spillover externalities for learning technologies. The opti-mization problem as defined by (13) forms a non-linear program which is solved numerically withGAMS (Brooke et al., 2005).
2.4. Evaluation of policy instruments
Policies � are evaluated with respect to their impact on intertemporal welfare and energy prices.While the analysis of intertemporal welfare measures the efficiency of instruments to achieve the mit-igation budget, the consideration of energy prices indicates possible distributional conflicts provokedby these policies.
2.4.1. Intertemporal welfareIn order to compare the intertemporal welfare of several policies we use balanced growth equivalents
(BGE) as introduced by Mirrlees and Stern (1972). As we use a discrete time model, we adopt themodified calculation of Anthoff and Tol (2009). The BGE is defined as an exponentially increasingconsumption path (with as initial consumption level and an exogenously given constant growthrate) that generates the same discounted utility as the original consumption path. Hence, we comparethe relative BGE differences for the first-best policy � and the second-best policy �′ according to theformula:
� = (�′) − (�) (�)
=
⎧⎪⎪⎪⎪⎨⎪⎪⎪⎪⎩
(W(�′)W(�)
)1/(1−�)
− 1 � /= 1
exp
(W(�′) − W(�)∑T
t=0(1 + �)−t
)− 1 � = 1
(14)
where W(�) denotes the resulting intertemporal welfare under policy �. By considering the relativedifference � of the two BGEs for � and �′, the growth rate of the exponentially increasing referenceconsumption path becomes irrelevant (see Anthoff and Tol, 2009 for an analytical derivation). Incontrast to a discounted consumption measure that uses an exogenously given discount rate, the BGEdoes not change the welfare ordering of policy outcomes. It translates welfare losses into appropriateconsumption losses which occur once and forever. In other words, the BGEs measure the costs of apolicy like a (non-recycled) tax levied on consumption.
2.4.2. Energy pricesAs energy from different sources is highly but imperfectly substitutable, prices for fossil, nuclear
and renewable energy differ. Therefore, we calculate an average energy price pE,t by the fraction oftotal energy expenditures and total energy consumption Et:
pE,t = pF,tEF,t + pL,tEL,t + pN,tEN,t
Et(15)
By comparing this average energy price, we analyze the impact of policies on energy prices. For thesubsequent analysis, two prominent reference points will often be considered to discuss and comparedifferent mitigation policies:
7 If market failures distort the anticipation of future learning benefits in the renewable energy sector, however, nuclear energybecomes temporarily dominant (see Kalkuhl et al., 2012, where the same model framework is used).
M. Kalkuhl et al. / Resource and Energy Economics 35 (2013) 217– 234 225
0
0.2
0.4
0.6
0.8
1
1.2
0 20 40 60 80 100
Maximum increase of energy price additionally to BAU [%]
Welfare losses [% BGE] due to energy price constraint
Carbon tax + renewable energy subsidyCarbon tax + renewable + nuclear energy subsidyCarbon tax + renewable + nuclear + fossil energy subsidyCarbon tax + nuclear + fossil energy subsidy
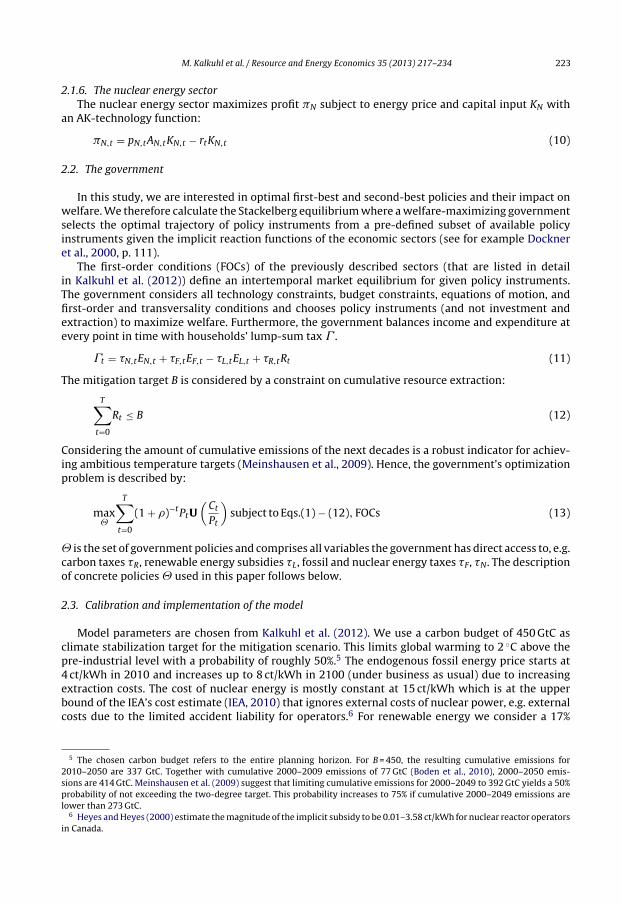
Fig. 2. Additional second-best costs of energy subsidies to reduce energy price increases due to carbon pricing.
• Optimal carbon tax (mitigation benchmark) � = {�R,t}: The optimal carbon tax �∗R,t is the first-best
instrument as it achieves the mitigation target at least economic costs and re-produces an economicoutcome identical to a social planner economy if no further market failures exist (Kalkuhl et al., 2012).The carbon tax increases with the interest rate as it resembles a Hotelling price for the scarcity ofthe carbon budget.
• The business-as-usual (BAU) scenario is considered where the cumulative carbon budget constraint(12) is relaxed and government intervention is absent, implying � =∅.
The welfare difference of a policy compared to the BAU scenario is denoted in the following as mit-igation cost. The welfare difference of a (second-best) policy compared to the mitigation benchmark(i.e. the first-best carbon pricing policy) is denoted as additional second-best cost. Usually, we will com-pare second-best policies with the first-best mitigation policy (carbon pricing) ignoring distributional(energy price) effects. However, it will also be interesting to compare second-best policies with theBAU outcome in order to identify the political economy implications regarding the implementationspecific (second-best) mitigation policies.
3. Optimal climate policies with energy price constraints
As elaborated in Section 1, energy price effects are one of the most important political obstacles forimplementing first-best carbon prices. As compensating lump-sum transfers are difficult to realize inpractice, subsidies on energy generation may be a more pragmatic alternative. We therefore analyzehow different sets of energy subsidies may counteract price increases.
Fig. 2 shows the additional second-best costs (in BGE) of a maximum constraint on energy prices,i.e. pE,t ≤ (1 + )pBAU
E,t . The considered policies are � = {�R, �L}, � = {�R, �L, �N}, � = {�R, �L, �N, �F}and � = {�R, �N, �F}. If energy price increases are limited to 100% compared to BAU prices, almost noadditional subsidies are necessary (and, thus, allowing for them will hardly increase costs). The lessenergy prices are allowed to increase, the higher the BGE losses for each policy. Thus, Fig. 2 visualizesthe trade-off between energy price impacts and overall efficiency losses. As mitigation costs are 2.3%(i.e. the BGE losses of considering a climate target relative to the BAU economy ignoring energy priceincreases), the energy price constraint may increase the costs of climate policy by up to 50%. Limitingenergy price increases to 50%, however, causes only very small additional costs.
If a carbon tax is not complemented by renewable energy subsidies, it becomes even infeasible toachieve the climate target with less than 70% energy price increases. The cheapest policy to considerthe energy price constraint simultaneously with the climate target is a mix of subsidies for all threetechnologies. Complementing a carbon price by a renewable energy subsidy only, increases BGE lossesby up to 0.2 percentage points (relative to the policy mix). Compared to the mitigation costs of 2.3% thatadd to all of the reported BGE losses in Fig. 2, the difference between the pure renewable subsidy and
226 M. Kalkuhl et al. / Resource and Energy Economics 35 (2013) 217– 234
the more comprehensive policies seem to be rather small. While fossil and nuclear energy subsidieshave only a small effect on BGE losses, renewable energy subsidies are indispensable.
The analysis indicates why renewable energy subsidies can be a useful complement for carbonpricing even if innovation market failures do not exist or have already been addressed: renewableenergy policies, if designed appropriately, can dampen one of the politically most worrying negativeside-effects of carbon pricing – the energy price increase – at relatively modest costs.
4. Renewable energy policies for climate change mitigation
In contrast to the optimal policy mix to account for the energy price constraint, there are otherapproaches focusing on renewable energy that have been implemented or that are considered forimplementation. In the following, we assess several second-best policies that achieve a climate targetby integrating a specific kind of renewable energy promotion. These policies are calculated withoutthe energy price constraint because they are not always feasible for a tight constraints (due to thelow degree of freedom) or because they achieve each price constraint ‘by the way’ (as it is the casefor pure renewable energy subsidies, see below).8 The selected policies are politically relevant as theyare either already in place or debated for implementation:
• Feed-in-tariff (FIT) � = {�F,t, �N,t, �L,t}: A uniform tax �F,t = �N,t on fossil and nuclear energy is used tocross-finance a subsidy �L,t on renewable energy and to limit fossil resource use. The FIT is imple-mented as income-neutral policy for the government due to �L,tEL,t = �F,t(EF,t + EN,t). Hence, the costsof promoting renewable energy are entirely borne by the energy sector. It is calculated to achievethe mitigation target at maximum welfare without an additional carbon price and lump-sum taxes(� t = 0).9
• Carbon trust � = {�R,t, �L,t}: For this policy instrument, the revenues of carbon pricing �R,t are spentcompletely to subsidize renewable energy �L,t, implying �L,tEL,t = �R,tRt and � t = 0.10 This instrumentdiffers from the FIT only in that not fossil and nuclear energy but fossil resources (i.e. emissions) aretaxed.
• Renewable energy subsidy � = {�L,t}: A subsidy �L,t on renewable energy is calculated that achievesthe climate target at highest welfare. The subsidy is financed by lump-sum taxation � t of the house-hold. No additional carbon price or energy tax is employed. The pure subsidy policy is consideredas an extreme reference point which is sometimes advocated by environmentalists or experts thatare skeptical of any form of carbon pricing.
• Temporary subsidy policy that is displaced by a carbon price: �t≤t′ = {�L,t} and �t>t′ = {�R,t}. Hence,for t ≤ t′ there is no carbon price (�R,t≤t′ = 0) and for t > t′ there is no subsidy (�L,t>t′ = 0). This instru-ment is appropriate if substantial carbon pricing is not politically feasible in the short run or if thereis a long regulatory phase-in.11 In the long run, however, carbon pricing will be implemented andsubsidies become obsolete.
First, we study these second-best policies with respect to welfare and energy prices. Next, we con-sider how important key parameters influence the welfare losses of pure renewable energy subsidiesas one extreme but popular tool to reduce emissions (Section 4.2). Finally, we consider small deviationsfrom the optimal second-best subsidy and their impact on welfare and emissions (Section 4.3).
8 Income-neutral policies, for example, have to transfer all tax revenues to subsidy expenditures. Hence, extra-subsidies todecrease energy prices have to be financed by other energy taxes that, in turn, increase energy prices.
9 The FIT is one of the most popular renewable energy policy as at least 45 countries implemented them already (Edenhoferet al., 2011, Chapter 11, p. 14).
10 This instrument leans on the atmospheric trust proposal by Barnes et al. (2008). It considers an emissions trading schemewhere the revenues from auctioning are partly used to promote renewable energy technologies.
11 Such a gradual phase-in of regulation can be motivated by distributional concerns (Williams, 2010). Introducing the efficientlevel of Pigovian taxes immediately devalues past investments into physical and human capital that are related to fossil energyuse. These investments had taken place under the prospect of missing Pigovian taxes.
M. Kalkuhl et al. / Resource and Energy Economics 35 (2013) 217– 234 227
0
2
4
6
8
10
12
14
Optimal carbon price
0.5x Energy Price Increase:
Carbon Price + RE Subsidy
No Energy Price Increase:
Carbon Price + RE Subsidy
Feed-in-tariff
Carbon Trust
20-yr Ren Subsidy
40-yr Ren Subsidy
60-yr Ren Subsidy
Renewable subsidy only
0
2
4
6
8
10
12
14W
elfa
re lo
sses
[%]
Welfare losses in BGE consumption losses [%]
Compared to optimal carbon pricing policyCompared to BAU (no policy)
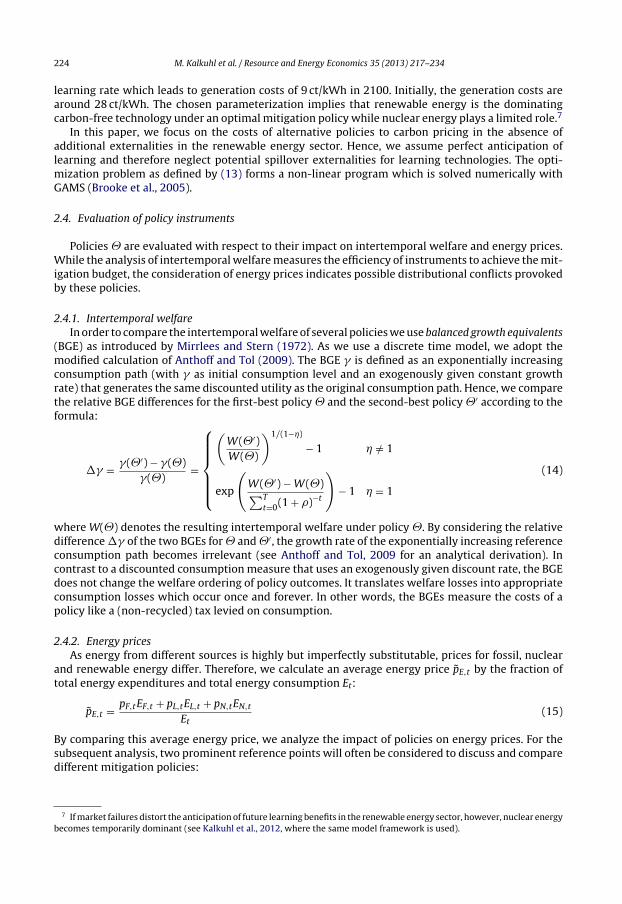
Fig. 3. Welfare losses (in BGE) for several policies.
4.1. Assessment of second-best policies
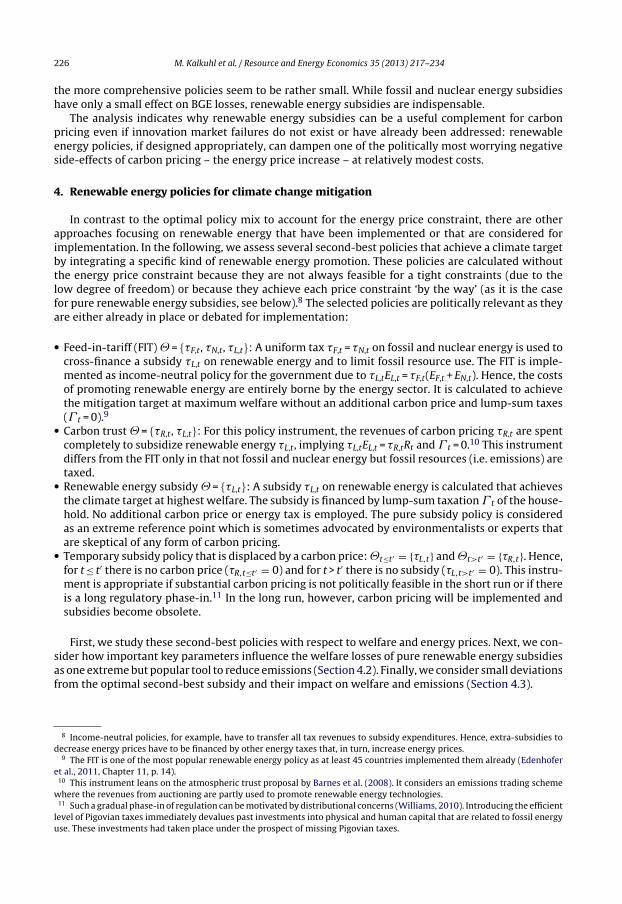
4.1.1. Impact on welfareFig. 3 shows the welfare losses of the policies described above (including two scenarios with energy
price constraint) compared to the business-as-usual scenario without a mitigation target (BAU) and tothe optimal first-best mitigation policy (optimal carbon tax). The mitigation costs of 2.3% increase to3.1% under a FIT and to 2.9% under a carbon trust. The higher mitigation costs occur because taxing fossilenergy or fossil resource use always implies a significant subsidy for renewable energy by the cross-financing mechanism. This subsidy, however, is not necessary because further market imperfections(besides the mitigation target) are absent. Hence, the subsidy leads to distortions and reduces welfare– albeit the quantitative effects remain small. The FIT provokes higher welfare losses than the carbontrust because fossil and nuclear energy is taxed instead of fossil resource use and because not allcost-effective re-allocation possibilities in the fossil energy sector are exploited.12
A temporary subsidy which is displaced by a carbon price in the long run provokes higher additionalcosts the longer carbon pricing is absent. If carbon pricing is implemented after 20 years, additionalcosts are marginal (0.2%). If, in contrast, carbon pricing is implemented after six decades, additionalsecond-best costs become substantial (3.8%). A pure subsidy policy, however, increases mitigationcosts substantially to 15.4%. This is far higher than existing estimates who find that pure subsidypolicies are approximately twice as expensive as carbon pricing (see (Fischer and Newell, 2008; Palmerand Burtraw, 2005), for moderate emission targets for the US).
4.1.2. Impact on energy pricesAs argued in Section 1, distributional concerns are one important reason for the high opposition
against carbon prices. Carbon pricing and fossil energy taxation (FIT) clearly increase fossil energyprices. On the contrary, subsidies on renewable energy decrease fossil energy prices (for an explanationsee below). Hence, households and consumers using large amounts of fossil energy face less energyexpenditures under a pure renewable energy subsidy policy. In contrast to fossil energy, renewable
12 In particular, the fossil energy tax fails to decrease carbon intensity in the fossil energy sector by higher capital input.Even without the cross-financing mechanism (i.e. ςF = 0), mitigation costs of an optimal second-best fossil energy tax are 2.6%implying welfare losses of 0.3% relative to the optimal carbon price.
228 M. Kalkuhl et al. / Resource and Energy Economics 35 (2013) 217– 234
0
0.5
1
1.5
2
2.5
2010 2030 2050 2070 2090
Year
Average energy price [BAU=1]
Optimal carbon pricing50% price increase: Carbon price + ren subsidies0% price increase: Carbon price + ren subsidiesFeed-in-tariffCarbon Trust20-yr subsidy40-yr subsidy60-yr subsidySubsidy
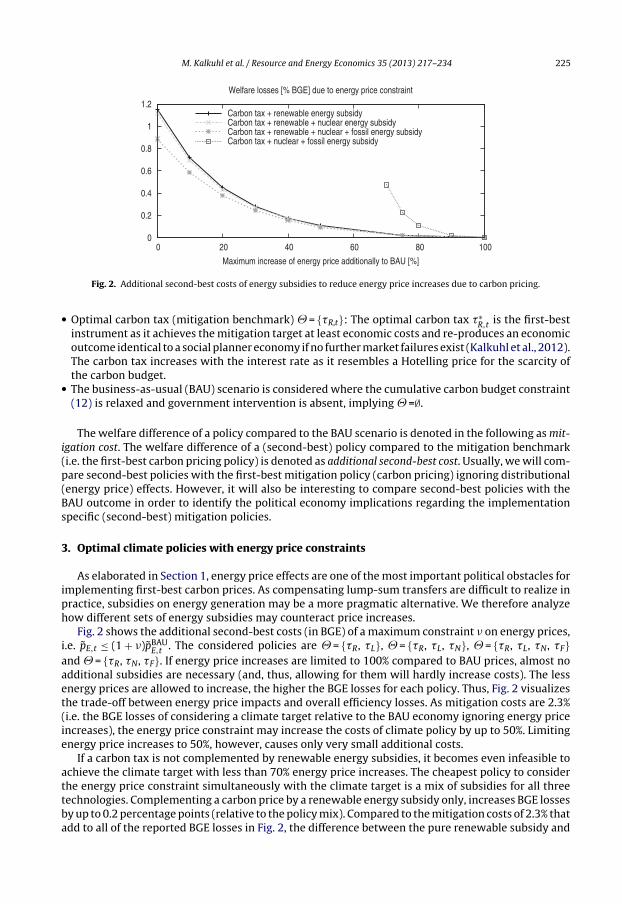
Fig. 4. Average energy prices according to Eq. (15) under different policy regimes relative to BAU prices.
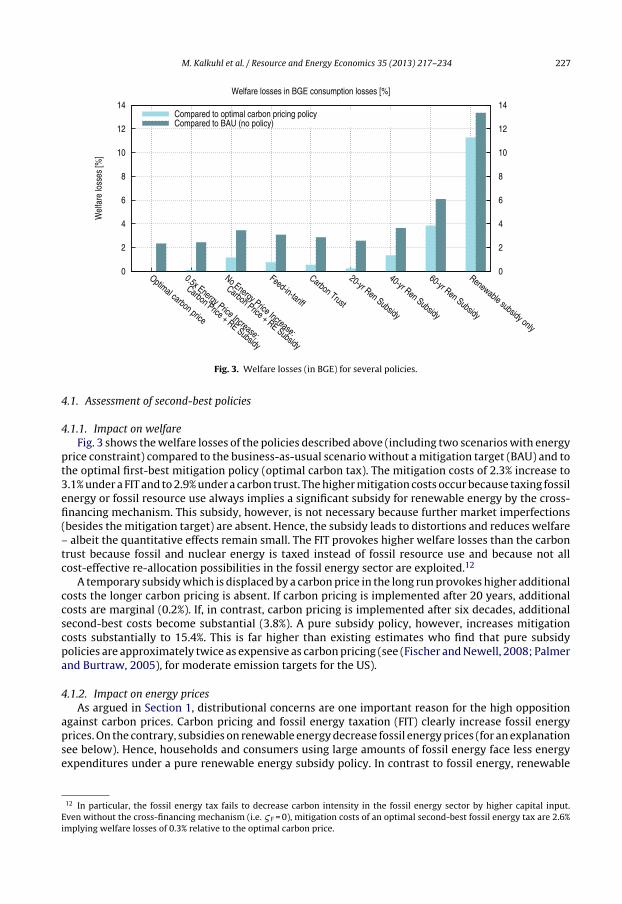
energy prices decrease for all mitigation policies (partly due to induced learning-by-doing, partly dueto paid subsidies).13 While the cost decrease is smallest for an optimal carbon tax, it is most pronouncedunder a pure subsidy policy. Remember that in our model all feasible FIT or Carbon Trust policies raisethe energy price. Thus while we observe a lower energy price in these scenarios compared to optimalcarbon pricing, these policies are not able to maintain the business-as-usual energy price.
The development of average energy prices is shown in Fig. 4. The efficient carbon tax leads to highenergy prices – almost double as high as in the business-as-usual scenario. The FIT and the carbontrust imply lower energy prices, although higher than in the BAU scenario. They peak increase isapproximately 60%. Temporary subsidy policies can reduce energy prices near to or below business-as-usual prices as long as subsidies are paid. After replacing the subsidy by a carbon price, energy pricesincrease sharply up to the energy price under an optimal carbon pricing scheme. Thus, a temporarysubsidy effectively delays the cost increase (and the associated distributional conflict). The permanentsubsidy policy leads to energy prices that are always substantially lower than without mitigation. Notethat in the very long run, energy prices under carbon pricing policies are not higher than in the BAUscenario.14
Hence, when firms or households cannot be compensated for higher energy prices resulting frommitigation targets, feed-in-tariffs, a carbon trust or additional renewable energy subsidies might bea pragmatic alternative to an optimal carbon pricing policy. A permanent renewable energy subsidywithout further carbon prices, however, leads to extremely low energy prices and high welfare losses.The following section will explore the reasons for this and evaluate the role of economic parametersin determining the costs of the pure subsidy policy.
4.2. What determines the second-best costs of a pure renewable energy subsidy policy?
If no tax on carbon or fossil energy is available, renewable energy net prices have to become verylow in order to crowd out fossil energy. It is important to note that the subsidy has to be higher than the
13 Recall that fossil and renewable energy are good but not perfect substitutes. Prices therefore differ.14 First, fossil energy is more expensive in the BAU scenario because extraction costs increase due to high cumulative extraction.
Second, learning-by-doing reduces the costs of renewable energy generation.
M. Kalkuhl et al. / Resource and Energy Economics 35 (2013) 217– 234 229
0
2
4
6
8
10
12
2010 2030 2050 2070 2090
Ener
gy p
rices
[ct/k
Wh]
Year
(a) (b)Fossil energy price (BAU)
Fossil energy price (subsidy policy)Renewable energy price (subsidy policy)
0
1000
2000
3000
4000
5000
6000
7000
8000
2010 2030 2050 2070 2090
Fin
al e
nerg
y de
man
d [E
J]
Year
BAU (no policy)Optimal carbon pricing policySubsidy policy
Fig. 5. Impact of renewable energy subsidies on (a) fossil and renewable energy prices and on (b) fossil and renewable energygeneration.
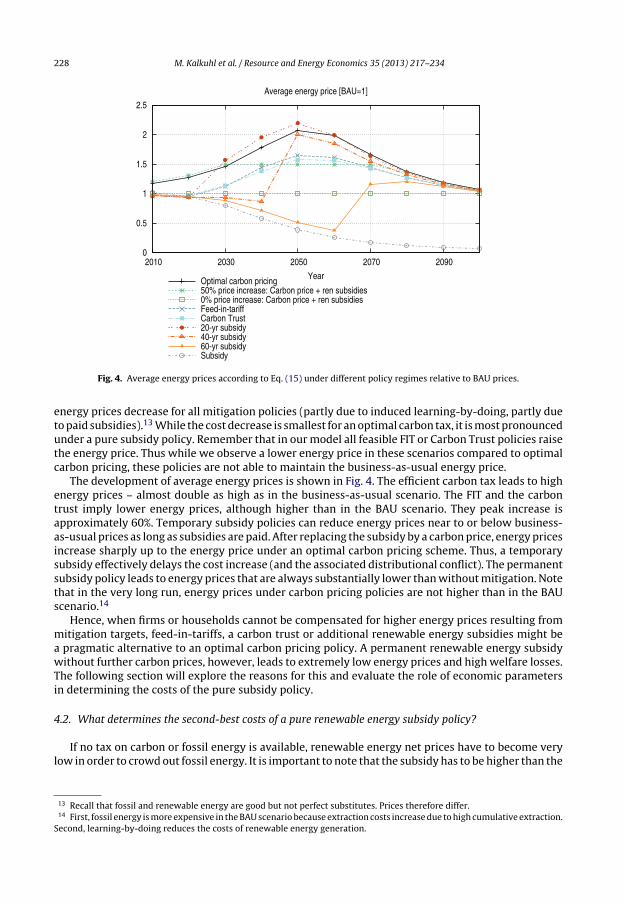
difference between fossil and renewable energy prices due to the (i) extraction cost dynamics, (ii) thefossil resource rent dynamics and (iii) the imperfect substitutability between energy technologies: Theless fossil resources are extracted, the lower are the unit extraction costs as the capital productivity of the extraction industry decreases with cumulative extraction. Fossil resource owners reduce furthertheir scarcity rent mark-up per unit extracted because fossil resources become abundant compared tothe tight carbon budget under the mitigation policy. Fig. 5a indicates how renewable energy subsidiesreduce fossil energy prices below BAU prices due to the supply-side dynamics of fossil resources.However, Fig. 5a also shows that the subsidy is so high that it pushes the renewable energy price farbelow the fossil energy price. This is necessary because both energy technologies are good, but notperfect substitutes: It is difficult, for example, to decarbonize the transportation sector by increasingrenewable energy subsidies because fossil fuel is not always replaceable by energy from wind, solaror biomass. The fact that the renewable energy price has to be far below the BAU price of fossil energyleads to an enormous energy demand, also called rebound effect (Fig. 5b). As a great part of the GDP isnow shifted into the energy sector to generate immense amounts of renewable energy consumptionfalls dramatically which explains the high welfare losses in Fig. 3.
In order to analyze the sensitivity of the consumption losses of a pure renewable energy subsidy,we calculate the mitigation costs for an optimal carbon pricing policy and the additional second-bestcosts for a variation in several economic parameters. Table 1 lists the results for parameters describingfossil resource reserves (S0), substitutability between fossil and carbon-free energy (�3) total energydemand (AL,max, �1), carbon-free energy costs (AL,max, , AN), normative parameters (�, �) and themitigation target (B).
By varying all these parameters we find that the additional second-best costs due to the subsidyare in most cases higher than 5%. A lower fossil reserve size S0 leads to higher resource extractioncosts as resource sites that are difficult to access have to be exploited earlier. Furthermore, resourcerents increase due to the higher scarcity. With increasing extraction costs, the subsidy performsbetter as the fossil energy net price increases in a similar way than under carbon taxes. High fossilenergy prices, however, require lower subsidies – which leads to fewer distortions. Additionally, ahigh substitutability �3 between fossil and carbon-free energy reduces the price gradient at whichrenewable energy crowds out fossil energy. An increase in labor growth productivity AY implies ahigher energy demand in the BAU scenario. This exacerbates the distortions created by the subsidypolicy. In the BAU scenario and under the optimal carbon pricing policy a higher substitutability�1 between final energy and capital and labor reduces the energy demand as it becomes easier tosubstitute expensive energy by capital and labor. Large renewable energy subsidies, on the contrary,lead to a higher energy demand for higher �1 as labor and capital is substituted by cheap energy.Hence, the second-best costs of renewable energy subsidies increase in �1.
If the generation costs of nuclear energy are low (i.e. AN is high), the technology forms a significantpart of an optimal energy mix under an optimal carbon pricing policy. A pure renewable subsidy
230 M. Kalkuhl et al. / Resource and Energy Economics 35 (2013) 217– 234
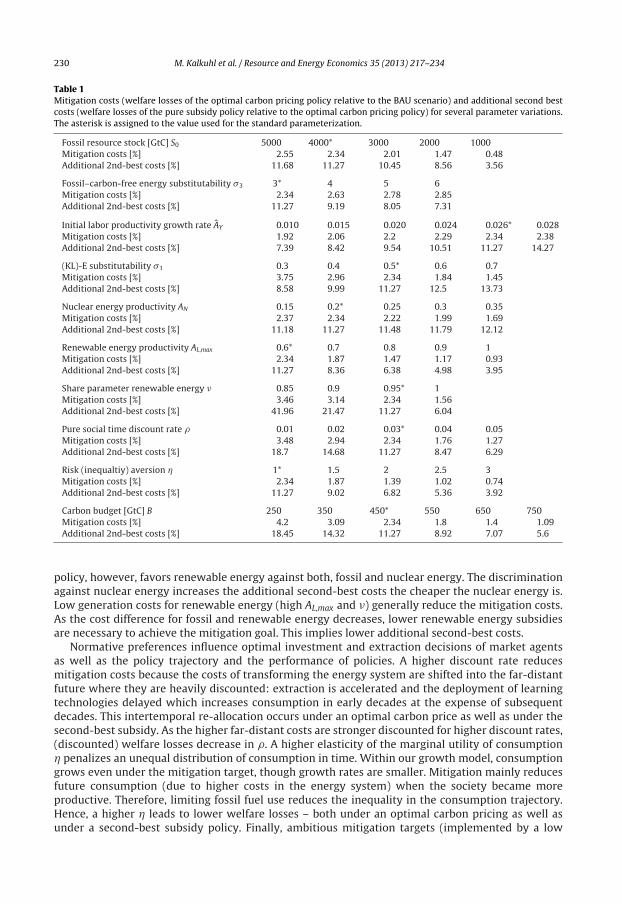
Table 1Mitigation costs (welfare losses of the optimal carbon pricing policy relative to the BAU scenario) and additional second bestcosts (welfare losses of the pure subsidy policy relative to the optimal carbon pricing policy) for several parameter variations.The asterisk is assigned to the value used for the standard parameterization.
Fossil resource stock [GtC] S0 5000 4000* 3000 2000 1000Mitigation costs [%] 2.55 2.34 2.01 1.47 0.48Additional 2nd-best costs [%] 11.68 11.27 10.45 8.56 3.56
Fossil–carbon-free energy substitutability �3 3* 4 5 6Mitigation costs [%] 2.34 2.63 2.78 2.85Additional 2nd-best costs [%] 11.27 9.19 8.05 7.31
Initial labor productivity growth rate AY 0.010 0.015 0.020 0.024 0.026* 0.028Mitigation costs [%] 1.92 2.06 2.2 2.29 2.34 2.38Additional 2nd-best costs [%] 7.39 8.42 9.54 10.51 11.27 14.27
(KL)-E substitutability �1 0.3 0.4 0.5* 0.6 0.7Mitigation costs [%] 3.75 2.96 2.34 1.84 1.45Additional 2nd-best costs [%] 8.58 9.99 11.27 12.5 13.73
Nuclear energy productivity AN 0.15 0.2* 0.25 0.3 0.35Mitigation costs [%] 2.37 2.34 2.22 1.99 1.69Additional 2nd-best costs [%] 11.18 11.27 11.48 11.79 12.12
Renewable energy productivity AL,max 0.6* 0.7 0.8 0.9 1Mitigation costs [%] 2.34 1.87 1.47 1.17 0.93Additional 2nd-best costs [%] 11.27 8.36 6.38 4.98 3.95
Share parameter renewable energy 0.85 0.9 0.95* 1Mitigation costs [%] 3.46 3.14 2.34 1.56Additional 2nd-best costs [%] 41.96 21.47 11.27 6.04
Pure social time discount rate � 0.01 0.02 0.03* 0.04 0.05Mitigation costs [%] 3.48 2.94 2.34 1.76 1.27Additional 2nd-best costs [%] 18.7 14.68 11.27 8.47 6.29
Risk (inequaltiy) aversion � 1* 1.5 2 2.5 3Mitigation costs [%] 2.34 1.87 1.39 1.02 0.74Additional 2nd-best costs [%] 11.27 9.02 6.82 5.36 3.92
Carbon budget [GtC] B 250 350 450* 550 650 750Mitigation costs [%] 4.2 3.09 2.34 1.8 1.4 1.09Additional 2nd-best costs [%] 18.45 14.32 11.27 8.92 7.07 5.6
policy, however, favors renewable energy against both, fossil and nuclear energy. The discriminationagainst nuclear energy increases the additional second-best costs the cheaper the nuclear energy is.Low generation costs for renewable energy (high AL,max and ) generally reduce the mitigation costs.As the cost difference for fossil and renewable energy decreases, lower renewable energy subsidiesare necessary to achieve the mitigation goal. This implies lower additional second-best costs.
Normative preferences influence optimal investment and extraction decisions of market agentsas well as the policy trajectory and the performance of policies. A higher discount rate reducesmitigation costs because the costs of transforming the energy system are shifted into the far-distantfuture where they are heavily discounted: extraction is accelerated and the deployment of learningtechnologies delayed which increases consumption in early decades at the expense of subsequentdecades. This intertemporal re-allocation occurs under an optimal carbon price as well as under thesecond-best subsidy. As the higher far-distant costs are stronger discounted for higher discount rates,(discounted) welfare losses decrease in �. A higher elasticity of the marginal utility of consumption� penalizes an unequal distribution of consumption in time. Within our growth model, consumptiongrows even under the mitigation target, though growth rates are smaller. Mitigation mainly reducesfuture consumption (due to higher costs in the energy system) when the society became moreproductive. Therefore, limiting fossil fuel use reduces the inequality in the consumption trajectory.Hence, a higher � leads to lower welfare losses – both under an optimal carbon pricing as well asunder a second-best subsidy policy. Finally, ambitious mitigation targets (implemented by a low
M. Kalkuhl et al. / Resource and Energy Economics 35 (2013) 217– 234 231
0
10
20
30
40
50
0 1 2 3 4 5
Addi
tiona
l 2nd
-bes
t cos
ts [%
]
Mitigation costs [%]
Parameter
S0σ3AYσ1ANAL,maxνρηB0
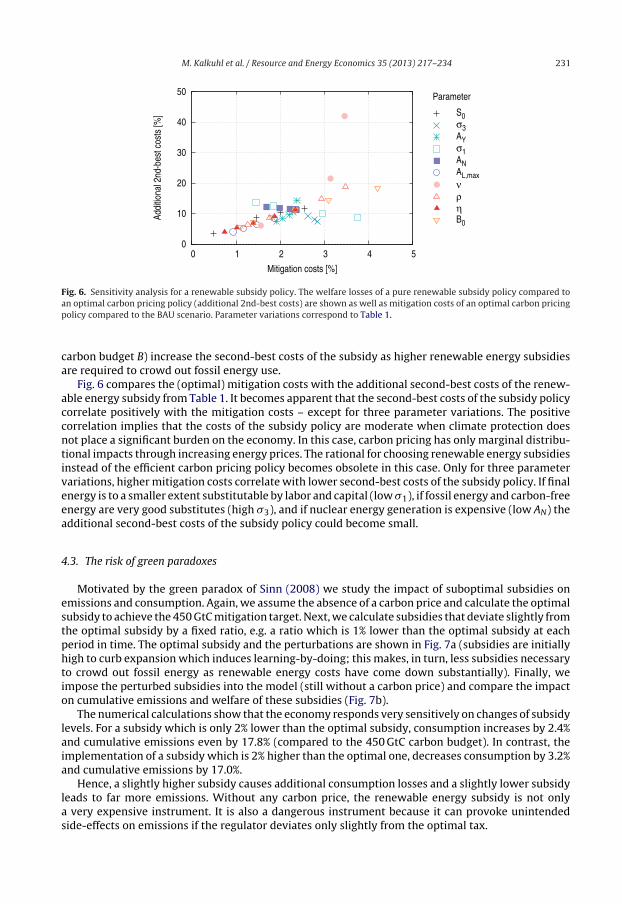
Fig. 6. Sensitivity analysis for a renewable subsidy policy. The welfare losses of a pure renewable subsidy policy compared toan optimal carbon pricing policy (additional 2nd-best costs) are shown as well as mitigation costs of an optimal carbon pricingpolicy compared to the BAU scenario. Parameter variations correspond to Table 1.
carbon budget B) increase the second-best costs of the subsidy as higher renewable energy subsidiesare required to crowd out fossil energy use.
Fig. 6 compares the (optimal) mitigation costs with the additional second-best costs of the renew-able energy subsidy from Table 1. It becomes apparent that the second-best costs of the subsidy policycorrelate positively with the mitigation costs – except for three parameter variations. The positivecorrelation implies that the costs of the subsidy policy are moderate when climate protection doesnot place a significant burden on the economy. In this case, carbon pricing has only marginal distribu-tional impacts through increasing energy prices. The rational for choosing renewable energy subsidiesinstead of the efficient carbon pricing policy becomes obsolete in this case. Only for three parametervariations, higher mitigation costs correlate with lower second-best costs of the subsidy policy. If finalenergy is to a smaller extent substitutable by labor and capital (low �1), if fossil energy and carbon-freeenergy are very good substitutes (high �3), and if nuclear energy generation is expensive (low AN) theadditional second-best costs of the subsidy policy could become small.
4.3. The risk of green paradoxes
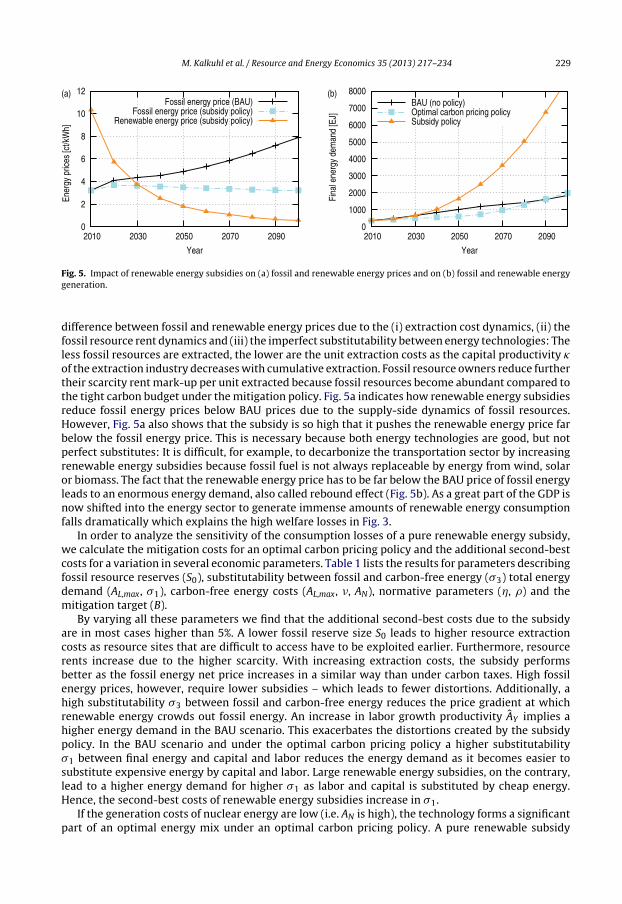
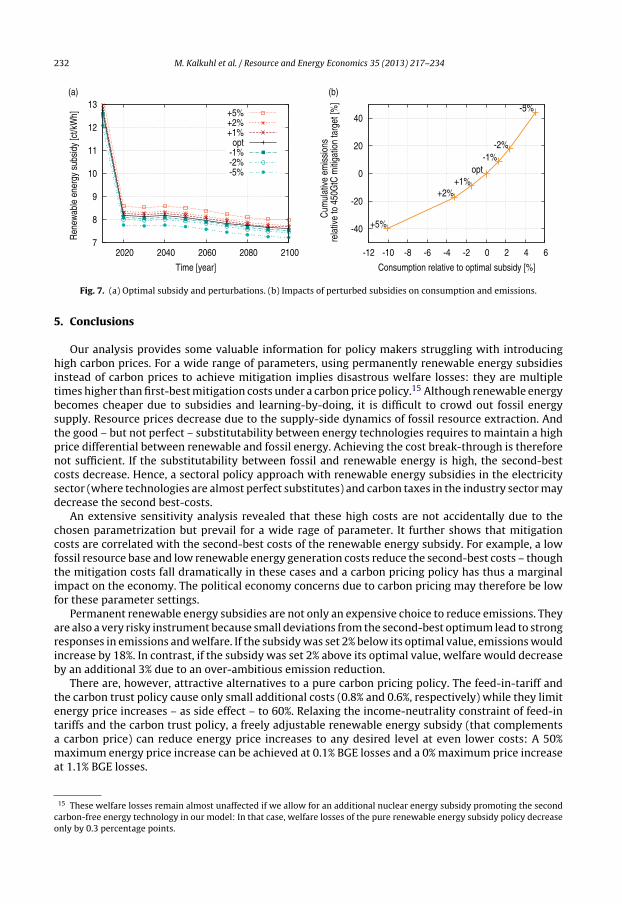
Motivated by the green paradox of Sinn (2008) we study the impact of suboptimal subsidies onemissions and consumption. Again, we assume the absence of a carbon price and calculate the optimalsubsidy to achieve the 450 GtC mitigation target. Next, we calculate subsidies that deviate slightly fromthe optimal subsidy by a fixed ratio, e.g. a ratio which is 1% lower than the optimal subsidy at eachperiod in time. The optimal subsidy and the perturbations are shown in Fig. 7a (subsidies are initiallyhigh to curb expansion which induces learning-by-doing; this makes, in turn, less subsidies necessaryto crowd out fossil energy as renewable energy costs have come down substantially). Finally, weimpose the perturbed subsidies into the model (still without a carbon price) and compare the impacton cumulative emissions and welfare of these subsidies (Fig. 7b).
The numerical calculations show that the economy responds very sensitively on changes of subsidylevels. For a subsidy which is only 2% lower than the optimal subsidy, consumption increases by 2.4%and cumulative emissions even by 17.8% (compared to the 450 GtC carbon budget). In contrast, theimplementation of a subsidy which is 2% higher than the optimal one, decreases consumption by 3.2%and cumulative emissions by 17.0%.
Hence, a slightly higher subsidy causes additional consumption losses and a slightly lower subsidyleads to far more emissions. Without any carbon price, the renewable energy subsidy is not onlya very expensive instrument. It is also a dangerous instrument because it can provoke unintendedside-effects on emissions if the regulator deviates only slightly from the optimal tax.
232 M. Kalkuhl et al. / Resource and Energy Economics 35 (2013) 217– 234
7
8
9
10
11
12
13
2020 2040 2060 2080 2100
Ren
ewab
le e
nerg
y su
bsid
y [c
t/kW
h]
Time [year]
(a) (b)
+5%+2%+1%
opt-1%-2%-5%
-40
-20
0
20
40
-12 -10 -8 -6 -4 -2 0 2 4 6
Cum
ulat
ive
emis
sion
s re
lativ
e to
450
GtC
miti
gatio
n ta
rget
[%]
Consumption relative to optimal subsidy [%]
-5%
-2%-1%
opt+1%
+2%
+5%
Fig. 7. (a) Optimal subsidy and perturbations. (b) Impacts of perturbed subsidies on consumption and emissions.
5. Conclusions
Our analysis provides some valuable information for policy makers struggling with introducinghigh carbon prices. For a wide range of parameters, using permanently renewable energy subsidiesinstead of carbon prices to achieve mitigation implies disastrous welfare losses: they are multipletimes higher than first-best mitigation costs under a carbon price policy.15 Although renewable energybecomes cheaper due to subsidies and learning-by-doing, it is difficult to crowd out fossil energysupply. Resource prices decrease due to the supply-side dynamics of fossil resource extraction. Andthe good – but not perfect – substitutability between energy technologies requires to maintain a highprice differential between renewable and fossil energy. Achieving the cost break-through is thereforenot sufficient. If the substitutability between fossil and renewable energy is high, the second-bestcosts decrease. Hence, a sectoral policy approach with renewable energy subsidies in the electricitysector (where technologies are almost perfect substitutes) and carbon taxes in the industry sector maydecrease the second best-costs.
An extensive sensitivity analysis revealed that these high costs are not accidentally due to thechosen parametrization but prevail for a wide rage of parameter. It further shows that mitigationcosts are correlated with the second-best costs of the renewable energy subsidy. For example, a lowfossil resource base and low renewable energy generation costs reduce the second-best costs – thoughthe mitigation costs fall dramatically in these cases and a carbon pricing policy has thus a marginalimpact on the economy. The political economy concerns due to carbon pricing may therefore be lowfor these parameter settings.
Permanent renewable energy subsidies are not only an expensive choice to reduce emissions. Theyare also a very risky instrument because small deviations from the second-best optimum lead to strongresponses in emissions and welfare. If the subsidy was set 2% below its optimal value, emissions wouldincrease by 18%. In contrast, if the subsidy was set 2% above its optimal value, welfare would decreaseby an additional 3% due to an over-ambitious emission reduction.
There are, however, attractive alternatives to a pure carbon pricing policy. The feed-in-tariff andthe carbon trust policy cause only small additional costs (0.8% and 0.6%, respectively) while they limitenergy price increases – as side effect – to 60%. Relaxing the income-neutrality constraint of feed-intariffs and the carbon trust policy, a freely adjustable renewable energy subsidy (that complementsa carbon price) can reduce energy price increases to any desired level at even lower costs: A 50%maximum energy price increase can be achieved at 0.1% BGE losses and a 0% maximum price increaseat 1.1% BGE losses.
15 These welfare losses remain almost unaffected if we allow for an additional nuclear energy subsidy promoting the secondcarbon-free energy technology in our model: In that case, welfare losses of the pure renewable energy subsidy policy decreaseonly by 0.3 percentage points.
M. Kalkuhl et al. / Resource and Energy Economics 35 (2013) 217– 234 233
Renewable energy subsidies are an efficient policy instrument when they address market failuresdirectly associated with renewable energy technologies or markets.16 This article emphasized thatbeside this aspect, renewable energy subsidies might be an important additional instrument to addressthe serious political concerns of carbon pricing regarding energy price impacts. However, if renewableenergy subsidies aim to reduce carbon emissions because carbon prices are entirely missing, welfarelosses can be substantial. In particular, if mitigation imposes a severe constraint on the economy –i.e. if fossil resources are abundant and cheaply available compared to renewable energy generation– a subsidy policy creates high additional consumption losses. The results of this paper show thatwithout some form of carbon pricing, pragmatic renewable energy policies may turn out to be a fatalaberration for mitigating global warming as costs explode. In order to achieve mitigation targets atlow costs, there seems to be no way around direct or indirect carbon pricing – at least in the long run.
Acknowledgements
We would like to thank two anonymous reviewers for the valuable comments that helped toimprove the paper. We gratefully acknowledge funding by the “Pakt für Forschung und Innovation”of the Leibniz-Gemeinschaft Germany, and the German Federal Ministry of Education and Research(BMBF) in the Call “Economics of Climate Change” (funding code 01LA11020B, Green Paradox).
References
Anthoff, D., Tol, R., 2009. The impact of climate change on the balanced growth equivalent: an application of FUND. Environ-mental and Resource Economics 43, 351–367.
Arrow, K.J., 1962. The economic implications of learning by doing. The Review of Economic Studies 29 (3), 155–173.Barnes, P., Costanza, R., Hawken, P., Orr, D., Ostrom, E., Umana, A., Young, O., 2008. Creating an earth atmospheric trust. Science
319 (5864), 724b.Bennear, L., Stavins, R., 2007. Second-best theory and the use of multiple policy instruments. Environmental and Resource
Economics 37 (1), 111–129.Boden, T., Marland, G., Andres, R., 2010. Global, regional, and national fossil-fuel CO2 emissions. Tech. Rep., Oak Ridge National
Laboratory, U.S. Department of Energy, Oak Ridge, TN, U.S.A.Boeters, S., Koornneef, J., 2011. Supply of renewable energy sources and the cost of eu climate policy. Energy Economics 33 (5),
1024–1034.Brooke, A., Kendrick, D., Meeraus, A., Raman, R., Rosenthal, R.E., 2005. GAMS. A Users Guide. GAMS Development Corporation.Burtraw, D., Sweeney, R., Walls, M., 2009. The incidence of U.S. climate policy: alternative uses of revenues from a cap-and-trade
auction. Resources for the Future Discussion Papers dp-09-17-rev.Dockner, E., Jørgensen, S., van Long, N., Sorger, G., 2000. Differential Games in Economics and Management Science. Cambridge
University Press, Cambridge.Edenhofer, O., Pichs-Madruga, R., Sokona, Y., Seyboth, K., Matschoss, P., Kadner, S., Zwickel, T., Eickemeier, P., Hansen, G.,
Schlömer, S., von Stechow, C. (Eds.), 2011. IPCC Special Report on Renewable Energy Sources and Climate Change Mitigation.Cambridge University Press, Cambridge, United Kingdom and New York, NY, USA.
Farmer, J.D., Trancik, J., 2007. Dynamics of Technological Development in the Energy Sector. The London Accord.Fischer, C., 2010. Renewable performance standards: when do they lower energy prices? Energy Journal 31 (1), 101–119.Fischer, C., Newell, R.G., 2008. Environmental and technology policies for climate mitigation. Journal of Environmental Eco-
nomics and Management 55 (2), 142–162.Fischer, C., Preonas, L., 2010. Combining policies for renewable energy: is the whole less than the sum of its parts? Resources
for the Future Discussion Papers dp-10-19.Galinato, G.I., Yoder, J.K., 2010. An integrated tax-subsidy policy for carbon emission reduction. Resource and Energy Economics
32 (August (3)), 310–326.Grimaud, A., Lafforgue, G., Magné, B., 2011. Climate change mitigation options and directed technical change: A decentralized
equilibrium analysis. Resource and Energy Economics 33 (4), 938–962.Heyes, A., Heyes, C., 2000. An empirical analysis of the nuclear liability act (1970) in Canada. Resource and Energy Economics
22 (January (1)), 91–101.IEA, 1997. Renewable Energy Policy in IEA Countries, Volume 1: Overview. International Energy Agency, Paris, France.IEA, 2010. Projected Costs of Generating Electricity. International Energy Agency, Paris, France.
16 Compared to the social optimum, the welfare costs of pure subsidies does not change if innovation spillovers persist leadingto an under-deployment of renewable energy. In this case, the pure carbon pricing policy benchmark would lead to approx.0.5–2% additional BGE welfare losses (see Kalkuhl et al., 2012 for calculations within the same model approach), while the purerenewable subsidy policy would still entail welfare losses of 11% compared to the optimal combination of both policies. In caseof 60% innovation spillovers, the welfare losses of feed-in-tariffs, reduce from 0.75 to 0.65% and the welfare losses of the carbontrust policy reduce from 0.54 to 0.41%.
234 M. Kalkuhl et al. / Resource and Energy Economics 35 (2013) 217– 234
IPCC, 2007a. Climate Change 2007: Mitigation. Contribution of Working Group III to the Fourth Assessment Report of theIntergovernmental Panel on Climate Change. Cambridge University Press, Cambridge and New York.
IPCC, 2007b. Climate Change 2007: The Physical Science Basis. Contribution of Working Group I to the Fourth Assessment Reportof the Intergovernmental Panel on Climate Change. Cambridge University Press, Cambridge and New York.
Kalkuhl, M., Edenhofer, O., Lessmann, K., 2012. Learning or lock-in: optimal technology policies to support mitigation. Resourceand Energy Economics 34 (1), 1–23.
Kverndokk, S., Rosendahl, K.E., 2007. Climate policies and learning by doing: impacts and timing of technology subsidies.Resource and Energy Economics 29 (1), 58–82.
Lapan, H., Moschini, G., 2012. Second-best biofuel policies and the welfare effects of quantity mandates and subsidies. Journalof Environmental Economics and Management 63, 224–241.
Markusen, J.R., Morey, E.R., Olewiler, N.D., 1993. Environmental policy when market structure and plant locations are endoge-nous. Journal of Environmental Economics and Management 24 (January (1)), 69–86.
Meinshausen, M., Meinshausen, N., Hare, W., Raper, S.C.B., Frieler, K., Knutti, R., Frame, D.J., Allen, M.R., 2009. Greenhouse-gasemission targets for limiting global warming to 2C. Nature 458 (7242), 1158–1162.
Metcalf, G.E., 2008. Designing a carbon tax to reduce U.S. greenhouse gas emissions. Review of Environmental Economics andPolicy 3 (1), 63–83.
Mirrlees, J.A., Stern, N.H., 1972. Fairly good plans. Journal of Economic Theory 4 (2), 268–288.Newell, R., Pizer, W., Zhang, J., 2005. Managing permit markets to stabilize prices. Environmental and Resource Economics 31,
133–157.Nordhaus, W.D., Boyer, J., 2000. Warming the World. Economic Models of Global Warming. The MIT Press, Cambridge, MA,
London, England.Palmer, K., Burtraw, D., 2005. Cost-effectiveness of renewable electricity policies. Energy Economics 27 (6), 873–894.Parry, I.W., Williams III, R.C., 2010. What are the costs of meeting distributional objectives for climate policy? NBER Working
Papers 16486, National Bureau of Economic Research Inc.Parry, I.W.H., 2004. Are emissions permits regressive? Journal of Environmental Economics and Management 47 (2), 364–387.Rogner, H.-H., 1997. An assessment of world hydrocarbon resources. Annual Review of Energy and the Environment 22 (1),
217–262.Sinn, H.-W., 2008. Public policies against global warming: a supply side approach. International Tax and Public Finance 15 (4),
360–394.Sorrell, S., Sijm, J., 2003. Carbon trading in the policy mix. Oxford Review of Economic Policy 19 (3), 420–437.Stern, N., 2007. The Economics of Climate Change: The Stern Review. Cambridge University Press, Cambridge.Unruh, G.C., 2000. Understanding carbon lock-in. Energy Policy 28 (12), 817–830.Vedenov, D., Wetzstein, M., 2008. Toward an optimal us ethanol fuel subsidy. Energy Economics 30 (5), 2073–2090.Weitzman, M.L., 2010. GHG targets as insurance against catastrophic climate damages. NBER Working Papers 16136, National
Bureau of Economic Research Inc.Williams III, R.C., 2010. Setting the initial time-profile of climate policy: the economics of environmental policy phase-ins. NBER
Working Papers 16120, National Bureau of Economic Research Inc.