Embed Size (px)
Citation preview

Copyright © 2014 The Brattle Group, Inc.
P r e sen ted t o
P r e pared b y
Resource Adequacy Requirements, Scarcity Pricing, and Electricity Market Design Implications
IEA Electricity Security Advisory Panel (ESAP) Paris, France Johannes P. Pfeifenberger
Ju ly 2 , 2014
| brattle.com 1
Acknowledgements This presentation is based in part on the following reports and presentations:
▀ Pfeifenberger, Newell, Spees, Energy and Capacity Markets: Tradeoffs in Reliability, Costs, and Risks, Harvard Electricity Policy Group, February 27, 2014.
▀ Newell, Spees, Pfeifenberger, Karkatsouli, Wintermantel, and Carden, Estimating the Economically Optimal Reserve Margin in ERCOT, Report prepared for The Public Utility Commission of Texas, The Brattle Group, January 31, 2014.
▀ Pfeifenberger, Spees, Characteristics of Successful Capacity Markets, APEx Conference, October 31, 2013.
▀ Pfeifenberger, Spees, Carden, Wintermantel, Resource Adequacy Requirements: Reliability and Economic Implications, Prepared for the Federal Energy Regulatory Commission (FERC), The Brattle Group, September 2013.
▀ Spees, Newell, Pfeifenberger, Capacity Markets: Lessons Learned from the First Decade, Economics of Energy & Environmental Policy, Vol. 2, No. 2, September 2013.
| brattle.com 2
Content I. Resource Adequacy Requirements
− Definitions and market design options − Relationship to pricing in energy and ancillary service markets − Importance of scarcity pricing
II. Resource Adequacy Study Results − Simulating Reliability, Scarcity Pricing, and Risks of Energy-only
and Capacity Markets
III. Successful Capacity Market Designs
Appendix A: FERC and ERCOT Resource Adequacy Study Results Appendix B: Characteristics of Successful Capacity Markets Appendix C: Additional Reading, About the Author, About Brattle
| brattle.com 3
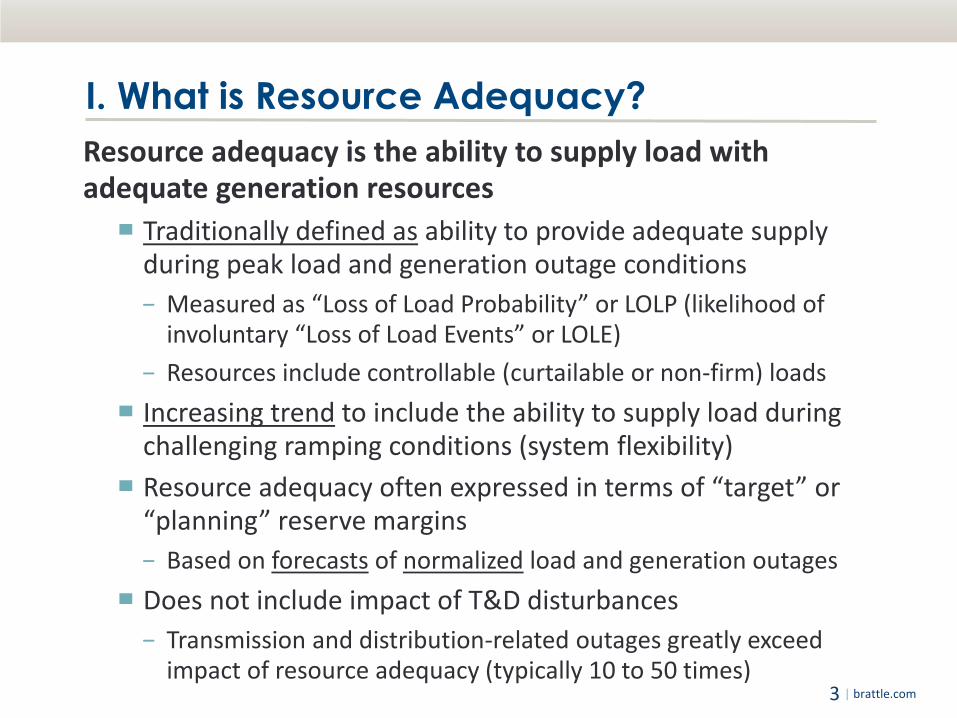
I. What is Resource Adequacy? Resource adequacy is the ability to supply load with adequate generation resources
▀ Traditionally defined as ability to provide adequate supply during peak load and generation outage conditions − Measured as “Loss of Load Probability” or LOLP (likelihood of
involuntary “Loss of Load Events” or LOLE) − Resources include controllable (curtailable or non-firm) loads
▀ Increasing trend to include the ability to supply load during challenging ramping conditions (system flexibility)
▀ Resource adequacy often expressed in terms of “target” or “planning” reserve margins − Based on forecasts of normalized load and generation outages
▀ Does not include impact of T&D disturbances − Transmission and distribution-related outages greatly exceed
impact of resource adequacy (typically 10 to 50 times)
| brattle.com 4
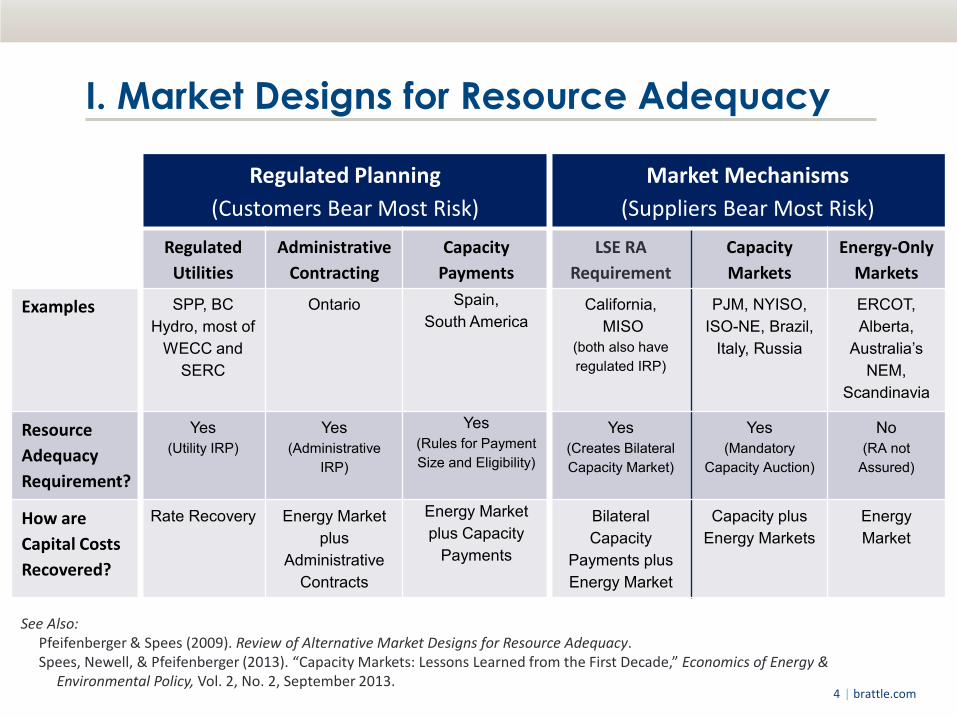
I. Market Designs for Resource Adequacy
See Also: Pfeifenberger & Spees (2009). Review of Alternative Market Designs for Resource Adequacy. Spees, Newell, & Pfeifenberger (2013). “Capacity Markets: Lessons Learned from the First Decade,” Economics of Energy &
Environmental Policy, Vol. 2, No. 2, September 2013.
Regulated Planning (Customers Bear Most Risk)
Market Mechanisms (Suppliers Bear Most Risk)
Regulated Utilities
Administrative Contracting
Capacity Payments
LSE RA Requirement
Capacity Markets
Energy-Only Markets
Examples SPP, BC Hydro, most of
WECC and SERC
Ontario Spain, South America
California, MISO
(both also have regulated IRP)
PJM, NYISO, ISO-NE, Brazil,
Italy, Russia
ERCOT, Alberta,
Australia’s NEM,
Scandinavia
Resource Adequacy Requirement?
Yes (Utility IRP)
Yes (Administrative
IRP)
Yes (Rules for Payment Size and Eligibility)
Yes (Creates Bilateral Capacity Market)
Yes (Mandatory
Capacity Auction)
No (RA not
Assured)
How are Capital Costs Recovered?
Rate Recovery Energy Market plus
Administrative Contracts
Energy Market plus Capacity
Payments
Bilateral Capacity
Payments plus Energy Market
Capacity plus Energy Markets
Energy Market
| brattle.com 5
I. Market Designs for Resource Adequacy The most appropriate market-based design for resource adequacy depends on a region’s policy objectives and risk tolerance:
▀ Energy-Only Market likely most appropriate if: − Economic efficiency is the primary policy objective − Lower reserve margins, higher outage levels, and potential for
periodic scarcity events is sustainable from a public policy perspective
▀ Resource Adequacy Requirement (e.g., implemented with a centralized capacity market) likely most appropriate if: − Maintaining physical resource adequacy standards is the primary
policy concern − Policy makers wish to prevent potential low-reliability, high-cost
events (thereby creating potential long-run benefits through risk-mitigation)
| brattle.com 6
I. Resource Adequacy Requirements Administrative resource-adequacy requirements are generally needed when energy-only markets do not attract adequate investments. Main reasons include:
1. Energy market designs that lead to price suppression
2. Incomplete or poorly-designed ancillary service markets
3. Distortions created by out-of-market payments for some resources that lead to over-supply
4. Challenging investment risks (e.g., in hydro-dominated markets)
5. Resource adequacy preferences (e.g., only 1 loss of load event in 10 years) that are higher than what even fully-efficient energy and ancillary service markets would provide
| brattle.com 7
I. Energy-Market Design Gaps Energy market design gaps often undermine adequate generation investments:
▀ Low price caps and inadequate scarcity pricing ▀ Poor integration of demand-response (DR) resources ▀ Substantial locational differences not reflected in market prices ▀ Absence of liquid and transparent balancing energy markets (e.g.,
5-minute real-time energy markets) ▀ Operational actions (e.g., out-of-market dispatch of emergency
resources) that depress clearing prices
Market design gaps often include incomplete or poorly-designed ancillary service markets
▀ Absence of liquid and transparent markets for ancillary services ▀ Missing ancillary service products (e.g., ramping capability) ▀ Not co-optimized with imbalance energy market ▀ Operational (out-of-market) actions that depress clearing prices
| brattle.com 8
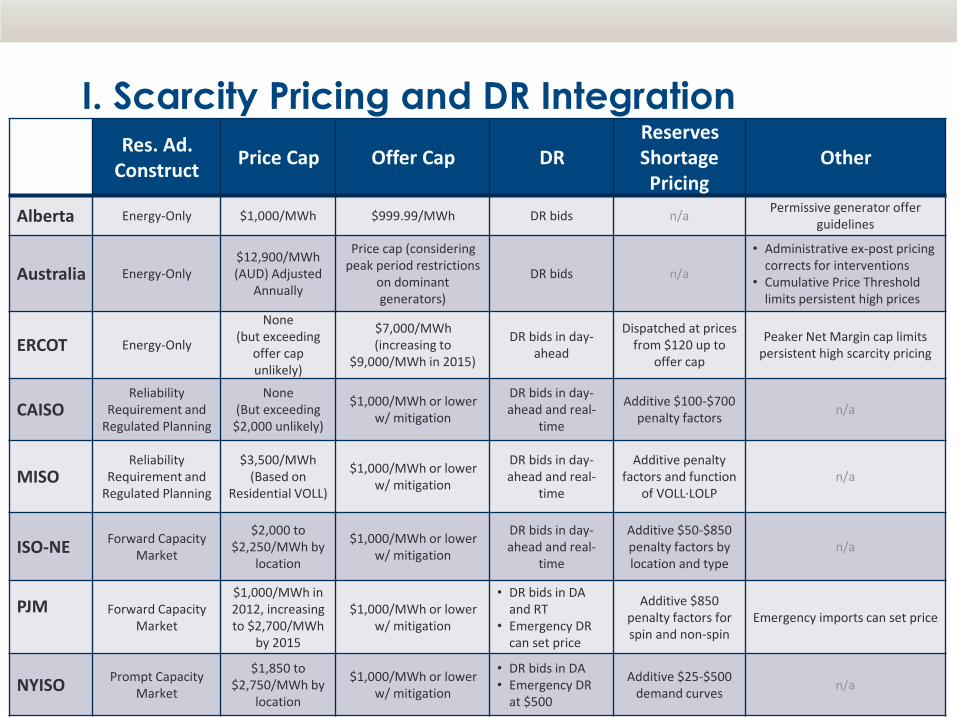
I. Scarcity Pricing and DR Integration Res. Ad.
Construct Price Cap Offer Cap DR Reserves Shortage Pricing
Other
Alberta Energy-Only $1,000/MWh $999.99/MWh DR bids n/a Permissive generator offer guidelines
Australia Energy-Only $12,900/MWh (AUD) Adjusted
Annually
Price cap (considering peak period restrictions
on dominant generators)
DR bids n/a
• Administrative ex-post pricing corrects for interventions
• Cumulative Price Threshold limits persistent high prices
ERCOT Energy-Only
None (but exceeding
offer cap unlikely)
$7,000/MWh (increasing to
$9,000/MWh in 2015)
DR bids in day-ahead
Dispatched at prices from $120 up to
offer cap
Peaker Net Margin cap limits persistent high scarcity pricing
CAISO Reliability
Requirement and Regulated Planning
None (But exceeding
$2,000 unlikely)
$1,000/MWh or lower w/ mitigation
DR bids in day-ahead and real-
time
Additive $100-$700 penalty factors n/a
MISO Reliability
Requirement and Regulated Planning
$3,500/MWh (Based on
Residential VOLL)
$1,000/MWh or lower w/ mitigation
DR bids in day-ahead and real-
time
Additive penalty factors and function
of VOLL∙LOLP n/a
ISO-NE Forward Capacity Market
$2,000 to $2,250/MWh by
location
$1,000/MWh or lower w/ mitigation
DR bids in day-ahead and real-
time
Additive $50-$850 penalty factors by location and type
n/a
PJM
Forward Capacity Market
$1,000/MWh in 2012, increasing to $2,700/MWh
by 2015
$1,000/MWh or lower w/ mitigation
• DR bids in DA and RT
• Emergency DR can set price
Additive $850 penalty factors for spin and non-spin
Emergency imports can set price
NYISO Prompt Capacity Market
$1,850 to $2,750/MWh by
location
$1,000/MWh or lower w/ mitigation
• DR bids in DA • Emergency DR
at $500
Additive $25-$500 demand curves n/a
| brattle.com 9
I. Resource Adequacy Requirements
− Definitions − Relationship to pricing in energy and ancillary service markets − Importance of scarcity pricing
II. Resource Adequacy Study Results − Simulating Reliability, Scarcity Pricing, and Risks of Energy-only
and Capacity Markets
III. Successful Capacity Market Designs
Appendix A: FERC and ERCOT Resource Adequacy Study Results Appendix B: Characteristics of Successful Capacity Markets Appendix C: Additional Reading, About the Author, About Brattle
| brattle.com 10
85%
90%
95%
100%
105%
110%
0 50 100 150 200 250
Peak
Loa
d (%
of 5
0/50
Pea
k)
Hour of Year
2011 Weather
Weather-Normal Year
Weather-Normal Peak Load
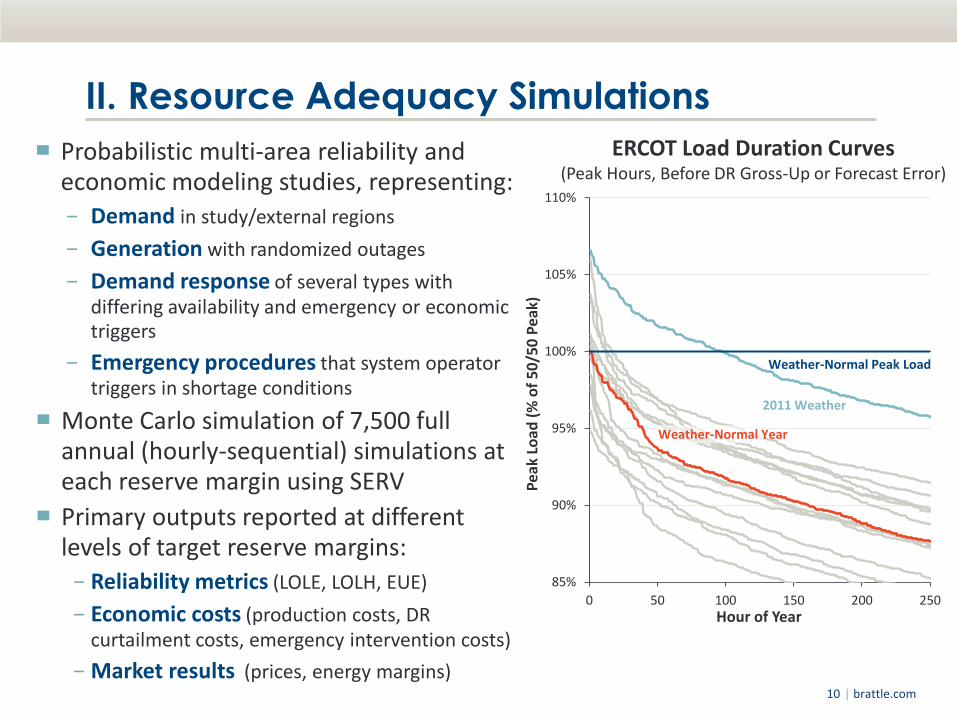
II. Resource Adequacy Simulations
▀ Probabilistic multi-area reliability and economic modeling studies, representing: − Demand in study/external regions − Generation with randomized outages − Demand response of several types with
differing availability and emergency or economic triggers
− Emergency procedures that system operator triggers in shortage conditions
▀ Monte Carlo simulation of 7,500 full annual (hourly-sequential) simulations at each reserve margin using SERV
▀ Primary outputs reported at different levels of target reserve margins: − Reliability metrics (LOLE, LOLH, EUE) − Economic costs (production costs, DR
curtailment costs, emergency intervention costs) − Market results (prices, energy margins)
ERCOT Load Duration Curves (Peak Hours, Before DR Gross-Up or Forecast Error)
| brattle.com 11
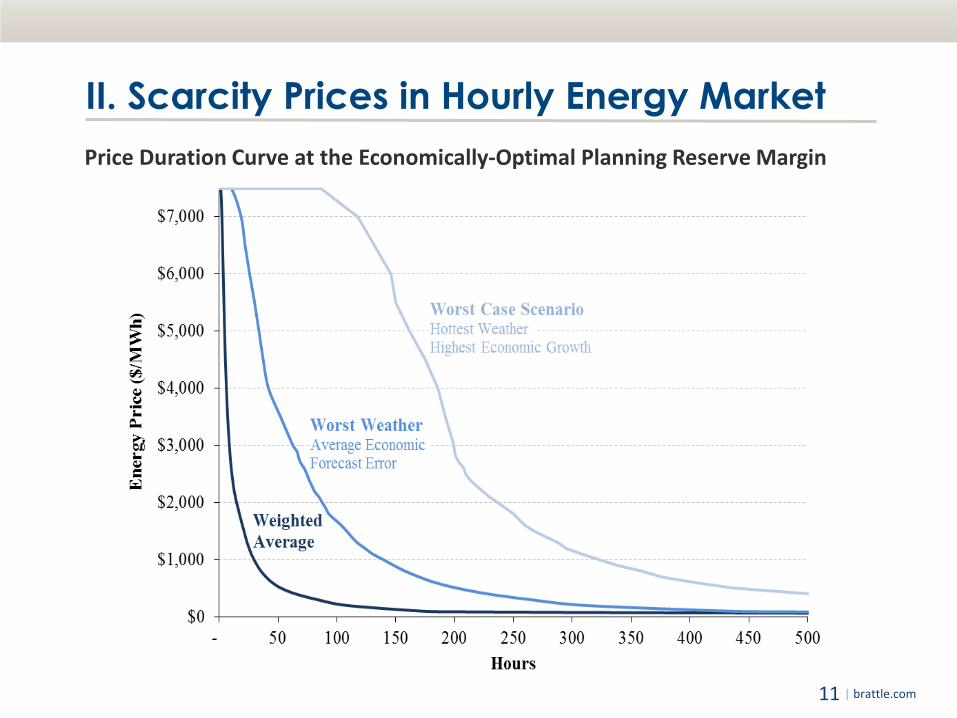
II. Scarcity Prices in Hourly Energy Market Price Duration Curve at the Economically-Optimal Planning Reserve Margin
| brattle.com 12
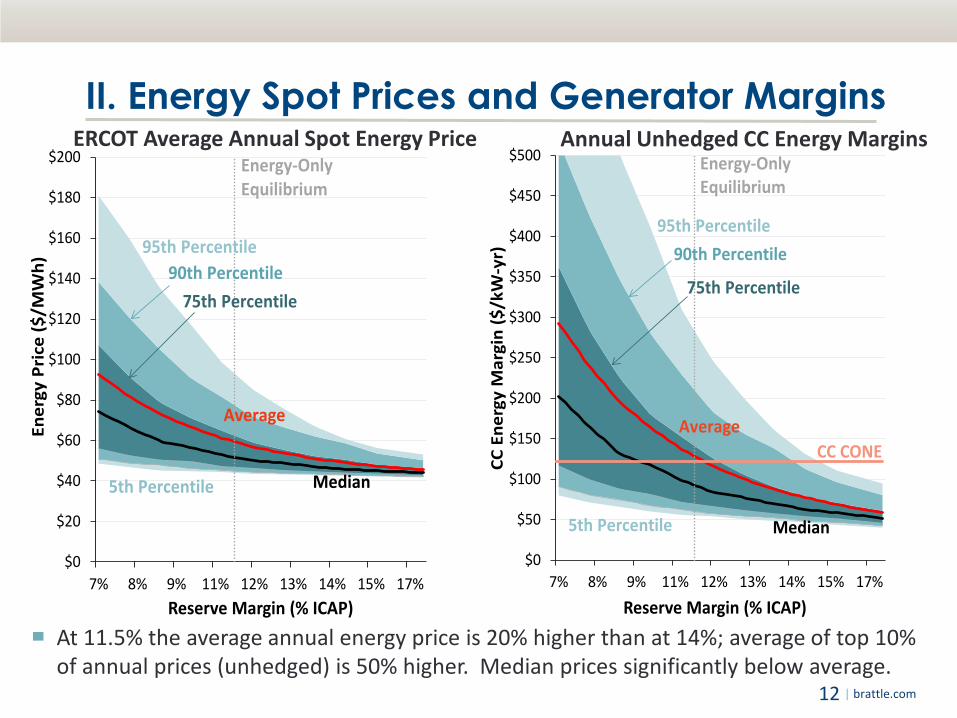
II. Energy Spot Prices and Generator Margins
$0
$20
$40
$60
$80
$100
$120
$140
$160
$180
$200
7% 8% 9% 11% 12% 13% 14% 15% 17%
Ener
gy P
rice
($/M
Wh)
Reserve Margin (% ICAP)
Average
Median
95th Percentile
75th Percentile90th Percentile
5th Percentile
Energy-Only Equilibrium
$0
$50
$100
$150
$200
$250
$300
$350
$400
$450
$500
7% 8% 9% 11% 12% 13% 14% 15% 17%
CC E
nerg
y M
argi
n ($
/kW
-yr)
Reserve Margin (% ICAP)
CC CONEAverage
Median
95th Percentile
75th Percentile
90th Percentile
5th Percentile
Energy-Only Equilibrium
ERCOT Average Annual Spot Energy Price Annual Unhedged CC Energy Margins
▀ At 11.5% the average annual energy price is 20% higher than at 14%; average of top 10% of annual prices (unhedged) is 50% higher. Median prices significantly below average.
| brattle.com 13
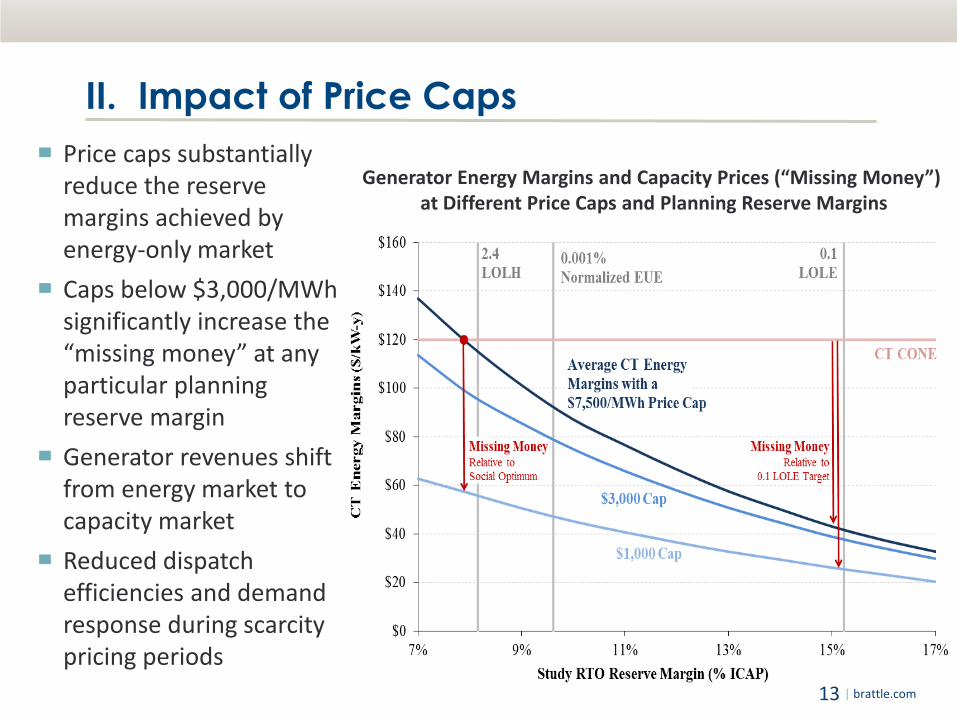
II. Impact of Price Caps
Generator Energy Margins and Capacity Prices (“Missing Money”) at Different Price Caps and Planning Reserve Margins
▀ Price caps substantially reduce the reserve margins achieved by energy-only market
▀ Caps below $3,000/MWh significantly increase the “missing money” at any particular planning reserve margin
▀ Generator revenues shift from energy market to capacity market
▀ Reduced dispatch efficiencies and demand response during scarcity pricing periods
| brattle.com 14
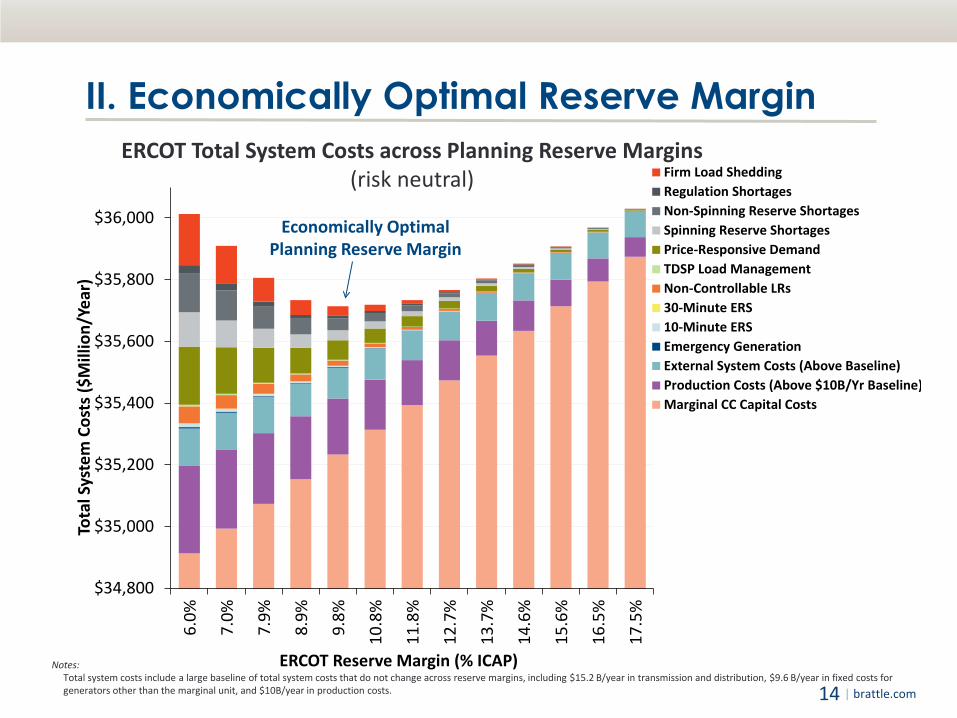
II. Economically Optimal Reserve Margin
$34,800
$35,000
$35,200
$35,400
$35,600
$35,800
$36,0006.
0%
7.0%
7.9%
8.9%
9.8%
10.8
%
11.8
%
12.7
%
13.7
%
14.6
%
15.6
%
16.5
%
17.5
%
Tota
l Sys
tem
Cos
ts ($
Mill
ion/
Year
)
ERCOT Reserve Margin (% ICAP)
Firm Load SheddingRegulation ShortagesNon-Spinning Reserve ShortagesSpinning Reserve ShortagesPrice-Responsive DemandTDSP Load ManagementNon-Controllable LRs30-Minute ERS10-Minute ERSEmergency GenerationExternal System Costs (Above Baseline)Production Costs (Above $10B/Yr Baseline)Marginal CC Capital Costs
Economically Optimal Planning Reserve Margin
ERCOT Total System Costs across Planning Reserve Margins (risk neutral)
Notes: Total system costs include a large baseline of total system costs that do not change across reserve margins, including $15.2 B/year in transmission and distribution, $9.6 B/year in fixed costs for
generators other than the marginal unit, and $10B/year in production costs.
| brattle.com 15
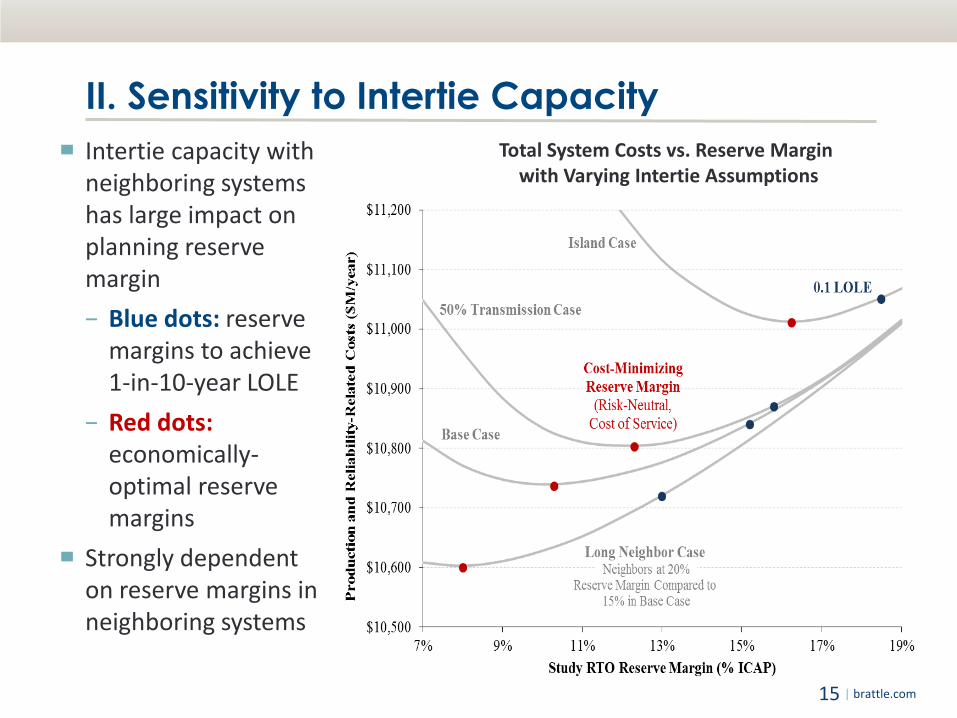
II. Sensitivity to Intertie Capacity Total System Costs vs. Reserve Margin
with Varying Intertie Assumptions ▀ Intertie capacity with
neighboring systems has large impact on planning reserve margin − Blue dots: reserve
margins to achieve 1-in-10-year LOLE
− Red dots: economically-optimal reserve margins
▀ Strongly dependent on reserve margins in neighboring systems
| brattle.com 16
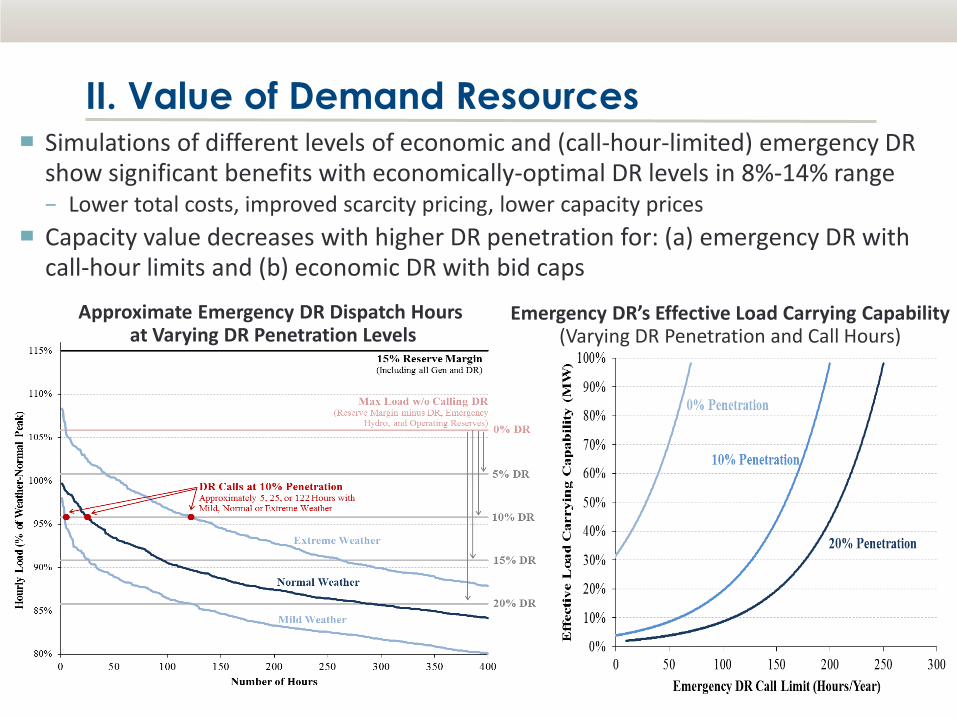
II. Value of Demand Resources ▀ Simulations of different levels of economic and (call-hour-limited) emergency DR
show significant benefits with economically-optimal DR levels in 8%-14% range − Lower total costs, improved scarcity pricing, lower capacity prices
▀ Capacity value decreases with higher DR penetration for: (a) emergency DR with call-hour limits and (b) economic DR with bid caps
Emergency DR’s Effective Load Carrying Capability (Varying DR Penetration and Call Hours)
Approximate Emergency DR Dispatch Hours at Varying DR Penetration Levels
| brattle.com 17
$0
$20
$40
$60
$80
$100
$120
$140
7% 9% 11% 13% 15% 17%
Equi
libri
um C
apac
ity
Pric
e ($
/kW
-y)
Reserve Margin (% ICAP)
CC CONE
0.1LOLE
Base Case Optimal RM
CC EnergyMargins
Equilibrium Capacity Price Net CONE = CONE - Energy Margins
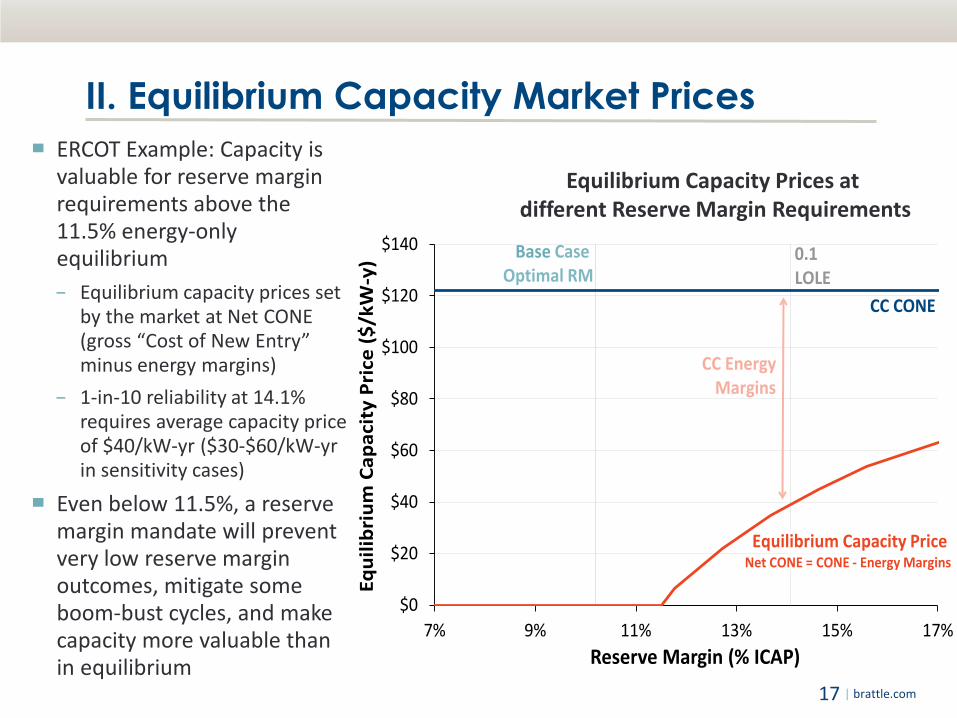
II. Equilibrium Capacity Market Prices ▀ ERCOT Example: Capacity is
valuable for reserve margin requirements above the 11.5% energy-only equilibrium − Equilibrium capacity prices set
by the market at Net CONE (gross “Cost of New Entry” minus energy margins)
− 1-in-10 reliability at 14.1% requires average capacity price of $40/kW-yr ($30-$60/kW-yr in sensitivity cases)
▀ Even below 11.5%, a reserve margin mandate will prevent very low reserve margin outcomes, mitigate some boom-bust cycles, and make capacity more valuable than in equilibrium
Equilibrium Capacity Prices at different Reserve Margin Requirements
| brattle.com 18
I. Resource Adequacy Requirements
− Definitions − Relationship to pricing in energy and ancillary service markets − Importance of scarcity pricing
II. Resource Adequacy Study Results − Simulating Reliability, Scarcity Pricing, and Risks of Energy-only
and Capacity Markets
III. Successful Capacity Market Designs
Appendix A: FERC and ERCOT Resource Adequacy Study Results Appendix B: Characteristics of Successful Capacity Markets Appendix C: Additional Reading, About the Author, About Brattle
| brattle.com 19
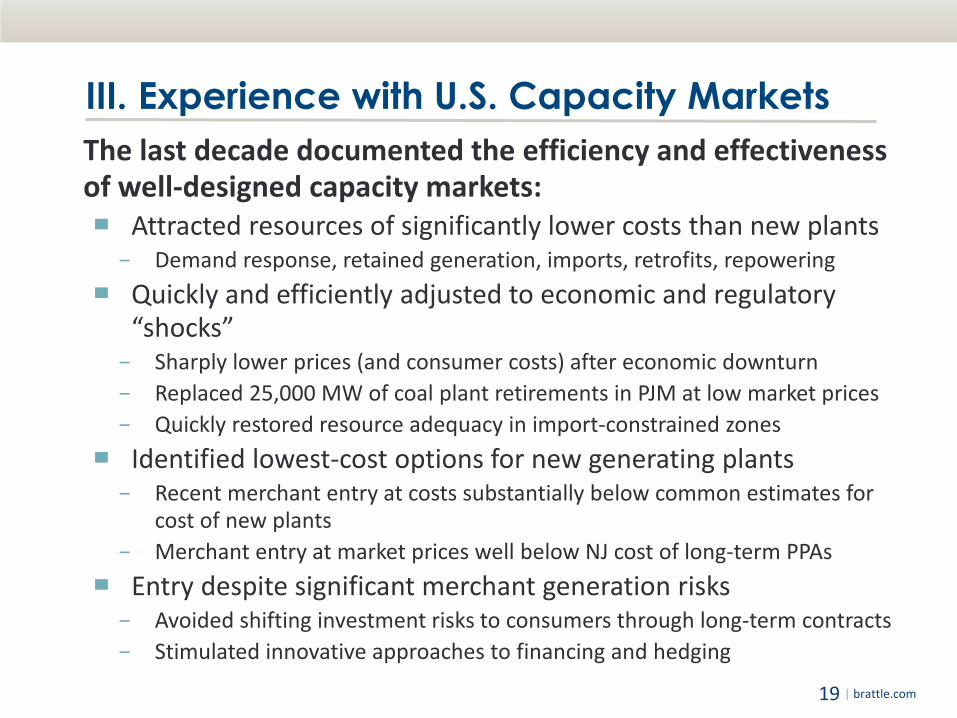
III. Experience with U.S. Capacity Markets The last decade documented the efficiency and effectiveness of well-designed capacity markets: ▀ Attracted resources of significantly lower costs than new plants
− Demand response, retained generation, imports, retrofits, repowering ▀ Quickly and efficiently adjusted to economic and regulatory
“shocks” − Sharply lower prices (and consumer costs) after economic downturn − Replaced 25,000 MW of coal plant retirements in PJM at low market prices − Quickly restored resource adequacy in import-constrained zones
▀ Identified lowest-cost options for new generating plants − Recent merchant entry at costs substantially below common estimates for
cost of new plants − Merchant entry at market prices well below NJ cost of long-term PPAs
▀ Entry despite significant merchant generation risks − Avoided shifting investment risks to consumers through long-term contracts − Stimulated innovative approaches to financing and hedging
| brattle.com 20
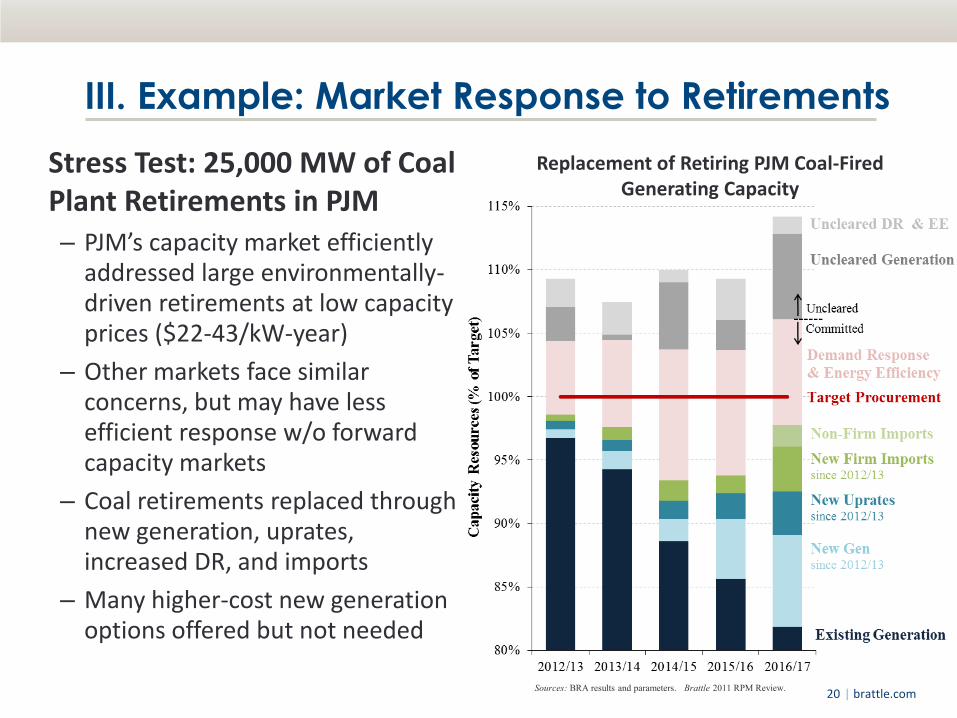
III. Example: Market Response to Retirements
Stress Test: 25,000 MW of Coal Plant Retirements in PJM – PJM’s capacity market efficiently
addressed large environmentally-driven retirements at low capacity prices ($22-43/kW-year)
– Other markets face similar concerns, but may have less efficient response w/o forward capacity markets
– Coal retirements replaced through new generation, uprates, increased DR, and imports
– Many higher-cost new generation options offered but not needed
Replacement of Retiring PJM Coal-Fired Generating Capacity
Sources: BRA results and parameters. Brattle 2011 RPM Review.
| brattle.com 21
III. Designing Successful Capacity Markets Market-based mechanisms for resource adequacy offer unique efficiency and innovation advantages, reducing out-of market costs imposed on consumers But don’t prematurely add capacity markets… ▀ …that explicitly or inadvertently:
− discriminate between existing and new resources − exclude participation by demand-side and renewable resources − ignore locational constraints and transmission interties
▀ …just to add revenues for certain resources or to address a perceived lack of long-term contracting
▀ …while also providing out-of-market payments (including long-term contracts) to some resources that oversupply the market and distort both short- and long-term investment signals
▀ …without understanding and addressing deficiencies in energy and ancillary service markets
| brattle.com 22
III. Designing Successful Capacity Markets Experience from the last decade strongly suggests that successful capacity markets require:
1. Well-defined resource adequacy objectives and drivers 2. Clear understanding why market design is deficient without capacity
market (inefficient or not able to achieve resource adequacy targets) 3. Clearly-defined capacity products, consistent with needs 4. Well-defined obligations, auctions, verifications, and monitoring 5. Efficient spot markets for energy and ancillary services 6. Addressing locational reliability challenges 7. Participation from all resource types (incl. DR, renewables, imports) 8. Carefully-designed forward obligations 9. Staying power to reduce regulatory risk while improving designs and
addressing deficiencies 10. Capitalizing and building on experience from other markets

Appendix A: FERC and ERCOT Resource Adequacy
Study Results
| brattle.com 24
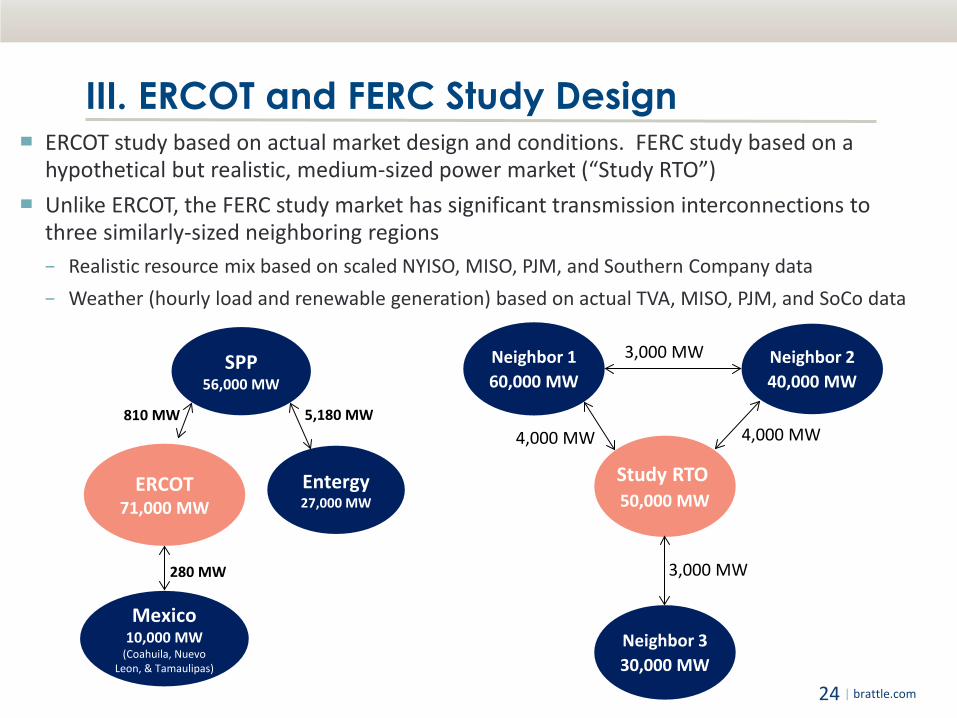
III. ERCOT and FERC Study Design ▀ ERCOT study based on actual market design and conditions. FERC study based on a
hypothetical but realistic, medium-sized power market (“Study RTO”) ▀ Unlike ERCOT, the FERC study market has significant transmission interconnections to
three similarly-sized neighboring regions − Realistic resource mix based on scaled NYISO, MISO, PJM, and Southern Company data − Weather (hourly load and renewable generation) based on actual TVA, MISO, PJM, and SoCo data
Study RTO 50,000 MW
Neighbor 3 30,000 MW
Neighbor 1 60,000 MW
Neighbor 2 40,000 MW
4,000 MW 4,000 MW
3,000 MW
3,000 MW
810 MW
280 MW
Mexico 10,000 MW
(Coahuila, Nuevo Leon, & Tamaulipas)
ERCOT 71,000 MW
5,180 MW
Entergy 27,000 MW
SPP 56,000 MW
| brattle.com 25
Summary of ERCOT Study ▀ The PUCT asked us to estimate the economically-optimal reserve margin in
ERCOT to inform their ongoing review of market design for resource adequacy.
▀ Under base case assumptions, we estimate reserve margins of: − 10.2% economic optimum − 11.5% in equilibrium of current energy market design (minimizes customer
cost) − 14.1% required to meet 1-in-10 reliability standard
▀ Enforcing a 1-in-10 reserve margin requirement at 14.1% (with or without a centralized capacity market) would increase long-run average customer costs by approximately 1% of retail rates relative to the 11.5% energy-only market in equilibrium : − Considered only energy and capacity price impacts − Potential additional benefits: risk mitigation, DR integration − Potential additional costs: implementation, added complexity, disputes
| brattle.com 26
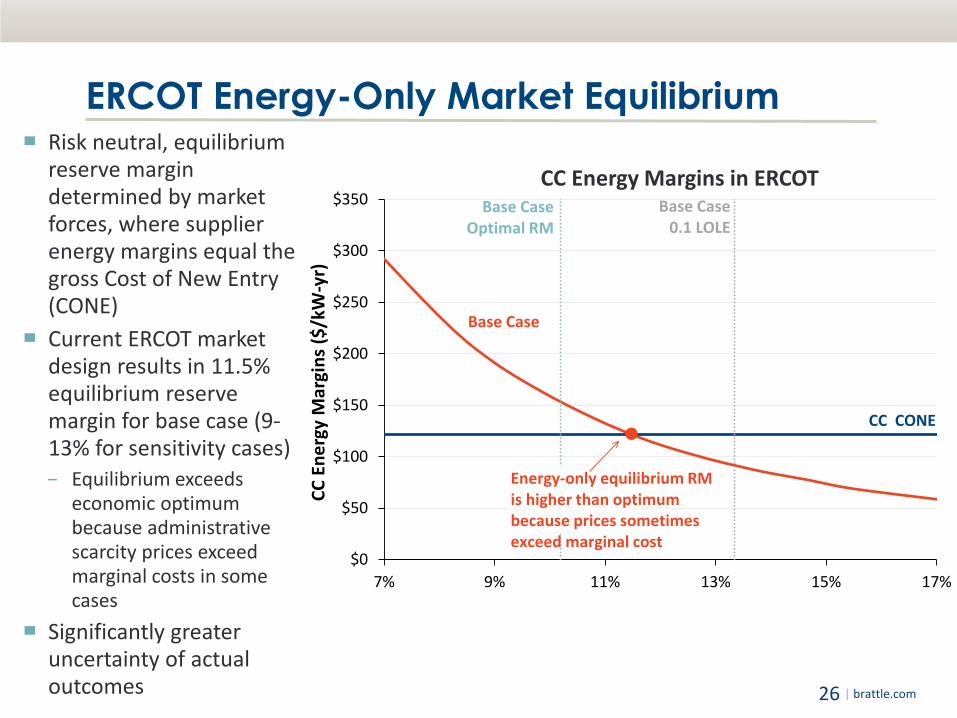
ERCOT Energy-Only Market Equilibrium ▀ Risk neutral, equilibrium
reserve margin determined by market forces, where supplier energy margins equal the gross Cost of New Entry (CONE)
▀ Current ERCOT market design results in 11.5% equilibrium reserve margin for base case (9-13% for sensitivity cases) − Equilibrium exceeds
economic optimum because administrative scarcity prices exceed marginal costs in some cases
▀ Significantly greater uncertainty of actual outcomes
$0
$50
$100
$150
$200
$250
$300
$350
7% 9% 11% 13% 15% 17%
CC E
nerg
y M
argi
ns ($
/kW
-yr)
CC CONE
Base Case
Base CaseOptimal RM
Base Case0.1 LOLE
Energy-only equilibrium RM is higher than optimumbecause prices sometimes exceed marginal cost
CC Energy Margins in ERCOT
| brattle.com 27
ERCOT Study: Supplier Net Revenues
$0
$100
$200
$300
$400
$500
$600
$700
$800
7.9% 8.9% 9.8% 10.8% 11.8% 12.7% 13.7% 14.6% 15.6% 17.5%
Supp
lier N
et R
even
ues (
$/kW
-y)
Reserve Margin (ICAP %)
Capacity PaymentsLong-Run CapacityPrice Needed to Sustain Reserve MarginEnergy Margins
CC CONE
Top 10% of Years Unhedged
Top 10% of Years 80% Hedged
Infeasible EquilibriaSupplier Net Revenues
Exceed Investment Costs
Increasing Capacity PaymentsAssociated with Progressively Higher Administratively -Set Reserve Margins
Energy-Only Equilibrium 11.5% RM
Annual Supplier Net Revenues On Average and in the Top 10% of Years
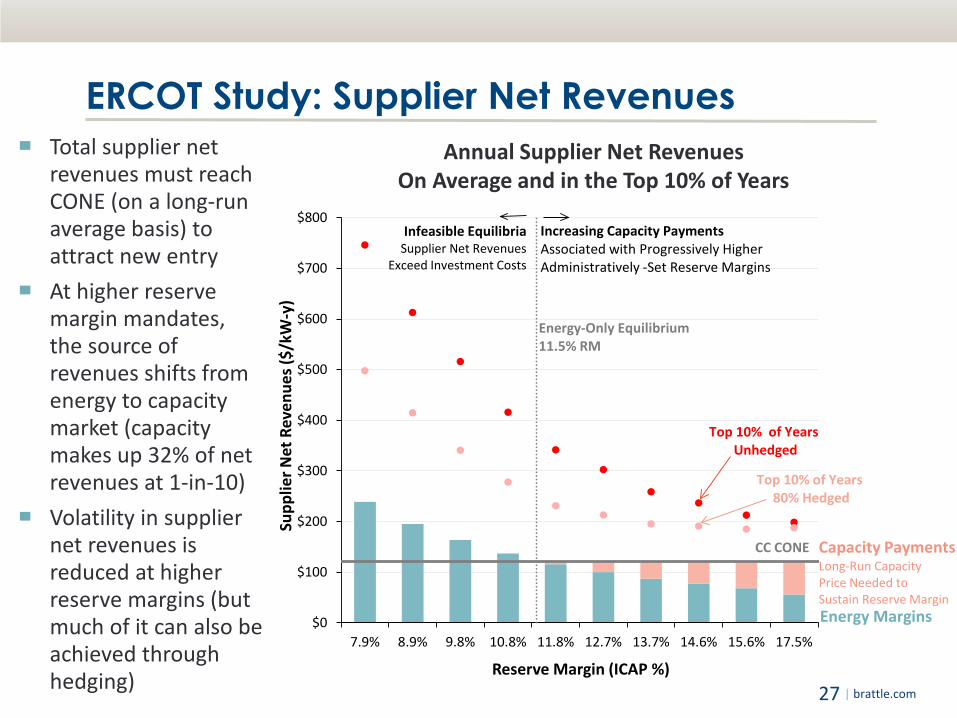
▀ Total supplier net revenues must reach CONE (on a long-run average basis) to attract new entry
▀ At higher reserve margin mandates, the source of revenues shifts from energy to capacity market (capacity makes up 32% of net revenues at 1-in-10)
▀ Volatility in supplier net revenues is reduced at higher reserve margins (but much of it can also be achieved through hedging)
| brattle.com 28
ERCOT Study: Total Customer Costs Total Annual Customer Costs
On Average and in the Top 10% of Years
0¢
5¢
10¢
15¢
20¢
25¢
7.9% 8.9% 9.8% 10.8% 11.8% 12.7% 13.7% 14.6% 15.6% 17.5%
Cust
omer
Cos
ts (¢
/kW
h)
Reserve Margin (ICAP %)
Transmission and Distribution
Capacity
Energy
Top 10% of YearsUnhedged
Top 10% of Years80% Hedged
Energy-Only Equilibrium 11.5% RM
Increasing Capacity PaymentsAssociated with Progressively Higher Administratively-Set Reserve Margins
Infeasible EquilibriaSupplier Net Revenues
Exceed Investment Costs
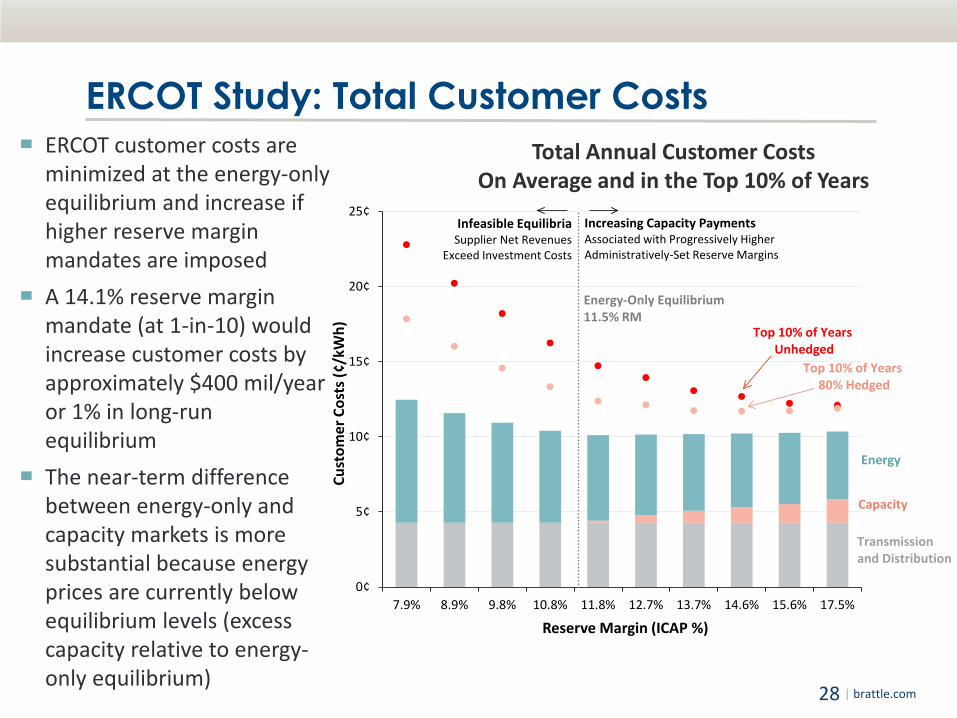
▀ ERCOT customer costs are minimized at the energy-only equilibrium and increase if higher reserve margin mandates are imposed
▀ A 14.1% reserve margin mandate (at 1-in-10) would increase customer costs by approximately $400 mil/year or 1% in long-run equilibrium
▀ The near-term difference between energy-only and capacity markets is more substantial because energy prices are currently below equilibrium levels (excess capacity relative to energy-only equilibrium)
| brattle.com 29
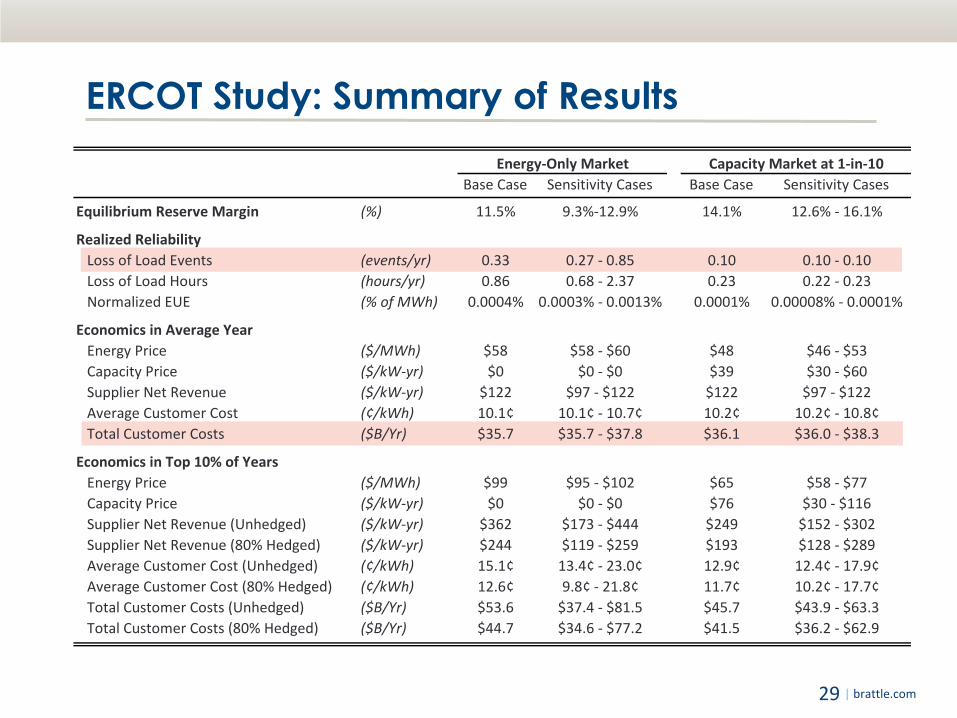
ERCOT Study: Summary of Results Energy-Only Market Capacity Market at 1-in-10
Base Case Sensitivity Cases Base Case Sensitivity Cases
Equilibrium Reserve Margin (%) 11.5% 9.3%-12.9% 14.1% 12.6% - 16.1%
Realized ReliabilityLoss of Load Events (events/yr) 0.33 0.27 - 0.85 0.10 0.10 - 0.10Loss of Load Hours (hours/yr) 0.86 0.68 - 2.37 0.23 0.22 - 0.23Normalized EUE (% of MWh) 0.0004% 0.0003% - 0.0013% 0.0001% 0.00008% - 0.0001%
Economics in Average YearEnergy Price ($/MWh) $58 $58 - $60 $48 $46 - $53Capacity Price ($/kW-yr) $0 $0 - $0 $39 $30 - $60Supplier Net Revenue ($/kW-yr) $122 $97 - $122 $122 $97 - $122Average Customer Cost (¢/kWh) 10.1¢ 10.1¢ - 10.7¢ 10.2¢ 10.2¢ - 10.8¢Total Customer Costs ($B/Yr) $35.7 $35.7 - $37.8 $36.1 $36.0 - $38.3
Economics in Top 10% of YearsEnergy Price ($/MWh) $99 $95 - $102 $65 $58 - $77Capacity Price ($/kW-yr) $0 $0 - $0 $76 $30 - $116Supplier Net Revenue (Unhedged) ($/kW-yr) $362 $173 - $444 $249 $152 - $302Supplier Net Revenue (80% Hedged) ($/kW-yr) $244 $119 - $259 $193 $128 - $289Average Customer Cost (Unhedged) (¢/kWh) 15.1¢ 13.4¢ - 23.0¢ 12.9¢ 12.4¢ - 17.9¢Average Customer Cost (80% Hedged) (¢/kWh) 12.6¢ 9.8¢ - 21.8¢ 11.7¢ 10.2¢ - 17.7¢Total Customer Costs (Unhedged) ($B/Yr) $53.6 $37.4 - $81.5 $45.7 $43.9 - $63.3Total Customer Costs (80% Hedged) ($B/Yr) $44.7 $34.6 - $77.2 $41.5 $36.2 - $62.9
| brattle.com 30
Summary of FERC Study ▀ Scope of September 2013 Study (released by FERC in Feb 2014):
− Assessed economic/reliability implications of different resource adequacy standards. − Examine the widely-used one-day-in-ten-years (1-in-10) loss of load standard and
compare it to alternative approaches to defining resource adequacy − Evaluate the implications of different resource adequacy standards from a customer
cost, societal cost, risk mitigation, market structure, and market design perspective. ▀ Documented wide differences in application of 1-in-10 standard
− 0.1 loss of load events (LOLE) per year interpretation is most widely used − 2.4 loss of load hours (LOLH) per year, economic reserve margins, and normalized
expected unserved energy (EUE) also applied ▀ Even different applications of 0.1 LOLE standard and calculation of reserve
margin have up to 5 percentage point impact on planning reserve margin − Different definition of “event” (e.g., load shed vs. operating reserve depletion) − Reserve margin based on name plate or de-rated capacity (e.g. for renewables) − Different treatment of intertie benefits, load growth uncertainty, etc.
▀ More explicit recognition of these wide difference would provide much-needed flexibility in market design for resource adequacy and flexibility needs
| brattle.com 31
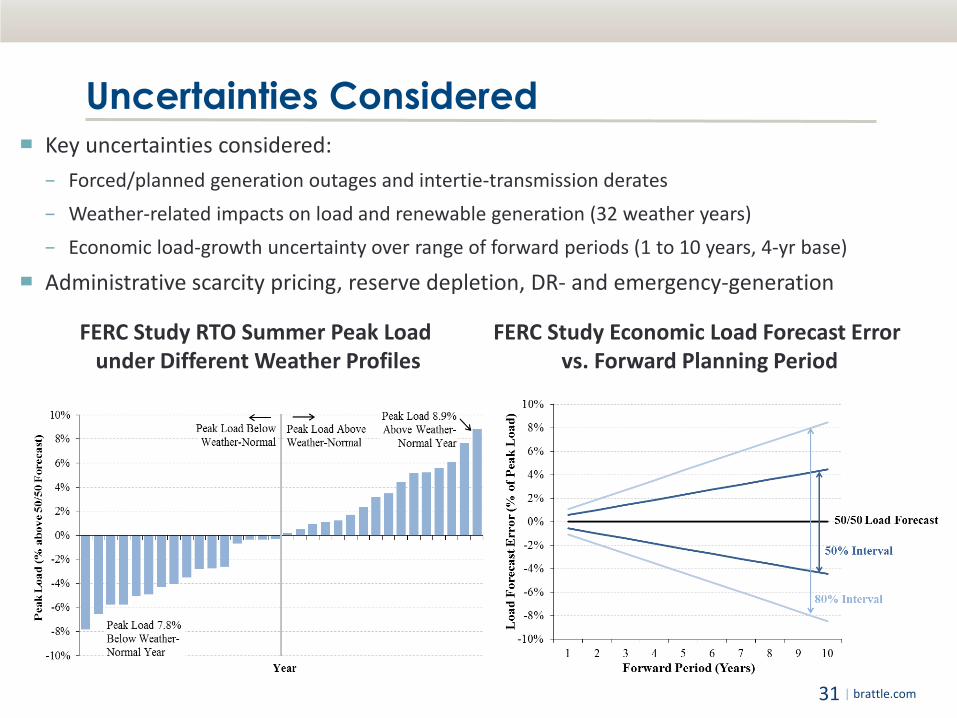
Uncertainties Considered
FERC Study Economic Load Forecast Error vs. Forward Planning Period
▀ Key uncertainties considered: − Forced/planned generation outages and intertie-transmission derates − Weather-related impacts on load and renewable generation (32 weather years) − Economic load-growth uncertainty over range of forward periods (1 to 10 years, 4-yr base)
▀ Administrative scarcity pricing, reserve depletion, DR- and emergency-generation
FERC Study RTO Summer Peak Load under Different Weather Profiles
| brattle.com 32
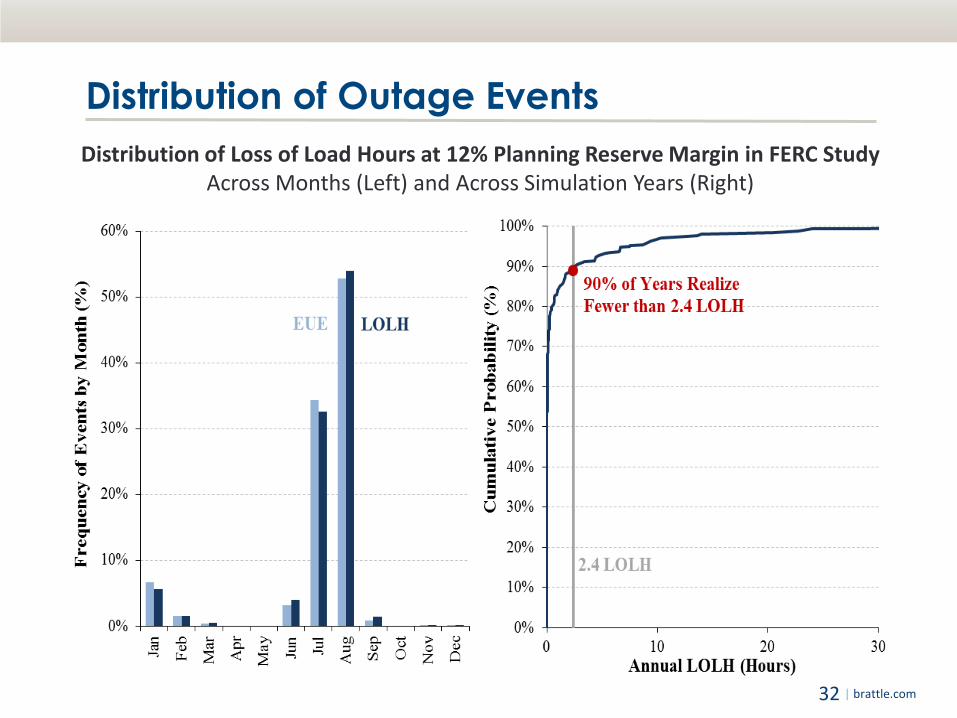
Distribution of Outage Events Distribution of Loss of Load Hours at 12% Planning Reserve Margin in FERC Study
Across Months (Left) and Across Simulation Years (Right)
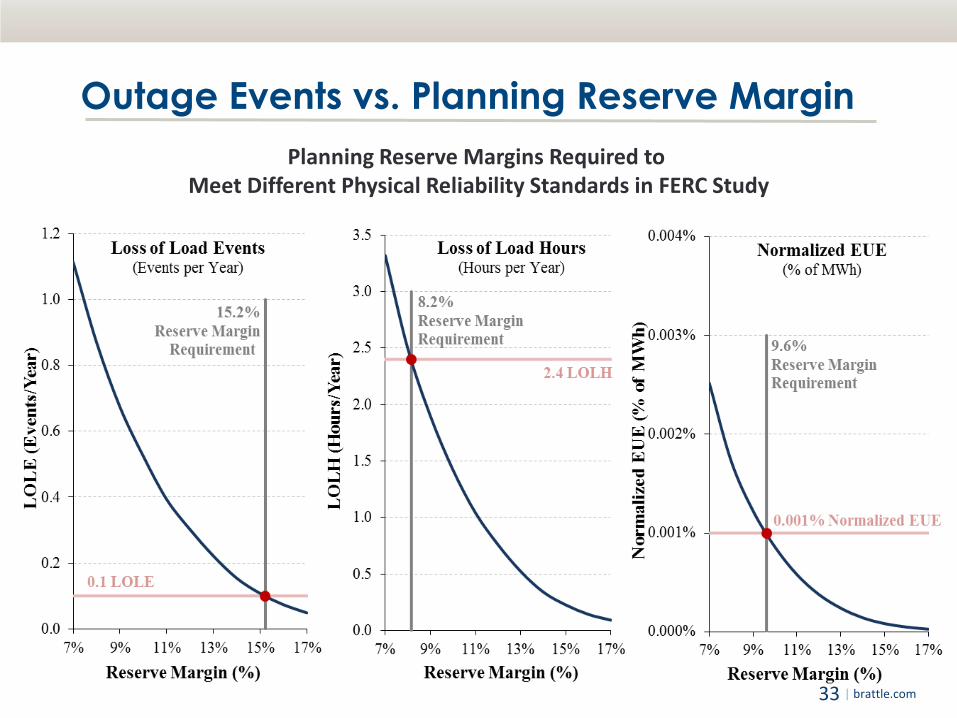
| brattle.com 33
Outage Events vs. Planning Reserve Margin Planning Reserve Margins Required to
Meet Different Physical Reliability Standards in FERC Study
| brattle.com 34
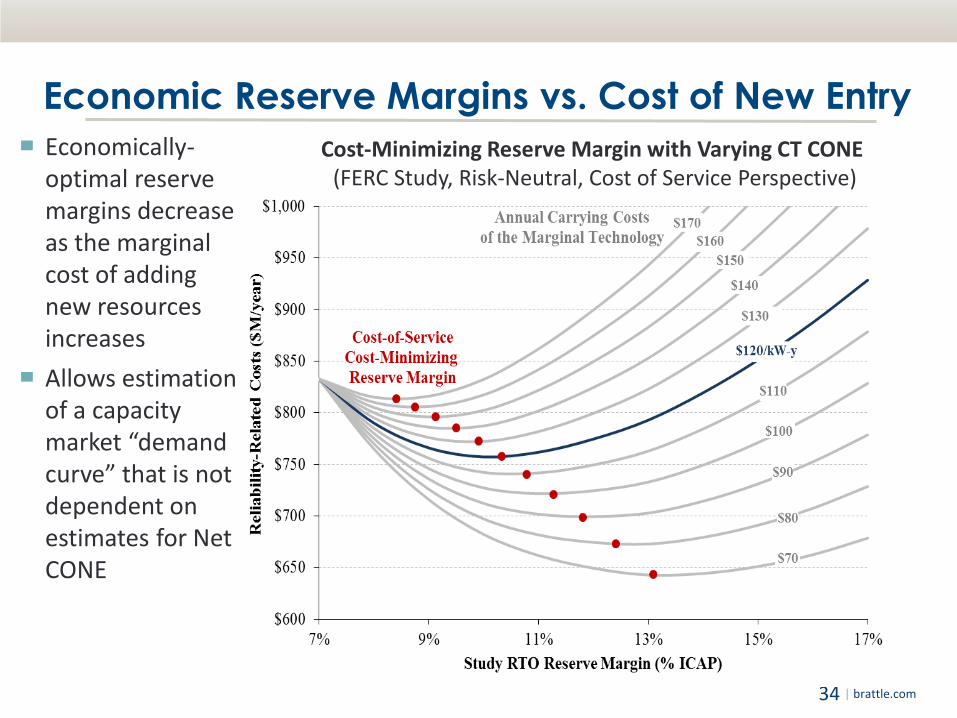
Economic Reserve Margins vs. Cost of New Entry Cost-Minimizing Reserve Margin with Varying CT CONE
(FERC Study, Risk-Neutral, Cost of Service Perspective) ▀ Economically-
optimal reserve margins decrease as the marginal cost of adding new resources increases
▀ Allows estimation of a capacity market “demand curve” that is not dependent on estimates for Net CONE
| brattle.com 35
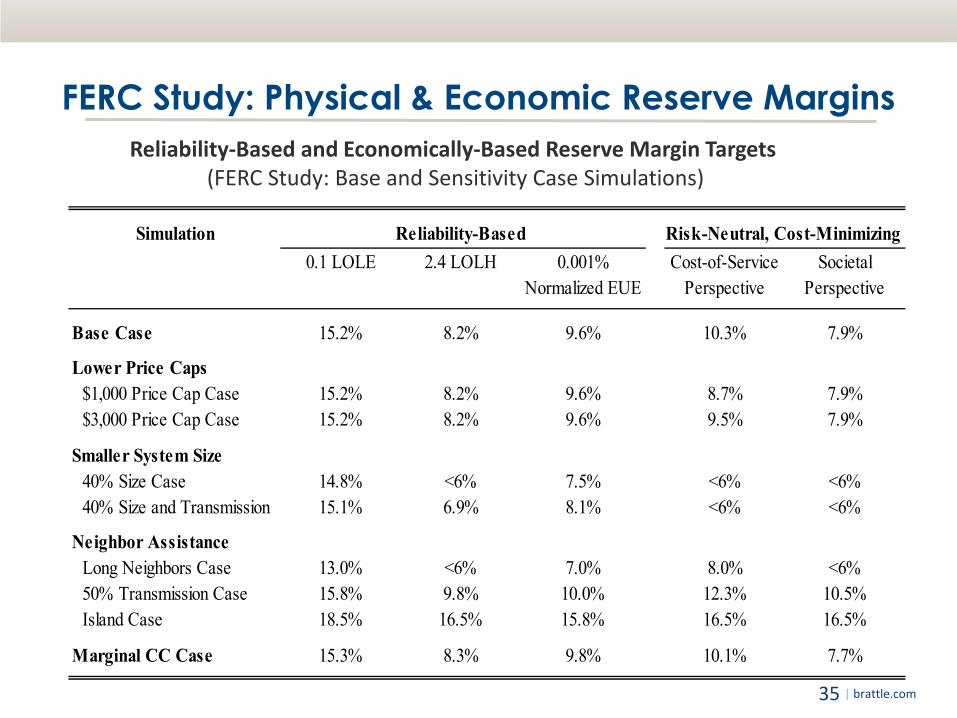
FERC Study: Physical & Economic Reserve Margins Reliability-Based and Economically-Based Reserve Margin Targets
(FERC Study: Base and Sensitivity Case Simulations)
Simulation Reliability-Based Risk-Neutral, Cost-Minimizing 0.1 LOLE 2.4 LOLH 0.001%
Normalized EUECost-of-Service
PerspectiveSocietal
Perspective
Base Case 15.2% 8.2% 9.6% 10.3% 7.9%
Lower Price Caps$1,000 Price Cap Case 15.2% 8.2% 9.6% 8.7% 7.9%$3,000 Price Cap Case 15.2% 8.2% 9.6% 9.5% 7.9%
Smaller System Size40% Size Case 14.8% <6% 7.5% <6% <6%40% Size and Transmission 15.1% 6.9% 8.1% <6% <6%
Neighbor AssistanceLong Neighbors Case 13.0% <6% 7.0% 8.0% <6%50% Transmission Case 15.8% 9.8% 10.0% 12.3% 10.5%Island Case 18.5% 16.5% 15.8% 16.5% 16.5%
Marginal CC Case 15.3% 8.3% 9.8% 10.1% 7.7%
| brattle.com 36
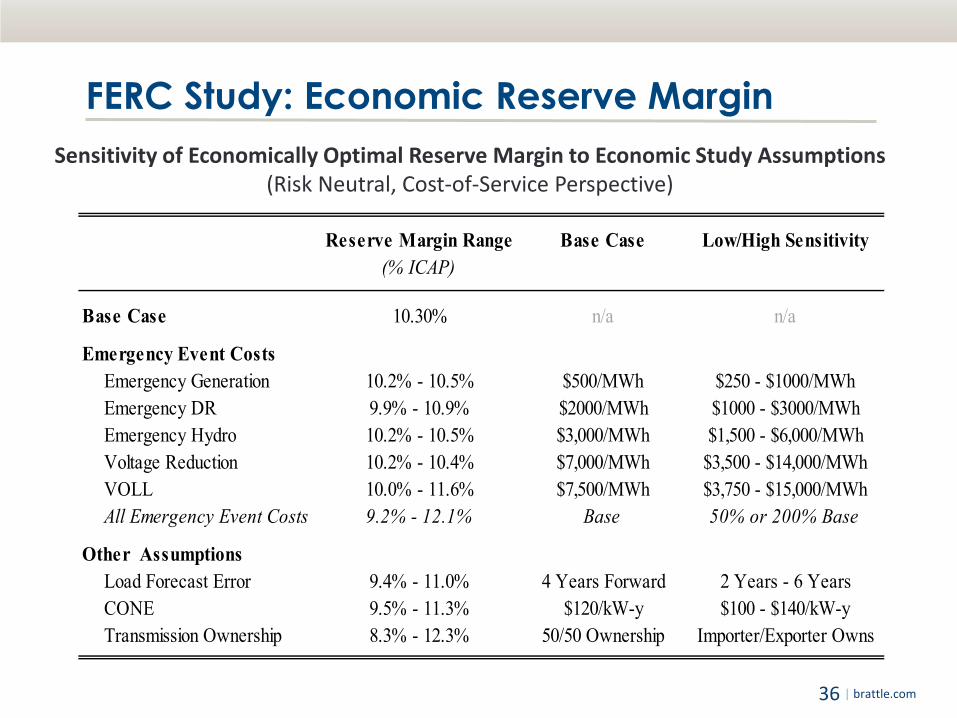
FERC Study: Economic Reserve Margin Sensitivity of Economically Optimal Reserve Margin to Economic Study Assumptions
(Risk Neutral, Cost-of-Service Perspective)
Reserve Margin Range Base Case Low/High Sensitivity(% ICAP)
Base Case 10.30% n/a n/a
Emergency Event CostsEmergency Generation 10.2% - 10.5% $500/MWh $250 - $1000/MWhEmergency DR 9.9% - 10.9% $2000/MWh $1000 - $3000/MWhEmergency Hydro 10.2% - 10.5% $3,000/MWh $1,500 - $6,000/MWhVoltage Reduction 10.2% - 10.4% $7,000/MWh $3,500 - $14,000/MWhVOLL 10.0% - 11.6% $7,500/MWh $3,750 - $15,000/MWhAll Emergency Event Costs 9.2% - 12.1% Base 50% or 200% Base
Other AssumptionsLoad Forecast Error 9.4% - 11.0% 4 Years Forward 2 Years - 6 YearsCONE 9.5% - 11.3% $120/kW-y $100 - $140/kW-yTransmission Ownership 8.3% - 12.3% 50/50 Ownership Importer/Exporter Owns
| brattle.com 37
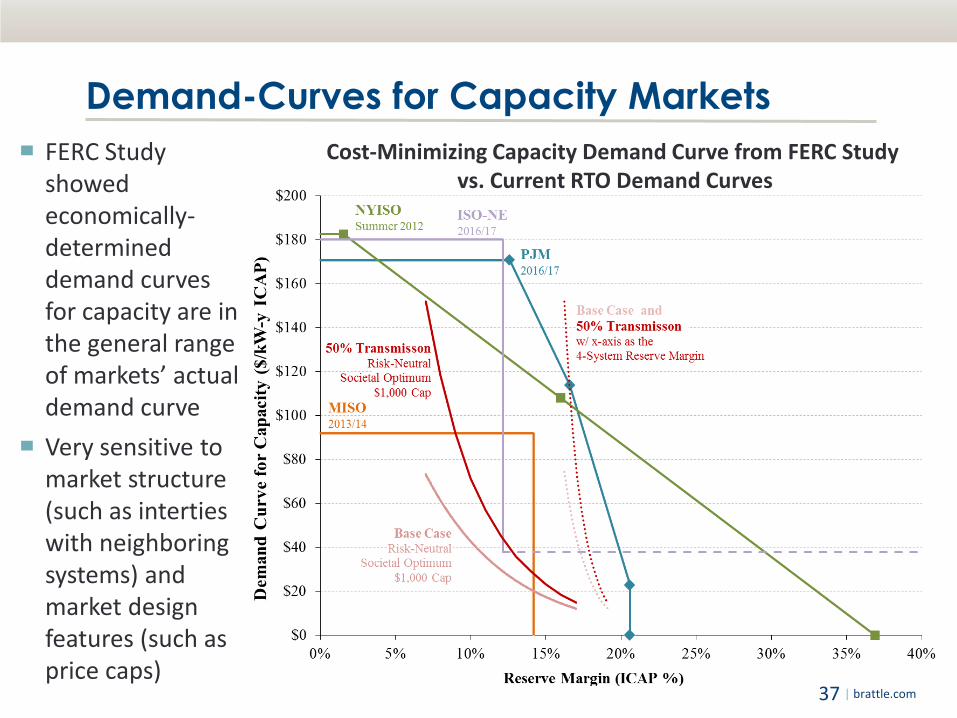
Demand-Curves for Capacity Markets Cost-Minimizing Capacity Demand Curve from FERC Study
vs. Current RTO Demand Curves ▀ FERC Study
showed economically-determined demand curves for capacity are in the general range of markets’ actual demand curve
▀ Very sensitive to market structure (such as interties with neighboring systems) and market design features (such as price caps)

Appendix B: Characteristics of Successful Capacity Markets
| brattle.com 39
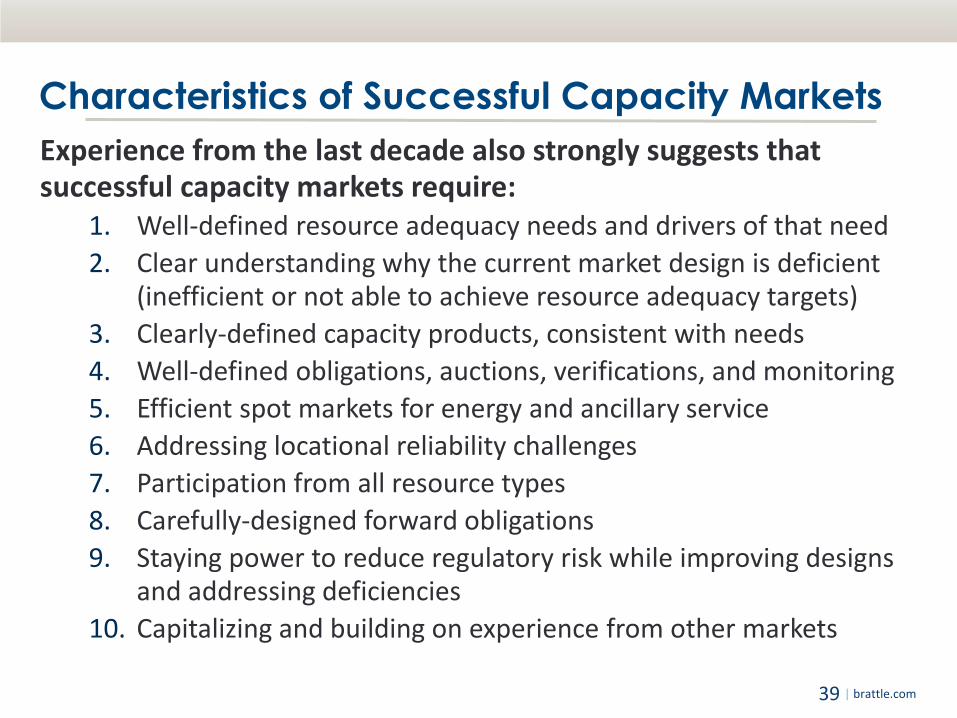
Characteristics of Successful Capacity Markets Experience from the last decade also strongly suggests that successful capacity markets require:
1. Well-defined resource adequacy needs and drivers of that need 2. Clear understanding why the current market design is deficient
(inefficient or not able to achieve resource adequacy targets) 3. Clearly-defined capacity products, consistent with needs 4. Well-defined obligations, auctions, verifications, and monitoring 5. Efficient spot markets for energy and ancillary service 6. Addressing locational reliability challenges 7. Participation from all resource types 8. Carefully-designed forward obligations 9. Staying power to reduce regulatory risk while improving designs
and addressing deficiencies 10. Capitalizing and building on experience from other markets
| brattle.com 40
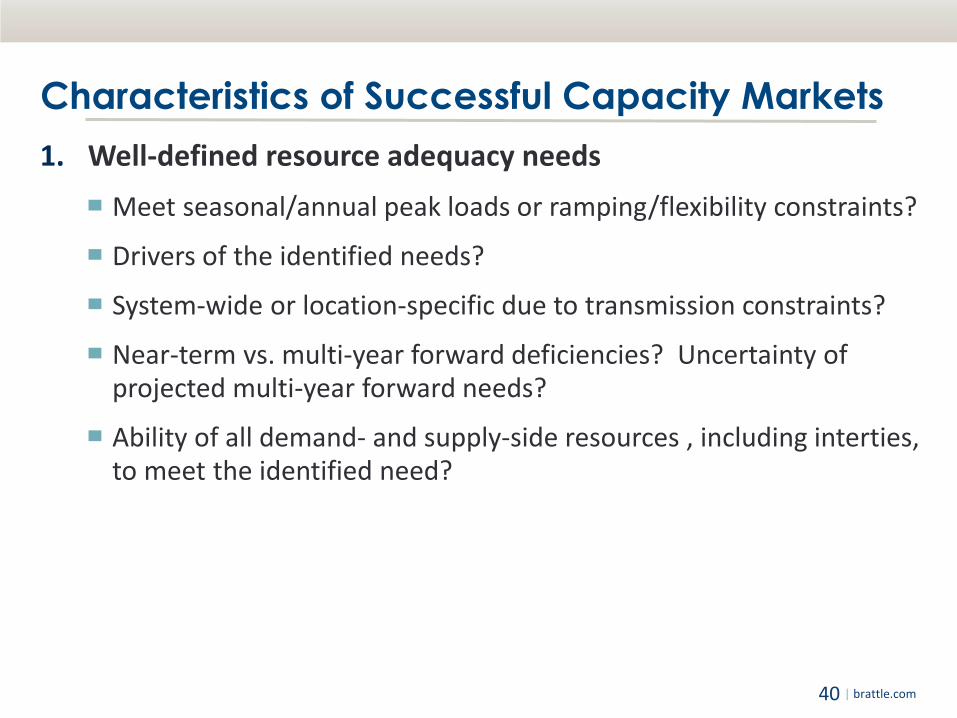
Characteristics of Successful Capacity Markets 1. Well-defined resource adequacy needs
▀ Meet seasonal/annual peak loads or ramping/flexibility constraints?
▀ Drivers of the identified needs?
▀ System-wide or location-specific due to transmission constraints?
▀ Near-term vs. multi-year forward deficiencies? Uncertainty of projected multi-year forward needs?
▀ Ability of all demand- and supply-side resources , including interties, to meet the identified need?
| brattle.com 41
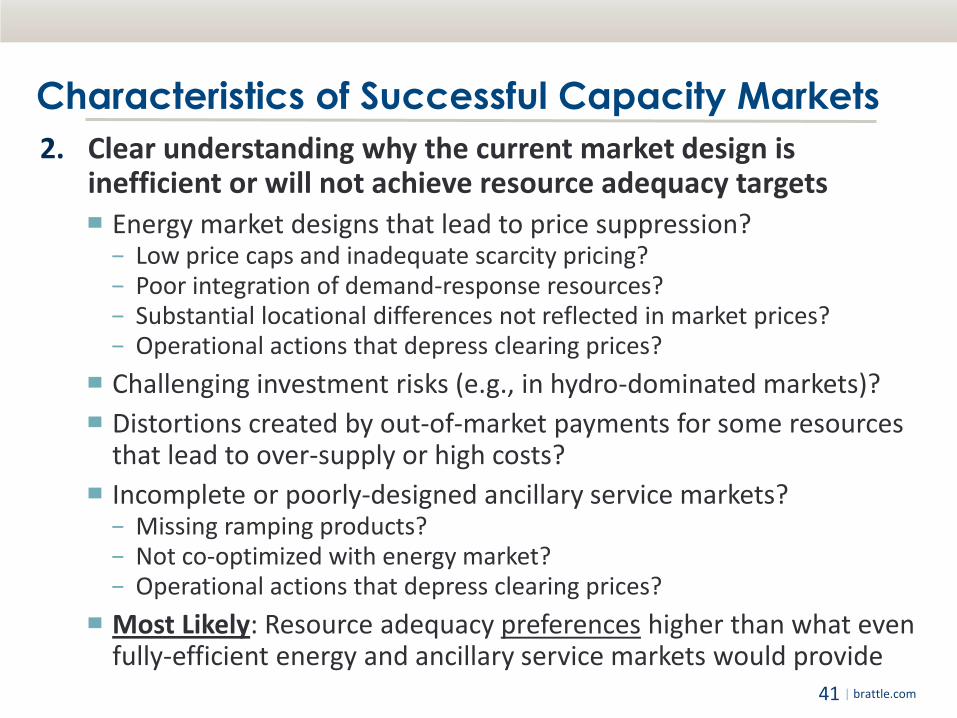
Characteristics of Successful Capacity Markets 2. Clear understanding why the current market design is
inefficient or will not achieve resource adequacy targets ▀ Energy market designs that lead to price suppression? − Low price caps and inadequate scarcity pricing? − Poor integration of demand-response resources? − Substantial locational differences not reflected in market prices? − Operational actions that depress clearing prices?
▀ Challenging investment risks (e.g., in hydro-dominated markets)? ▀ Distortions created by out-of-market payments for some resources
that lead to over-supply or high costs? ▀ Incomplete or poorly-designed ancillary service markets? − Missing ramping products? − Not co-optimized with energy market? − Operational actions that depress clearing prices?
▀ Most Likely: Resource adequacy preferences higher than what even fully-efficient energy and ancillary service markets would provide
| brattle.com 42
Characteristics of Successful Capacity Markets 3. Clearly-defined capacity products, consistent with needs
▀ Annual and seasonal capability ▀ Near-term or multi-year forward obligations ▀ Peak load carrying vs. ramping capability ▀ Effective load carrying capability and outage rates of different
resource types (including renewables, demand-response, and interties)
▀ Integration with energy and ancillary service markets
4. Well-defined obligations, auctions, verifications, monitoring, and penalties ▀ Ensure quality of resources and compliance without creating
inadvertent bias against certain resources (e.g., demand-response, intermittent resources, imports)
| brattle.com 43
Characteristics of Successful Capacity Markets 5. Efficient spot markets for energy and ancillary service
▀ Capacity markets can “patch-up” deficiencies in energy and ancillary service markets from a resource adequacy perspective
▀ Less efficient investment signals (e.g., resource types, supply- vs. demand-side resources, locations) if deficiencies in energy and ancillary service are not addressed
6. Addressing locational reliability challenges ▀ Resource adequacy won’t be addressed efficiently if reliability
concerns are locational but capacity markets aren’t
▀ Requires locational resource adequacy targets and market design
▀ Requires understanding of how transmission (including interties between power markets) affect resource adequacy
| brattle.com 44
Characteristics of Successful Capacity Markets 7. Participation from all resource types
▀ Existing and new generating plants ▀ Conventional, renewable/intermittent, and distributed generation ▀ Load (demand response) ▀ Interties (actively committed imports vs. resource adequacy value of
uncommitted interties)
8. Carefully-designed forward obligations ▀ Efficiency of near-term obligations (avoid forecasting uncertainty,
adjust to changes in market conditions, reduced commitment risk) ▀ Benefits of multi-year forward obligations (competition between
new and existing resources; forward visibility; financial certainty) ▀ Questionable need for forward commitments greater than 3-4 years ▀ Avoid capacity markets as substitute for long-term contracts
| brattle.com 45
Characteristics of Successful Capacity Markets 9. Staying power to reduce regulatory risk while improving
designs ▀ Staying power of market design reduces regulatory risk and
improves investment climate ▀ Requires careful balancing of staying power and the need to
improve design elements and address deficiencies ▀ Challenge due to strong financial interests of different stakeholders
10. Capitalizing and building on experience from other markets ▀ Regional difference are important but often overstated ▀ Avoid the “not invented here” syndrome ▀ Avoid “urban myths” (e.g., no new generation built in regions with
capacity markets; insufficient to support merchant investments unless 5-10 year payments can be locked in)

Appendix C: Additional Reading,
About the Author and Brattle
| brattle.com 47
Additional Reading Pfeifenberger, Newell, Spees, Energy and Capacity Markets: Tradeoffs in Reliability, Costs, and Risks,
Harvard Electricity Policy Group, February 27, 2014. Newell, Spees, Pfeifenberger, Karkatsouli, Wintermantel, Carden. Estimating the Economically Optimal
Reserve Margin in ERCOT, Report prepared for the PUCT, January 31, 2014. Pfeifenberger. Market-based Approaches to Resource Adequacy, IESO Stakeholder Summit, Feb. 11, 2014. Pfeifenberger, Spees. Characteristics of Successful Capacity Markets, APEx Conference, October 31, 2013. Pfeifenberger, Spees, Carden and Wintermantel, Resource Adequacy Requirements: Reliability and
Economic Implications, Report prepared for FERC, September 2013. Spees, Newell, Pfeifenberger. “Capacity Markets: Lessons Learned from the First Decade,” Economics of
Energy & Environmental Policy. Vol. 2, No. 2, September 2013. Spees, Pfeifenberger. “PJM’s Energy and Capacity Markets: Outlook on Fundamentals,” 12th Annual Power
&Utility Conference, Goldman Sachs, August 8, 2013. Pfeifenberger, Spees. “Evaluation of Market Fundamentals and Challenges to Long-Term System Adequacy
in Alberta’s Electricity Market,” March 2013 (Update) and April 2011 (Original Study). Pfeifenberger. “Structural Challenges with California’s Current Forward Procurement Construct.” CPUC
and CAISO Long-Term Resource Adequacy Summit. San Francisco, February 26, 2013 Newell, Spees. “Get Ready for Much Spikier Energy Prices: The Under-Appreciated Market Impacts of
Displacing Generation with Demand Response.” February 2013. Pfeifenberger, Spees, Newell. “Resource Adequacy in California: Options for Improving Efficiency and
Effectiveness,” October 2012. Newell, Spees, Pfeifenberger, Mudge, DeLucia, Carlton, “ERCOT Investment Incentives and Resource
Adequacy,” June 2012.
| brattle.com 48
Additional Reading (cont’d) Pfeifenberger, Newell. “Trusting Capacity Markets: Does the Lack of Long-Term Pricing Undermine the
Financing of New Power Plants?” Public Utilities Fortnightly. December 2011. Pfeifenberger, Newell, Spees, Hajos, Madjarov. “Second Performance Assessment of PJM’s Reliability
Pricing Model: Market Results 2007/08 through 2014/15.” August 26, 2011. Spees, Newell, Carlton, Zhou, Pfeifenberger. “Cost of New Entry Estimates for Combustion Turbine and
Combined-Cycle Plants in PJM.” August 24, 2011. Carden, Pfeifenberger and Wintermantel. “The Economics of Resource Adequacy Planning: Why Reserve
Margins Are Not Just About Keeping the Lights On.” NRRI Report 11-09. April 2011. Newell, Spees, Hajos. “The Midwest ISO’s Resource Adequacy Construct: An Evaluation of Market Design
Elements.” The Brattle Group, January 19, 2010. Newell, Bhattacharyya, Madjarov. “Cost-Benefit Analysis of Replacing the NYISO’s Existing ICAP Market
with a Forward Capacity Market." June 15, 2009. LaPlante, Chao, Newell, Celebi, Hajos. “Internal Market Monitoring Unit Review of the Forward Capacity
Market Auction Results and Design Elements.” ISO New England and The Brattle Group. June 5, 2009. Pfeifenberger, Spees. “Best Practices in Resource Adequacy.” PJM Long Term Capacity Issues Symposium.
January 27, 2010. Pfeifenberger, Spees, Schumacher. “A Comparison of PJM's RPM with Alternative Energy and Capacity
Market Designs.” September 2009. Pfeifenberger, Newell, Earle, Hajos, Geronimo. “Review of PJM's Reliability Pricing Model (RPM).” June 30,
2008. Reitzes, Pfeifenberger, Fox-Penner, Basheda, Garcia, Newell, Schumacher. “Review of PJM’s Market Power
Mitigation Practices in Comparison to Other Organized Electricity Markets,” September 2007.

| brattle.com 49
Speaker Bio and Contact Information Johannes P. Pfeifenberger Principal The Brattle Group Cambridge, Massachusetts, USA [email protected] 617.864.7900 office 617.234.5624 direct
Johannes (Hannes) Pfeifenberger is an economist with a background in power engineering and over 20 years of experience in the areas of public utility economics and finance. He has published widely, assisted clients and stakeholder groups in the formulation of business and regulatory strategy, and submitted expert testimony to the U.S. Congress, courts, state and federal regulatory agencies, and in arbitration proceedings. Hannes has extensive experience in the economic analyses of wholesale power markets and transmission systems. His recent experience includes reviews of capacity market and resource adequacy designs, testimony in contract disputes, and the analysis of transmission benefits, cost allocation, and rate design. He has performed market assessments, market design reviews, asset valuations, and cost-benefit studies for investor-owned utilities, independent system operators, transmission companies, regulatory agencies, public power companies, and generators across North America and internationally. Hannes received an M.A. in Economics and Finance from Brandeis University and an M.S. in Power Engineering and Energy Economics from the University of Technology in Vienna, Austria.
Note: The views expressed in this presentation are strictly those of the presenter and do not necessarily state or reflect the views of The Brattle Group, Inc.

| brattle.com 50
About The Brattle Group The Brattle Group provides consulting and expert testimony in economics, finance, and regulation to corporations, law firms, and governmental agencies worldwide. We combine in-depth industry experience and rigorous analyses to help clients answer complex economic and financial questions in litigation and regulation, develop strategies for changing markets, and make critical business decisions. Our services to the electric power industry include:
▀ Climate Change Policy and Planning ▀ Cost of Capital ▀ Demand Forecasting Methodology ▀ Demand Response and Energy
Efficiency ▀ Electricity Market Modeling ▀ Energy Asset Valuation ▀ Energy Contract Litigation ▀ Environmental Compliance ▀ Fuel and Power Procurement ▀ Incentive Regulation
▀ Rate Design and Cost Allocation ▀ Regulatory Strategy and Litigation
Support ▀ Renewables ▀ Resource Planning ▀ Retail Access and Restructuring ▀ Risk Management ▀ Market-Based Rates ▀ Market Design and Competitive Analysis ▀ Mergers and Acquisitions ▀ Transmission
| brattle.com 51
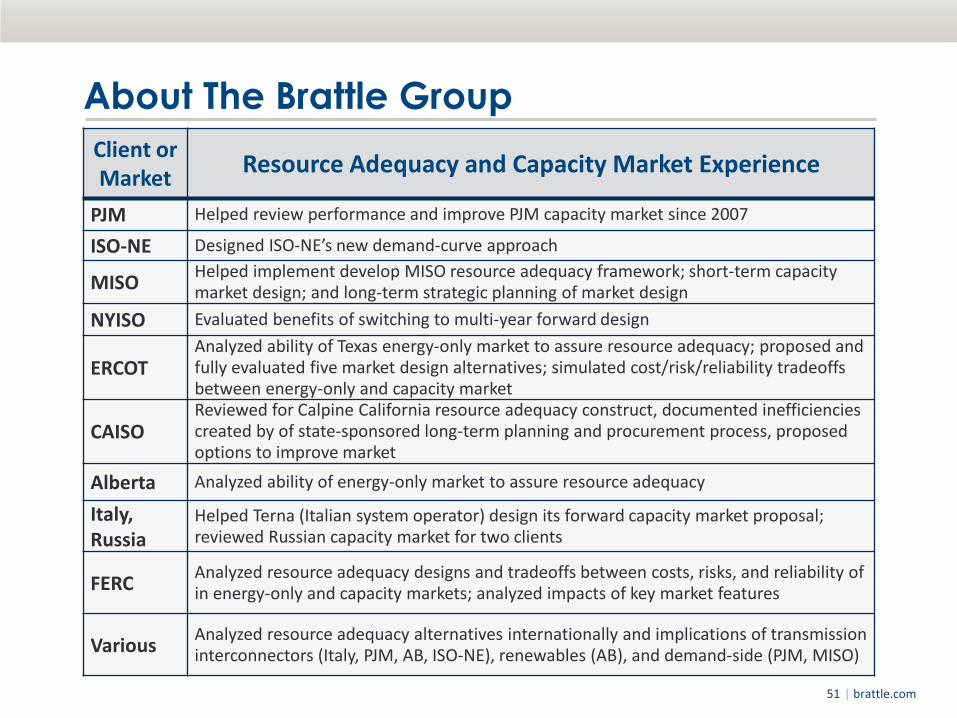
About The Brattle Group Client or Market Resource Adequacy and Capacity Market Experience
PJM Helped review performance and improve PJM capacity market since 2007
ISO-NE Designed ISO-NE’s new demand-curve approach
MISO Helped implement develop MISO resource adequacy framework; short-term capacity market design; and long-term strategic planning of market design
NYISO Evaluated benefits of switching to multi-year forward design
ERCOT Analyzed ability of Texas energy-only market to assure resource adequacy; proposed and fully evaluated five market design alternatives; simulated cost/risk/reliability tradeoffs between energy-only and capacity market
CAISO Reviewed for Calpine California resource adequacy construct, documented inefficiencies created by of state-sponsored long-term planning and procurement process, proposed options to improve market
Alberta Analyzed ability of energy-only market to assure resource adequacy
Italy, Russia
Helped Terna (Italian system operator) design its forward capacity market proposal; reviewed Russian capacity market for two clients
FERC Analyzed resource adequacy designs and tradeoffs between costs, risks, and reliability of in energy-only and capacity markets; analyzed impacts of key market features
Various Analyzed resource adequacy alternatives internationally and implications of transmission interconnectors (Italy, PJM, AB, ISO-NE), renewables (AB), and demand-side (PJM, MISO)

| brattle.com 52
Brattle Group Offices
Cambridge New York San Francisco Washington, DC
London Rome Madrid
NORTH AMERICA
EUROPE